Article

Validation and Application of the Diffusive Gradients in Thin-Films Technique for In Situ Measurement of β-Blocker Drugs in Waters and Sediments

1
College of Environmental Science and Engineering, Dalian Maritime University, Dalian 116023, China
2
School of Environmental Science and Technology, Shanxi University of Science & Technology, Xi’an 710021, China
3
Science and Technology on Underwater Test and Control Laboratory, The 760th Research Institute of China Shipbuilding Industry Corporation, Dalian 116023, China
4
Teaching Affairs Division, Dalian University, Dalian 116023, China
*
Authors to whom correspondence should be addressed.
Water 2024, 16(11), 1478; https://doi.org/10.3390/w16111478
Submission received: 19 March 2024 / Revised: 5 May 2024 / Accepted: 17 May 2024 / Published: 22 May 2024

Abstract

:
The occurrence of β-blocker drugs in aquatic environments worldwide has caused increasing attention to their threat to human health in recent years. It is essential to monitor these widely prescribed pharmaceuticals in natural waters and sediments, helping us investigate their potential risk to humans and ecosystems. In this study, a passive sampling technique, diffusive gradients in thin-films (DGT), was systematically developed for eight frequently detected β-blockers. The effective capacities of target compounds were large enough for the devices to deploy for several weeks. The uptake of all compounds was linearly correlated with deployment times during the 7-day laboratory experiment and agreed well with the theoretical line, except for several compounds (e.g., ATL) due to their relatively slow uptake rate. The performance of most compounds was independent of varying pH values and organic matter contents; only a few compounds were affected, while the application in high-salinity environments needs to be conducted with caution. Field deployments of DGT to detect β-blockers in situ in rivers and sediments proved that DGT is an effective tool to monitor β-blocker drugs and their fate in the natural aquatic environment, while DGT probes can provide information for us to investigate the biogeochemical processes occurred in sediment, especially at the sediment–water interface. This novel approach will help us understand the behaviour of β-blocker drugs in the aquatic environment, assess their risks, finally protect human health and maintain the sustainable development of the ecosystem.

1. Introduction

As one of the most widely prescribed group of pharmaceuticals, β-blocker drugs are consumed in large quantities every year all over the world. They contribute significantly to the treatment of various cardiovascular diseases such as angina, arrhythmias, hypertension and myocardial infarction [1]. In addition, they may be abused by athletes to reduce their cardiac rhythm and by farmers to prevent anxiety in animals [2]. β-blockers cannot be fully absorbed by users; a large fraction of the drugs is excreted through urea and faeces. Private households, hospitals and pharmaceutical plants are often considered as the point sources of β-blockers [3]. β-blockers have been found to be inefficiently removed in wastewater treatment plants, with most removal efficiencies under 50% [4]. Thus, they have been widely detected in aquatic environments, with concentrations ranging from ng L−1 to μg L−1 [5] in surface waters and 10 s to 10,000 s ng kg−1 in sediments [4,6]. The adverse effects of β-blocker residues have been reported on aquatic organisms such as green fish, algae and invertebrates, and have attracted extensive public attention [7,8]. In the past 3–4 years, the consumption of β-blockers has increased due to the COVID-19 pandemic, and higher concentrations of β-blockers have been detected [9]. Hence, there is a great need to monitor β-blocker drugs and understand their behaviour in aquatic environments, including waters and sediments.
Conventional monitoring for organic compounds in waters is often conducted by grab sampling, in which large volumes of water samples are collected. The storage and transport of water samples may cause the loss of the target compounds. In addition, only snapshot information captured at the sampling time may give false information of the contaminant level [10]. Organic compounds in sediments were often treated as soils in traditional detection approaches. Sediment samples were grabbed, then dried and sieved before extracting with organic solvents [11]. These treatments disrupt the anoxic condition of sediments and bring uncertainty to the results. Furthermore, as an important part of aquatic environments, sediment is the ultimate sink of surface water and ground water, and probably the secondary source when environmental conditions change. The distribution of pollutants at the sediment–water interface (SWI) and surface sediment is important for investigating their behaviour and potential for re-mobilization and re-release [12]. Therefore, reliable measurements of β-blockers in waters and sediments are required.
In contrast to the aforementioned methods, DGT (diffusive gradients in thin-films) has become popular for the measurement of pollutants in waters and sediments in recent years. It pre-concentrates compounds in situ with minimal disturbance to the environment and gives the time-weighted average (TWA) concentration of the target compounds [13]. In addition, DGT can be adapted to measure the distribution of contaminants around the sediment–water interface in the form of a probe, which can help us to understand the chemical interaction and dynamic processes between the overlying water and sediment [14].
Since 2012, the development and application of DGT have been extended from inorganic to organic chemicals, including pesticides, antibiotics, personal-care products, pharmaceuticals, flame retardants, illicit drugs, perfluorinated compounds, etc. [13,15,16,17,18,19,20]. DGT samplers have been adopted for measuring a large number of pharmaceuticals including three β-blockers (atenolol, metoprolol and propranolol) in rivers [21]. However, further work is still required for systematic validation of its performance under different environmental conditions. Environmental parameters such as pH, ionic strength (IS) and dissolved organic matters (DOMs) may affect diffusion and/or adsorption of target compounds; the uptake performance of HLB-DGT to target β-blockers has not been evaluated yet. Meanwhile, there are no reports for some other frequently detected β-blockers yet. DGT probes have only been employed for organic chemical measurements in sediments recently [22,23]; the detection and investigation of β-blockers in sediments, especially at the sediment–water interface, is still waiting to be resolved [24].
Therefore, the aims of this research were to develop and apply the DGT technique to measure β-blocker drugs in waters and sediments. The binding properties of the devices were tested. To evaluate the performance of DGT devices under different environment conditions, they were deployed in solutions with various pH values, ionic strengths and organic matter contents. Time and thickness dependence effects were conducted in the laboratory to validate the linear accumulation of target β-blockers in long-time sampling. Field campaigns were undertaken in rivers (by normal DGT devices) and lake sediments (using DGT probes) to validate the application of DGT in the real environment.

2. Materials and Methods

2.1. Chemicals and Reagents

Eight β-blockers were selected as target compounds due to their frequent presence in aquatic environments, including atenolol (ATL), metoprolol (MTL), propranolol (PPL), sotalol (STL), nadolol (NDL), bisoprolol (BSL), betaxolol (BTL) and acebutolol (ABL). ATL-d7 was used as the internal standard (IS). Details of all the chemicals, regents and materials are given in the Supplementary Materials.

2.2. Gel Preparation and DGT Assemblies

To avoid the possible biodegradation of agarose gels, which have been widely used in the measurement of organic compounds, polyacrylamide (PA) gels were selected for the DGT assemblies. Following the documented procedures [25], binding gels were prepared by mixing 2 g of HLB resin beads with 10 mL of gel solution (purchased from DGT Research Ltd., Lancaster, UK), 60 µL of freshly prepared ammonium persulfate and initiated by 15 µL of TEMED (N,N,N′,N′-tetramethylethylenediamine). The solution was pipetted into two glass plates with a spacer in between and reacted under 45 °C for 40 min. The diffusive gels were made as the binding gels without adding HLB resin, and the thickness was 0.78 mm.
Possible adsorptions of target compounds on the DGT-related materials including PA diffusive gels, DGT mouldings and protective filter membranes were tested prior to the assembly of the DGT devices; detailed information can be found in the Supplementary Materials. The DGT device was assembled with three layers (a 0.4 mm thick binding gel, a 0.78 mm thick PA diffusive gel and a filter membrane) sandwiched between the standard plastic moulding (a base and a cap).

2.3. Adsorption Properties of DGT Binding Gels

The effective capacities of DGT were measured by deploying DGT devices with binding gel in front in 50 mL solutions with the concentration of mixed compounds ranging from 100 to 1000 µg L−1. The test solutions with a matrix of 0.01 mol L−1 NaCl were shaken for 24 h. The amount of target compounds adsorbed onto the binding gels were measured by the difference between concentration before and after shaking.
To ensure fast adsorption of target compounds on DGT binding gels, DGT devices with binding gel in front were immersed separately in 20 mL of 30 µg L−1 mixed-compound solutions containing 0.01 mol L−1 NaCl and shaken for 24 h. A volume of 100 µL of samples was taken out at various times (5 min to 24 h) for analysis.
Efficient and consistent elution methods are important for the determination of target compounds. Binding gels were immersed separately in 10 mL solutions containing 10 µg L−1 mixed compounds and shaken for 24 h, then eluted with 5 mL of methanol (MeOH), acetonitrile (ACN) or 5% NH3 in MeOH for 30 min sonication after retrieval. The elution efficiencies were calculated using the ratio of masses of target compounds in the eluent to their masses adsorbed on the binding gels.

2.4. Diffusion Coefficient Measurements

The diffusion coefficients of target β-blockers were measured using a diffusion cell. This device consists of two stainless steel compartments (source and receptor) connected by a 1.5 cm diameter window; a 0.78 mm thick diffusive gel and a 0.065 mm thick PTFE filter membrane were placed between the windows. A volume of 100 mL of 1 mg L−1 mixed-compound solution (0.01 mol L−1 NaCl) was added to the source compartment, while 100 mL of 0.01 mol L−1 NaCl solution without target compounds was in the receptor compartment. Both compartments were stirred for 4 h; the solution pH was 6.4 ± 0.2, and the temperature was 27.6 °C during the experiment. Samples with a volume of 0.2 mL were collected at various times from both compartments.
The diffusion coefficient (D) of a compound was calculated using Equation (1) [15]:
D   = slope   ×   Δ g / ( C   ×   A )
where the slope is evaluated by plotting the masses of the measured compound against time, Δg is the thickness of the diffusive layer (the combination of a diffusive gel and a filter membrane), A represents the area of the connecting window between the two compartments and C is the concentration of target compound in the source compartment.

2.5. Time and Diffusive Layer Thickness Dependence

To test if the performance of DGT follows the DGT principle, DGT devices were deployed in a well-stirred solution (pH = 6.3 ± 0.2, 0.01 mol L−1 NaCl, temperature = 20 ± 0.6 °C) containing mixed compounds at 10 µg L−1 for different time periods up to 168 h, and the masses accumulated on the binding gels for different time lengths were determined.
DGT devices with various thicknesses of diffusive gels (0.5–2.0 mm) were deployed in a 10 µg L−1 mixed-target β-blocker solution. The solution was well stirred for 24 h.

2.6. DGT Performance Tests under Different Conditions

To investigate if the performance of DGT was affected under different environmental conditions, DGT devices were deployed in 10 µg L−1 mixed-compound solutions for 24 h with (a) various pH (changing from 5 to 9), 0.01 mol L−1 NaCl, no DOM (dissolved organic matter) addition; (b) different ionic strength (IS) (0.01 to 0.5 mol L−1), pH = 6.5 ± 0.2, no DOM addition; and (c) DOM (humic acid) ranging from 0 to 20 mg L−1, pH = 6.3 ± 0.1, IS = 0.01 mol L−1.

2.7. In Situ Application of DGT in Rivers

To test the robustness and reliability of the DGT devices for measuring β-blockers in natural waters, 7 sampling sites in rivers were selected in Nanjing, China. As presented in the Supplementary Materials Figures S1, S6 and S7, 2 sites were in the upper and lower reaches of the Yangtze River in the Nanjing section, while the other 5 sites were along the urban rivers. Water flowed from the Yangtze River to Figure S2 on New Qinhuai River then went to Figure S4 on the Qinhuai River, passing Figure S3; Figure S5 was a small tributary of the Qinhuai River. Figure S7 was on the Jiuxiang River, known as a representative contamination source of the Yangtze River [26]. The sampling campaign was carried out in January 2021, including DGT deployments and water sample collections. All DGT devices were placed at 1 m below water at each site (triplicate) then collected after 7 and 14 days. Temperature was recorded by a button thermometer (Maxim Integrated Products, San Jose, CA, USA). On Day1, 7 and 14 of deployment, 2 L water samples at each site were also collected, together with DGT collections. All samples were transferred to the laboratory immediately after collection.

2.8. Deployment of DGT Probe at the Sediment–Water Interface

The accuracy and precision of measurements using DGT probes were tested by deploying a DGT probe in a well-stirred solution with 10 µg L−1 ATL (0.01 mol L−1 NaCl) for 24 h in the laboratory (details shown in the Supplementary Materials).
A sediment core with overlying waters from the sampling site was obtained by a gravity corer [27] (Ke Fan, Nanjing, China) with PVC sampling tubes from Lake Chaohu, China, to verify the applicability of DGT in sediments in January 2022. To present the vertical distribution of target compounds at the sediment–water interface and heterogeneity of the sediment, a DGT probe (de-oxidized overnight prior to deployment) was employed in sediment measurement. The sediment core was kept in the dark for 4 days after being transported from the lake. The DGT probe was inserted straight into the core with 2 cm in the overlying water and 13 cm in the sediment and kept for 2 days. After deployment, the surface of the probe was jet-washed with MQ water, and the binding gel was taken out and cut into small strips at 5 mm intervals. Gel strips were extracted by ultrasonic bath with 3 mL of MeOH (5% NH3 added). The sediment core was then sliced at 1 cm intervals, and compounds in each segment were extracted by centrifugation for pore-waters.

2.9. Chemical Analysis and DGT Calculation

Laboratory and field samples were all prepared following the description in the Supplementary Materials; after that, the samples were analysed by ultra-high-performance liquid chromatography coupled with a triple quadrupole mass spectrometer (UPLC-MS/MS, SCIEX Triple Quad 4500, Framingham, MA, USA) equipped with an ESI source. The separation of target compounds was performed with a Phenomenex (Tianjin, China) Kinetex® C18 column (2.1 × 100 mm, 2.6 µm). The mobile phases of the UPLC were set as MQ water with 0.1% formic acid (A) and MeOH (B). The gradients of the mobile phases are listed as follows: it started from 10% B and kept for 1 min, then increased to 90%B within 5 min, kept for 2 min, then decreased to the initial gradients. The flow rate was 0.4 mL/min, the injection volume was 3 µL, and column temperature was set as 40 °C. The MS was in positive mode; all the settings are listed in Table S2.
The DGT measured concentration of the analytes can be calculated based on Fick’s first law and expressed as Equation (2):
C DGT = M   Δ g D e A   t
where M is the mass of target compound accumulated on the binding gel, Δg refers to the thickness of the diffusion layer (a diffusive gel and a filter membrane), De represents the diffusion coefficient of the analyte in the diffusive layer, A is the exposure area of DGT devices and t is the deployment time.

3. Results and Discussion

3.1. Possible Adsorption on DGT Mouldings, Diffusive Gels and Filter Membranes

Figure 1 describes the adsorption of target β-blockers onto the DGT mouldings, PA diffusive gels and seven types of filter membranes. There was no appreciable adsorption of target compounds onto DGT mouldings and PA gels, with the adsorbed amounts all less than 10%. The MCE filter significantly adsorbed most of the target compounds (with >50% for five compounds). Loss on the PVDF, PES, CA and GHP filters was also considerable. The nylon filter showed little sorption of most compounds except for NDL (14.7%), while adsorptions on PTFE filters were all <6%. Thus, standard DGT mouldings and PA diffusive gels were suitable for DGT assemblies, and the PTFE filter membrane was selected for the subsequent experiments.

3.2. Uptake Kinetics and Effective Capacity of DGT Devices

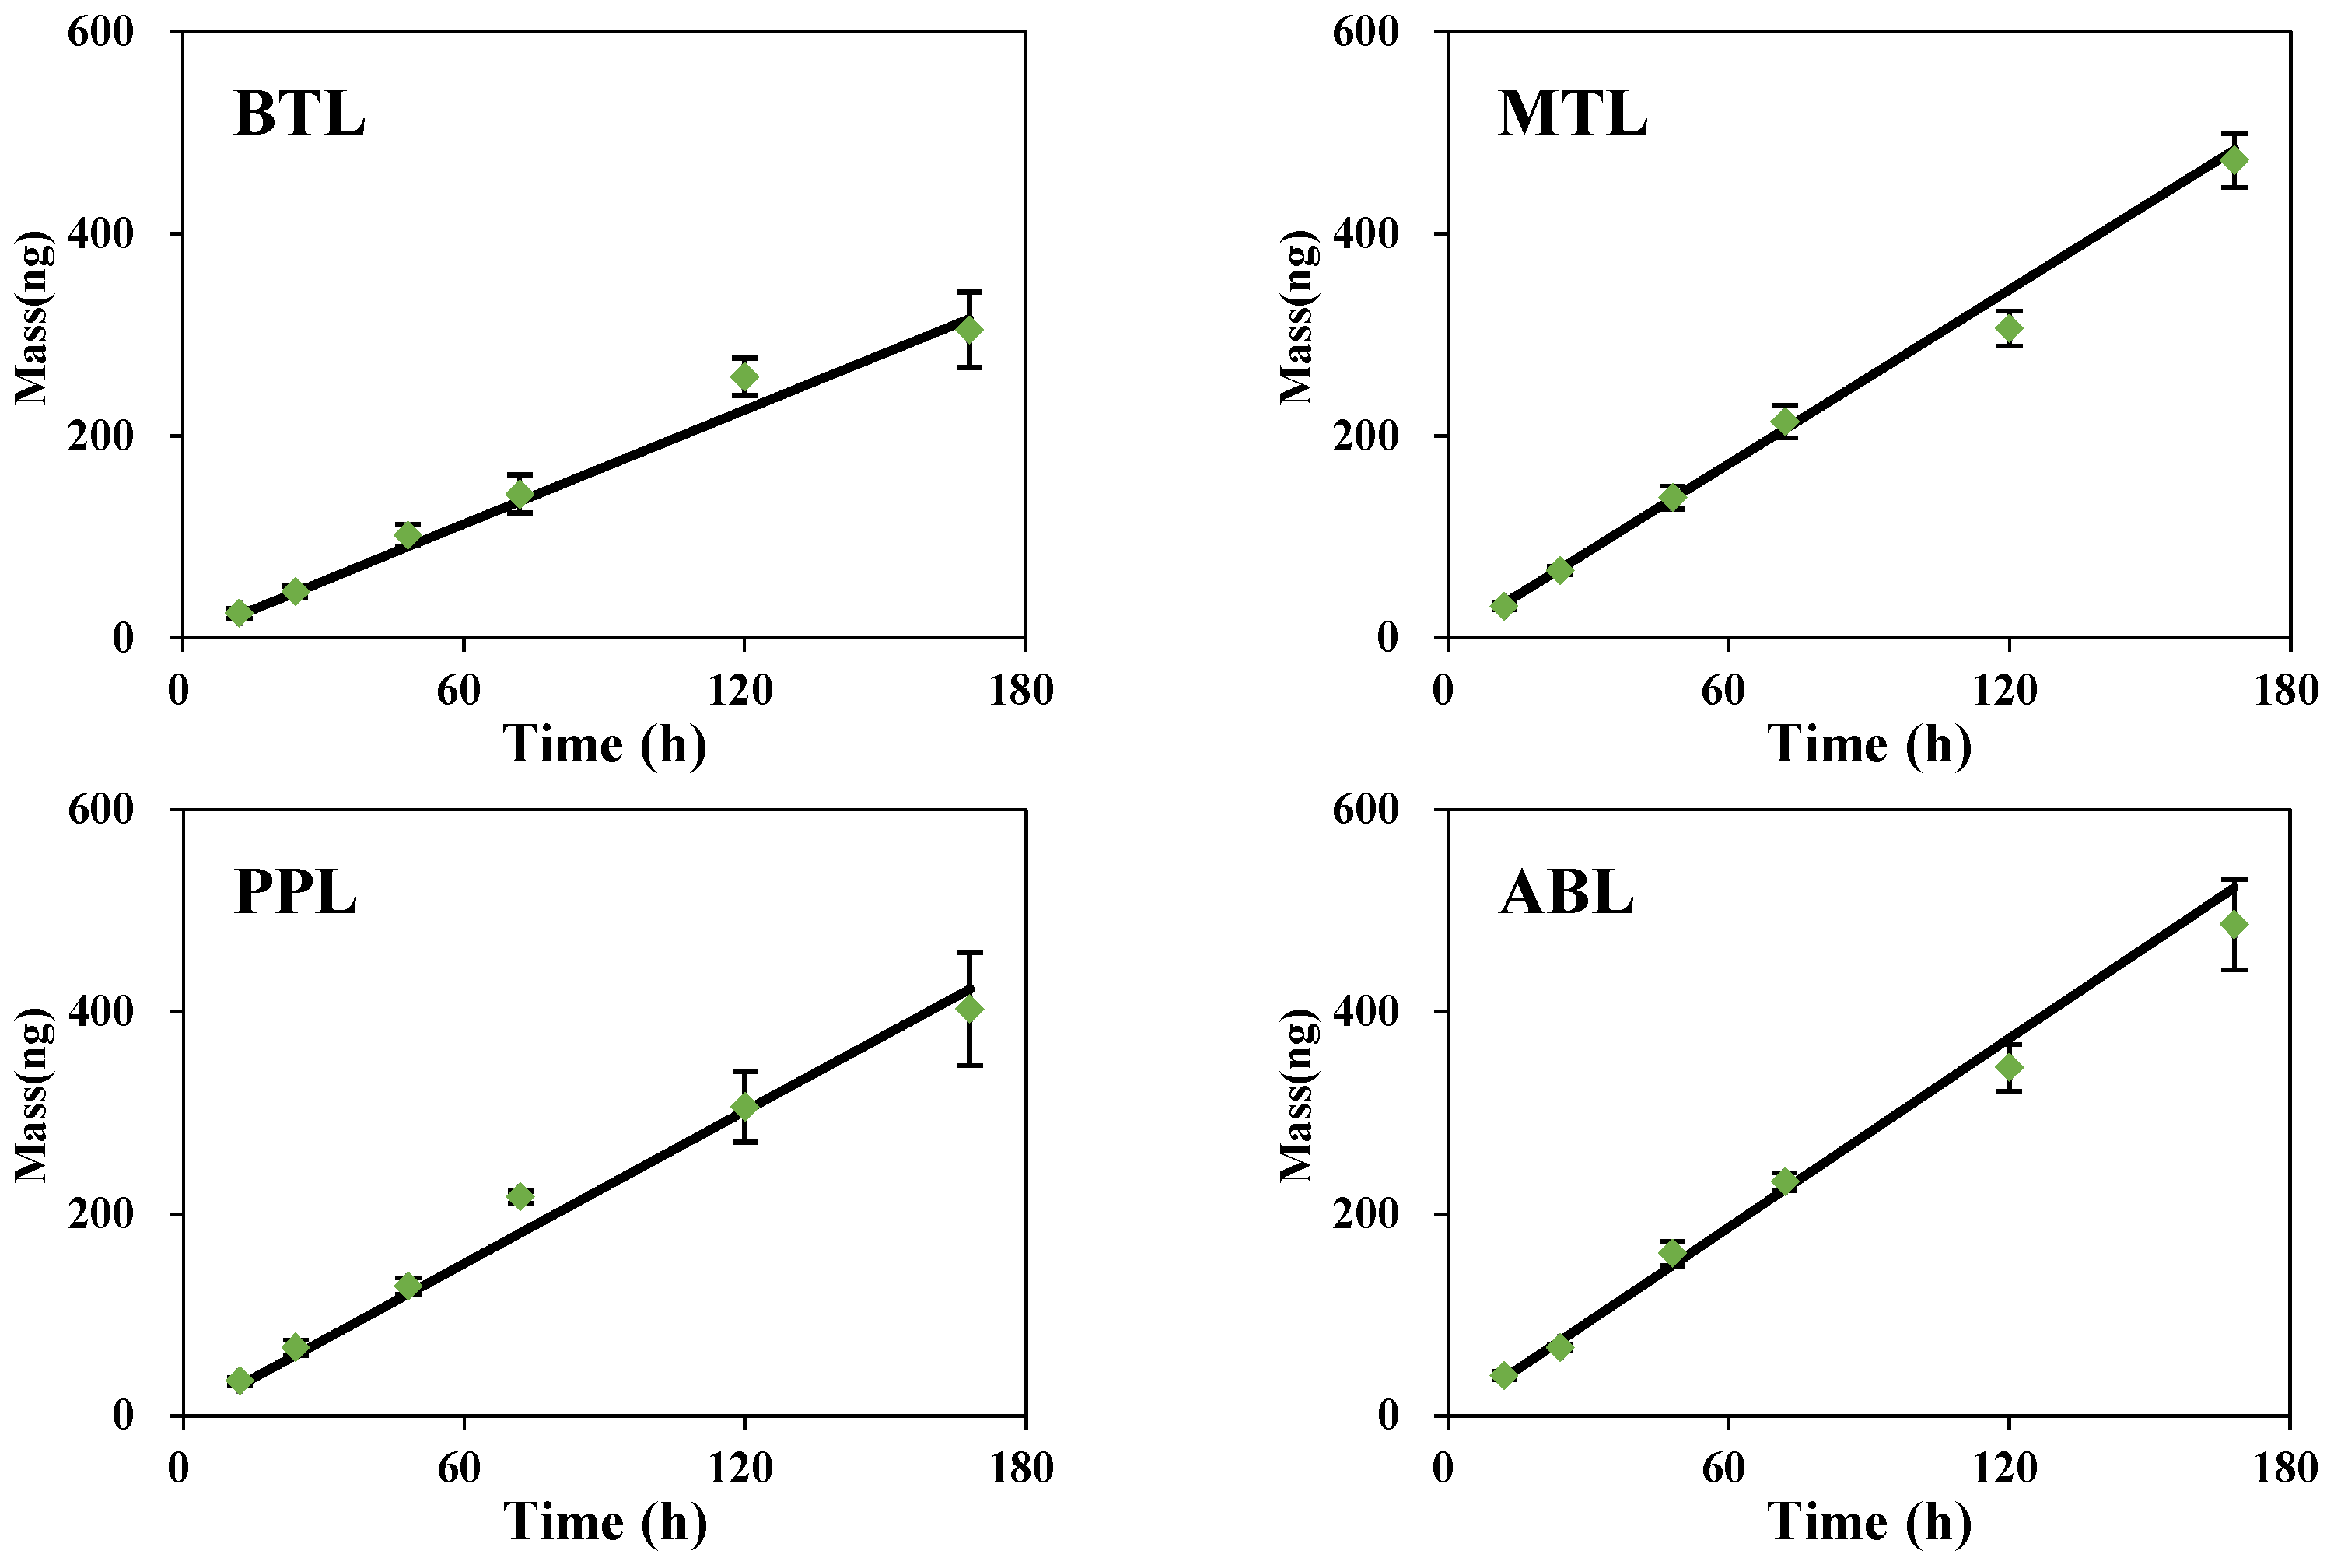
The adsorption of target compounds onto the binding gels (with exposure area = 3.14 cm2) should be fast enough to ensure a steady linear uptake phase. The uptake of β-blockers onto the binding gels was rapid in the first 45 min (Figure S2); especially in the first 2 min, the uptake masses were dramatically increased. During the experiment period, six of the compounds were adsorbed by 70~80% of the total amount added, while ATL and STL were only adsorbed by half. Unlike the uptake curves of most compounds reported previously [15,28], which stopped rising and became a relatively horizontal line after several hours, the uptake of target β-blockers slowed down after 45 min, but it still increased linearly until the end of the experiment, implying that the uptake could still go on with longer time. In the first 5 min, the uptake amount by the binding gels was one order of magnitude higher than the compounds diffused through and adsorbed by binding gels, showing that sufficiently rapid uptake could be achieved. More tests were still required to assess the performance of whole DGT devices for ATL and STL.
Long-term monitoring of β-blockers requires large capacities of the devices, to ensure the capacity is not exceeded during the deployment and concentration values can be accurately calculated. In this experiment, binding gels were assembled in the front to obtain effective capacities of devices. As shown in Figure 1 and Figure S3, the adsorbed masses of five target compounds were linearly increased with the test concentration ranging from 100 to 1000 μg L−1, reaching 21 (BSL)–32 (PPL) μg per disc in the solution with the highest test concentrations. These values were comparable to HLB gels for glucocorticoids [29], pesticides [15] and PPCPs [17]. Assuming the concentration of each target β-blocker was 1 μg L−1 in natural environments, the deployment time could last for several months. Furthermore, the linear increase without a sign of reaching equilibrium showed that the capacities of binding gels were beyond the maximum masses measured in this research. For ATL, NDL and STL, the adsorption amounts increased at lower test concentrations, then the uptake masses remained constant when masses in the test solution increased from 20 to 50 μg, indicating the capacities of these three target compounds were reached (4.8–7.6 μg per disc); this could be caused by the competition between target compounds. The binding of ATL was reported to be much lower comparing to other compounds including β-blockers and pharmaceuticals, with a capacity of 57 ng in a test solution with more than 30 compounds [21]. Even so, it is still enough for our devices to be deployed for over 3 weeks in the natural environment Figure 1.
The elution efficiencies of half of the target compounds were less than 70% using 5 mL of MeOH; 5 mL of ACN was able to elute 70–90% of the target compounds with 30 min sonication, while MeOH with 5%NH3 performed more efficiently, giving >90% efficiencies for all compounds (Table S3). Thus, 30 min sonication with 5 mL of 5%NH3 in MeOH was selected for the subsequent experiments.

3.3. Diffusion Coefficient Measurements

To calculate the concentration measured by DGT, accurate diffusion coefficients of the target compounds in the diffusion layer were essential. As shown in Figure S4, masses of target compounds diffused through the diffusion layer (the combination of a PA diffusive gel and a PTFE filter membrane) were linearly correlated with time (R2 = 0.983–0.995) at the tested temperature (27.6 ± 0.2 °C). Standard diffusion coefficients of target compounds at 25 °C were obtained using Equation (3) and presented in Table S4. The standard diffusion coefficients of eight β-blockers at 25 °C were in the range of 3.95 to 5.00 × 10⁻⁶ cm2 s−1. The diffusion coefficients of ATL, MTL and PPL in agarose diffusive gels were reported previously; they were ~21%, 12% and 13% less than the values measured in this study. However, considering the SD values, the differences in D values between those reported previously and this work may reduce [21].
log D t = 1.37023 t 25 + 8.36   ×   10 4 ( t 25 ) 2 109 + t + log D 25 ( 273 + t ) 298

3.4. Time and Diffusive Layer Thickness Dependence

To validate the principle of DGT for measuring β-blockers, experiments were conducted for time and diffusive layer thickness dependence. As shown in Figure 2 and Figure S5, the accumulation of all target compounds increased linearly with the deployment time up to 168 h. The uptake of five compounds agreed well with theoretical predictions, while the results for ATL, NDL and STL displayed different degrees of deviations (Figure S5). After 7 days, 87% of the predicted mass of NDL was detected, which was acceptable. However, the uptake of ATL and STL deviated from the theoretical lines, with only 71% and 79% of the predicted masses obtained. It was reported that the linear uptake of ATL went on for 12 days in a 2 μg L−1 solution with 30 mixed compounds [21], while in another 5 μg L−1 mixed solution, the linear uptake stopped after only 4 days [30]. In these two studies, the poor uptake of ATL could be caused by the competitive adsorption between target compounds. In our study, although the deployment time was shorter than in the above studies, higher test concentrations also led to the competition of effective binding sites between target β-blockers, and the uptake of ATL and STL slowed down after several days of accumulation, which would be responsible for the uptake deviations.
According to the principle of DGT, the accumulated masses onto binding gels should be inversely proportional to the diffusion layer thicknesses. The results obtained from the experiment were in accordance with the theoretical lines when the thickness ranged from 0.8 to 2.0 mm (Figure S6), while measured masses diffused through 0.4 mm diffusive gels deviated from the predicted values. The diffused fluxes of target compounds through 0.4 mm gels were large due to the short diffusion pathway; the slow uptake rate caused inefficient adsorption of these compounds. A similar phenomenon was also observed in the detection of glucocorticoids [29].
Thus, standard assembly of DGT devices (0.8 mm) is recommended in the measurement of β-blockers in the natural environment, as thicker diffusive gels will slow down the diffused fluxes. One to two weeks is suitable for deployment time since the uptake of target compounds was still linear and the concentration of target compounds in the real environment will be much lower than in the laboratory.

3.5. DGT Performances under Different Conditions

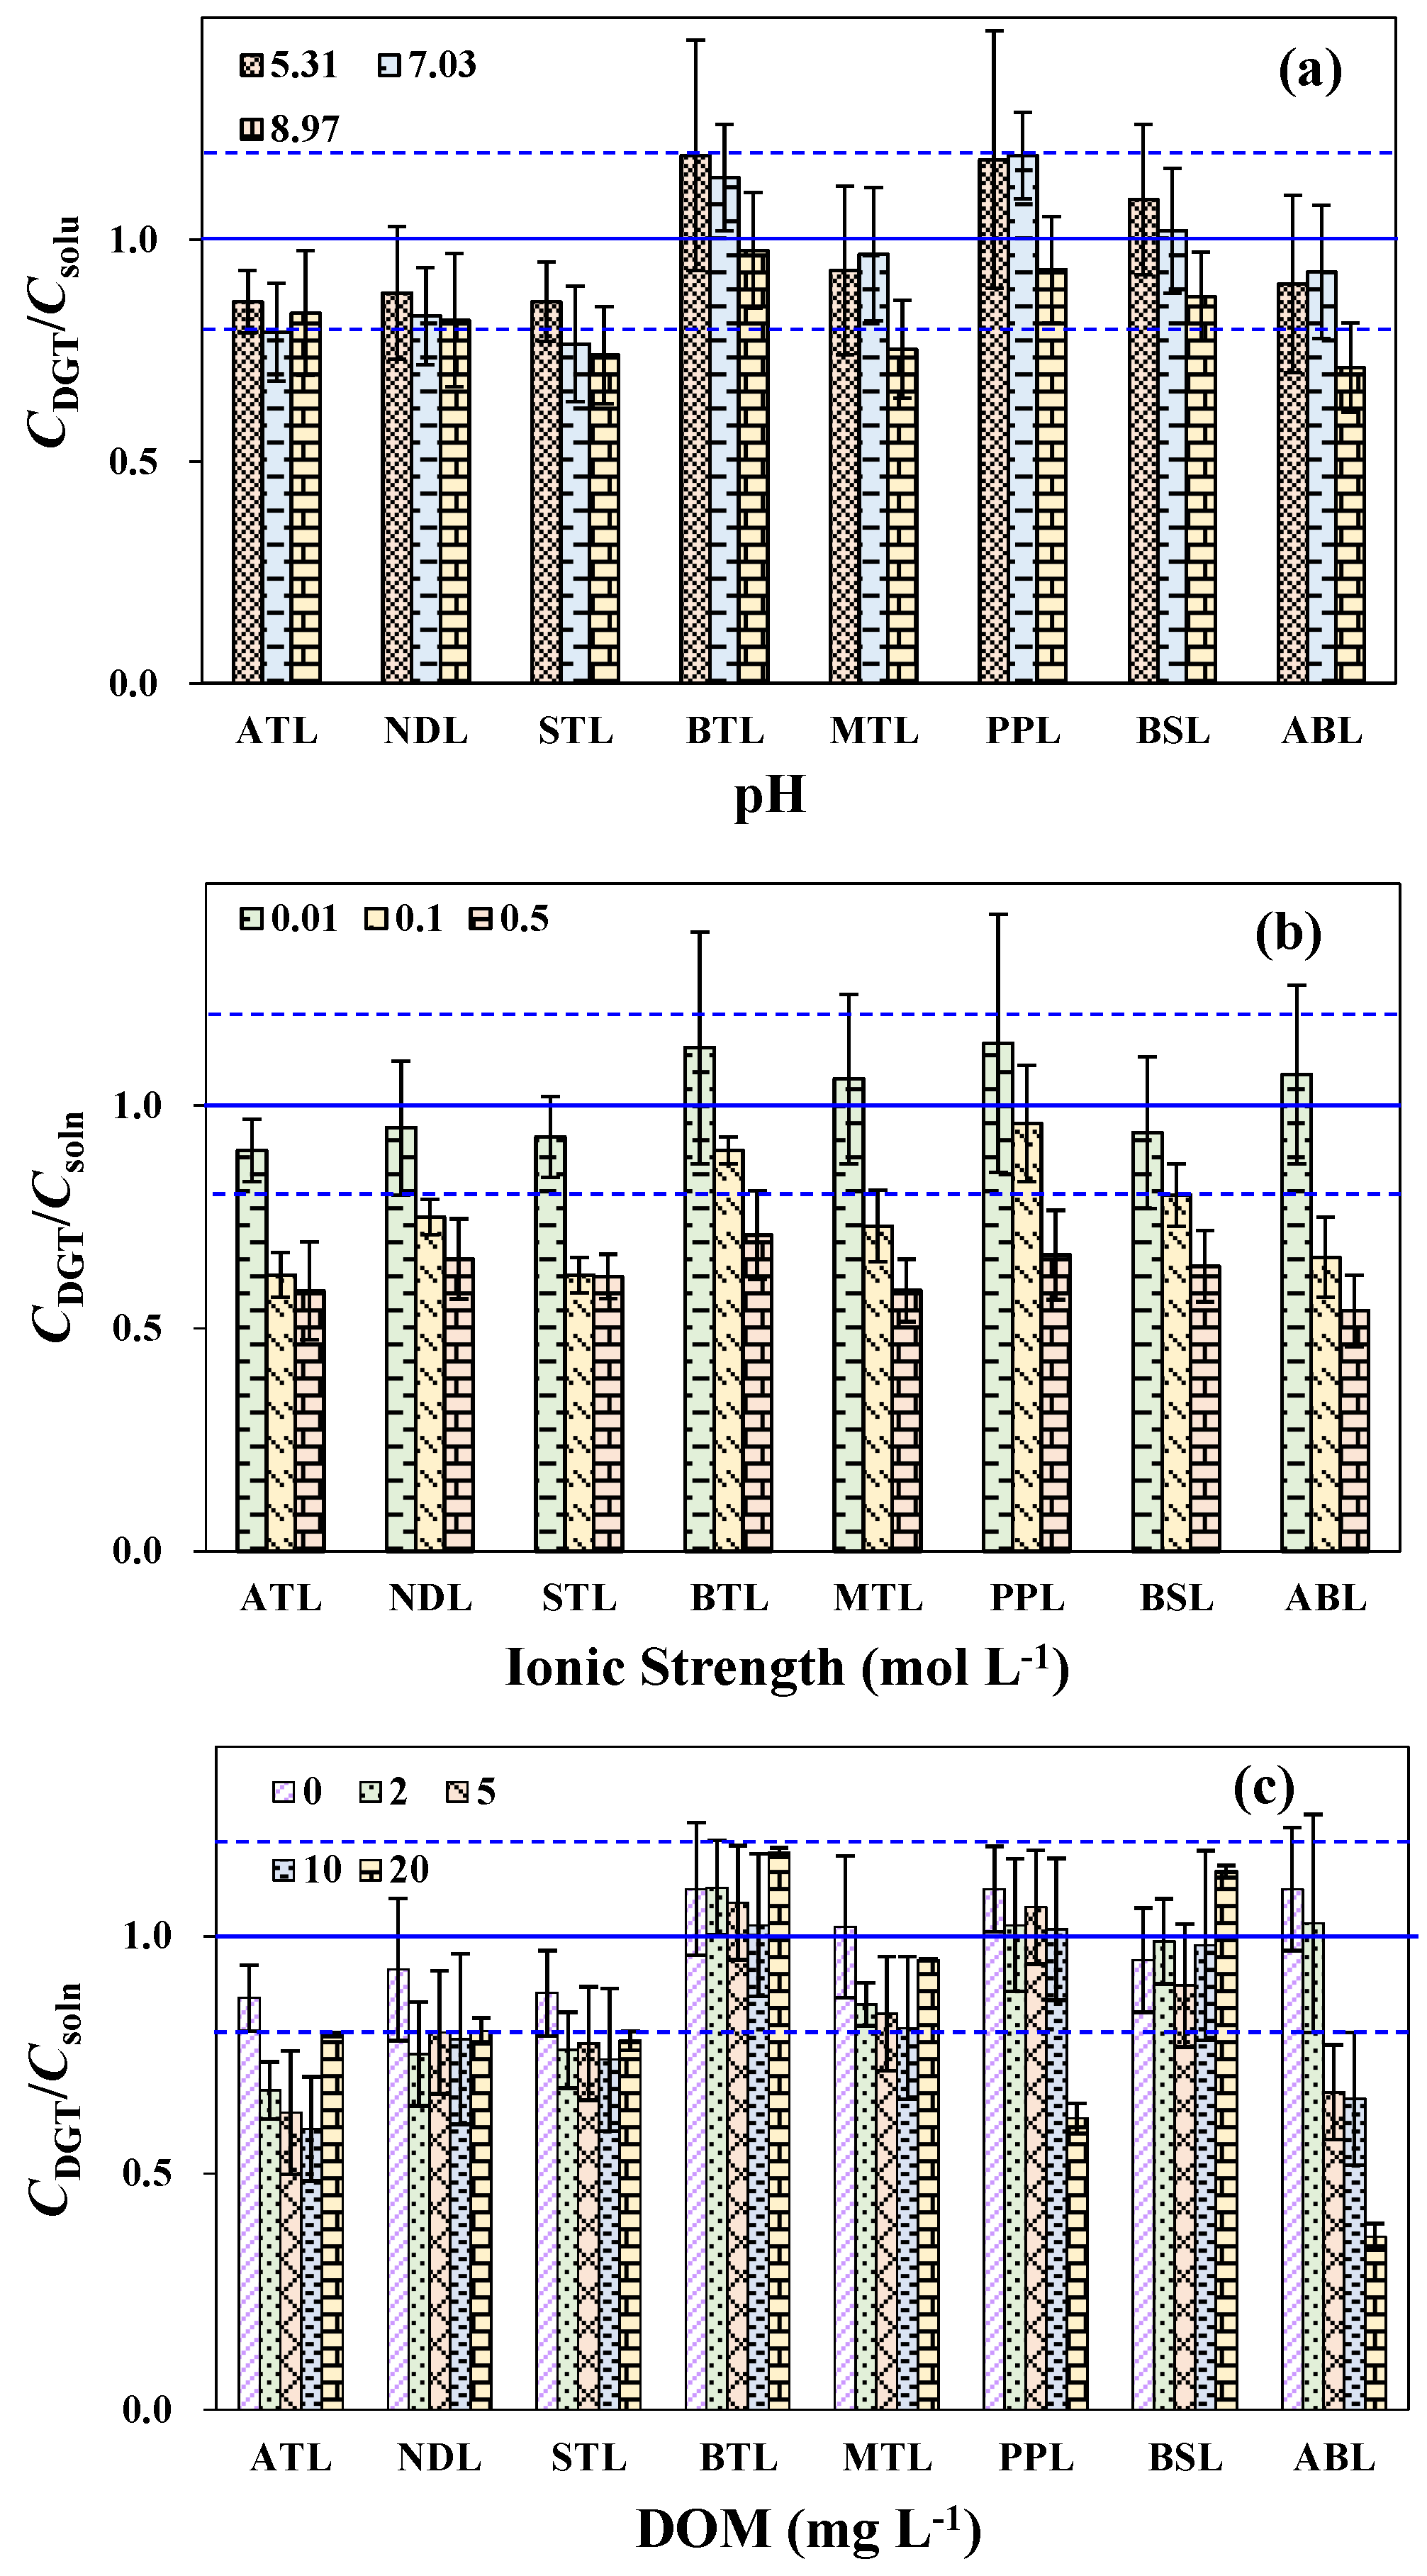
Environmental factors such as pH, ionic strength (IS) and dissolved organic matter content (DOM) may affect the performance of DGT in the field deployments. The ratio of DGT measured concentrations (CDGT) to the concentration directly obtained in the test solution (Csoln) was used to present the performance of DGT under these environmental variables (Figure 3).
The pH effect tests were conducted under pH ranging from 5.31 to 8.97 as shown in Figure 3a. The results show that some compounds (STL, MTL, ABL) were slightly influenced by higher pH (8.97) as the ratios fell down a little below 0.8, which was also observed in EDC measurement using SXLA resin gels [30] and pesticides by HLB resin gels [31], but the quantification accuracies were still <30%.
Ionic strength had a great influence on DGT performance. A reduction in the CDGT/Csoln ratio was observed for all target compounds with the increasing IS as shown in Figure 3b. The ratios of most compounds were below 0.8 even in 0.1 M NaCl solution. This may be due to the competition between ionized forms of compounds and added ions for ion-exchangeable sites of HLB resin [32,33] and/or the interference of mass transfer caused by the increasing salinity [34]. This phenomenon was consistent with some pesticides [15,31] and EDC [32] detection. The HLB-DGT was suitable for measuring β-blockers in surface waters and lake sediments, but more work needs to be conducted to verify the usage in high-salinity environments (e.g., marine water and costal sediment).
The addition of humic acid slightly impeded the uptake of ATL, NDL and STL starting from low spiking level (2 mg L−1), while PPL and ABL were not affected below 20 mg L−1 (Figure 3c). The effect of DOM on target β-blockers was compound- and content-dependent, which was also observed for a wide range of organic compounds. Chen et al. also found a significant reduction in the uptake of triclosan by HLB binding gels with DOM higher than 2 mg L−1, but the sampling of other PPCPs was not influenced even at high DOM level [17].
In general, DGT devices can be used to quantify target β-blockers in natural aquatic environments, while using in high organic content or/and high-salinity environments should be taken with caution.

3.6. In Situ Application of DGT in River Waters

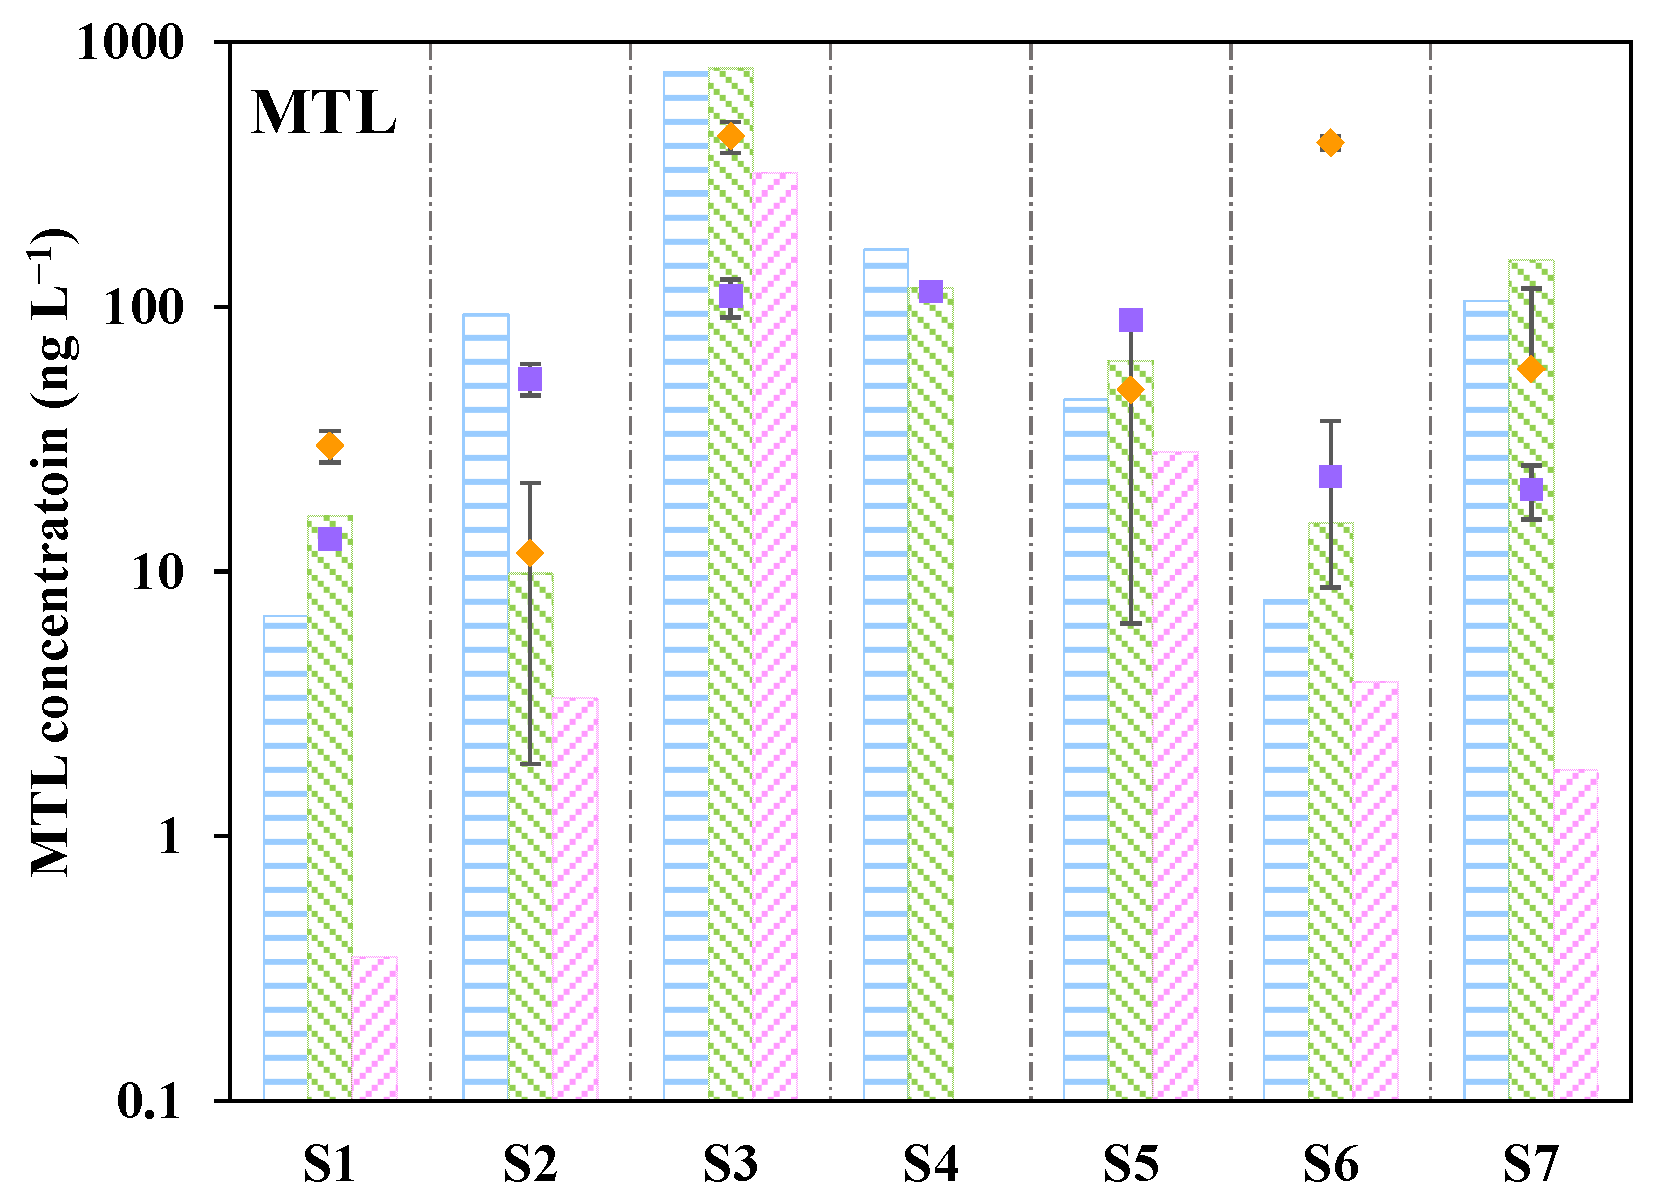
The water parameters such as pH and DOM of different sampling sites are listed in Table S6a. The pH values were in the range between 7.92 and 8.20, and DOM was <13.31 mg L−1; within the tested conditions, the measurements were not significantly affected. As shown in Figure 4 and Figure S8, four target compounds (MTL, PPL, ATL and STL) were detectable in river waters; concentrations of MTL were much higher than the other compounds, suggesting a high consumption of MTL in this area, which was similar as in some other parts of China [35]. The concentrations of MTL measured in urban rivers were generally several times higher than that in Figures S1 and S6, mainly because of the dilution effect in the main stream due to the high flow rate in the Yangtze River [13].
In Figures S3–S5, MTL concentrations from grab samples were relatively stable between three sampling dates; comparable CDGT values were observed, indicating that DGT and grab sampling were in reasonable agreement at sites which have constant chemical input, as commonly seen in WWTPs [31]. In Figure S6, where all the rivers finally converge here into the Yangtze River, DGT-measured MTL concentrations were much higher than Cgrab. Large differences between the two measurements were also observed in PPL and ATL at most sites, where CDGT values were low, but Cgrab values on Day 7 were 2–4 times higher. Grab sampling could only present a snapshot of the contaminant level; the fluctuations of inconstant input would be missed. On the other hand, DGT integrated fluctuating concentrations and provided a TWA concentration, more accurately represented the general contamination level. ATL is another frequently detected β-blocker drug all over the world. In Europe, ATL and MTL together account for more than 80% of total β-blocker consumption [36]. However, in our research area, the concentrations of ATL obtained by the two approaches were all <10 ng L−1, as was PPL, which may be due to the prescription differences.

3.7. In Situ Profiling of β-Blockers at the Sediment–Water Interface Using DGT Probes

A DGT probe was adopted to determine the distribution and labile concentration profile of target compounds around the sediment–water interface. Comparing to DGT devices, the performance of the measurements using DGT probes could be influenced by systematic errors caused by heterogeneity of binding gels and gel cutting. To validate the fine scale (5 mm) as DGT probes are often employed for trace metals, a pre-test was conducted in a well-stirred ATL solution. The average concentration of ATL derived from the DGT probe at 5 mm intervals was 93% of the concentration measured in the spiked solution, and the relative standard deviation of the measurement between these 5 mm strips was <7% (Figure S9). The results verified that accurate and precise measurements of target β-blockers can be obtained using DGT probes.
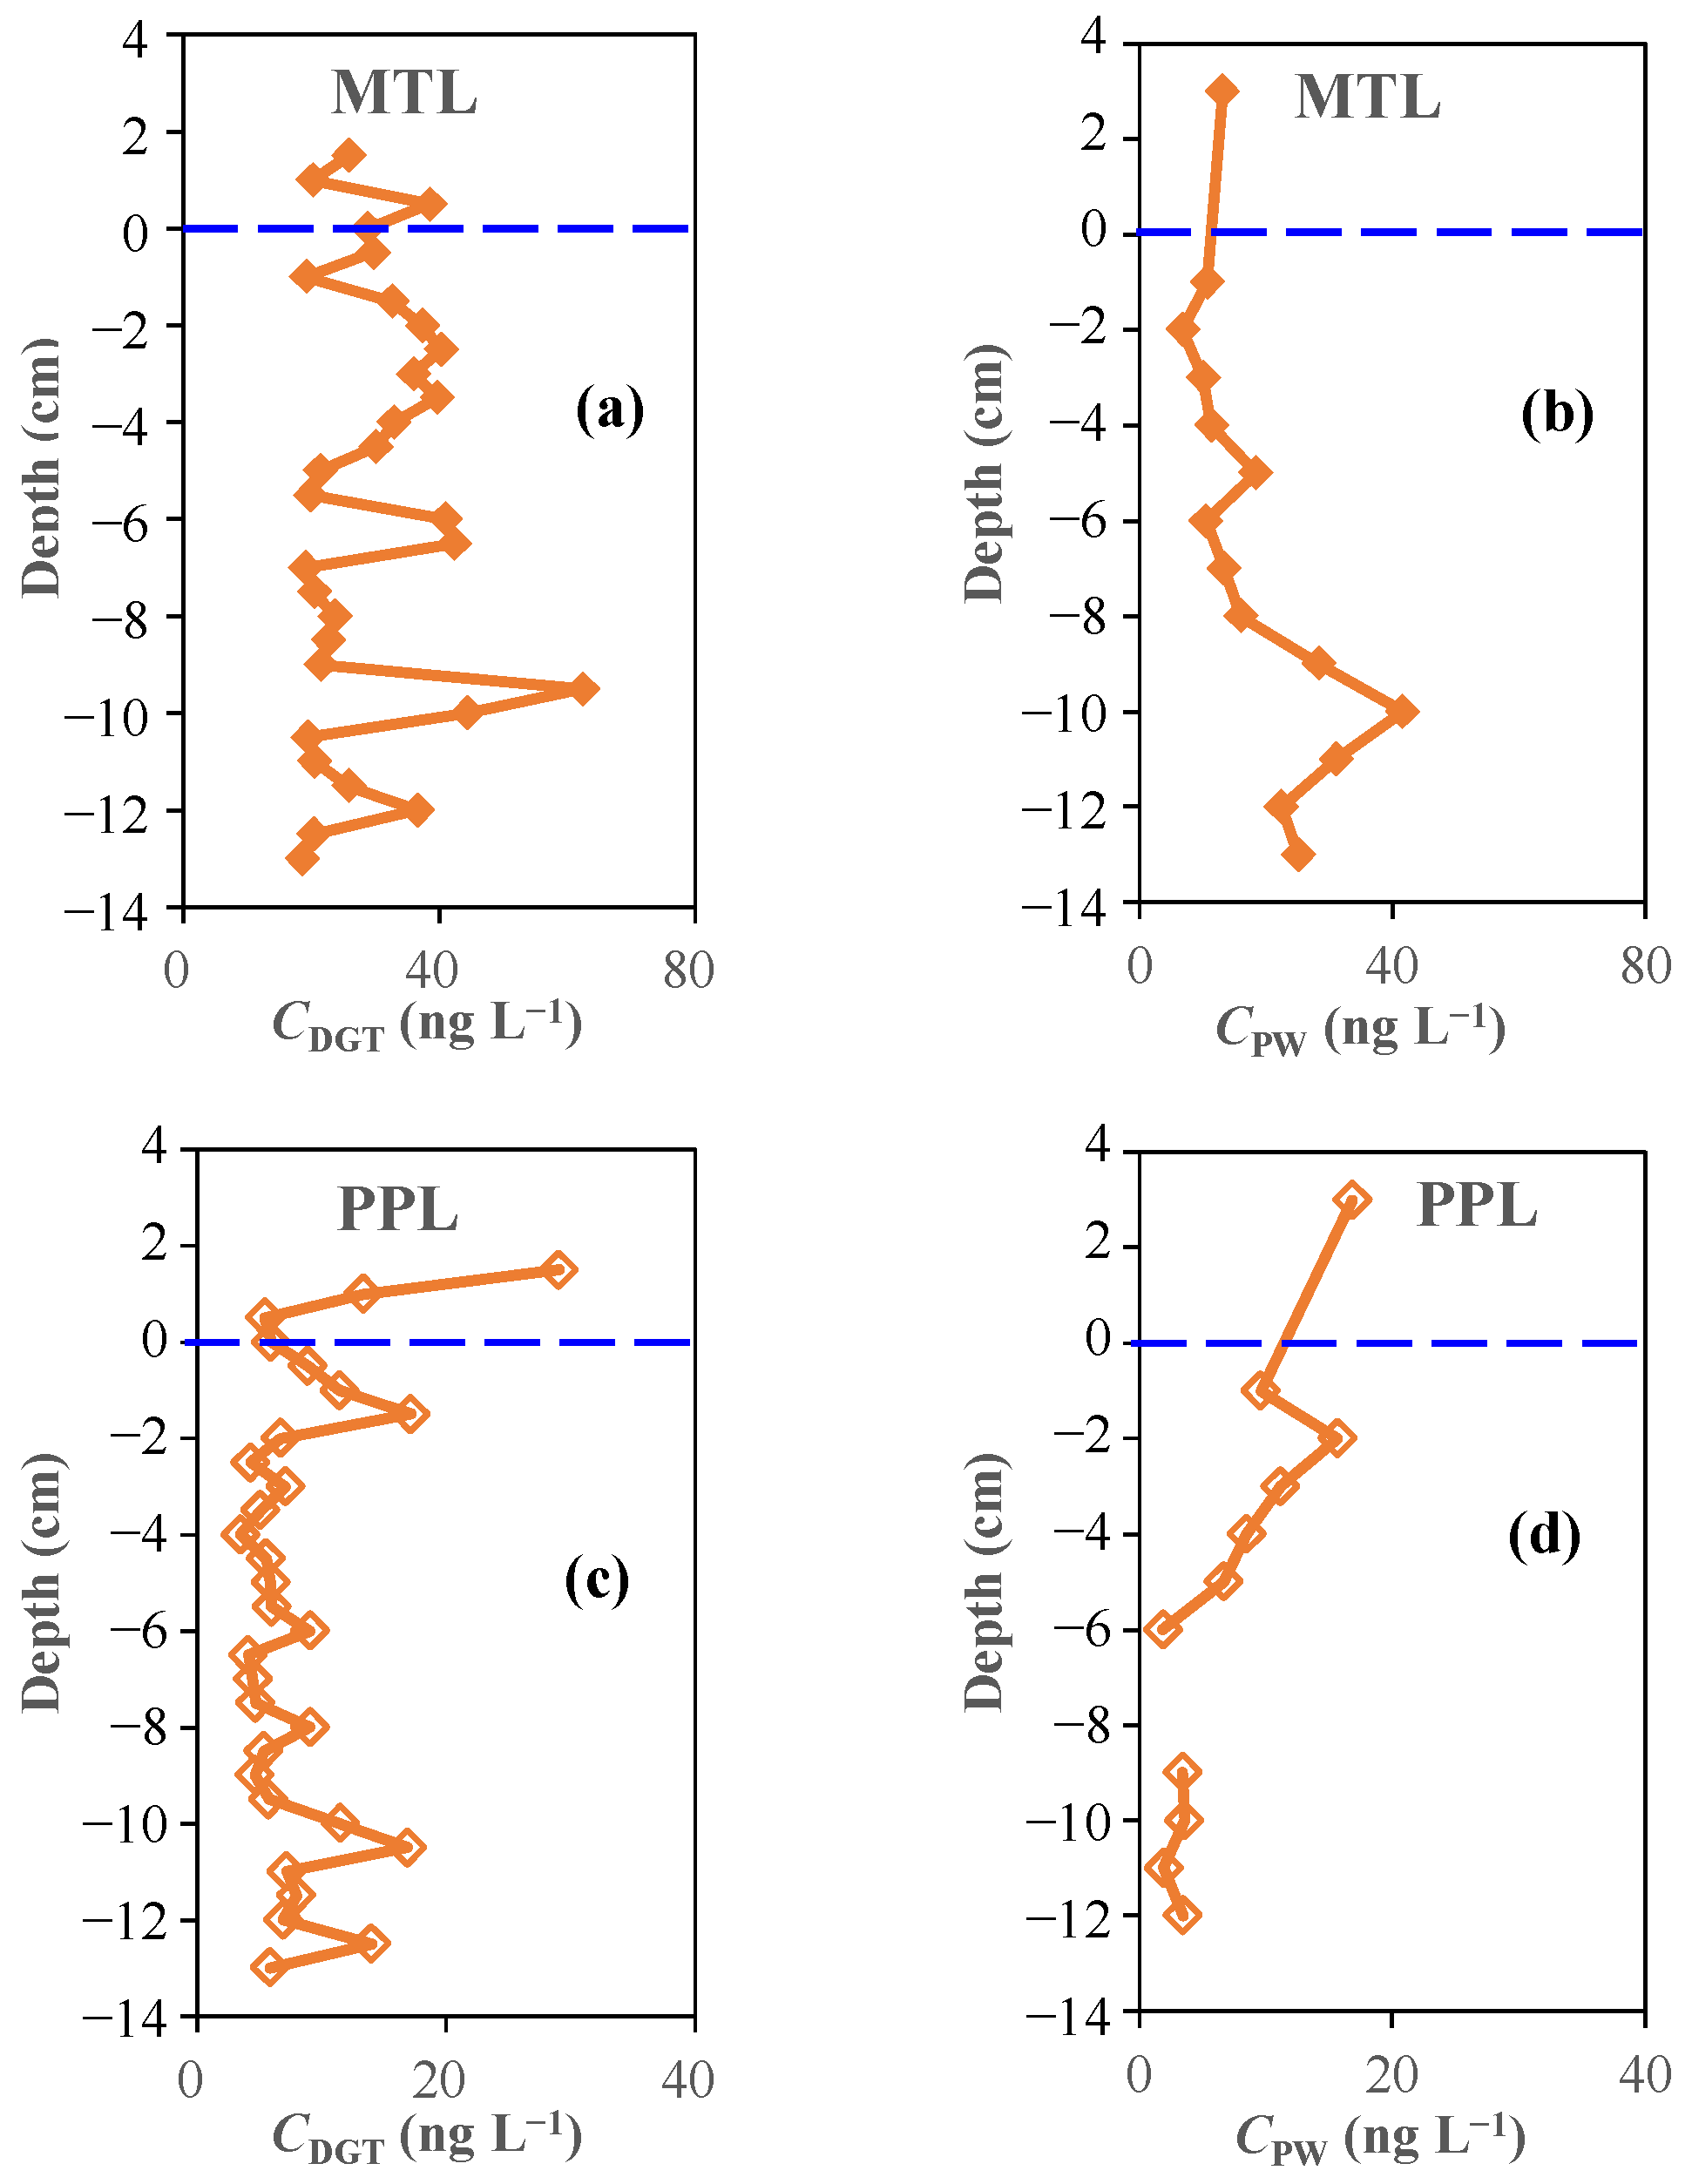
The DGT concentration profile was derived from the top 13 cm of the intact sediment core, together with 2 cm overlying water, as presented in Figure 5a,c. Only MTL and PPL were detectable in the core. The sediment core was sliced at 1 cm intervals; pore-water concentrations (CPW) were also determined at different depths, and overlying water was collected at 2 cm above the sediment surface (Figure 5b,d). Comparing to CPW profiles, CDGT profiles showed more fluctuations and presented more details as they were achieved with higher resolution. The baseline of labile concentrations of MTL were quite constant at ~20 ng L−1. A maximum concentration of 62.4 ng L−1 was observed at −9.5 cm, which was also shown in the CPW profile at −10 cm. Peak values of PPL concentration were also detected at comparable depths. PPL was detectable at all depths using a DGT probe, although most of the values were < 10 ng L−1, while CPW values between −6 and −9 cm were < MDL. It is unusual that the CDGT values were higher than CPW at most depths; this phenomenon was much more serious in the distribution profiles of PPL. A Chelex-DGT probe was deployed together with the HLB-DGT probe to describe the redox condition in the sediment by detecting the vertical distribution of Fe(II) and Mn(II) (as shown in Figure S10). The labile Fe(II) and Mn(II) increased to maximum values at −4 cm, then kept constant below that, indicating that the anoxic condition was formed in the intact core. The treatment for pore-water was conducted in the open air; the original anoxic condition of the sediment was disrupted, probably resulting in the adsorption of target β-blockers on the precipitated iron oxides and accelerated degradation [37]. The real contamination level may be underestimated by this ex situ approach, proving the importance of in situ techniques such as DGT.

4. Conclusions

In this study, we have developed the DGT technique for the determination of eight β-blocker drugs in aquatic environments and assessed its performance in real waters and sediments. Although a few of the target compounds were sensitive to high organic content (e.g., ABL) condition, and high salinity impeded the uptake of all compounds, the DGT technique still performed well in natural water and sediment conditions. For compounds like ATL, which was poorly adsorbed by HLB resin gels, thicker diffusive layers were recommended due to the slow uptake rate. It is also preferred to look for some more effective binding materials in the future. In the field deployment, β-blockers were measured in situ in river waters, a DGT probe was used for the in situ detection at the sediment–water interface for the first time and DGT was proven to be a sensitive and reliable sampling tool. Hence, DGT is promising to improve our biogeochemical knowledge of more pharmaceuticals and understand their dynamic processes in waters and sediments.

Supplementary Materials

The following supporting information can be downloaded at https://www.mdpi.com/article/10.3390/w16111478/s1, Content 1.1: Chemicals and regents; 1.2. Possible adsorption by diffusive gels, filter membranes and DGT mouldings; 1.3. Assembly of DGT probes for sediment samples; 1.4. Pre-test for DGT probes; 1.5. Sample preparation; Table S1: Physicochemical properties of the target β-blockers; Table S2: MSMS parameters for target β-blockers; Table S3: Elution efficiencies of target compounds; Table S4: Diffusion coefficients of 8 target β-blockers at test temperature (27.6 °C, measured) and standard temperature (25 °C, calculated); Table S5: Detection limits (IDLs and MDLs) for DGT samples during lab and field deployments; Table S6 (a). Water parameters of the 7 sampling sites. (b). Parameters of the sediment sample (overlying water); Figure S1: Adsorption of target β-blockers onto DGT mouldings, agarose diffusive gels and 7 filter membranes; Figure S2: Binding kinetics of target compounds; Figure S3: Effective binding capacities of 4 target compounds by DGT devices; Figure S4: Masses of the target β-blockers diffused through the diffusion layer (a 0.78 mm PA diffusive gel and a 0.065 mm PTFE filter membrane) at different times (0–240 min) in the diffusive cell (pH = 6.4 ± 0.2, IS = 0.01 mol/L, T = 27.6 ± 0.1 °C); Figure S5: Measured masses of 4 target β-blockers accumulated onto DGT devices for different times (pH = 6.3 ± 0.2, 0.01 mol/L NaCl, T = 20 ± 0.6 °C); the solid lines are theoretical lines; Figure S6: Measured masses of target β-blockers accumulated onto DGT devices with different diffusion layer thicknesses (pH = 6.5 ± 0.1, 0.01 M NaCl, T = 21 ± 0.2 °C); the solid lines are theoretical lines; Figure S7: Map of sampling sites for deployment in rivers; Figure S8: Concentrations of PPL, ATL and STL detected at 8 sampling sites (bars: grab samples collected on different days (blue: Day 1; green: Day 7; pink: Day 14); dots: DGT samples deployed for different time length (purple dots: 7 days; orange dots: 14 days)); Figure S9: Concentration profile of ATL measured using a DGT probe in a well-stirred solution with average concentrations and relative standard deviation (μg/L); Figure S10: Mn and Fe concentration profiles with depths in the sediment core measured using a DGT probe.

Author Contributions

Y.L.: conceptualization, investigation, methodology, original draft and funding acquisition; M.W.: investigation, methodology and original draft; M.F.: methodology and investigation; D.T.: funding acquisition and original draft; P.Z.: methodology, validation and funding acquisition; Z.Z.: validation and funding acquisition; X.L.: writing—review and editing. All authors have read and agreed to the published version of the manuscript.

Funding

This research was funded by the Open Foundation of Key Laboratory of Industrial Ecology and Environmental Engineering MOE, grant number [KLIEEE-23-05]; Dalian Key Research and Development Plan, grant number [2023YF23WZ046]; the Fundamental Research Funds for the Central Universities, grant number [3132022158]; the National Natural Science Foundation of China, grant number [22076112, 22006006].

Data Availability Statement

Data is contained within the article.

Conflicts of Interest

The authors declare that they have no known competing financial interests or personal relationships that could have appeared to influence the work reported in this paper.

References

  1. Strauss, M.H.; Hall, A.S.; Narkiewicz, K. The combination of beta-blockers and ACE inhibitors across the spectrum of cardiovascular diseases. Cardiovasc. Drugs Ther. 2023, 37, 757–770. [Google Scholar] [CrossRef]
  2. Yıldırım, S.; Erkmen, C.; Uslu, B. Novel trends in analytical methods for β-blockers: An overview of applications in the last decade. Crit. Rev. Anal. Chem. 2022, 52, 131–169. [Google Scholar] [CrossRef] [PubMed]
  3. Chen, Y.; Tong, Y.; Xue, Y.; Liu, Z.; Tang, M.; Huang, L.-Z.; Shao, S.; Fang, Z. Degradation of the β-blocker propranolol by sulfite activation using FeS. Chem. Eng. J. 2020, 385, 123884. [Google Scholar] [CrossRef]
  4. Xu, J.; Sun, H.; Zhang, Y.; Alder, A.C. Occurrence and enantiomer profiles of β-blockers in wastewater and a receiving water body and adjacent soil in Tianjin, China. Sci. Total Environ. 2019, 650, 1122–1130. [Google Scholar] [CrossRef] [PubMed]
  5. Pang, L.; He, K.; Zhang, Y.; Li, P.; Lin, Y.; Yue, J. Predicting environmental risks of pharmaceutical residues by wastewater surveillance: An analysis based on pharmaceutical sales and their excretion data. Sci. Total Environ. 2024, 916, 170204. [Google Scholar] [CrossRef] [PubMed]
  6. Kucharski, D.; Nałęcz-Jawecki, G.; Drzewicz, P.; Skowronek, A.; Mianowicz, K.; Strzelecka, A.; Giebułtowicz, J. The assessment of environmental risk related to the occurrence of pharmaceuticals in bottom sediments of the Odra River estuary (SW Baltic Sea). Sci. Total Environ. 2022, 828, 154446. [Google Scholar] [CrossRef] [PubMed]
  7. Mojiri, A.; Zhou, J.L.; Ratnaweera, H.; Rezania, S.; Nazari, M. Pharmaceuticals and personal care products in aquatic environments and their removal by algae-based systems. Chemosphere 2022, 288, 132580. [Google Scholar] [CrossRef] [PubMed]
  8. Kingsbury, J.W.; Hartman, K.J. The Potential Impacts of Statins and Beta-Blockers on West Virginia Ichthyofauna. Water 2023, 15, 3536. [Google Scholar] [CrossRef]
  9. Ulvi, A.; Aydın, S.; Aydın, M.E. Fate of selected pharmaceuticals in hospital and municipal wastewater effluent: Occurrence, removal, and environmental risk assessment. Environ. Sci. Pollut. Res. 2022, 29, 75609–75625. [Google Scholar] [CrossRef]
  10. Zhu, X.Q.; Jiang, L.; Wang, Y.F.; Ji, X.W.; Zhang, D.L.; Xu, G.Z.; Wu, D.S.; Li, A.M.; Xie, X.C. Validation and application of diffusive gradient in thin-film (DGT) equipped novel cyclodextrin polymer gels for monitoring endocrine disrupting chemicals (EDCs) and environmental risk assessment in the Taihu lake basin. Environ. Res. 2022, 212, 113391. [Google Scholar] [CrossRef]
  11. Gui, W.; Tian, C.; Sun, Q.; Li, S.; Zhang, W.; Tang, J.; Zhu, G. Simultaneous determination of organotin pesticides by HPLC-ICP-MS and their sorption, desorption, and transformation in freshwater sediments. Water Res. 2016, 95, 185–194. [Google Scholar] [CrossRef]
  12. Zhou, C.; Gaulier, C.; Luo, M.; Guo, W.; Baeyens, W.; Gao, Y. Fine scale measurements in Belgian coastal sediments reveal different mobilization mechanisms for cationic trace metals and oxyanions. Environ. Int. 2020, 145, 106140. [Google Scholar] [CrossRef] [PubMed]
  13. Fang, Z.; Li, Y.; Li, Y.; Yang, D.; Zhang, H.; Jones, K.C.; Gu, C.; Luo, J. Development and applications of novel DGT passive samplers for measuring 12 per-and polyfluoroalkyl substances in natural waters and wastewaters. Environ. Sci. Technol. 2021, 55, 9548–9556. [Google Scholar] [CrossRef] [PubMed]
  14. Zhuo, T.Y.; Wan, Q.; Chai, B.B.; Lei, X.H.; He, L.X.; Chen, B. Microbial pathways in the coupling of iron, sulfur, and phosphorus cycles at the sediment-water interface of a river system: An in situ study involving the DGT technique. Sci. Total Environ. 2023, 863, 160855. [Google Scholar] [CrossRef]
  15. Li, Y.; Chen, C.-E.L.; Chen, W.; Chen, J.; Cai, X.; Jones, K.C.; Zhang, H. Development of a passive sampling technique for measuring pesticides in waters and soils. J. Agric. Food Chem. 2019, 67, 6397. [Google Scholar] [CrossRef]
  16. Xie, H.; Chen, J.; Chen, Q.; Chen, C.-E.L.; Du, J.; Tan, F.; Zhou, C. Development and evaluation of diffusive gradients in thin films technique for measuring antibiotics in seawater. Sci. Total Environ. 2018, 618, 1605–1612. [Google Scholar] [CrossRef] [PubMed]
  17. Chen, W.; Li, Y.; Chen, C.; Sweetman, A.; Zhang, H.; Jones, K. DGT passive sampling for quantitative in situ measurements of compounds from household and personal care products in waters. Environ. Sci. Technol. 2017, 51, 13274–13281. [Google Scholar] [CrossRef]
  18. Fang, W.; Williams, P.N.; Fang, X.; Amoah-Antwi, C.; Yin, D.X.; Li, G.; Ma, L.Q.; Luo, J. Field-Scale Heterogeneity and Geochemical Regulation of Arsenic, Iron, Lead, and Sulfur Bioavailability in Paddy Soil. Environ. Sci. Technol. 2018, 52, 12098–12107. [Google Scholar] [CrossRef]
  19. Zou, Y.-T.; Fang, Z.; Li, Y.; Wang, R.; Zhang, H.; Jones, K.C.; Cui, X.-Y.; Shi, X.-Y.; Yin, D.; Li, C. Novel Method for in Situ Monitoring of Organophosphorus Flame Retardants in Waters. Anal. Chem. 2018, 90, 10016–10023. [Google Scholar] [CrossRef]
  20. Guo, C.; Zhang, T.; Hou, S.; Lv, J.; Zhang, Y.; Wu, F.; Hua, Z.; Meng, W.; Zhang, H.; Xu, J. Investigation and application of a new passive sampling technique for in situ monitoring of illicit drugs in waste waters and rivers. Environ. Sci. Technol. 2017, 51, 9101–9108. [Google Scholar] [CrossRef]
  21. Challis, J.K.; Hanson, M.L.; Wong, C.S. Development and calibration of an organic-diffusive gradients in thin films aquatic passive sampler for a diverse suite of polar organic contaminants. Anal. Chem. 2016, 88, 10583–10591. [Google Scholar] [CrossRef]
  22. Li, Y.; Han, C.; Luo, J.; Jones, K.C.; Zhang, H. Use of the Dynamic Technique DGT to Determine the Labile Pool Size and Kinetic Resupply of Pesticides in Soils and Sediments. Environ. Sci. Technol. 2021, 55, 9591–9600. [Google Scholar] [CrossRef]
  23. Yang, Y.; Liu, S.; Wang, R.; Li, C.; Tang, J.; Chen, T.; Ying, G.-G.; Chen, C.-E. Diffusive gradients in thin films (DGT) probe for effectively sampling of per-and polyfluoroalkyl substances in waters and sediments. J. Environ. Sci. 2022, 121, 90–97. [Google Scholar] [CrossRef]
  24. Ji, X.; Challis, J.K.; Brinkmann, M. A critical review of diffusive gradients in thin films technique for measuring organic pollutants: Potential limitations, application to solid phases, and combination with bioassays. Chemosphere 2022, 287, 132352. [Google Scholar] [CrossRef]
  25. Zhang, H.; Davison, W. In situ speciation measurements. Using diffusive gradients in thin films (DGT) to determine inorganically and organically complexed metals. Pure Appl. Chem. 2001, 73, 9–15. [Google Scholar] [CrossRef]
  26. Guan, D.X.; Li, Y.Q.; Yu, N.Y.; Yu, G.H.; Wei, S.; Zhang, H.; Davison, W.; Cui, X.Y.; Ma, L.Q.; Luo, J. In situ measurement of perfluoroalkyl substances in aquatic systems using diffusive gradients in thin-films technique. Water Res. 2018, 144, 162–171. [Google Scholar] [CrossRef] [PubMed]
  27. Han, C.; Geng, J.J.; Xie, X.C.; Wang, X.R.; Ren, H.Q.; Gao, S.X. Determination of phosphite in a eutrophic freshwater lake by suppressed conductivity ion chromatography. Environ. Sci. Technol. 2012, 46, 10667–10674. [Google Scholar] [CrossRef] [PubMed]
  28. Fang, Z.; Li, K.; Li, Y.; Zhang, H.; Jones, K.C.; Liu, X.; Liu, S.; Ma, L.Q.; Luo, J. Development and application of the diffusive gradients in thin-films technique for measuring psychiatric pharmaceuticals in natural waters. Environ. Sci. Technol. 2019, 53, 11223–11231. [Google Scholar] [CrossRef] [PubMed]
  29. Yan, L.; Rong, Q.; Zhang, H.; Jones, K.C.; Li, Y.; Luo, J. Evaluation and Application of a Novel Diffusive Gradients in Thin-Films Technique for In Situ Monitoring of Glucocorticoids in Natural Waters. Environ. Sci. Technol. 2022, 56, 15499–15507. [Google Scholar] [CrossRef]
  30. Stroski, K.M.; Challis, J.K.; Wong, C.S. The influence of pH on sampler uptake for an improved configuration of the organic-diffusive gradients in thin films passive sampler. Anal. Chim. Acta 2018, 1018, 45–53. [Google Scholar] [CrossRef]
  31. Guibal, R.; Buzier, R.; Charriau, A.; Lissalde, S.; Guibaud, G. Passive sampling of anionic pesticides using the Diffusive Gradients in Thin films technique (DGT). Anal. Chim. Acta 2017, 966, 1–10. [Google Scholar] [CrossRef] [PubMed]
  32. Chen, W.; Pan, S.; Cheng, H.; Sweetman, A.J.; Zhang, H.; Jones, K.C. Diffusive gradients in thin-films (DGT) for in situ sampling of selected endocrine disrupting chemicals (EDCs) in waters. Water Res. 2018, 137, 211–219. [Google Scholar] [CrossRef]
  33. Jeong, Y.; Schäffer, A.; Smith, K. Equilibrium partitioning of organic compounds to OASIS HLB® as a function of compound concentration, pH, temperature and salinity. Chemosphere 2017, 174, 297–305. [Google Scholar] [CrossRef] [PubMed]
  34. Semple, K.; Morriss, A.; Paton, G. Bioavailability of hydrophobic organic contaminants in soils: Fundamental concepts and techniques for analysis. Eur. J. Soil Sci. 2003, 54, 809–818. [Google Scholar] [CrossRef]
  35. Ma, R.; Wang, B.; Lu, S.; Zhang, Y.; Yin, L.; Huang, J.; Deng, S.; Wang, Y.; Yu, G. Characterization of pharmaceutically active compounds in Dongting Lake, China: Occurrence, chiral profiling and environmental risk. Sci. Total Environ. 2016, 557, 268–275. [Google Scholar] [CrossRef] [PubMed]
  36. Alder, A.C.; Schaffner, C.; Majewsky, M.; Klasmeier, J.; Fenner, K. Fate of β-blocker human pharmaceuticals in surface water: Comparison of measured and simulated concentrations in the Glatt Valley Watershed, Switzerland. Water Res. 2010, 44, 936–948. [Google Scholar] [CrossRef]
  37. Pan, M.; Chu, L. Adsorption and degradation of five selected antibiotics in agricultural soil. Sci. Total Environ. 2016, 545, 48–56. [Google Scholar] [CrossRef]
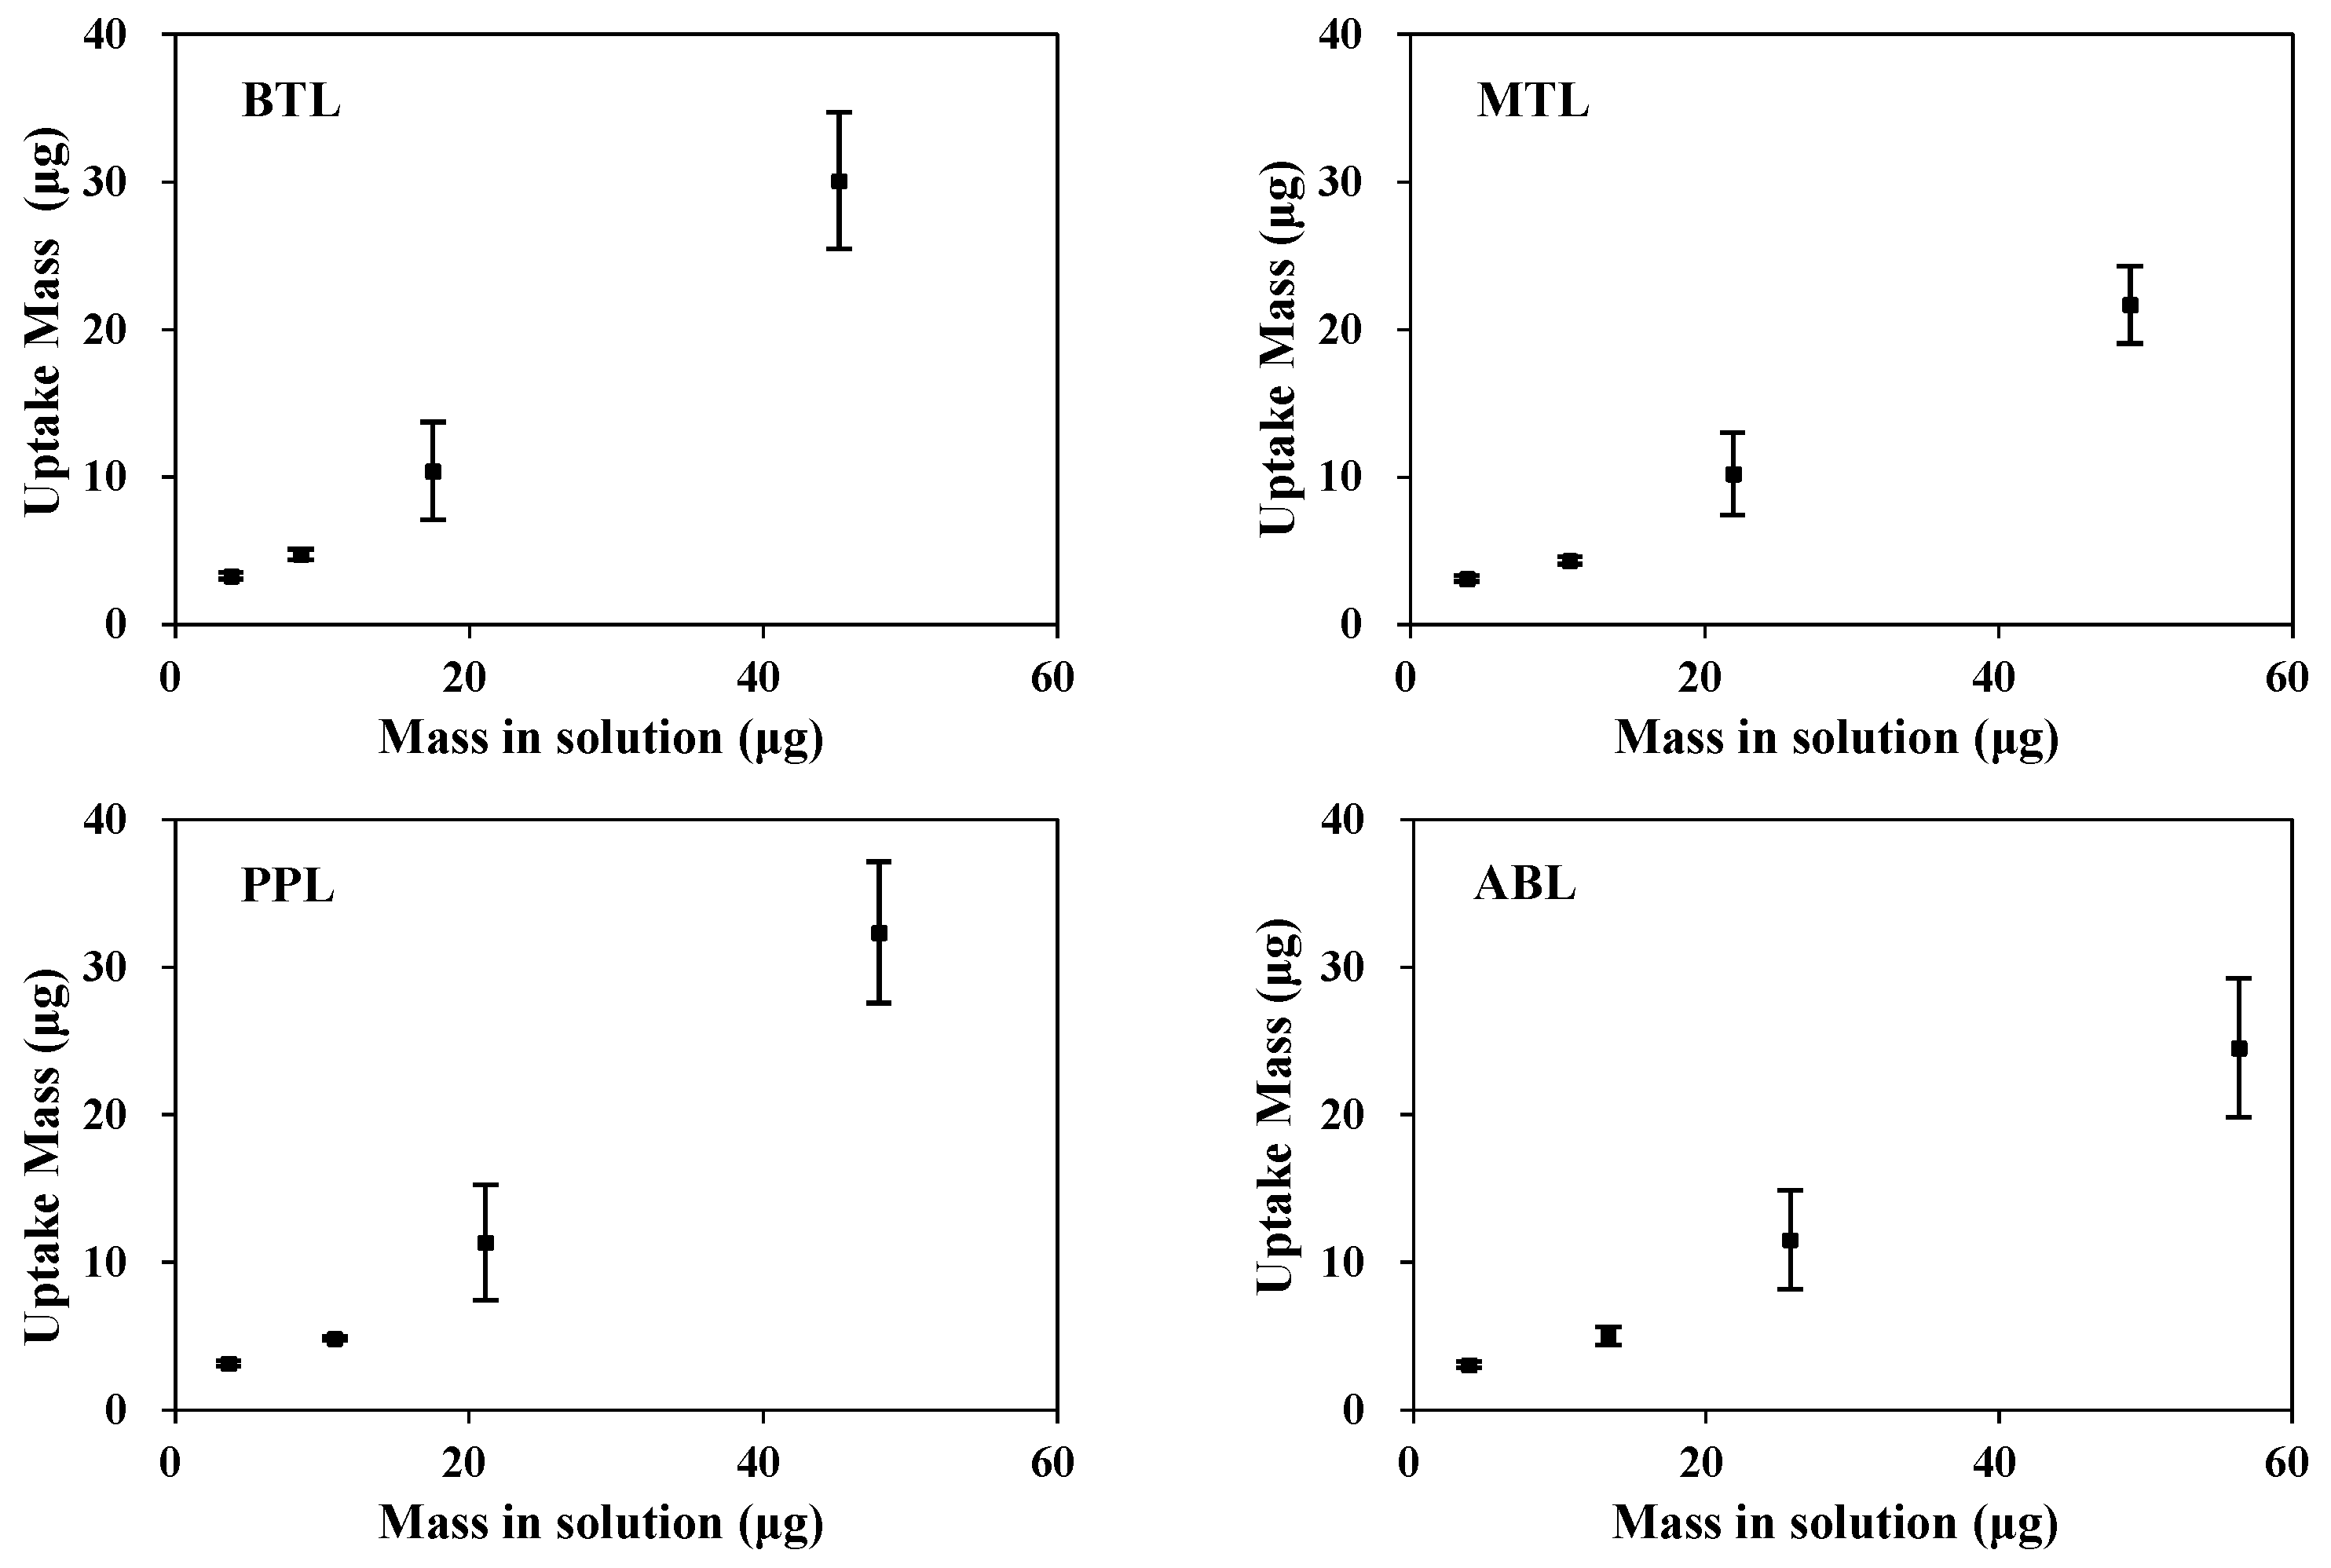
Figure 1. Effective binding capacities of 4 target compounds by DGT devices.
Water 16 01478 g001
Figure 2. Measured masses of 4 target β-blockers accumulated onto DGT devices for different times (pH = 6.3 ± 0.2, 0.01 mol L−1 NaCl, T = 20 ± 0.6 °C). The solid lines are theoretical lines.
Water 16 01478 g002
Figure 3. Effect of various pH (a), IS (b) and DOM (c) on the performance of DGT for 8 target β-blockers (expressed by the ratio of DGT measured concentrations to their concentrations in the test solutions; values were shown as mean ± standard deviation (SD) of three replicate samples). Solid lines are CDGT/Csoln = 1, dash lines are CDGT/Csoln = 0.8 and 1.2 (20% quantification accuracies).
Water 16 01478 g003
Figure 4. Concentrations of MTL at 8 sampling sites (bars: grab samples collected on different days (blue: Day 1; green: Day 7; pink: Day 14); dots: DGT samples deployed for different time lengths (purple dots: 7 days; orange dots: 14 days)).
Water 16 01478 g004
Figure 5. Concentration profiles of target compounds (MTL and PPL) in the sediment cores measured by DGT (a,c) and centrifugation (b,d). Blue dashed lines are SWIs.
Water 16 01478 g005
Disclaimer/Publisher’s Note: The statements, opinions and data contained in all publications are solely those of the individual author(s) and contributor(s) and not of MDPI and/or the editor(s). MDPI and/or the editor(s) disclaim responsibility for any injury to people or property resulting from any ideas, methods, instructions or products referred to in the content.