Article

Bankline Abutment Scour in Compound Channels

1
Civil Engineering Department, Benha Faculty of Engineering, Benha University, Benha 13512, Egypt
2
School of Civil and Environmental Engineering, Nanyang Technological University, Singapore 639798, Singapore
3
Department of Civil and Environmental Engineering, Nazarbayev University, Astana 010000, Kazakhstan
*
Author to whom correspondence should be addressed.
Water 2024, 16(11), 1479; https://doi.org/10.3390/w16111479
Submission received: 14 March 2024 / Revised: 24 April 2024 / Accepted: 30 April 2024 / Published: 23 May 2024
(This article belongs to the Section Hydraulics and Hydrodynamics)

Abstract

:
This paper presents the results of bed scouring near an abutment that spans the entire floodplain width and terminates at the edge of the main channel, termed here as the bankline abutment. The cross section can be divided into a scoured section and an un-scoured section. The scoured bed profile can be approximated using a power function. An analytical method has been suggested to predict the maximum scour depth at bankline abutment. This method is valid irrespective of whether the original bed is at or below the threshold condition of sediment motion. The proposed method is consistent with the experiments from this study and previous studies.

1. Introduction

Scour refers to the removal of sediments around bridge foundations caused by flowing water. The abutment, a crucial component of bridges, plays a vital role in transferring loads from the superstructure to the bridge foundation [1,2]. Scour around abutments typically arises due to the reduction in flow area, posing a threat to the stability of numerous bridges. This concern is paramount among scientists and engineers [3,4].
However, existing scour prediction equations often exhibit limitations in their applicability to various field conditions. One plausible explanation for this limitation is the reliance on experimental studies conducted in rectangular flumes, where the distribution of bed shear stress and flow velocity was assumed to be uniform across the transverse direction [3,5,6,7,8,9]. Natural rivers are different from these idealized conditions. The idealized experiments represent abutments in wide braided rivers. Moreover, natural rivers often feature compound cross-sections, where abutment scour may occur on floodplains [2,10,11,12,13,14] or within the main channel [15,16,17].
When the abutment is situated on the floodplain, it obstructs the flow across the floodplain, leading to a constriction of flow through a narrower cross-section. This narrowing can result in increased local velocity, potentially leading to scour. The distribution of lateral velocity and bed shear stress undergoes redistribution due to large-scale secondary flow cells induced by the floodplain and the main channel [18].
With an increase in the length of the abutment, the redistribution of bed shear stress and velocity between the floodplain and the main channel intensifies. Consequently, abutment scour in a compound channel presents a more intricate scenario compared to that in a rectangular channel.
Sturm and Janjua [10] conducted experiments on abutment scour, extending the abutment length up to approximately 60% of the floodplain width. However, their tests likely did not reach equilibrium as each lasted only 10–12 h. Dongol [19] investigated abutments of varying lengths, some protruding into the floodplain and others into the main channel, with lengths corresponding to 0.168, 0.665, and 1.837 times the floodplain width. In their study, Lim and Yu [16] utilized abutments approximately 1.5 and 2.1 times the floodplain width. Cardoso and Bettess [12] examined four different abutment lengths, focusing on bankline abutments in three tests, the results of which are to be utilized in a subsequent section.
Regarding bankline abutments, Yu et al. [20] discussed flow characteristics and bed shear stress distribution. They observed significantly higher shear stress (3.8 times) at the abutment nose compared to the upstream section. Li [21] emphasized the profound impact of floodplain roughness on the scour pattern around bankline abutments. Sturm [17] experimentally investigated scour around setback and bankline abutments in a compound channel, establishing relationships between maximum scour depth, upstream floodplain depth, and discharge contraction ratio.
It is worth noting that bankline abutment scour is less common than other types but remains important due to the obstruction of flow on the floodplain, redirecting flow and causing scour on the main channel bed. Consequently, our objective is to develop an analytical method for predicting the maximum scour depth around bankline abutments featuring fixed vertical walls as channel banks.

2. Experimental Setup

The experiments took place in a compound flume illustrated in Figure 1 and Figure 2. The former channel has dimensions of 19 m in length, 0.75 m in height, and 1.6 m in width. The floodplain measures 1 m in width, 0.6 m in depth, with a 0.15 m difference in elevation between the floodplain and the main channel. In Figure 2, the abutment is positioned on the left, extending up to the edge of the floodplain, categorizing this setup as Type III (b) according to Melville’s classification [15]. The transition from the main channel to the floodplain (bankline) is vertical and fixed. Both the floodplain and main channel have a bed slope of 1/1000. To minimize flow fluctuations, a honeycomb structure was installed at the flume inlet. Detailed velocity measurements were obtained using the Acoustic Doppler Velocimeter (ADV), while changes in the topography of the scour hole were monitored using a point gauge. These instruments were mounted on a carriage that traversed the length of the flume.
At a distance of 11 m from the flume entrance, two sediment recess tanks were positioned along the main channel and floodplain, respectively. The former tank had a depth of 0.25 m, while the latter was 0.4 m deep. For Runs 1–5 and 8–12, the sediment tanks were filled with uniform quartz particles with a median diameter of 0.93 mm and a standard deviation σ g = ( d 84.1 / d 15.9 )0.5 = 1.31. Runs 6 and 7 utilized the same sand but included an appropriate mix of 5 mm to 10 mm stones. The resulting sediment mixture had a median diameter (d50) of 1.14 mm and a standard deviation σ g = ( d 84.1 / d 15.9 )0.5 = 3.6. (i.e, d84.1 = sediment size of which 84.1% is finer; d15.9 = sediment size of which 15.9% is finer))
The sediment beds were leveled to match the elevations of the main channel and floodplain beds. A vertical-wall abutment model, 1 m in length and 0.05 m wide, was installed perpendicular to the channel wall in the floodplain and centered within the sediment tank, as depicted in Figure 2. The floodplain and main channel beds were constructed of steel, excluding the sediment recess tanks. To replicate bed roughness, the approach section was glued with a single layer of the same sand.
Twelve sets of experiments were conducted, and the results are listed in Table 1. Each run was performed at the desired flow rate that was measured using an electromagnetic flow meter, which can measure up to 1 m3/h. Water was pumped from the underground storage tank to the flume and was re-circulated. The test was conducted for one to three weeks for each experiment until there was very little sediment particle movement out of the scour hole. Hereafter, the pump was gradually shut down and the water in the flume was slowly drained. Using the point gauge, the bathymetry of the scoured bed was measured within an error of ±1 mm. The resolutions of the measured bathymetry grids were 4 cm in the streamwise and 5 cm in the lateral direction.

3. Results and Discussions

3.1. Water Level Observation

The abutment construction raised the water level at the abutment section, but its downstream water level decreased. The water surface elevations along the right sidewall and the abutment were measured with manometers, as shown in Figure 3. The measurement stations were distributed along the right sidewall and around the abutment. Station 6 is at the abutment nose and station 5 is at the opposite bank. The water surface levels at all the stations were monitored regularly during the scour process. A typical observation for Run 1 is shown in Figure 4. The water levels along the sidewall were also measured prior to the construction of the abutment under the same approach flow conditions. Compared to the water levels without the abutment, the water levels around the abutment were slightly raised except near the nose, such as stations 13 and 6. The abutment also caused the water level at station 5 to increase, while that at stations 7 and 8 decreased.
The water surface level around the abutment basically remained unchanged during the scouring process. Figure 4 shows that the changes in the water levels at stations 5 and 6 were less than 0.5 cm during the entire scouring process for Run 1. The flow depth at the approach section of the main channel was 20.9 cm and the maximum flow depth in the equilibrium scour hole was about 28.8 cm. Therefore, the fluctuations of the water surface elevation near the abutment section during scouring can be ignored in comparison to the flow depth at the approach section of the main channel.

3.2. Scour Measurement

Figure 5 shows a representative bathymetry of the scoured bed in the main channel. The numbers on the contour lines are the scour depths in cm, and the y-axis represents the lateral distance from the abutment nose in the main channel, while the horizontal x-axis denotes the streamwise distance from the abutment nose. The present experiments showed that the deepest scour points were not at the abutment nose, but located slightly downstream of the abutment section. The maximum equilibrium scour depth was calculated by interpolation using the elevations at the measured grids.
Two tests, i.e., Runs 6 and 7, were carried out using a sediment mixture with d50 = 1.14 mm and a sediment gradation of 3.6 to investigate the influence of the bed armoring on the scour hole formation. The large gravel in the sediment mixture consisted of 5 mm to 10 mm stones. As the scouring process progresses, the smaller particles can be seen being washed away, leaving behind the larger particles in the scour hole. Finally, an armored layer was formed on the bed surface layer of the scour hole. A photo analysis showed that the stones larger than d95 (i.e d95 = sediment size of which 95% is finer) occupied about 20–30% of the bed surface after the scouring reached the equilibrium phase. Figure 6 depicts the armored layer in the scour hole of Run 7.

3.3. Semi-Empirical Analysis

When the scour hole is in its equilibrium phase, the scoured bed would have attained a particular shape and the shear stress on the bed may be assumed to be equal to the critical Shields stress on the sloping bed [20]. With the knowledge of bed shear, the bed profile should be determinable with respect to the balance of various forces (drag, lift, weight and frictional forces) exerted on the sediment particles on the sloping bed surface, and finally, the depth of flow may be calculated for a given flow discharge. Prior to the abutment construction, the total discharge, represented as Q, within the compound channel can be formulated as follows:
Q = B f h f p U f p + B m h m p U m p
where the subscript p is related to the initial conditions without the construction of the abutment, f and m are related to the floodplain and main channel, respectively, Bf is the floodplain width, hfp and Ufp are the flow depth and mean velocity on the floodplain, respectively; Bm is the main channel width; hmp and Ump are the flow depth and mean velocity in the main channel, respectively. To enhance the reliability of the model, if possible, it is recommended that these quantities should preferably be obtained from field measurements. However, these are not easily available, as a design flow discharge is typically of the order of 1 in 50 or 100 years. Based on the design discharge, slope and geometry of the compound channel, the depths of flow and velocities on the floodplain and in the main channel can be calculated numerically [22,23] or using empirical method [24].
Once the abutment is constructed, the local bed shear stress at the abutment section increases, particularly at the abutment tip, and this causes localized scour around the abutment [25]. The local bed shear decreases and the intensity of scouring also reduces with the increase in scour hole size. If the scouring process continues for a sufficiently long time, an equilibrium scoured bed profile would be formed. In this context, the shear stress of the bed at any given point on the scoured bed matches the critical value required for sediment movement on the slope. At the deepest point within the scour hole, this value approximates the critical Shields stress on a flatbed [20]. In other words, the sediment particles at the deepest location can be assumed to have shear stress under equilibrium scour conditions given by the following equation:
τ c d = θ c ρ s ρ g d *
where τcd is the critical bed shear stress, θc is the critical Shields parameter, ρs is the density of sediment, ρ is the density of fluid, g is the acceleration of gravity, and d is the representative sediment size. For uniform sediment, d is assumed to be the median size, d50, and for sediment mixtures, the bed would be armored and d* is taken as d95, which is the sediment size of which 95% is finer.
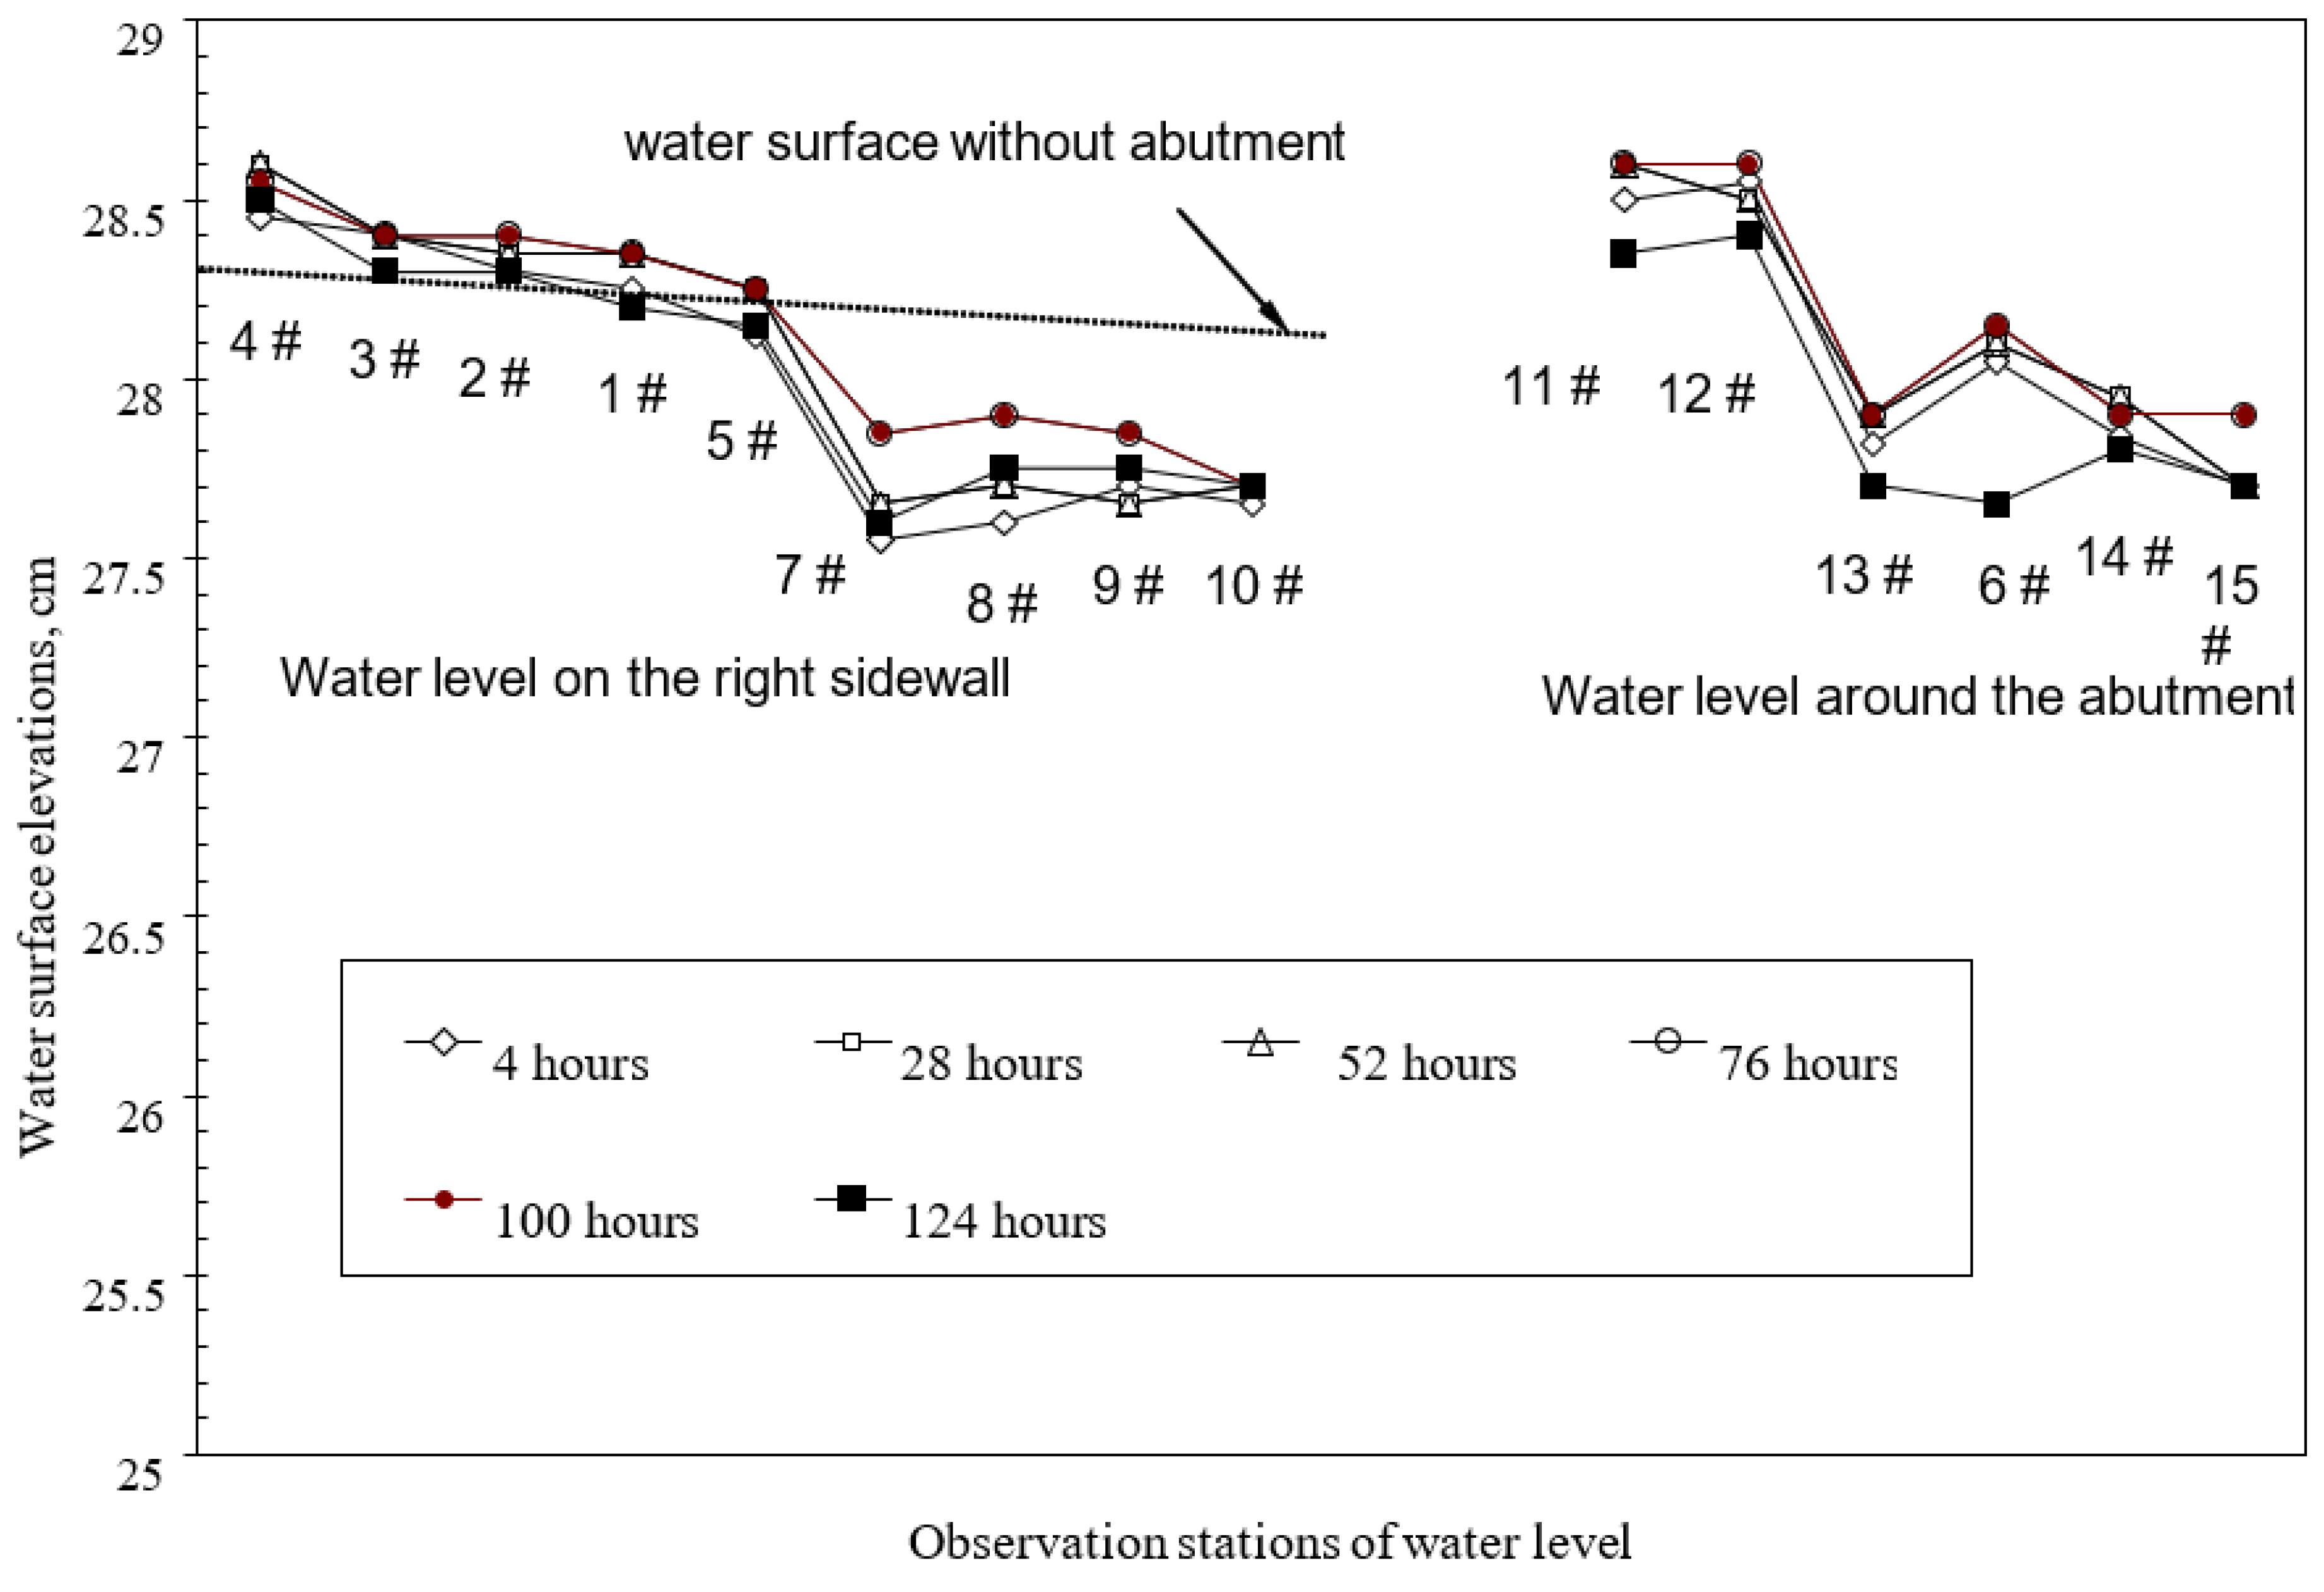
As the scour progresses, it was noticed that the elevation of water surface in the streamwise direction did not change much compared to the flow depth (Figure 4). This means that the effect of the abutment resulted mainly in an increase in the local velocity. Hence, the depth of flow at any position in the scour hole can be regarded as the sum of the original flow depth (hmp) and the local scour depth.
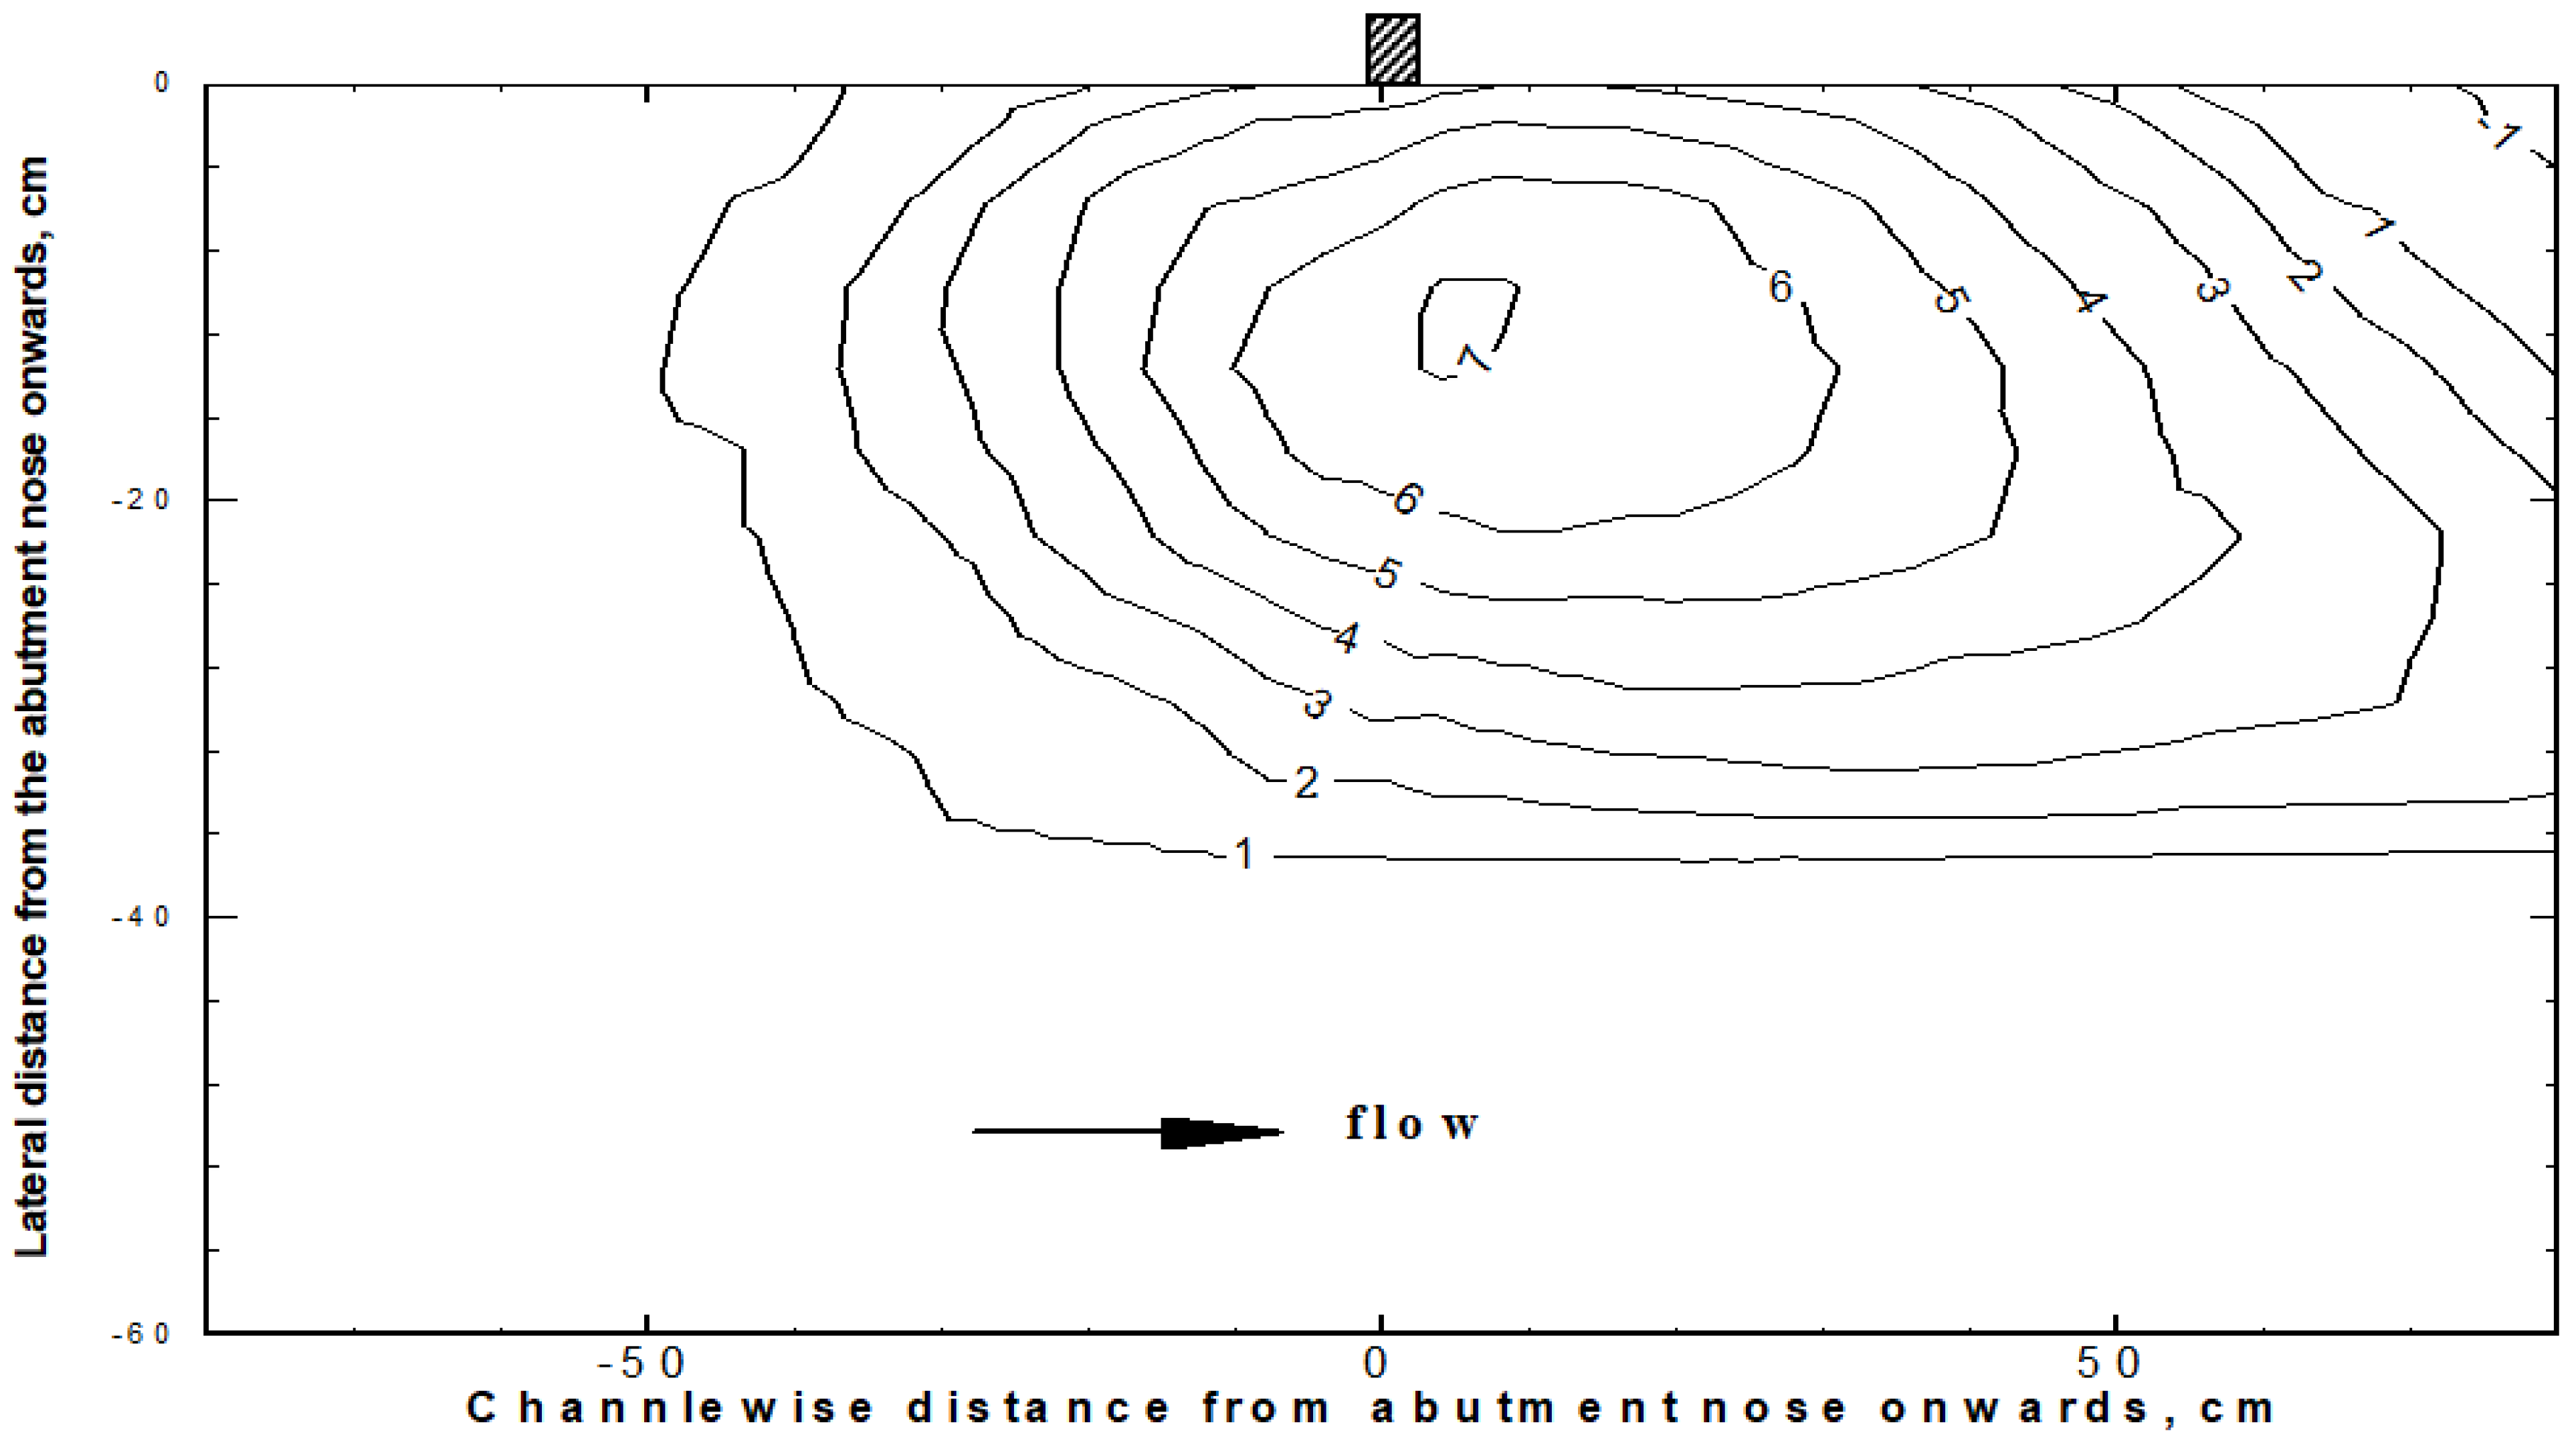
For bankline abutment with a vertical bankfull embankment, the scour hole is formed adjacent to the nose of abutment in the main channel. It is assumed that the lateral scoured profile at the deepest section is at the abutment section, even though the scour contour measurements showed that the maximum scour depth occurs slightly downstream of the abutment section (see Figure 5). Within this short distance, this assumption would not cause much difference to the flow conditions as the flow dispersed in the floodplain would be comparatively small compared to the total flow in the channel.
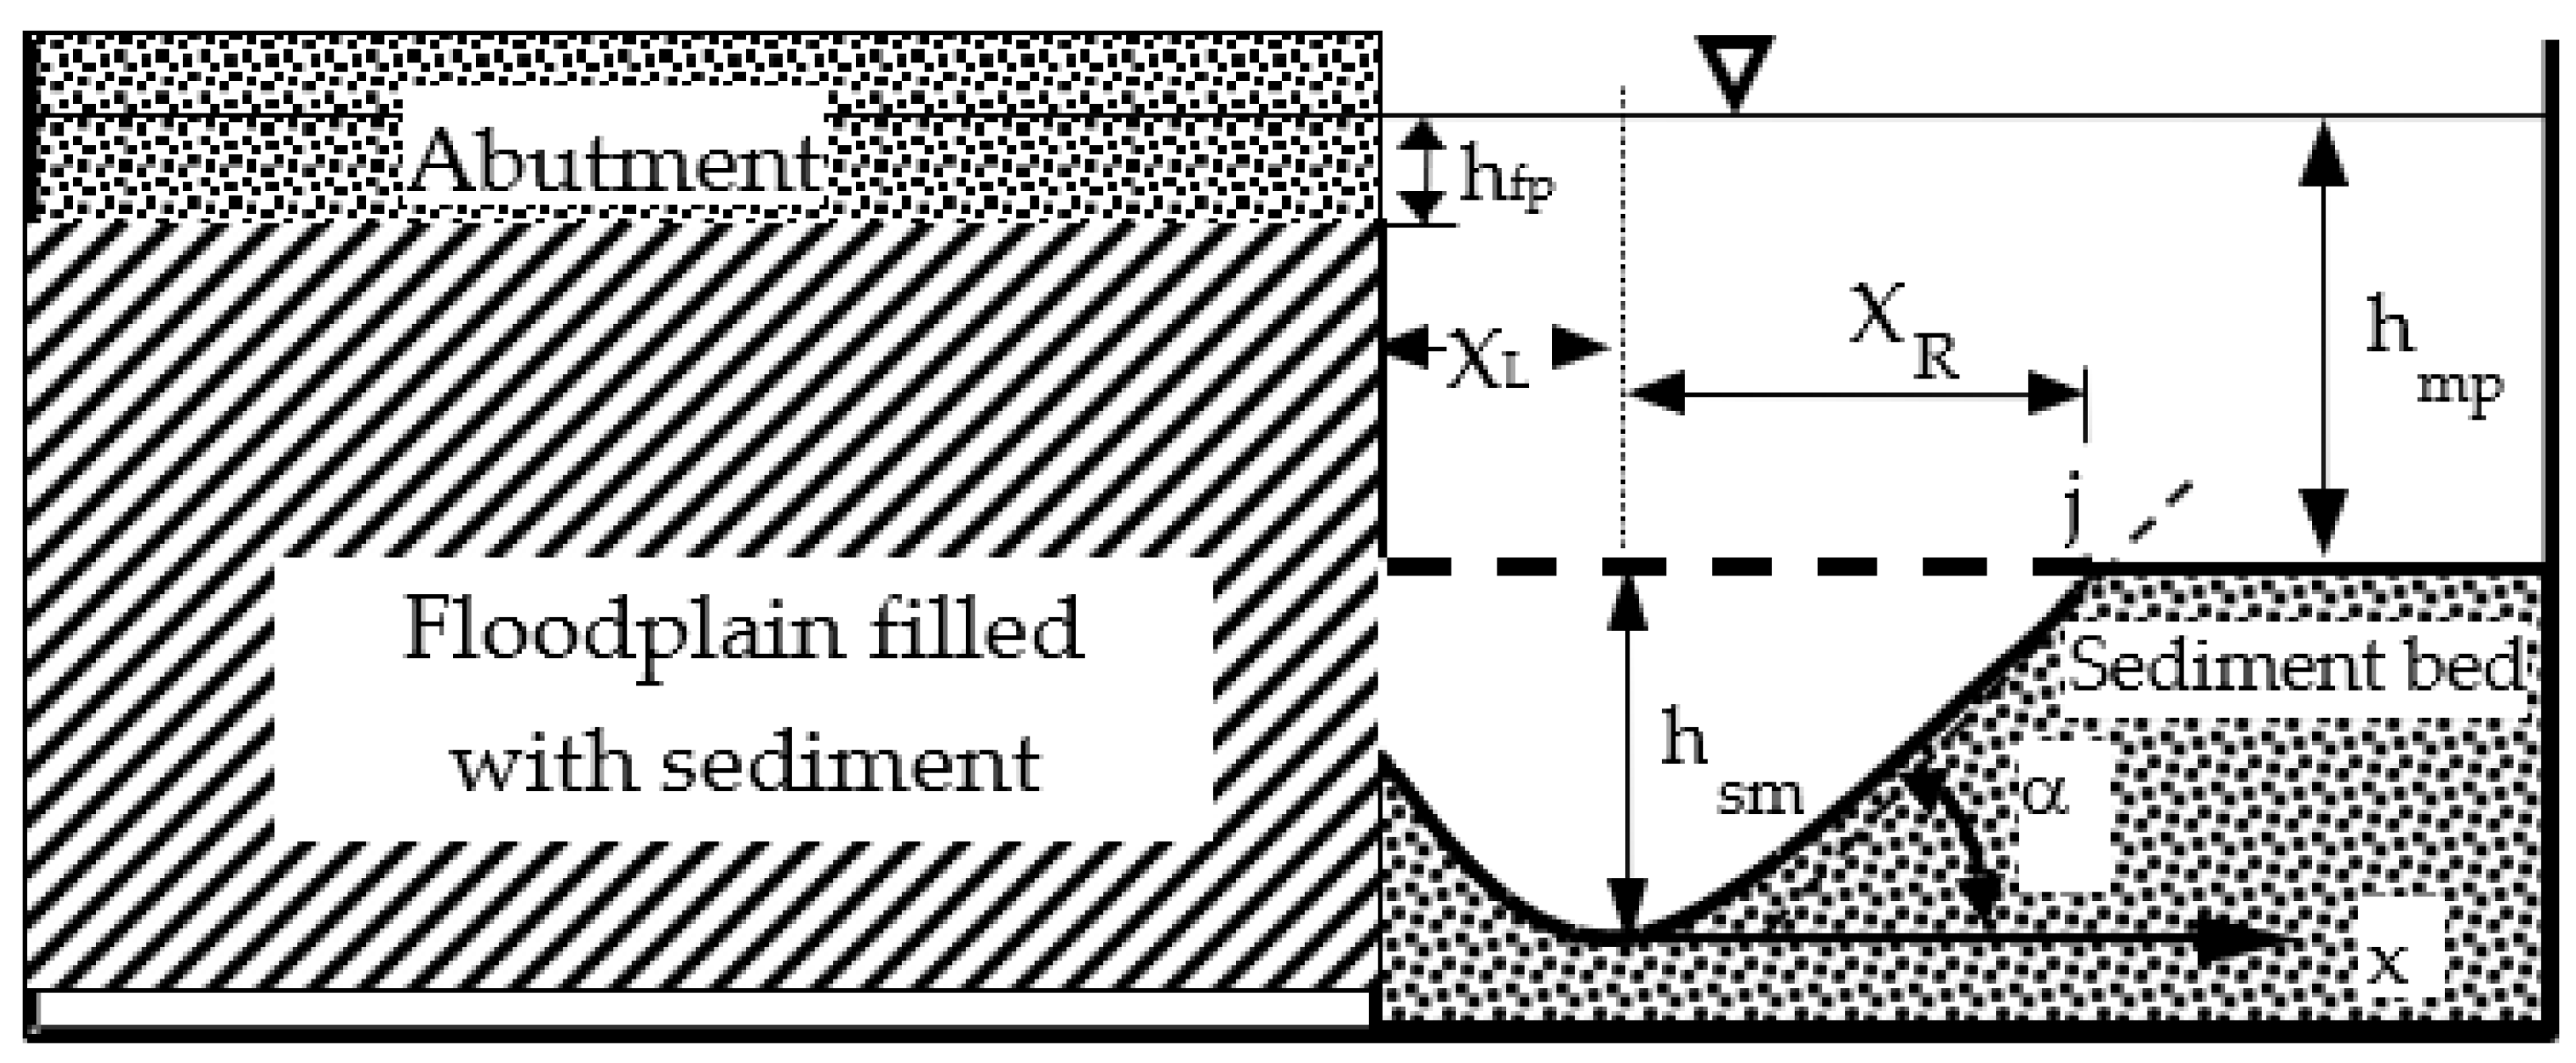
Figure 7 shows that the area of flow above the lateral cross section of the deepest scoured bed profile to the water surface may be segmented into three sub-regions. The first sub-flow region lies within the scour hole with a lateral width of XL, measured from the abutment nose to the maximum scour depth (hsm). The second region extends laterally from the maximum scour depth to a point j on the initial bed level, with a width of XR. The final sub-flow region represents the un-scoured portion, stretching from point j to the sidewall of the main channel. At equilibrium, the shear stress on the bed within the scour hole matches the critical value required to initiate sediment movement on a sloping surface, while on the un-scoured bed, it remains below or equals the critical value for sediment motion on a flatbed [20].
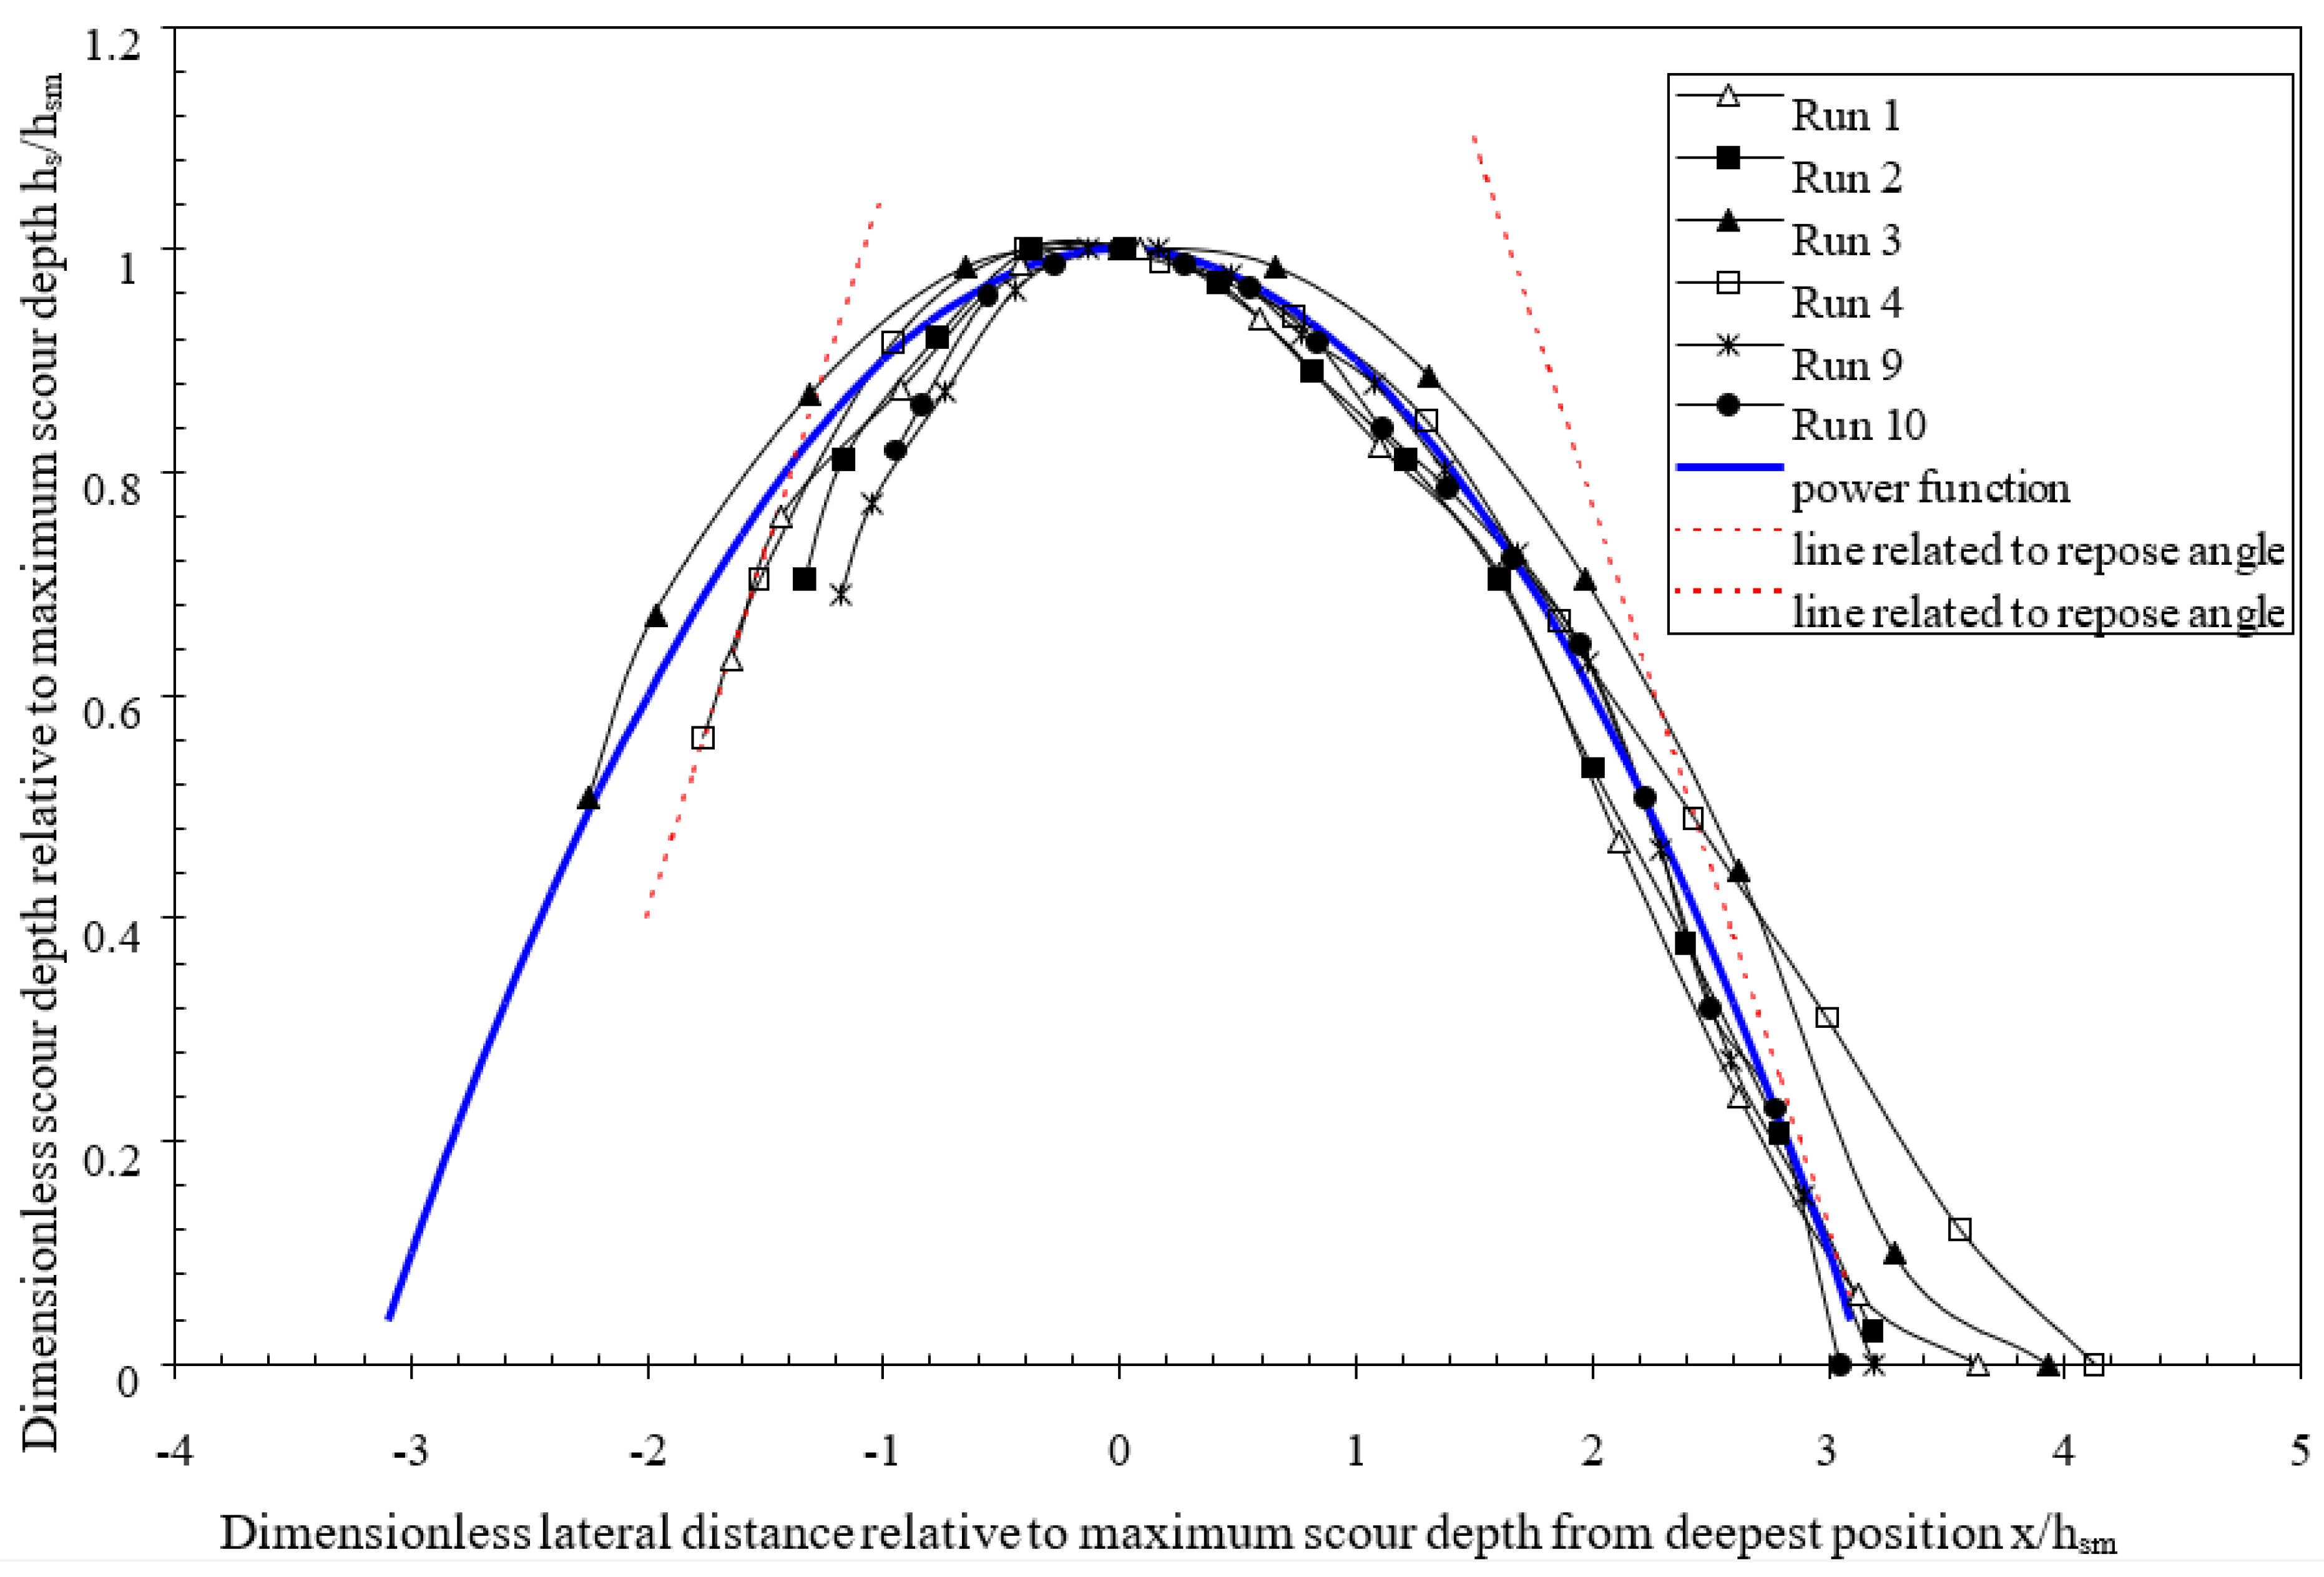
Using a similar approach to the determination of the channel profile of a critical stable channel [23], the lateral scour hole profile can also be solved numerically with respect to the force balance exerted on the sediment particles on the surface of bed. Considering the deepest scouring location of each run as the origin of the lateral distance, the measured lateral scoured bed profiles are tested for self-similarity by plotting hs/hsm against x/hsm, where hs is the scour depth at any x-location, and x is measured from the maximum scour point, hsm. Figure 8 shows the dimensionless bed profiles for various runs. These lateral bed profiles can be represented by a second-order parabolic function, as shown by the solid line in Figure 8, which can be expressed as follows:
y = k x 2
where the deepest scouring location is the origin of the curve, y is the elevation above the deepest point, and k is the constant associated with the flow conditions and sediment size.
With reference to Figure 7, it can be assumed that the bed slope at point j should be equal to the submerged repose angle of the sediment particles in still water. If d y d x = β , where β is the slope of the bed profile at point j, then β would be equal to tan α, where α is the repose angle of the sediment, which can be calculated using the formula proposed by Yu and Knight [23]. The dotted lines in Figure 7 show that the angle of repose of the sediment is close to the slope at point j.
Differentiating (3) and substituting d y d x = β and x = XR at point j yields the following equation:
k = β 2 X R
From Figure 7, it can be seen that the ordinate of point j is hsm and its abscissa is XR. Hence, using (3), the following equation can be obtained:
h s m = k X R 2
From (4) and (5), we can write k and XR in terms of hsm and β.
k = β 2 4 h s m   and   X R = 2 h s m β
According to the experimental results of the present study, it was found that XL ≈ XR/3. Therefore, using (6), the lateral width of the scour hole is as follows:
X L + X R = 8 h s m 3 β
Since β = tan α and taking α = 33° as a typical value, Equation (7) shows that the scour width is larger than the 2.75 hsm value suggested by Laursen [26], bearing in mind that his experiments were carried out under live-bed conditions. The lateral bed profile of the scour hole can be expressed as follows:
y = β 2 4 h s m x 2
With reference to Figure 7, the flow depth, h, in the main channel at any arbitrary lateral location in the scour hole can be written as follows:
h = h m p + h s m β 2 4 h s m x 2 = h m p + h s m 1 k 2 x 2
where k 2 = 1 h m p + h s m β 2 4 h s m .
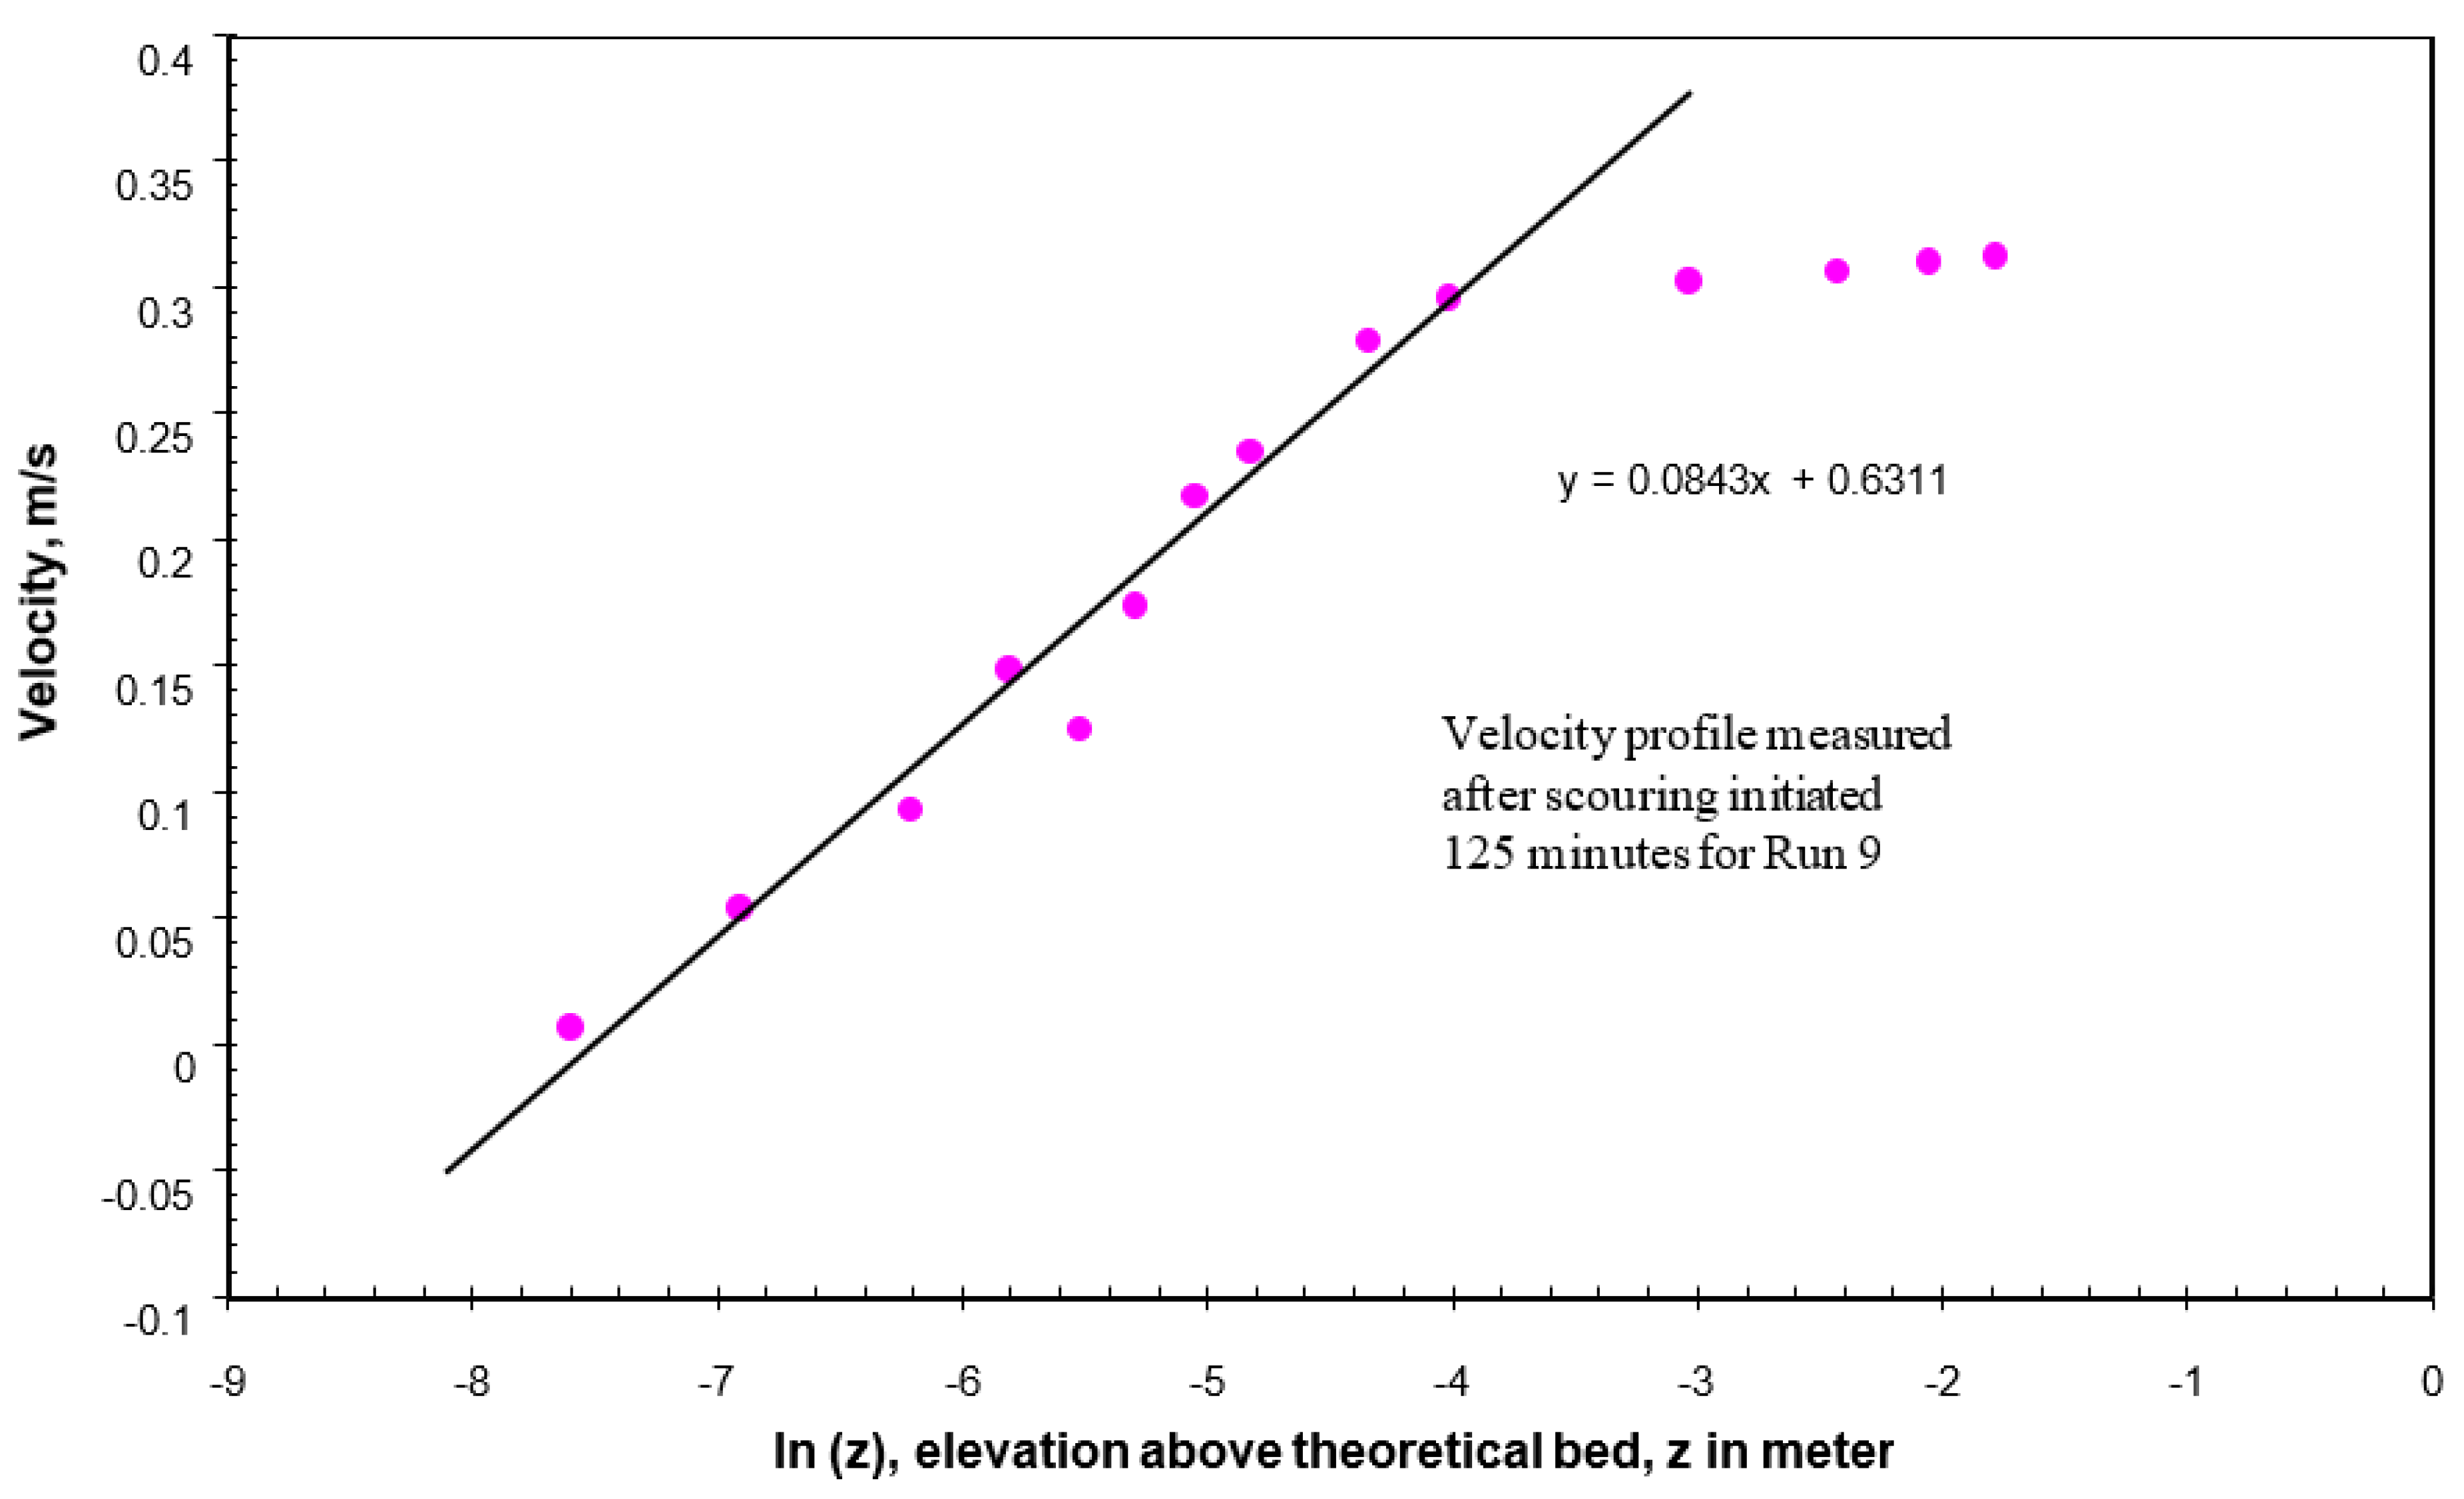
For flow in a wide alluvial channel, we assumed that the velocity distribution for fully turbulent 2D flow may be approximated by the power law [27].
U u * = m   h k s n
where U is the depth-averaged velocity, u is the shear velocity, h is the normal flow depth, ks is the equivalent sand roughness, (=2d50); m and n are the coefficient and exponent, respectively. An example of Equation (10) is the one-sixth power law or the Manning–Strickler equation.
From (2) and (10), the depth-averaged velocity at any arbitrary lateral position in the scour hole can be written as follows:
U = k 1 m h n
where k 1 = θ c ρ s ρ 1 g d * 1 k s n .
For a straight compound channel with uniform geometry, the slopes for the floodplain and main channel are typically similar and the mean velocities at the approach section are given by the following formulas:
U f p = 1 n f p R f p 2 / 3 S 0
U m p = 1 n m p R m p 2 / 3 S 0
where Rfp and Rmp are the hydraulic radii, nfp and nmp are Manning’s roughness of the floodplain and main channel, respectively. Eliminating S0 in (12) and (13) yields the following formula:
U f p = U m p n m p n f p R f p R m p 2 / 3
Substituting (14) into (1), the mean velocity of the un-scoured section from point j (see Figure 7) to the sidewall of the main channel can be written as follows:
U m p = Q h m p B m + h f p B f n m p n f p R f p R m p 2 / 3
During the experiments, it was observed that the flow directions are not perpendicular to the cross section at the deepest scour location. The flow is being diverted as it approaches the abutment tip towards the main channel and the separation of flow occurs at the lee side of abutment. Lim and Nugroho [25] observed similar deflection behavior for setback abutment sited on the floodplain. The yaw angle of the flow diversion in the streamwise direction at any arbitrary point of this cross section depends on its geometrical position as well as the ambient flow conditions. The closer it is to the abutment nose, the larger the yaw angle [9], and this trend has been confirmed from the path of the large-scale vortices by Yu et al. [20]. Consequently, the yaw of the flow causes a reduction in the conveyance of flow and a correction is needed to calculate the flow discharge through the scour hole section. We assume that the correction factor, denoted as f, is generally proportional to the ratio of the unobstructed main channel flow discharge to the total approach flow discharge, i.e., f = U m p h m p B m / Q . Considering the correction to the yaw and the non-uniform of flow distribution in the scour hole section, the flow discharge passing through this scour hole section, Qss, may be written as follows:
Q s s = k 1 m k 3 h m p + h s m 1 + n U m p h m p B m Q X L X R 1 k 2 x 2 1 + n d x
where k 2 = 1 h m p + h s m β 2 4 h s m , and k3 is a coefficient. Since 0 k 2 x 2 < 1 , the term 1 k 2 x 2 1 + n can be approximated by the following expression:
1 k 2 x 2 1 + n 1 1 + n k 2 x 2 + n 1 + n 2 ! k 2 x 2 2
Substituting (17) into (16) yields the following equation:
Q s s = k 1 m k 3 h m p + h s m 1 + n U m p h m p B m Q x 1 + n k 2 3 x 3 + n 1 + n k 2 2 10 x 5 x = X L x = X R
which can be further simplified as follows:
Q s s = k 1 m k 3 h m p + h s m 1 + n U m p h m p B m Q h s m β 8 3 56 1 + n 81 h s m h m p + h s m + 244 n 1 + n 1215 h s m h m p + h s m 2
The flow discharge over the un-scoured section, Qus, can be written as follows:
Q u s = U m p h m p B m 8 3 h s m β
Hence, the total flow discharge can be calculated using the following equation:
Q = Q s s + Q u s
where the first term of the right side is the discharge, Qss, related to the scour hole (19) and the second term is the discharge, Qus, associated with the un-scoured bed (20). The equilibrium scour depth can be obtained by solving (4), (19), (20) and (21) using Excel spread sheets or other programs such as FORTRAN, C or Visual Basic.
It should be noted that the solution need not state whether the original bed in the main channel is at the threshold condition of sediment motion. When the approach flow conditions are higher than the threshold condition of sediment motion, the channel bed would be mobile and the flow depth exceeds the critical depth for sediment incipient motion. Otherwise, the flow depth is smaller than the critical depth of sediment incipient motion. In a broad sense, the scour depth is defined as the bed elevation prior to the abutment construction minus the elevation of the deepest scour point. However, in most studies, the experiments were carried out by imposing approximately the threshold velocity on the floodplain, which is supposed to give the most extreme scour depths if the runs are of sufficiently long duration [3,28]. In this sense, the definition of the maximum scour depth was confined to compare with such a critical condition.

3.4. Sample Calculation

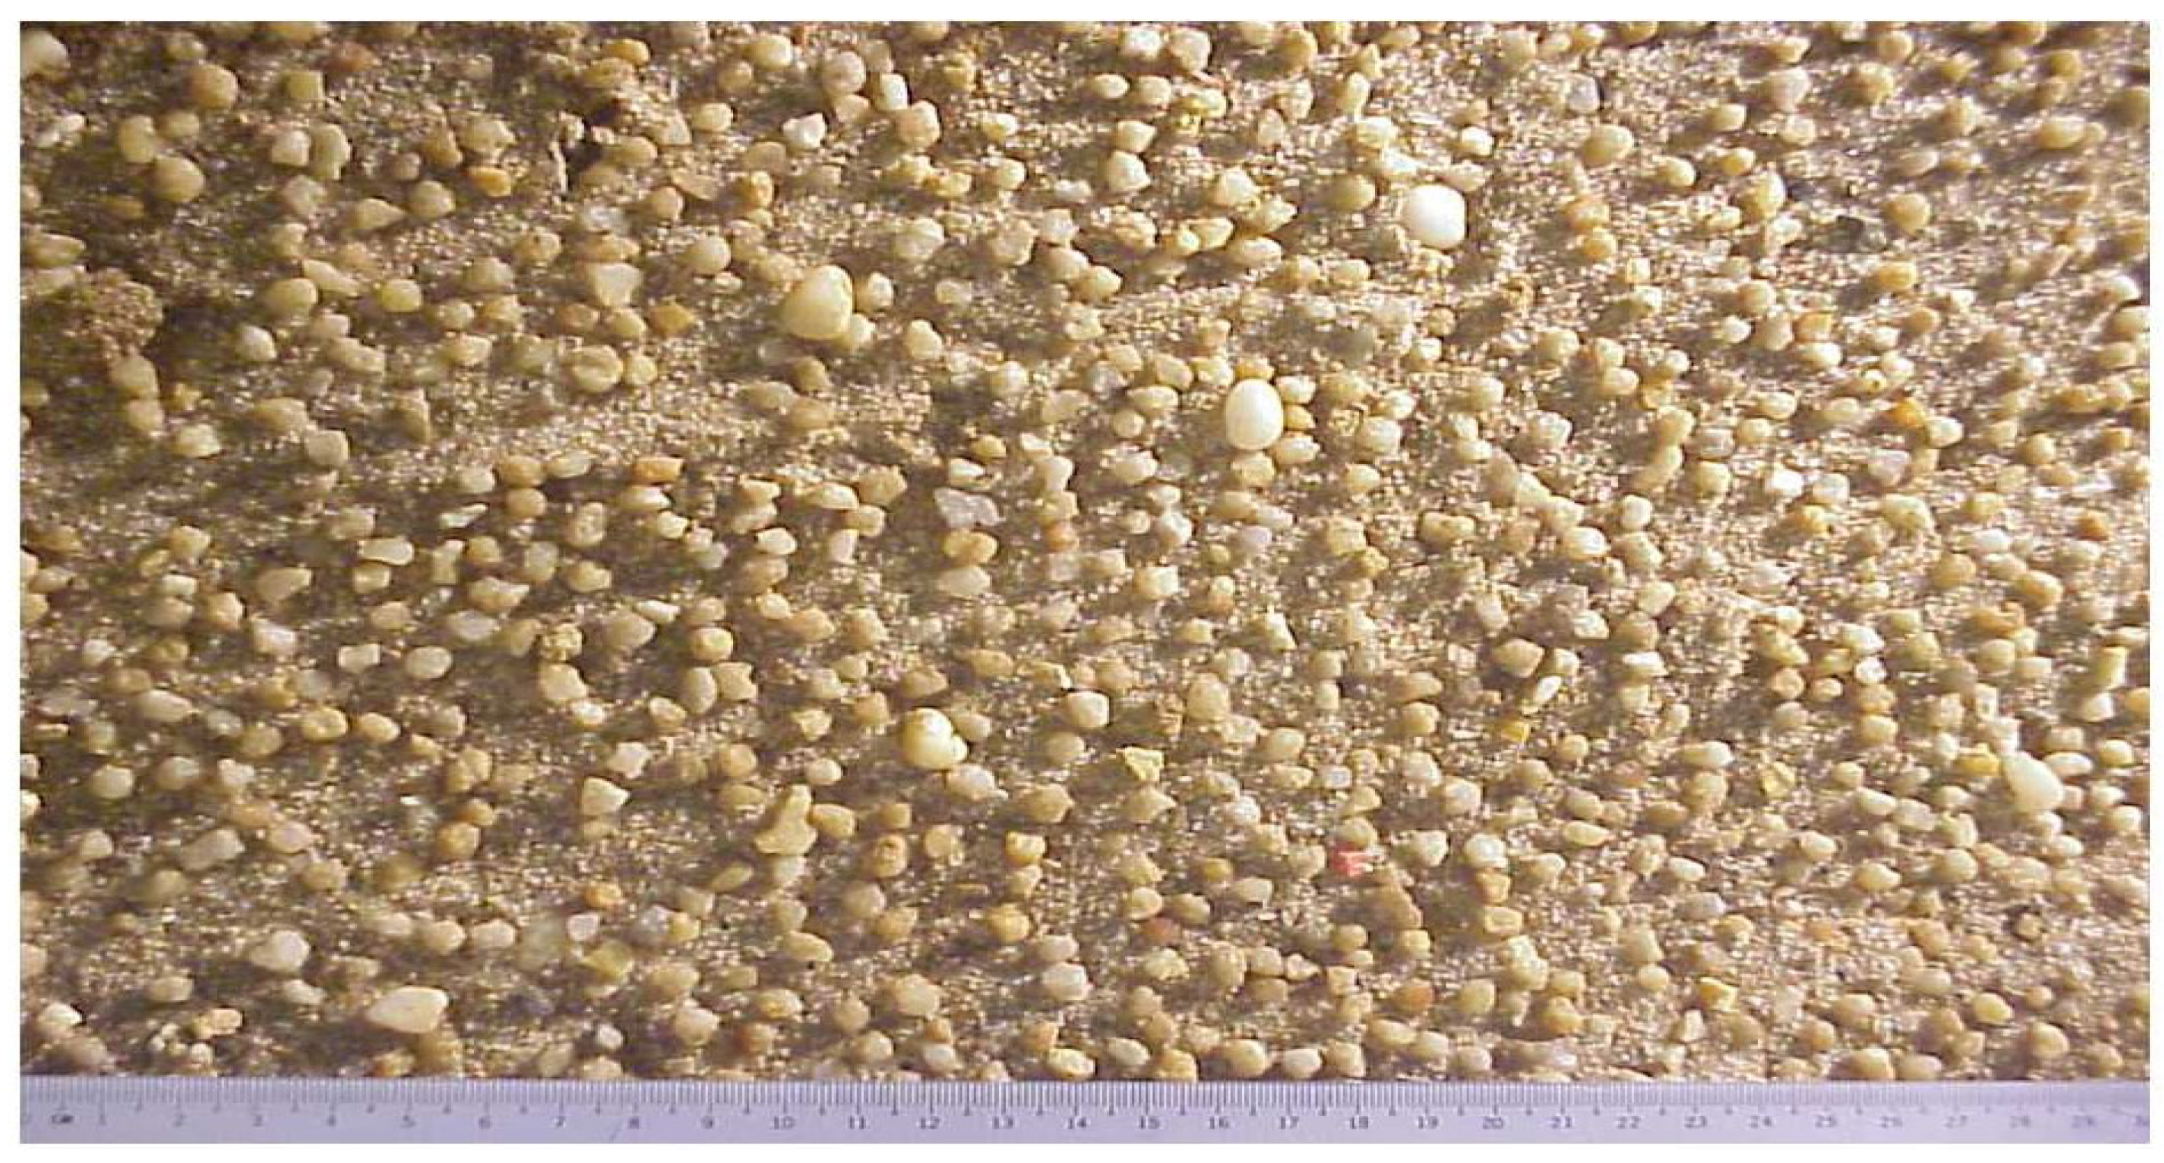
A sample calculation is shown for the case of Run 1. The measured flow discharge, Q, was 0.0425 m3/s. With a sediment size of 0.93 mm and ρs = 2640 kg/m3, the corresponding angle of repose was measured, which was 33° and β = 0.65. The measured flow depths were hmp = 0.209 m and hfp = 0.059 m. The calculated hydraulic radii are Rmp = 0.131 m and Rfp = 0.054 m. The measured flow velocities in the main channel and floodplain were Ump = 0.249 m/s and Ufp = 0.195 m/s. The critical Shields parameter θc = 0.031 according to the Shields diagram [29]. We adopted mk3 = 3.9, n = 1/3, and the equivalent sand roughness ks = 2d50 = 1.86 mm. Hence, the coefficient k1 = 0.175 using k 1 = θ c ρ s ρ 1 g d * 1 k s n . The measured water surface slope without the abutment was 0.00065. Based on the velocity measurements in the floodplain and main channel for different flow discharges, the mean roughness was evaluated from (12) and (13) for the floodplain and main channel to be nfp = 0.0186 m−1/3s and nmp = 0.0264 m−1/3s, respectively. The mean approach velocity computed using (15) was 0.249 m/s (herein Ump was over-assigned), and the correction factor f = U m p h m p B m / Q = 0.731.
Using the solver in the Excel spread sheet, the maximum scour depth can be calculated by trial and error using (19), (20) and (21). For Run 1, we will first assume a value of hsm = 0.08 m. Using (18) and (19), Qss = 0.0285 m3/s and Qus = 0.0140 m3/s, respectively. Using (21), the total calculated flow discharge for this first trial scour depth was Q = 0.0425 m3/s, which was exactly the same as the experimental total discharge. Hence, the calculated maximum scour depth was 0.08 m, which agrees well with the measured scour depth of 0.079 m. The iteration needs to be repeated if Q from (21) is different from the measured value.

3.5. Comparison with Experimental Results

For the present set of experimental data listed in Table 1, the approach mean velocities on the main channel and floodplain were measured using the ADV. It was found by trial and error that mk3 in (19) equals 3.9 to obtain a good prediction for the equilibrium maximum scour depth. The Shields parameter θc = 0.031 for the 0.93 mm sediment, and this is assumed to be applicable to the bed at the deepest location on the scour hole, which is basically flat. The repose angle of the sediments was measured, which was 33° and β = 0.65. 
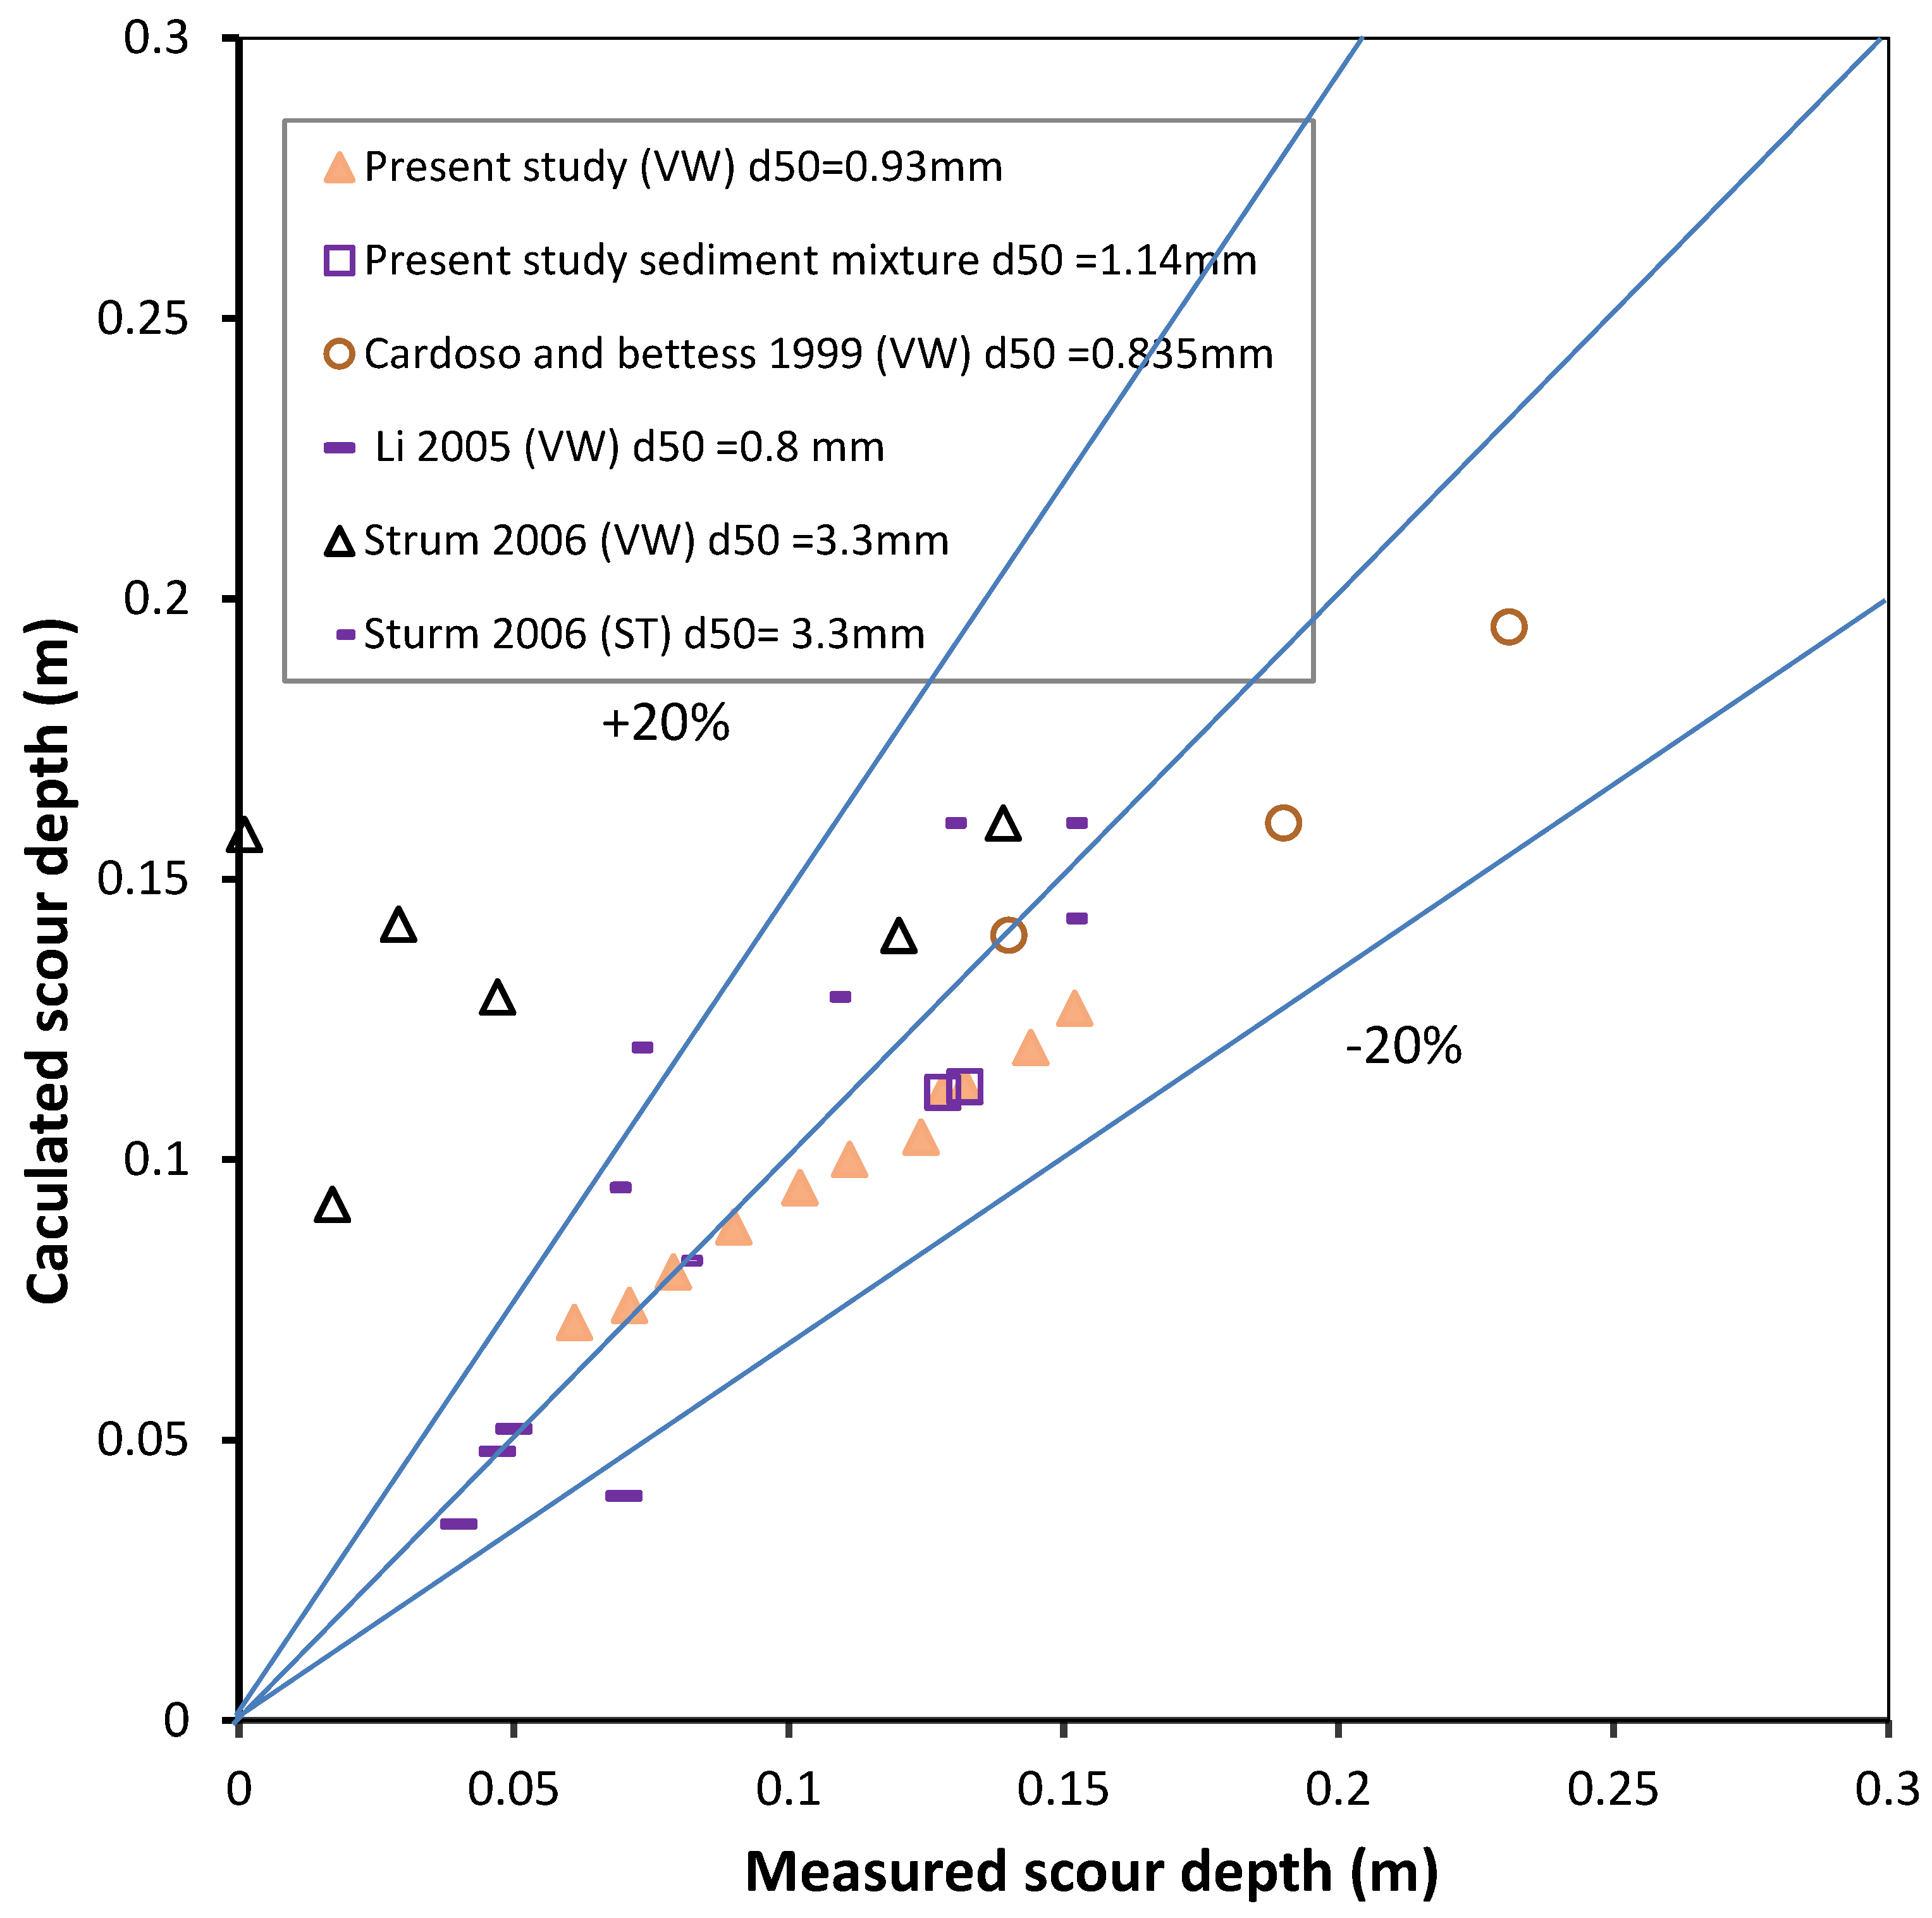
Figure 9 depicts the experimental values against the calculated values for maximum scour depths. The calculated errors ranged from −19% to 14%. The agreement and consistency for the dataset of the 0.93 mm sediment were good. The general trend is that the equations over-predict for the shallow scour holes and under-predict for the deep scour holes for our test range. The reasons for the consistent results are as follows: (1) the same bed material (uniform sediment 0.93 mm) was used; (2) the maximum scour depths were determined from the bed-contours of the scour hole, rather than one-point measurement; (3) the water levels at the approach zone were read using the manometer; and (4) the total flow discharges were recorded using the flow meter. The inconsistency of the dataset might be due to the velocity measurements in the main channel to determine the roughness nmp.
In addition to the present experiments, three data points from Cardoso and Bettess [12] were used to check the model. They conducted three tests of Type III (b) in a 22 m long, 2.44 m wide flume. The bed width of the main channel was 1.56 m, and the floodplain width was 0.8 m. The latter was 0.08 m higher than the main channel bed. The submerged floodplain bank had a slope of 1:1. The sediment size used was 0.835 mm with a sediment gradation of 1.26. The corresponding repose angle was assumed to be 33° as the sediment size was close to that of the present experiments. The equilibrium maximum scour depths given in Table 2 of their paper were measured from the reference level of the floodplain bed. Hence, in order to be consistent with the present definition of the equilibrium scour depths, the data given in their Table 2 were reduced by the floodplain height of 0.08 m. Figure 9 shows the calculated values agree well with their experimental results, with errors ranging from −18% to 9 %, and this is better than the trend of the present experiment dataset. It is noted that the experimental set-ups were slightly different, as we used vertical and fixed main channel walls, whereas Cardoso and Bettess [12] used an inclined and erodible wall. An inclined wall (1:1) may shift the flow much more away from the abutment nose. This is the reason why the predictions for Cardoso and Bettess [12] are slightly higher than the predictions for the present experiments.
Furthermore, we used four data points of a vertical wall from Li [21] to check the model. He conducted five tests of Type III (b) in a 30 m long, 1.2 m wide flume. The bed width of the main channel was 0.8 m. The floodplain (width 0.32 m) was 0.08 m higher than the main channel bed. The submerged floodplain bank had a slope of 1:1. The sediment size used was 0.8 mm with a sediment gradation of 1.37. The corresponding repose angle was assumed to be 34°. The maximum scour depths of this study were given in Table 3. Figure 9 depicts that the agreement between measured and calculated scour depths for the previous study is acceptable. This is probably because the dimensions of flume and sediment size are similar to that of the present study.
Finally, we used six data points of a vertical wall and seven data points of a spill-through (two horizontal; one vertical) from Sturm [17] to check the model. He conducted 13 tests of Type III (b) in a 24.4 m long, 4.2 m wide flume. The bed width of the main channel was 0.55 m. The floodplain (width 3.66 m) was 0.154 m higher than the main channel bed. The submerged floodplain bank had a slope of 2.6 H:1 V. The sediment size used was 3.3 mm with a sediment gradation of 1.3. The corresponding repose angle was assumed to be 33°. The maximum scour depths given in Table 4 of his paper were measured from the reference level of the floodplain bed. Hence, in order to be consistent with the present definition of the equilibrium scour depths, the data given in their Table 3 have been reduced by the floodplain height of 0.154 m. Figure 9 shows that (1) the errors in Sturm’s data range from 13% to 80% for a vertical wall, and from −6% to 28% for spill-through, (2) the calculated values are higher than the measured values of scour depth as the experiments last only for 24 to 65 h, and this period is not enough for scour depth to reach equilibrium. It is observed that, for the same discharge and water depth, the measured scour depths for both the spill-through and vertical wall are close to each other and, in some cases, the measured scour depth for spill-through is higher than that for a vertical wall. In addition, there was a relatively long slope connecting the bed of the main channel and the bed of the flood plain. From the above, we can conclude that (1) the shape factor of abutment has less effect on scour depth in the main channel, and (2) the shape factor of spill-through is the same as that of the vertical wall and is equal to one.

4. Discussion

The analysis above assumed that the profile of velocity is close to the power law, which in turn is an approximation of the log law, for fully turbulent flow in a wide cannel [29]. Whether this is true within the scour hole depends on the influence of the flow divergence or convergence due to the abutment and the shape of the scoured bed. This approximation has been shown to be acceptable within the scour hole [8]. The observations of Ahmed and Rajaratnam [9] showed that the velocity profile matched the standard log low, as is evidenced for the velocity profile at station B in Figure 1 of their paper.
To this end, we have also measured the velocity profiles at the deepest position within the scour hole. The original intention was to investigate the shear stress of bed at the beginning of scouring [20]. It was found the boundary layer thickness increases with the development of scour. Within the boundary layer, the velocity profile obeyed the log-law distribution, as shown in Figure 10. The distribution of velocity was measured in the scour hole after 125 min of scouring action. In the determination of the friction velocity, we found that the theoretical bed datum and the real bed surface level are very sensitive and a few millimeters of error of the velocity measurement heights would yield very significant errors in the friction velocity. We did not measure the velocity profile after the scouring had reached its equilibrium; presumably, the power law approimation should still hold at that stage.
From Figure 10, it can be observed that the friction velocity was 0.0346 with the von Karman κ = 0.41. The Shields parameter θ after 125 min of scouring was reduced to 0.0794, which is 2.56 times the threshold θc of 0.031, but much smaller than at the flow approach section, which was 4 to 5 times the threshold θc. The value of the constant Bs was 2.98 in the log velocity profile of u u = 1 κ ln z k s + B s , which was smaller than the conventional value of 8.5 for the 2D flow. The deviation of B may be caused by an increase in the apparent roughness and the streamline curvature in the scour hole.
In the present model, it is only necessary to know the term mk3 in (19). From a comparison of the calculated and experimental scour hole depths, we found mk3 = 3.9. Depending on the types of bedform, m and n in (10) are not necessarily constant, but vary from 3.2 to 7.66 and from 1/12 to 1/3, respectively [8,30]. Since k3 may likely not be equal to one, m for the flow in the scour hole would not be the same as that for the 2D open channel flow. Further work is needed to obtain the value of m in scour holes. However, the present model does not need the individual value of k3 and m.
The model uses the discharge conservation (21) for closure of the equations and the power law to calculate the velocities in the approach section and the deepest scour cross section. Supposing the velocity in the scour hole is over-valued, a deeper hole would be obtained. As mentioned previously, the water level at the section of the scouring hole basically remains the same. On the other hand, a deeper scour hole requires a smaller mean velocity because of the restraint of discharge conservation. This damping would guarantee the convergence of the model. Finally, it should be noted that the inclined main channel wall may cause underestimated of scour depth since this wall deflected flow away from abutment nose.

5. Conclusions

A laboratory study was conducted to study the bed scouring near a bankline abutment in a 19 m long compound flume. The bed profile at the abutment section can be divided into the scour hole part and the un-scoured part. The scour bed profile can be approximated using a power function.
The water surface levels around the abutment were measured during the scouring process. It was found that the water level increased slightly due to the abutment construction, but this change can be ignored if it is compared to the flow depth. The measured water level remained almost unchanged throughout the scouring process.
An analytical method has been suggested to predict the equilibrium scour depth for bankline abutment in compound channels. Comparison with measured data from previous studies has shown that the calculated scour depths using the proposed method agreed well with the experiment results.

Author Contributions

Conceptualization, A.A.A., S.Y.L. and J.R.K.; methodology, A.A.A. and S.Y.L.; software, S.Y.L. and J.R.K.; validation, A.A.A. and S.Y.L.; formal analysis, A.A.A., S.Y.L. and J.R.K.; investigation, S.Y.L. and J.R.K.; resources, S.Y.L. and J.R.K.; data curation, S.Y.L. and J.R.K.; writing—original draft preparation, A.A.A. and S.Y.L.; writing—review and editing, S.Y.L. and J.R.K.; visualization, S.Y.L. and J.R.K.; supervision, A.A.A., S.Y.L. and J.R.K.; project administration, S.Y.L. and J.R.K.; funding acquisition, J.R.K. All authors have read and agreed to the published version of the manuscript.

Funding

This research was funded by [Nazarbayev University Research Fund] grant number [20122022FD4108]. The authors are grateful for this support. The authors also would like to thank Nanyang Technological University for financial support during this study.

Data Availability Statement

Materials and data used in the present paper are available under request to the corresponding author.

Acknowledgments

This research was supported by the Nazarbayev University Research Fund under Grant No. 20122022FD4108. The authors are grateful for this support. The authors also would like to thank Nanyang Technological University for the financial support during this study.

Conflicts of Interest

The authors declare no conflicts of interest.

Abbreviations

The following symbols are used in this paper:
ρfluid density
αrepose angle of the sediment
θccritical Shields parameter
τcdcritical shear stress
ρssediment density
σ g standard deviation of sediment
βslope of the bed profile
Bchannel width
d*representative sediment size on the scoured bed
d50sediment size of which 50% is finer
d15.9sediment size of which 15.9% is finer
d84.1sediment size of which 84.1% is finer
d95sediment size of which 95% is finer
dsscour depth
fcorrection factor
gacceleration of gravity
hflow depth
hsmscour depth measured from the initial level of sediments in main channel
k3a coefficient
ksequivalent roughness size to 2d50
nManning’s roughness coefficient
Qtotal flow discharge
Qmdischarge of main channel
Qssdischarge related to the scour hole
Qusdischarge associated with the un-scoured bed
Rhydraulic radius
Subfix: fp, mprelated to floodplain and main channel at the approach section, respectively
Subfix: sRepresents the scour hole
Umean velocity
u*friction velocity
uccritical mean velocity for sediment motion
zdistance from the bed
κvon Karman constant for clear water flow (=0.41)

References

  1. Abdelaziz, A.A.; Lim, S.Y. Scour hole characteristics around abutment in compound channel. In Proceedings of the World Environmental and Water Resources Congress, Sacramento, CA, USA, 21–25 May 2017; pp. 389–401. [Google Scholar] [CrossRef]
  2. Abdelaziz, A.A.; Lim, S.Y. Effect of abutment aspect ratio on clear water scour in floodplain. River Res. Appl. 2020, 36, 148–160. [Google Scholar] [CrossRef]
  3. Melville, B.W. Local scour at bridge abutments. J. Hydraul. Eng. 1992, 118, 615–631. [Google Scholar] [CrossRef]
  4. Richardson, E.V.; Harrison, L.J.; Richardson, J.R.; Davis, S.R. Evaluating Scour at Bridges, 2nd ed.; Rep. No. HEC-18; Federal Highway Administration: Washington, DC, USA, 1993. [Google Scholar]
  5. Laursen, E.M. An analysis of relief bridge scour. J. Hydraul. Div. 1963, 92, 93–118. [Google Scholar] [CrossRef]
  6. Gill, M.A. Erosion of sand beds around spur-dikes. J. Hydraul. Eng. 1972, 98, 1587–1602. [Google Scholar] [CrossRef]
  7. Kwan, R.T.F. A Study of Abutment Scour; Rep. No. 451; University of Auckland: Auckland, New Zealand, 1989. [Google Scholar]
  8. Lim, S.Y. Equilibrium clear-water scour around an abutment. J. Hydraul. Eng. 1997, 123, 237–243. [Google Scholar] [CrossRef]
  9. Ahmad, F.; Rajaratnam, N. Observations on flow around bridge abutment. J. Eng. Mech. 2000, 126, 51–59. [Google Scholar] [CrossRef]
  10. Sturm, T.W.; Janjua, N.S. Clear-water scour around abutments in floodplains. J. Hydraul. Eng. 1994, 120, 956–972. [Google Scholar] [CrossRef]
  11. Kouchazadeh, S.; Townsend, R.D. Maximum scour depth at bridge abutments terminating in the floodplain zone. Can. J. Civ. Eng. 1997, 24, 996–1006. [Google Scholar] [CrossRef]
  12. Cardoso, A.H.; Bettess, R. Effects of time and channel geometry on scour at bridge abutments. J. Hydraul. Eng. 1999, 125, 388–399. [Google Scholar] [CrossRef]
  13. Melville, B.W.; Yang, Y.; Xiong, X.; Ettema, R.; Nowroozpour, A. Effects of streamwise abutment length on scour at riprap apron-protected setback abutments in compound channels. J. Hydraul. Eng. 2020, 147, 04021003. [Google Scholar] [CrossRef]
  14. Abdelaziz, A.A.; Lim, S.Y. Equilibrium scour hole size at setback abutments with varied aspect ratios in floodplains. J. Hydro-Environ. Res. 2022, 42, 21–30. [Google Scholar] [CrossRef]
  15. Melville, B.W. Bridge abutment scour in two-stage channels. J. Hydraul. Eng. 1995, 121, 863–868. [Google Scholar] [CrossRef]
  16. Lim, S.Y.; Yu, G. Study on abutment scour in two-stage channel. In Proceedings of the XXIX IAHR Congress—21st Century: The New Era for Hydraulics Research and Its Application, Beijing, China, 16–21 September 2001; Volume II. Theme D. [Google Scholar]
  17. Sturm, T.W. Scour around bankline and setback abutments in compound channels. J. Hydraul. Eng. 2006, 132, 21–32. [Google Scholar] [CrossRef]
  18. Knight, D.W. Flow mechanisms and sediment transport in compound channels. Int. J. Sediment Res. 1999, 14, 217–236. [Google Scholar]
  19. Dongol, D.M.S. Local Scour at Bridge Abutments; Rep. No. 544; University of Auckland: Auckland, New Zealand, 1994. [Google Scholar]
  20. Yu, G.; Lim, S.Y.; Tan, S.K. Flow and scouring in main channel due to abutments. In Proceedings of the First International Conference on Scour of Foundations, College Station, TX, USA, 12–17 November 2002; pp. 785–794. [Google Scholar]
  21. Li, H. Countermeasures against Scour at Bridge Abutments. Ph.D. Thesis, Michigan Technological University, Houghton, MI, USA, 2005. [Google Scholar]
  22. Shiono, K.; Knight, D.W. Mathematical model of flow in two or multi stage straight channels. In Proceedings of the International Conference on River Flood Hydraulics, Wallingford, England, 17–20 September 1990; White, W.R., Ed.; Wiley & Sons: New York, NJ, USA; pp. 229–238, Paper G1. [Google Scholar]
  23. Yu, G.; Knight, D.W. Geometry of self-formed straight threshold channels in uniform material. Proc. Inst. Civ. Eng. Water Manag. 1998, 130, 31–41. [Google Scholar] [CrossRef]
  24. Ackers, P. Hydraulic design of two stage channels. Proc. Inst. Civ. Eng. Water Manag. 1992, 96, 247–257. [Google Scholar] [CrossRef]
  25. Lim, S.Y.; Nugroho, J. Observations on flow field around an abutment in a two-stage channel. In Proceedings of the 2nd International Conference on Scour and Erosion, Singapore, 14–17 November 2004; pp. 156–164. [Google Scholar]
  26. Laursen, E.M. Scour at Bridge Crossings; Bulletin No. 8; Iowa Institute of Hydraulic Research, State University of Iowa: Iowa City, IA, USA, 19 August 1958; pp. 179–197. [Google Scholar]
  27. Chen, C.L. Unified Theory on Power Laws for Flow Resistance. J. Hydraul. Eng. 1991, 117, 371–389. [Google Scholar] [CrossRef]
  28. Breusers, H.N.C.; Raudikiv, A.J. Scouring. In Hydraulic Structure Manual; No. 2; Balkema: Rotterdam, The Netherlands, 1991. [Google Scholar]
  29. Chien, N.; Wan, Z. Mechanics of Sediment Transport; ASCE Press: Reston, VA, USA, 1999. [Google Scholar]
  30. Chitale, S.V. Discussion of ‘Resistance relationship for alluvial channel flow’ by R.J. Garde and K.T. Ranga Raju. J. Hydraul. Div. ASCE 1967, 93, 106–108. [Google Scholar]
Figure 1. Front view of the compound flume (scale distorted).
Water 16 01479 g001
Figure 2. Cross section of flume at abutment location.
Water 16 01479 g002
Figure 3. Layout of stations for water level measurements.
Water 16 01479 g003
Figure 4. Variations in water level during bed scouring process for Run 1.
Water 16 01479 g004
Figure 5. Bathymetry of scour hole (contour line in cm) in main channel for Run 4 (Q = 40.8 L/s, hmp = 20.75 cm, hfp = 5.75 cm, hsm = 7.1 cm).
Water 16 01479 g005
Figure 6. Armored bed in the scour hole for Run 7.
Water 16 01479 g006
Figure 7. Sketch of the lateral bed profile of scour hole in a compound channel.
Water 16 01479 g007
Figure 8. Dimensionless lateral scour profiles for different flow discharges.
Water 16 01479 g008
Figure 9. Experimental scour depths against the calculated values predicted using measured approach velocities.
Water 16 01479 g009
Figure 10. Velocity profile at the deepest location within the scour hole after 125 min of scouring.
Water 16 01479 g010
Table 1. Summary of the experimental data.
RunQ (L/s)hmp (cm)hfp (cm)Ump (m/s)Ufp (m/s)d50 (mm)Measured
hsm (cm)
Calculated
hsm (cm)
Ump/UcUfp/Uc
142.520.95.90.2490.1950.937.980.6020.471
247.521.36.30.2650.2150.9310.29.50.640.519
338.920.55.510.2340.1830.936.17.10.5670.443
440.820.85.80.2420.1860.937.17.40.5850.45
54521.16.10.2570.2060.939.08.80.6210.498
657.222.47.40.2980.2291.1412.811.20.6230.479
76022.87.80.3110.2241.1413.211.30.6470.466
86022.87.80.3110.2240.9315.212.70.7420.534
95522.27.20.2940.2210.9313.211.30.7050.53
1057.222.57.50.2990.2280.9314.4120.7150.545
115021.76.70.2760.2110.9311.1100.6640.507
1252.522.07.00.2860.2140.9312.410.40.6860.513
Note: Q = total flow discharge, hmp = flow depth of the main channel, hfp = flow depth of the floodplain, Ump = mean velocity of the main channel, Ufp = mean velocity of the floodplain, uc = critical mean velocity for sediment motion, d50 = sediment size of which 50% is finer and hsm = maximum scour depth.
Table 2. Experimental data (bank line abutment) of Cardoso and bettess [12].
Runhfp (cm)Ufp (m/s)d50 (mm)ds (cm)
13.40.2660.83522
25.50.2930.83527
38.40.2670.83531.1
Table 3. Experimental data (bank line abutment) of Li 21.
RunQ (L/s)hfp (cm)hmp (cm)Ump (m/s)d50 (mm)ds (cm)
136.64.513.20.3420.84
233.51.29.90.4210.85
338.75.213.20.3610.87
435.33110.3970.84.7
Table 4. Experimental data (bank line abutment) of Sturm [17].
RunQ (L/s)hfp (cm)Qm/Qd50 (mm)ds (cm)
VW149.62.260.423.317.1
VW 256.52.50.363.320.1
VW 367.13.050.313.329.3
VW 456.92.50.263.315.5
VW 556.92.50.313.318.3
VW 656.72.50.323.327.4
ST149.32.260.4533.323.5
ST255.52.50.3783.322.6
ST363.72.860.3493.330.5
ST469.73.20.3213.330.5
ST549.32.260.423.322.2
ST656.92.50.363.326.2
ST769.73.170.3153.328.3
Disclaimer/Publisher’s Note: The statements, opinions and data contained in all publications are solely those of the individual author(s) and contributor(s) and not of MDPI and/or the editor(s). MDPI and/or the editor(s) disclaim responsibility for any injury to people or property resulting from any ideas, methods, instructions or products referred to in the content.

