Article

Optimizing Water Distribution in Transboundary Rivers Based on a Synthesis–Dynamic–Harmonious Approach: A Case Study of the Yellow River Basin, China

1
School of Environmental Science and Engineering, Tianjin University, Tianjin 300000, China
2
School of Water Conservancy Engineering, Zhengzhou University, Zhengzhou 450001, China
3
Zhengzhou Key Laboratory of Water Resource and Environment, Zhengzhou 450001, China
4
College of Humanities and Law, Beijing University of Chemical Technology, Beijing 100029, China
*
Author to whom correspondence should be addressed.
Water 2023, 15(6), 1207; https://doi.org/10.3390/w15061207
Submission received: 21 February 2023 / Revised: 14 March 2023 / Accepted: 17 March 2023 / Published: 20 March 2023

Abstract

:
It has been difficult to revise and adjust the water distribution of the Yellow River in 1987 (1987 water distribution scheme). By gathering data and studies from previous literature, this paper summarized some water distribution ideas, principles and rules in transboundary rivers. We proposed the “synthesis–dynamic–harmonious” water distribution method (SDH), and applied it to the actual conditions of the Yellow River basin. Through the SDH method, we calculated a new scheme for water distribution in the Yellow River and analyzed the results. The key findings of this study are summarized below. Firstly, the water distribution of transboundary rivers required the establishment of advanced water distribution ideas. Secondly, the proposed water distribution method took into account a variety of factors: with the change in distributable water volume, the same ratio changes and meets the minimum water demand and water efficiency constraints. Thirdly, the 1987, the water distribution scheme needed some adjustment. Fourthly, under the new Yellow River basin water distribution scheme (“19ZQT” water distribution scheme), Shandong, Inner Mongolia, and Henan account for 50% of the total water distribution. Sichuan accounts for only 0.3% of the total. Compared with the 1987 water distribution scheme, Hebei and Tianjin reduced the amount of water allocated by 51.2%, while Shaanxi increased it by 24.89%. In this paper, considering the changes in the total distributable water volume, the new Yellow River water distribution scheme (“19ZQT” water distribution scheme) assumed water distribution of 37 billion m3 and 30 billion m3, upon which calculations were performed. This study should provide a scientific and reasonable scheme for water distribution of transboundary rivers, and rational utilization of water resources. It should lay a solid foundation for the high-quality development of the Yellow River basin.

1. Introduction

Due to excess water demand, water resources have become a cause in conflicts between different regions and countries, leading to various cross-border river water conflicts [1,2,3]. On 18 September 2019, the Government of the People’s Republic of China mentioned the importance of considering the ecological protection and high-quality development of the Yellow River basin as a part of national strategy of China, and proposed the implementation of total water consumption and double-intensity control. However, the large population of the Yellow River basin equates a large demand for water resources, and the per capita water resources are relatively small. As a result, water resources are scarce. At the same time, the contradiction between the supply and demand of water resources has increased, and the water-saving potential has decreased [4,5]. To guarantee the water demand of all areas along the line and solve the contradiction in water resources, it is essential to further optimize the distribution of water resources. Doing so could help prevent rivers from drying up and the occurrence of flood disasters, while ensuring the high-quality development of the Yellow River basin.
Transboundary rivers have invariably been an issue of international concern. In the 21st century, scholars from various countries have successively explored and studied transboundary rivers in various fields. For instance, Kallioras et al. [6] explored and studied the legislative framework governing transboundary river basins in the European geographic regions. Sneddon and Fox [7] studied the concept of water politics based on the conflicts in the transboundary waters of the Mekong River. These earlier studies primarily focused on macroscopic research. In terms of policy research, Zhong et al. [8] analyzed the cost–benefit situation faced by stakeholders as subjects of the mutual game in the process of institutional change of water division policy, to better improve the system of the watershed water distribution. Shams et al. [9] proposed a framework for cooperation through geographical, hydro-logical, historical, institutional, and political aspects, emphasizing benefit sharing as a principle that transcends water needs and rights. Sheng et al. [10] studied the impact of inter-basin water transfer (IBWT) policies on water use technical efficiency (WUTE). It can be seen that policy research is an important means to further improve the efficiency of water resources utilization and scientific distribution. Some of the recent studies investigated the management of water resources of transboundary rivers. For example, Mylopoulos and Kolokytha [11] suggested that the lack of comprehensive methods, legal agreements, and administrative flaws render transboundary cooperation and management difficult. From an in-depth analysis of Africa’s cross-border river basin management system, Chikozho [12] believes that the capabilities of prominent players are the key to integrated water resource management activities in transboundary rivers. In other research facets, Rai et al. [13] adopted the fuzzy synthetic evaluation technology to perform a risk assessment on international transboundary rivers. Cerkasova et al. [14] established a modeling framework for flow, sediment, and nutrient loads in large transboundary river basins. In summary, the research on transboundary rivers involving all facets has received much attention of the international research community, since water distribution is also the key to transboundary rivers. Hence, this has always been a popular research topic.
With the improvement of science and technology and the continuous deepening of research, the water distribution of transboundary rivers has become more complex. The factors that need to be considered gradually increase, which makes the water distribution work more challenging. However, through the continuous concentrated research of scholars from all walks of life, there are more research results on the distribution of water resources in transboundary rivers. By adopting the Shapley value, Gateley point, and Nash-Hansani solution, three cooperative game theory methods, Li et al. [15] investigated the optimal distribution method of water resources in transboundary rivers. Through combining relevant laws with technical methods for allocating water resources in transboundary rivers, Avarideh et al. [16] quantified the provisions of the convention on fair and reasonable water sharing. By combining evolutionary games and dynamic system models, Yuan et al. [17] analyzed the shared water problem and predicted the equilibrium results of different strategic scenarios. By integrating economic, social, and ecological benefits into a mathematical model for the rational allocation of water resources, Li et al. [18] attempted to realize the rational allocation of water resources under the ecological priority model. Dadmand et al. [19] applied the sustainability index to the optimization model. Despite numerous published works about water distribution in transboundary rivers, there were few summaries on the theoretical aspects (e.g., water distribution criteria and water distribution principles). Most previous studies concentrated on the technical methods of water distribution, while no unified standard for water distribution ideas was presented.
In 1987, China put forward the Yellow River water distribution scheme for the first time, which effectively guaranteed the safety of people’s lives and properties. At the same time, many scholars have also started to research water distribution in the Yellow River. In terms of water volume research, Yang et al. [20] determined the environmental flow requirements for comprehensive water distribution by determining the natural and artificial water consumption of the Yellow River basin. Based on a coupled system between man and nature, Li et al. [18] comprehensively analyzed the water production in the Yellow River basin. In terms of influencing-factor analysis, Wei et al. [21] suggested that local people’s environmental attitude and socio-economic status usually affected the level of flow distribution. In terms of optimizing water distribution, Di et al. [22] proposed a multi-objective optimal water distribution model based on fluid mechanics, energy theory, and dynamic differential games, in order to coordinate and optimize the ecological environment, economic, and social values. Jia et al. [23] studied a strategic water distribution scheme, which can allocate more water indicators to the upper and middle reaches of the Yellow River.
There are still several problems in the distribution of water resources in transboundary rivers. First, the current theoretical research foundation of water distribution in transboundary rivers is weak, and there is a lack of detailed rules for the quantification of water distribution schemes, and universal water distribution techniques and methods. Second, the 1987 water distribution scheme can no longer meet the current water-use pattern. Therefore, it is necessary to formulate a new Yellow River water distribution scheme that is more adaptable.
To address the problems mentioned above, the main research contents of this paper include (a) research on the theoretical basis of water distribution in transboundary rivers; (b) research on quantitative methods of water distribution in transboundary rivers; (c) further research on the Yellow River water distribution scheme. There are several innovations in this paper. First, we combine the concept of harmony, and put forward a theoretical system of water distribution in transboundary rivers. Second, based on the theoretical research on water distribution of transboundary rivers, a “synthesis–dynamic–harmonious water distribution method” (SDH) is proposed. Third, we present the calculations of the new Yellow River water distribution scheme (called the “19ZQT” water distribution scheme) for scenarios of 37 billion m3 and 30 billion m3 of water allocation. The rationality of the scheme is analyzed and demonstrated. This manuscript attempts summarize the theories and technical methods of water distribution in transboundary rivers, assist the formation of systematic water distribution ideas and standards, and provide a basis for water distribution in transboundary rivers across regions and even countries.

2. Materials and Methods

2.1. Theoretical System of Water Distribution in Transboundary Rivers

Transboundary-river water distribution problems are widespread among Chinese rivers and international rivers. The crux of the problem is that the limited water resources cannot satisfy the high demands of various regions. At present, there are two theories about the distribution of water resources in transboundary rivers, i.e., absolute territorial sovereignty and absolute territorial integrity [24]. However, these theories only consider the interests of their own countries and can lead to a multitude of contradictions. Consequently, this is not a feasible water distribution. Whilst some domestic scholars have analyzed river water distribution situations and water distribution adaptability [25,26], they have not studied new water distribution schemes. Despite the abundance of studies on the water distribution ideas of transboundary rivers in China and abroad, a universal theoretical system for the water distribution in transboundary rivers has not yet been established.
This paper summarizes a set of general theories based on water distribution ideas, principles, rules and methods. At the same time, these theories are applied to the water distribution problem of transboundary rivers in the Yellow River basin. In this way, it is possible to obtain a more scientific and reasonable water distribution scheme, and achieve the high-quality development of the Yellow River basin.

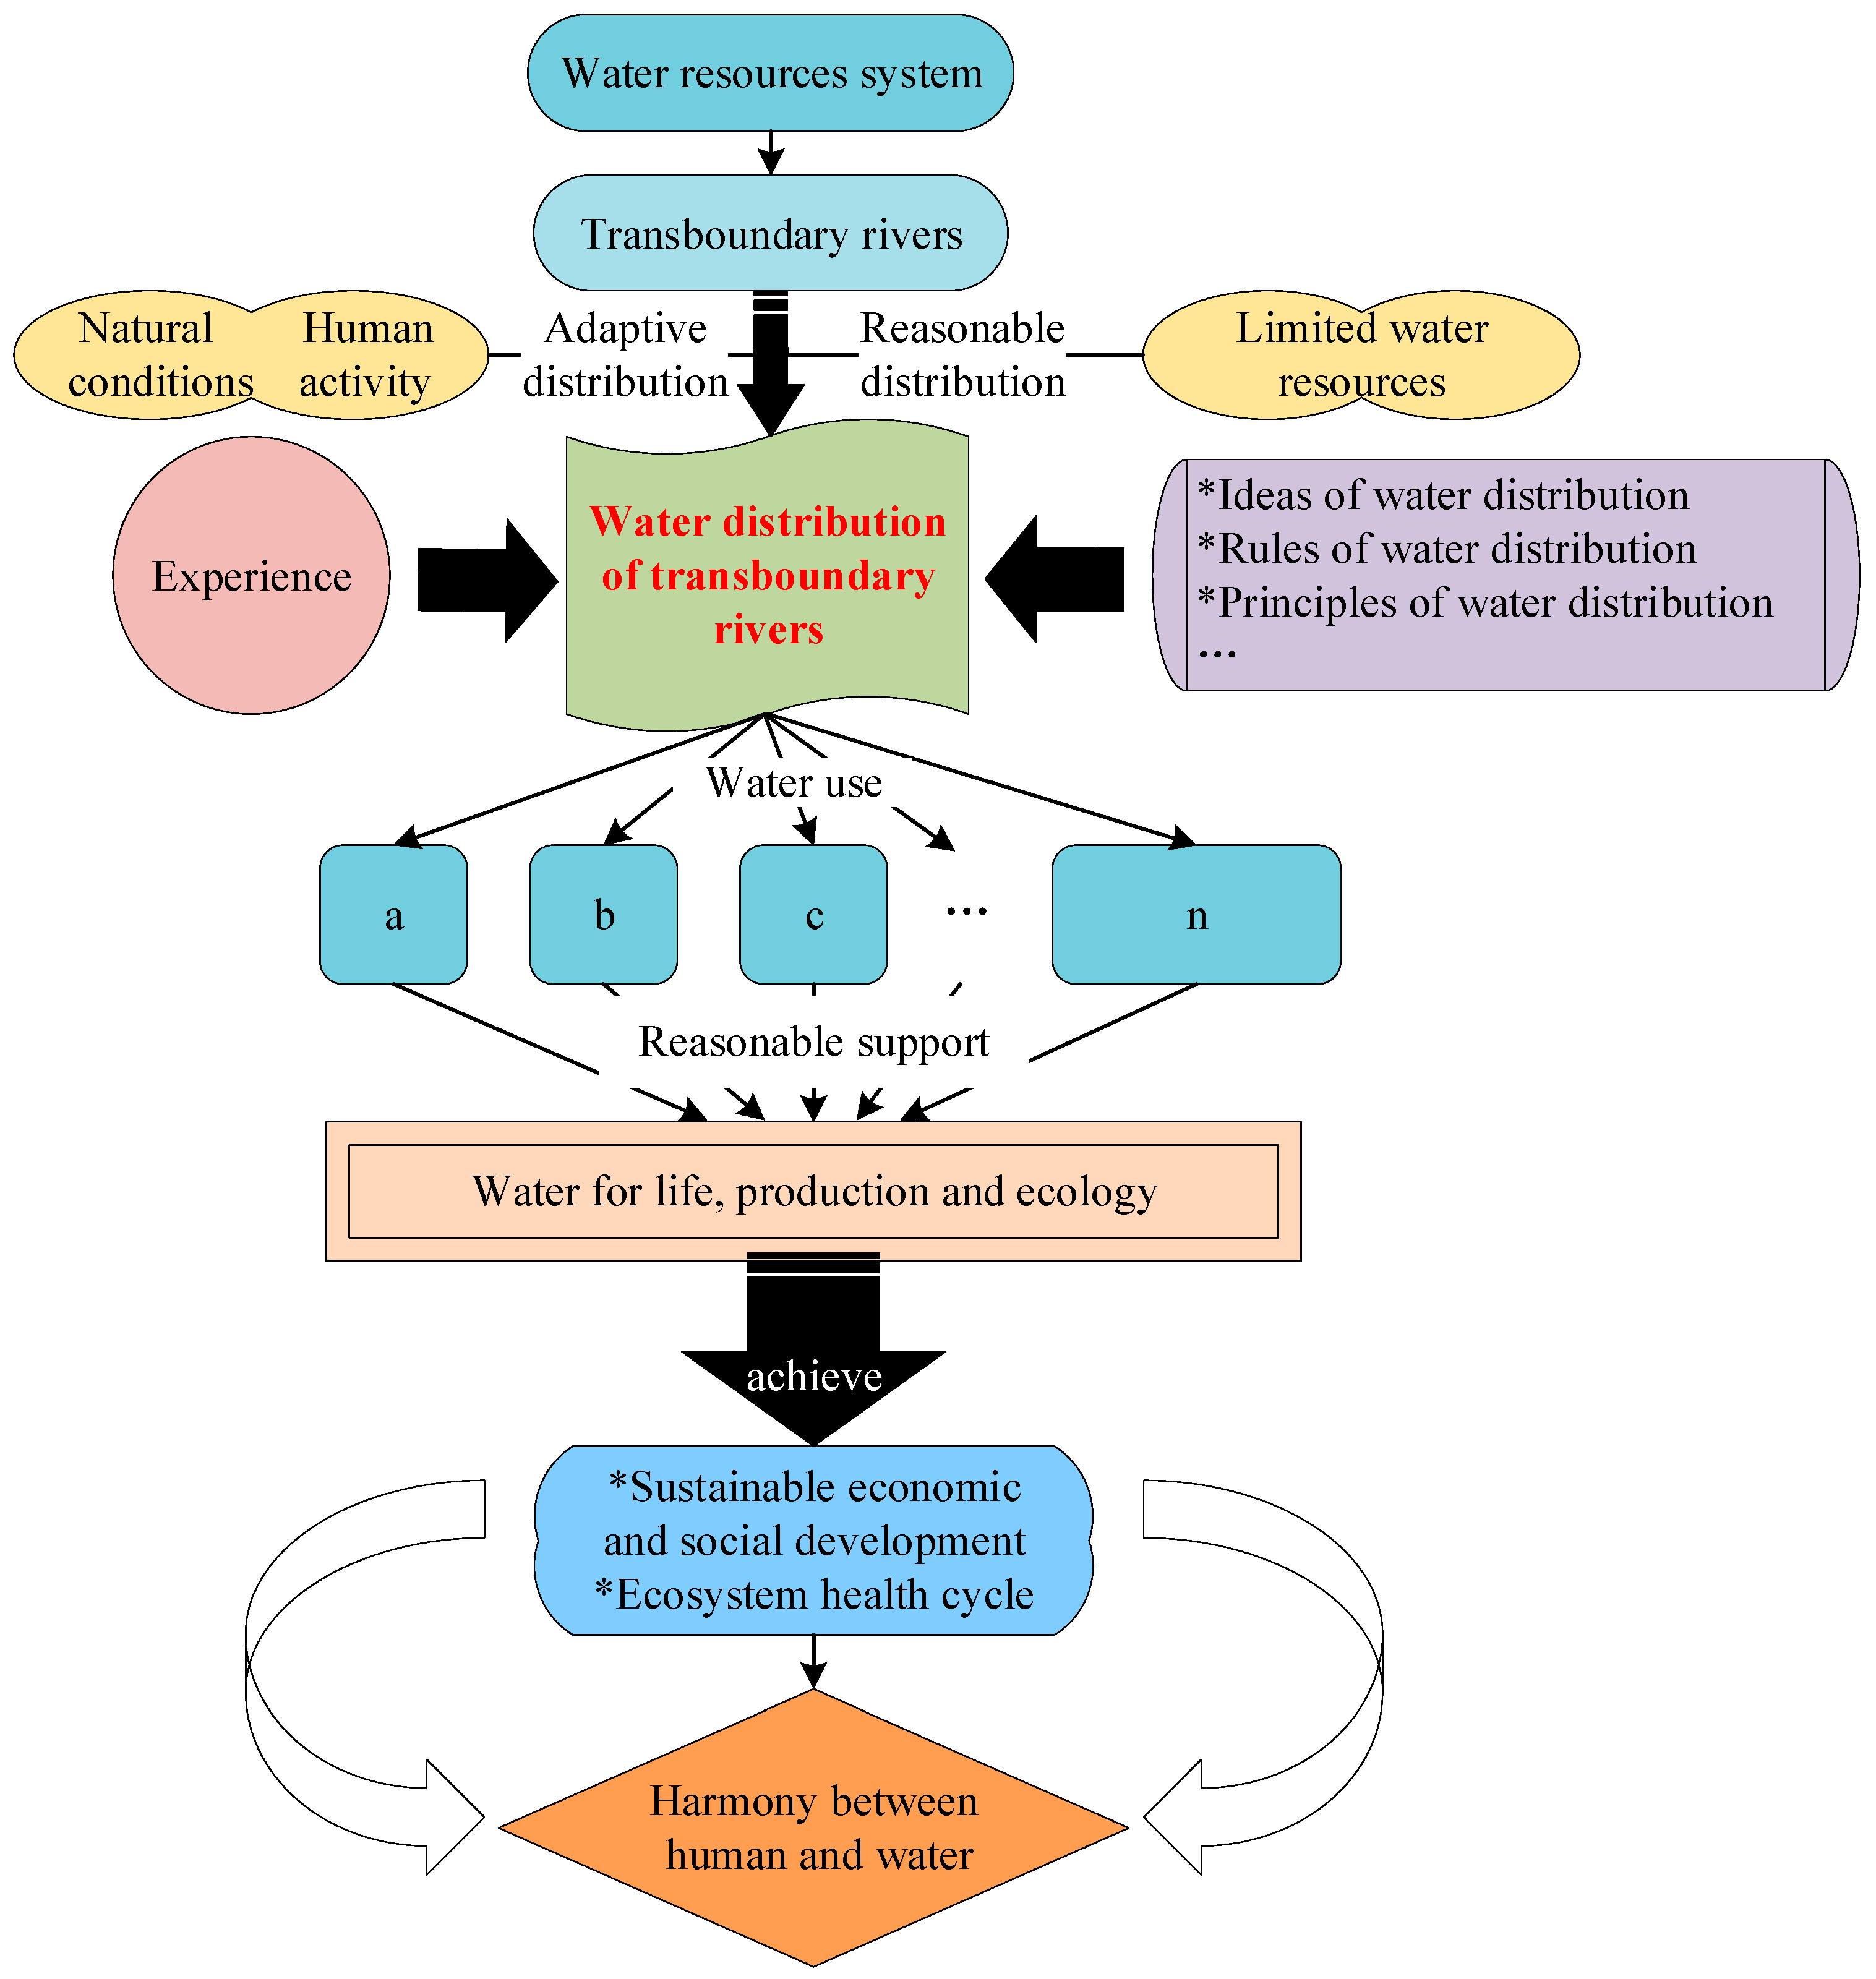
2.1.1. Framework of the Water Distribution System for Transboundary Rivers

A description of the main content (excluding the specific details) of the cross-border river water distribution theory is presented in Figure 1. Due to different analysis angles, there may be a specific crossover and causality.
(1) Research object.
The research objects are the regions and countries (i.e., water distribution units) that use water within a particular basin. For the water distribution of the Yellow River, Hebei and Tianjin are not within the basin, but they have water distribution indicators. Therefore, according to the actual situation, the research object can be expanded to the nine provinces of the Yellow River basin, and Tianjin and Hebei.
(2) Objectives.
This article considers a variety of influencing factors and incorporates new water diversion ideas and principles. According to the water distribution criteria, the scientific water distribution theory and methods are used to calculate an optimized water distribution scheme for transboundary rivers. In this way, the supply of water resources can be matched with the socio-economic development.
(3) Involvement in the field.
The research field of water distribution in transboundary rivers involves the human–water system (i.e., economic field, social field, water resource field). Correspondingly, there is a need to consider economic factors, social factors, and water resources. In addition, population, GDP, water resources, and water efficiency are also the main factors to achieve systematic regulation of water balance.
(4) Policies and laws.
A sound policy and legal system for water distribution in transboundary rivers is a powerful guarantee for regulating water distribution. Regarding water distribution in international rivers, the widely implemented international water laws include the Helsinki Regulations, enacted in 1966, and the Law of the Non-navigational Use of International Waterways in 1997. There is also a corresponding legal basis in the country. For instance, the Water Law, the Interim Measures for Water Distribution issued in 2007, and the Regulations on Water Dispatching of the Yellow River and other documents, provide some guidance to achieve fair water distribution.
(5) Water distribution ideas.
With the continuous accumulation of water control experience, more new water-control ideas have emerged in the new era. These ideas include bearable water distribution, harmonious water distribution, fair water distribution, efficient water distribution, shared water use, and system analysis. They form an essential part of the theory of water distribution in transboundary rivers.
(6) Water distribution principles.
The water distribution of transboundary rivers is a kind of human intervention in water resources, and must follow the laws of nature and social development. Therefore, in combination with socio-economic development and ecosystem health, we discuss the general principles and internal correlations of water diversion from the perspectives of water distribution phenomena, water distribution ideas, and water distribution purposes.
(7) Water distribution rules.
The water distribution rules are a series of water distribution instructions, formulated under the guidance of water distribution ideas. They guide the implementation of the water distribution method and have an important practical significance. They must be theoretically sound and applicable in practice. Therefore, water distribution of transboundary rivers needs to refer to existing experiences and reach a consensus after repeated consultations with involved countries or regions.
(8) Theoretical method.
Theoretical methods refer to the existing theoretical methods applied to water diversion in transboundary rivers, including guiding theoretical methods and basic theoretical methods. The guiding theories cover the theory of harmony, harmony between humans and water, and the theory of sustainable utilization of water resources. The basic theoretical methods include harmonious balance theory, optimized technical methods, simulation forecasting methods, and harmonious control methods.

2.1.2. Water Distribution Ideas

(1) Bearable water distribution.
The first prerequisite for water distribution in transboundary rivers is to determine the carrying capacity of the water resources system. Therefore, “carrying capacity” is the central guiding ideology of water distribution [27]. In a sense, the development and utilization of water resources within the carrying range is the most basic requirement for water distribution in transboundary rivers. At the same time, it is necessary to coordinate the balance between the use of water resources and the virtuous cycle of the ecosystem.
(2) Harmonious water distribution.
The complex relationship and prominent contradictions between people and water need to be resolved by realizing the concept of harmony. The harmony theory must be reflected in the reasonable distribution of river water volume [28]. It is necessary to allocate water resources rationally, with fixed water production and appropriate development of water resources as the core. In addition, the matching of development and demand should be realized, and the joint promotion and coordinated development of the economy, society, and ecological environment should be realized [29].
(3) Fair water distribution.
The water distribution in transboundary rivers is a highly complex matter and must adhere to the principle of fair and just distribution [30,31]. The fair water distribution mentioned here is not equal to water distribution, but is based on various factors. In adherence with the idea of fair water distribution, the purpose is to ensure that all coastal areas develop and utilize water resources of transboundary rivers fairly and reasonably. This idea suggests the need to avoid overexploitation of water resources, and also promotes the efficient use of water resources.
(4) Efficient water distribution.
The high-efficiency water diversion should achieve high efficiency and operability in the actual work of water distribution, and promote the efficient use of water resources [32,33]. Firstly, the method should be scientific and reasonable, and it should be universal. In addition, it is necessary to configure the corresponding water distribution system software to assist the implementation and promotion of water distribution work. Secondly, by taking water resources as rigid constraints, there is a need to fully strengthen water conservation, and analyze the water demand of various regions. Finally, it is necessary to improve the matching between water distribution and water use. The distribution index should not deviate significantly from the actual water use, to maintain a continuous and stable water supply.
(5) Shared water.
“Publicly available” is one of the essential characteristics of water resources. All regions along the coast of a transboundary river enjoy the right to develop and utilize the river’s water resources. Transboundary rivers do not belong to a specific region or country. Therefore, the use of water resources in transboundary rivers must adhere to the idea of sharing water resources and maximizing all parties’ interests under the condition of limited water resources [34].
(6) System analysis.
Resource management is a complex system of engineering. To achieve the reasonable distribution of water resources, the economy and practicability should be systematically and comprehensively considered in terms of the available water in the whole river basin, the runoff of main and tributary streams, water intake projects and uses, development scale, and long-term scheme.

2.1.3. Water Distribution Principles

The basic principles of water distribution in transboundary rivers (Figure 2) are analyzed as follows:
(1) The river water resources system is the object of water distribution, and its water resources are limited. However, water distribution is essential to satisfy the water demands of different regions, industries or sectors.
(2) The problem of water distribution in transboundary rivers is complicated, and it is necessary to adhere to the scientific water distribution idea and follow specific water distribution rules. In particular, it is necessary to learn from the successful experience of water distribution in China and abroad, and perform comprehensive water distribution according to the actual conditions.
(3) Since the water resource system is greatly affected by climate change and human activities, it should account for environmental changes and adaptations.
(4) By implementing the water distribution scheme, rational use of water for livelihood, production, and ecology can achieve sustainable economic and social development, a healthy cycle of ecosystems, and ultimately realize the goal of harmony between humans and water.

2.1.4. Water Distribution Rules

Through careful consideration of various factors and experience, the primary water distribution rules are summarized as follows:
(1) Water distribution according to the original water distribution scheme.
The current water distribution scheme is ongoing. After expert argumentation and comprehensive coordination, the scheme is based on the early stage in-depth and detailed work. It has withstood the test of history for a long time and continues to play a huge role. Therefore, the implementation of the current water distribution scheme can meet the demand to a certain extent.
(2) Changes at the same rate as the amount of distributable water changes.
There are certain inter-annual variations in river runoff, and some rivers might exhibit reduced runoffs due to climate change and human activities. To ensure the rational use of water resources and meet the needs of ecological base flow, changes in the amount of water that can be allocated should be considered. The water distribution scheme of transboundary rivers can be calculated based on the average water year. Then, the adjustment coefficient can be determined relative to the average water year according to the change of the incoming water runoff. Next, the same proportion can be calculated.
(3) Minimum water demand and water efficiency constraints considered.
To protect the healthy circulation of the river ecosystem, the minimum water demand of the river should be considered to meet the water demand of the ecological environment. In addition, people’s basic survival needs must be considered, and the amount of water allocated should be higher than the reasonable minimum water requirement. At the same time, we should also enhance water use efficiency, eliminate waste, and strictly control within the red water line.
(4) Water according to the current situation, and considering the future use of water and water distribution.
The current water distribution of transboundary rivers is mainly based on the actual water demand, and the most recent year is used as the base year. In addition, the specific water distribution amount is determined according to the long-term scheme and the future development situation. In this way, we could avoid deviations in water consumption caused by various factors, and alleviate the issues of water shortage and waste of water resources.
(5) Water distribution according to the actual water-using population ratio.
The population is one of the leading indicators of the socio-economic scale and one of the key indicators that affect or determine the scale of water use. Therefore, water distribution according to the actual proportion of water users is also an important facet. The rule is to allocate water considering the proportion of the population of each area to support the environmental protection goals of the river in the coastal areas.
(6) Water distribution in proportion to regional development.
This is also an important indicator that affects the region’s total production and water consumption. Therefore, it is necessary to consider the needs of regional production and development, and allocate water according to the proportion of GDP of each region, without sacrificing the river ecological protection.
(7) Water distribution according to regional watershed area or water production.
To reflect the contribution of different regions to the water production of the river basin, it is reasonable and fair to use the watershed area or the ratio of water production to divide the water. The rule is that the coastal areas should receive the water distributed by the river basin area or the proportion of water produced in each area, whilst maintaining the ecological environment protection of the river.
(8) Maximum water distribution according to the overall harmony degree.
The water distribution of transboundary rivers should follow the idea of harmonious water distribution. This idea aims to develop and utilize river water resources, comprehensively coordinate upstream and downstream water requirements, left and right banks, and primary and tributary streams [35], to avoid intensifying conflicts related to water contention. With this idea, water is allocated reasonably according to water use, geographic location and per capita water consumption.

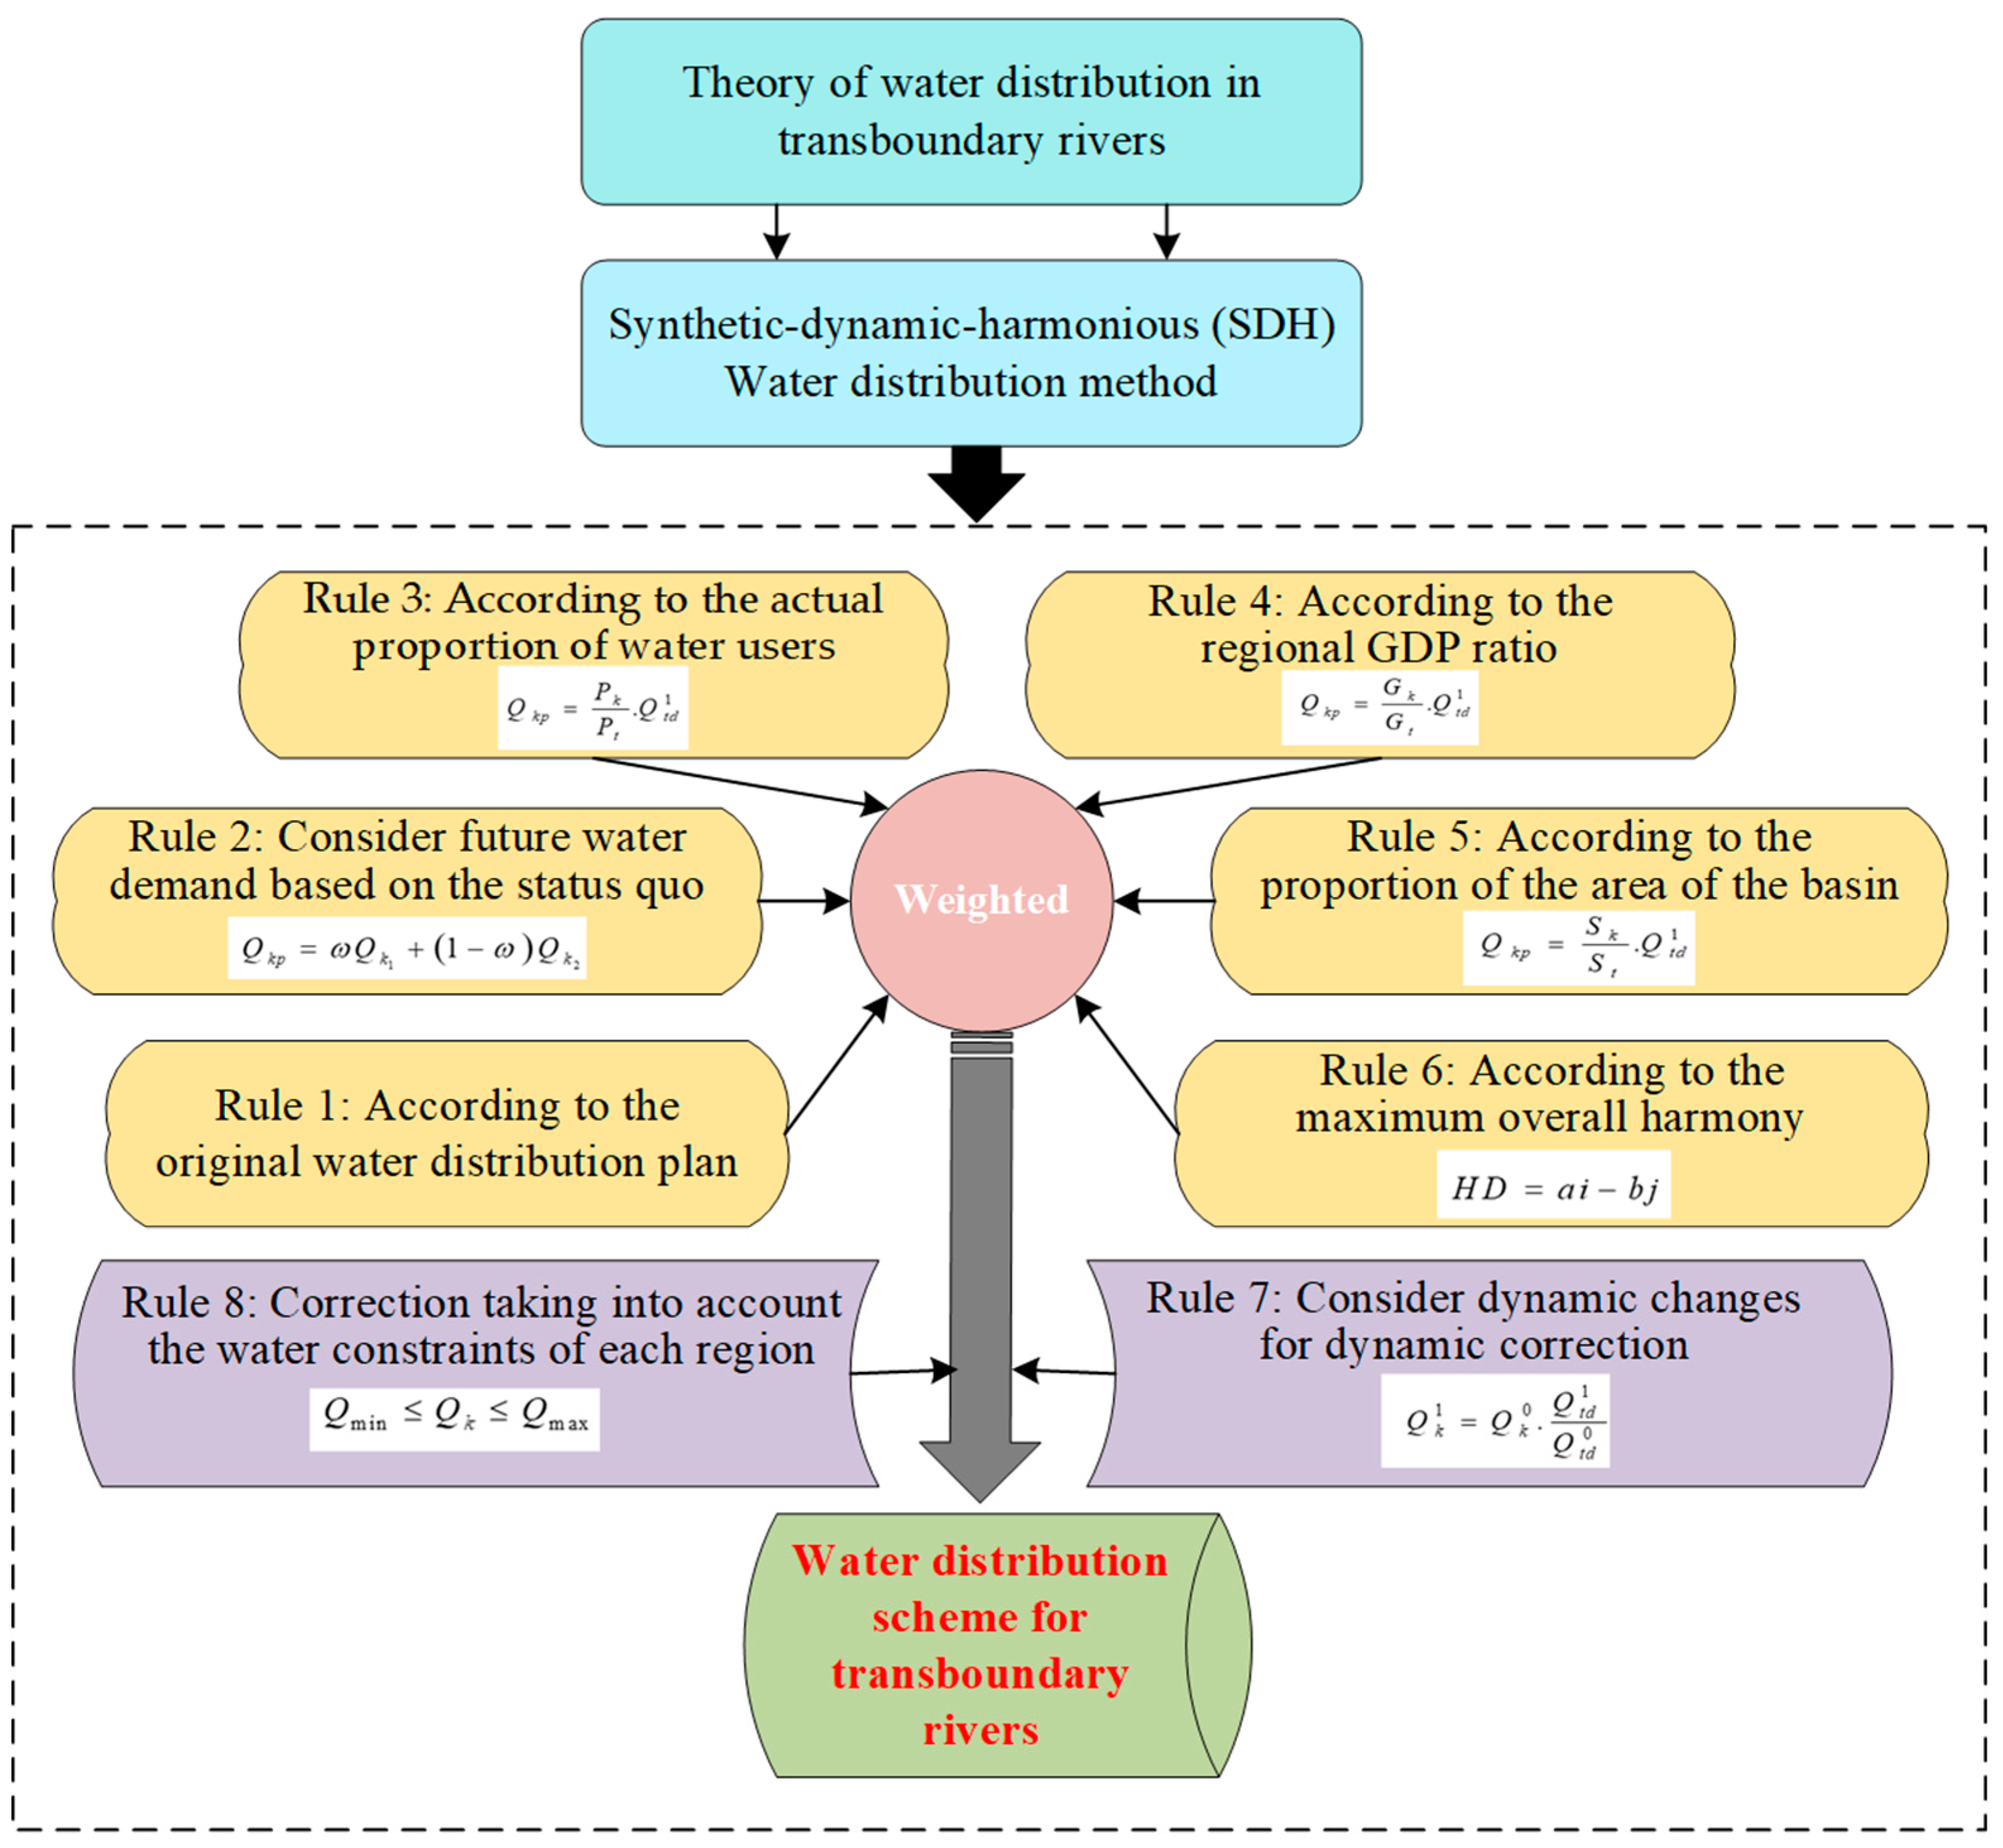
2.2. Water Distribution Calculation Methods for Transboundary Rivers

The current domestic and international water distribution methods for transboundary rivers mainly include: (a) the average distribution of water according to the number of countries or regions in the basin; (b) the distribution of water according to the area of the basin or the proportion of the production flow; (c) the distribution of water according to the proportion of the population in the basin; and (d) negotiation of the water distribution method, among others [36]. For instance, when studying the water distribution scheme of Nanpan River in prefectures and provinces, comparison and analysis were carried out from these aspects. Finally, a scheme to divide water according to the proportion of water volume was determined [37]. Regarding the water division of the Yili River between China and Kazakhstan, Zheng [38] also compared these methods and confirmed the feasibility of water allocation according to population and water demand. Internationally, in the 20th century, Israel and Jordan adopted a fixed amount of water to divide water, which resulted in severe water shortage problems during a drought period. Subsequently, the international water law also clarified that the principle of water distribution should be considered comprehensively, such as social needs and population. Regarding the water distribution of the Indus River between India and Pakistan in 1960, it was primarily based on historical and planned water use after demonstration [39]. A number of current records demonstrated that [40,41] the water distribution of transboundary rivers is mainly based on water demand and the multi-year average water resources of the river basin. In terms of the application of the method, it mainly includes a multi-objective optimization model, Gini-coefficient-based optimization model, multi-objective and Gini coefficient synthesis model, etc. For example, Hu et al. [42] established a multi-objective model involving water distribution equity and economic efficiency risk control. Dai et al. [43] analyzed the ways in which the hydrological model, water balance model, Gini coefficient, and chance-constrained programming (CCP) was applied to the general multi-objective optimization model, and the Gini-coefficient-based stochastic optimization (GBSO) model was constructed. Xu et al. [44] established a multi-objective water resource allocation model for sustainable development and integrated intergenerational rights and interests by using the Gini coefficient and modified Bentham–Rawls criterion. Ramírez et al. [45] established the WANAB model for basin water resource management optimization, and combined hydrological parameters and equations to determine the optimal water distribution network.
To sum up, to differ from traditional water distribution modes and methods, based on the ideas, principles, and rules of water distribution proposed in this paper and the reference to advanced experience [46], a concise and highly operable water division idea is used to summarize and propose a water division calculation method for transboundary rivers. The detailed process is presented below:

2.2.1. Rule-Based Calculation to Obtain the Water Distribution Scheme for Each Element

Scheme (A): Water distribution according to the original water distribution scheme does not require recalculation.
Scheme (B): Use water in accordance with the current situation and consider the use of water and water distribution in the future.
Q k p = ω Q k 1 + 1 ω Q k 2
In Equation (1), Qkp is the water distribution under the pth water distribution scheme in the k area; k is the area code, k = 1, 2, …, n; p = 2 (representing rule b); ω is the adjustment coefficient of the current water consumption; Qk1 is the current water consumption; Qk2 is future water consumption, obtained by considering the scale of future development. This paper uses ω = 0.5 when calculating the Yellow River water distribution scheme, i.e., the current and future water consumptions will each account for half of the proportion. Note that the value of ω is adjustable to reflect its relative importance.
Scheme (C): water distribution according to the actual proportion of water users.
Q k p = P k P t . Q t d 1
In Equation (2), Pk is the actual water-using population in the kth area; Pt is the total actual water-using population in the basin; Q1td is the distributable water volume; and p = 3 (representing rule b). Other symbols are similar to above.
Scheme (D): water distribution according to the proportion of regional GDP.
Q k p = G k G t . Q t d 1
In Equation (3), Gk is the GDP of the k th area; Gt is the total GDP in the basin; and p = 4 (representing rule d). Other symbols are the same as before.
Scheme (E): water distribution in proportion to the area of the basin.
Q k p = S k S t . Q t d 1
In Equation (4), Sk is the basin area of the k th area; St is the total basin area; and p = 5 (representing rule e). Other symbols are mentioned earlier.
Scheme (F): maximum water distribution according to the overall harmony.
H D = a i b j
In Equation (5), a = k = 1 n G k / k = 1 n A k , b = 1 − a, HD is the degree of harmony corresponding to a certain factor, where the factors can be the actual water consumption, per capita water consumption, etc; a and b are the degrees of unity and divergence, respectively; Ak is the harmony behavior of the kth area, i.e., the actual water consumption; Gk is the harmonious behavior in the kth area that meets the harmony rules, i.e., it does not exceed the water consumption under the allocated water volume. In Equation (5), i and j are the harmony coefficient and the disharmony coefficient, respectively, which are calculated using the function curve given by Zuo (2016) [36].

2.2.2. Consideration of Dynamic Changes for Dynamic Correction

Changes with changes in the amount of water that can be distributed.
Q k 1 = Q k 0 . Q t d 1 Q t d 0
In Equation (6), Q1k is the new water distribution scheme with the amount of water that can be distributed; Q0k is the original water distribution scheme; and Q0td is the original water distribution volume.

2.2.3. Consideration of the Water Constraints of Each Area for Correction

Considering the minimum water demand and water efficiency constraints.
Q min Q k Q max
In Equation (7), Qmin is the minimum water demand to meet the regional ecology, life, and production; Qmax is the maximum water demand under the control of the water efficiency quota; and Qk is the allocated water volume of the kth area.

2.2.4. Calculation and Determination of the Water Distribution Scheme

① The expert consultation method is used to determine the comprehensive weight uj of each water distribution scheme. To comprehensively synthesize the opinions of different scholars, we conducted a survey (through the water science QQ group, the water science WeChat group, and the Yellow River Forum expert WeChat group) to obtain a sum of 180 completed questionnaires. Through a statistical analysis, we finally summarized six weights of the water separation rules (i.e., 0.170, 0.255, 0.130, 0.090, 0.080, and 0.275). For different rivers, similar methods can be used to obtain specific weights.
② Calculate the water distribution, Qk, for the kth area.
Q k = p = 1 6 u p . Q k p
In Equation (8), p is the rule number, p = 1, 2, 3, 4, 5, 6.
③ Judge whether the distributable water volume has changed. If it changes, we calculate the new Qk according to the same rate of change.
④ Then, determine whether Qk meets the minimum water demand and water efficiency constraints.
The calculation process of the water distribution scheme is illustrated in Figure 3. This method can be summarized as a dynamic and coordinated water distribution method for transboundary rivers based on water distribution ideas, water distribution principles, and water distribution rules. It accounts for natural and human elements, and coordinates the relationship between man and water. This kind of water distribution method for transboundary rivers is called the “synthesis–dynamic–harmonious water distribution method”, also referred to as “SDH”.

3. Case Study

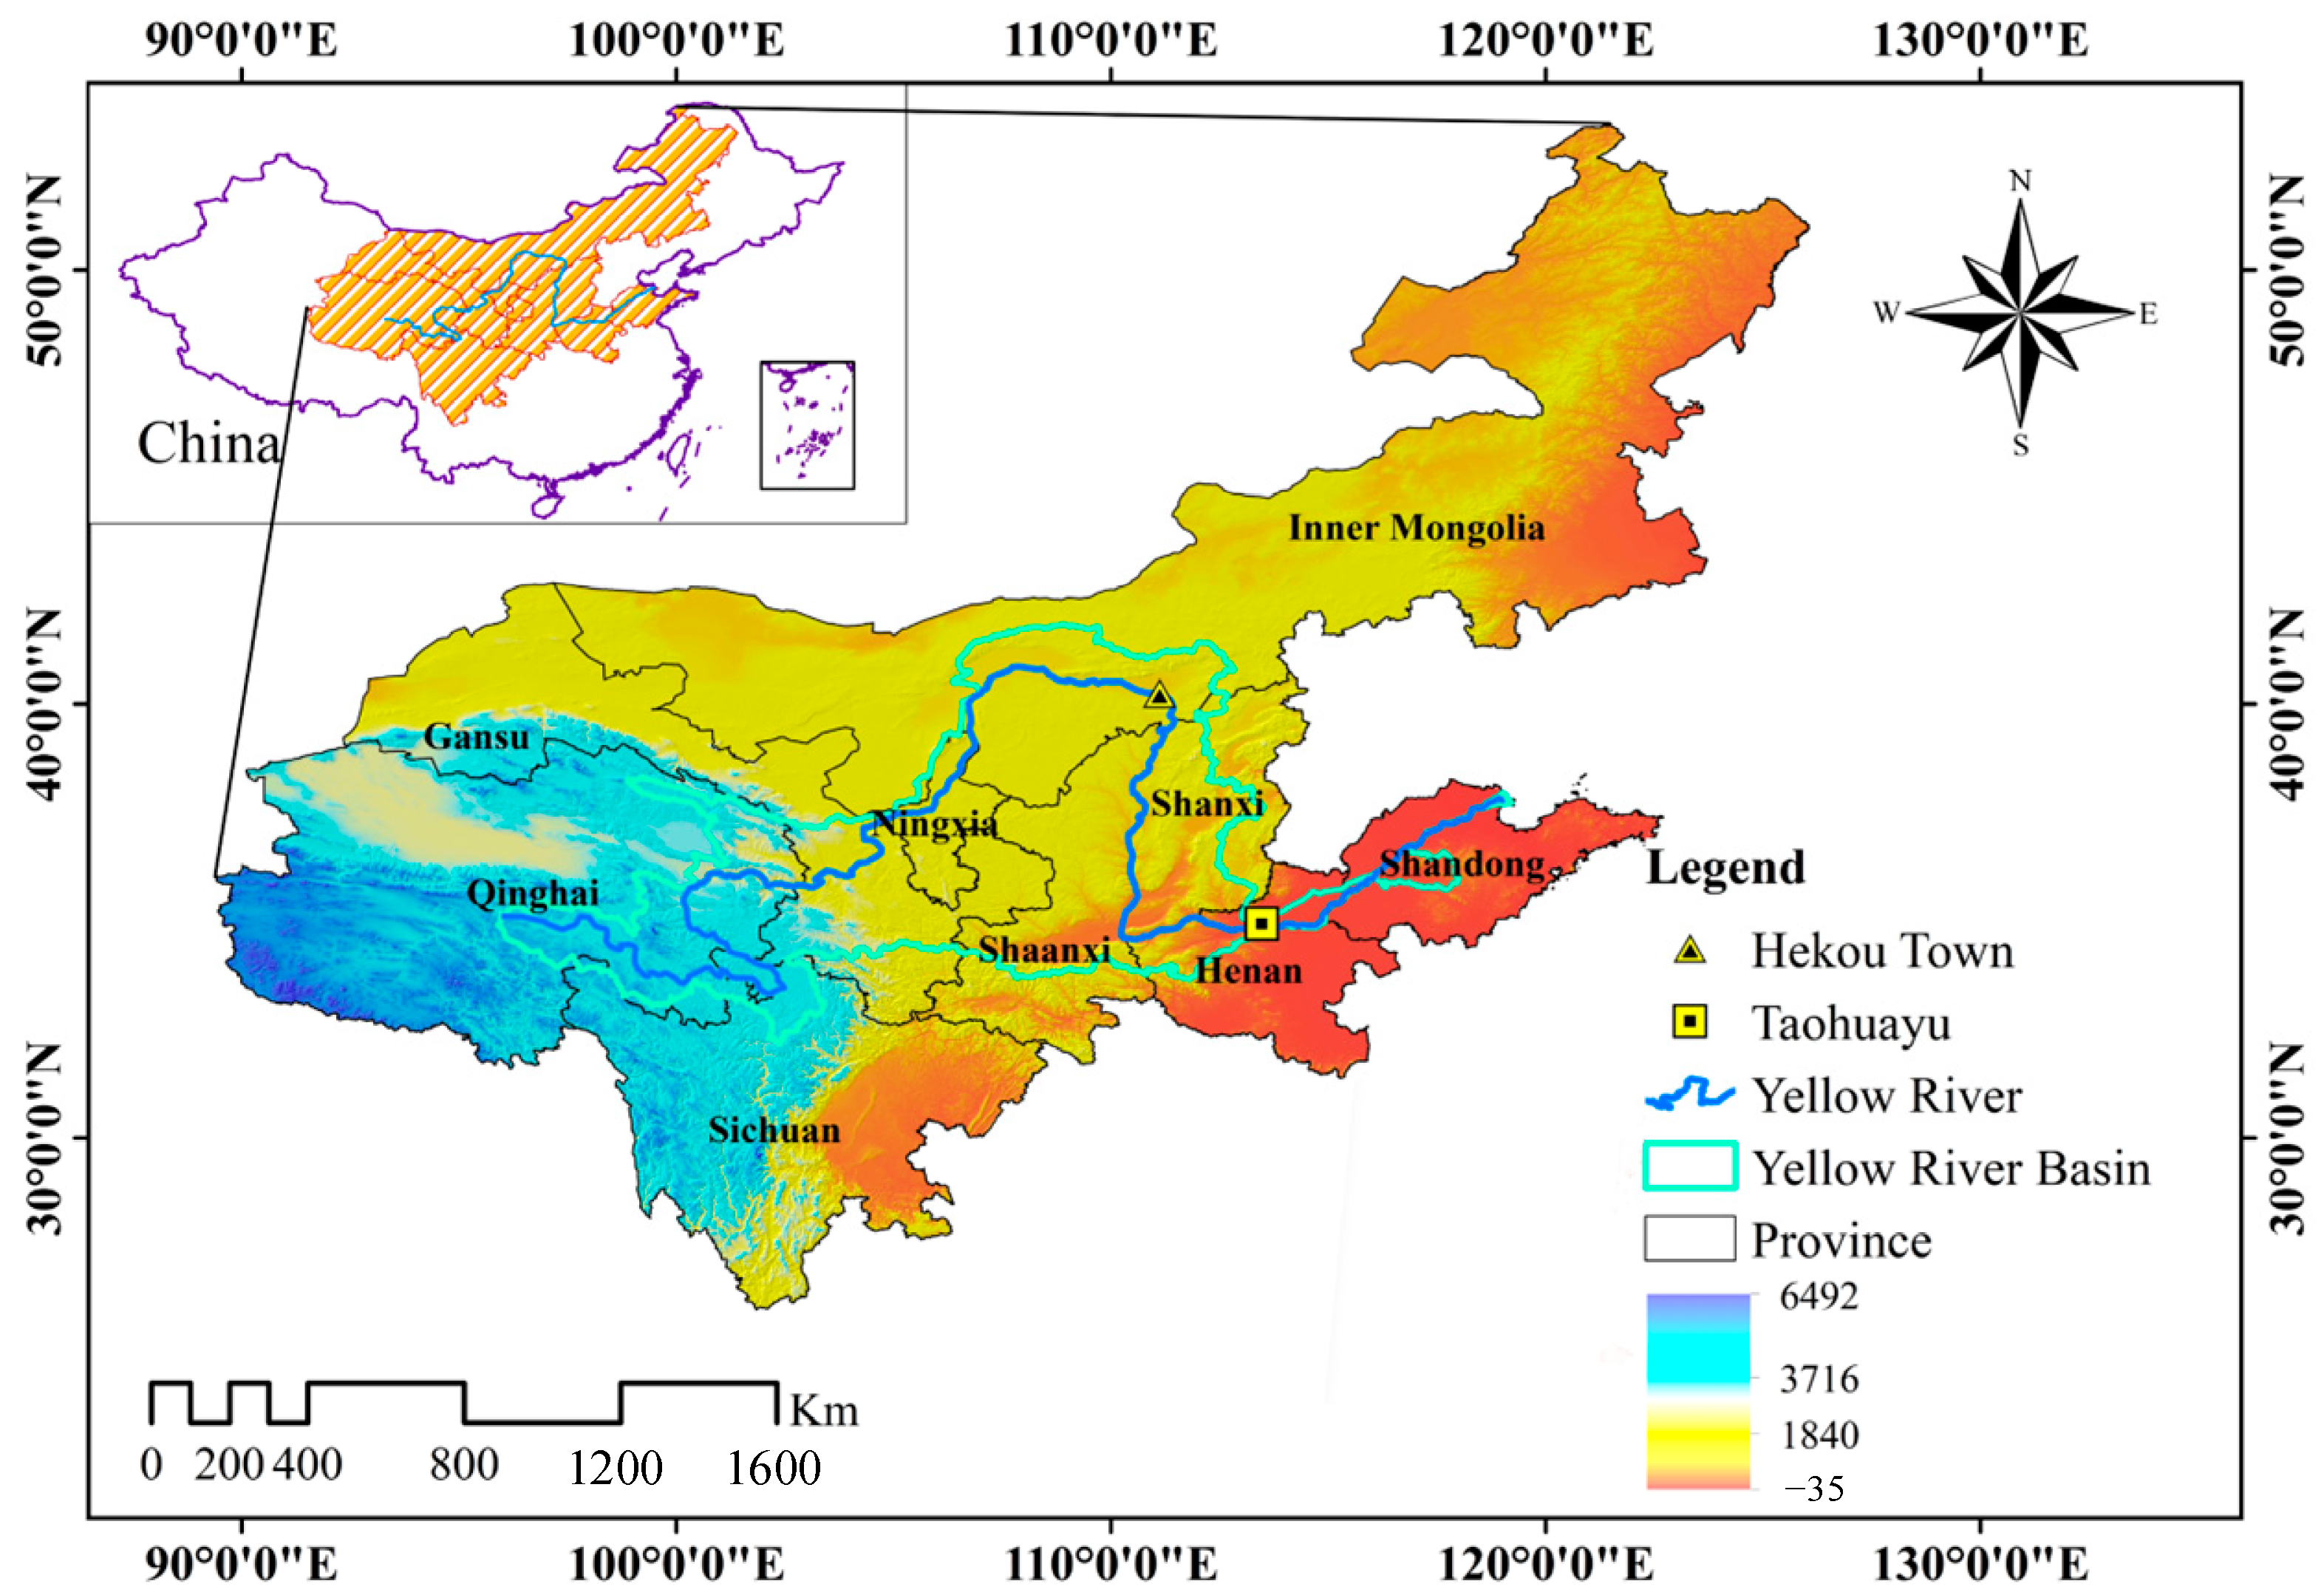
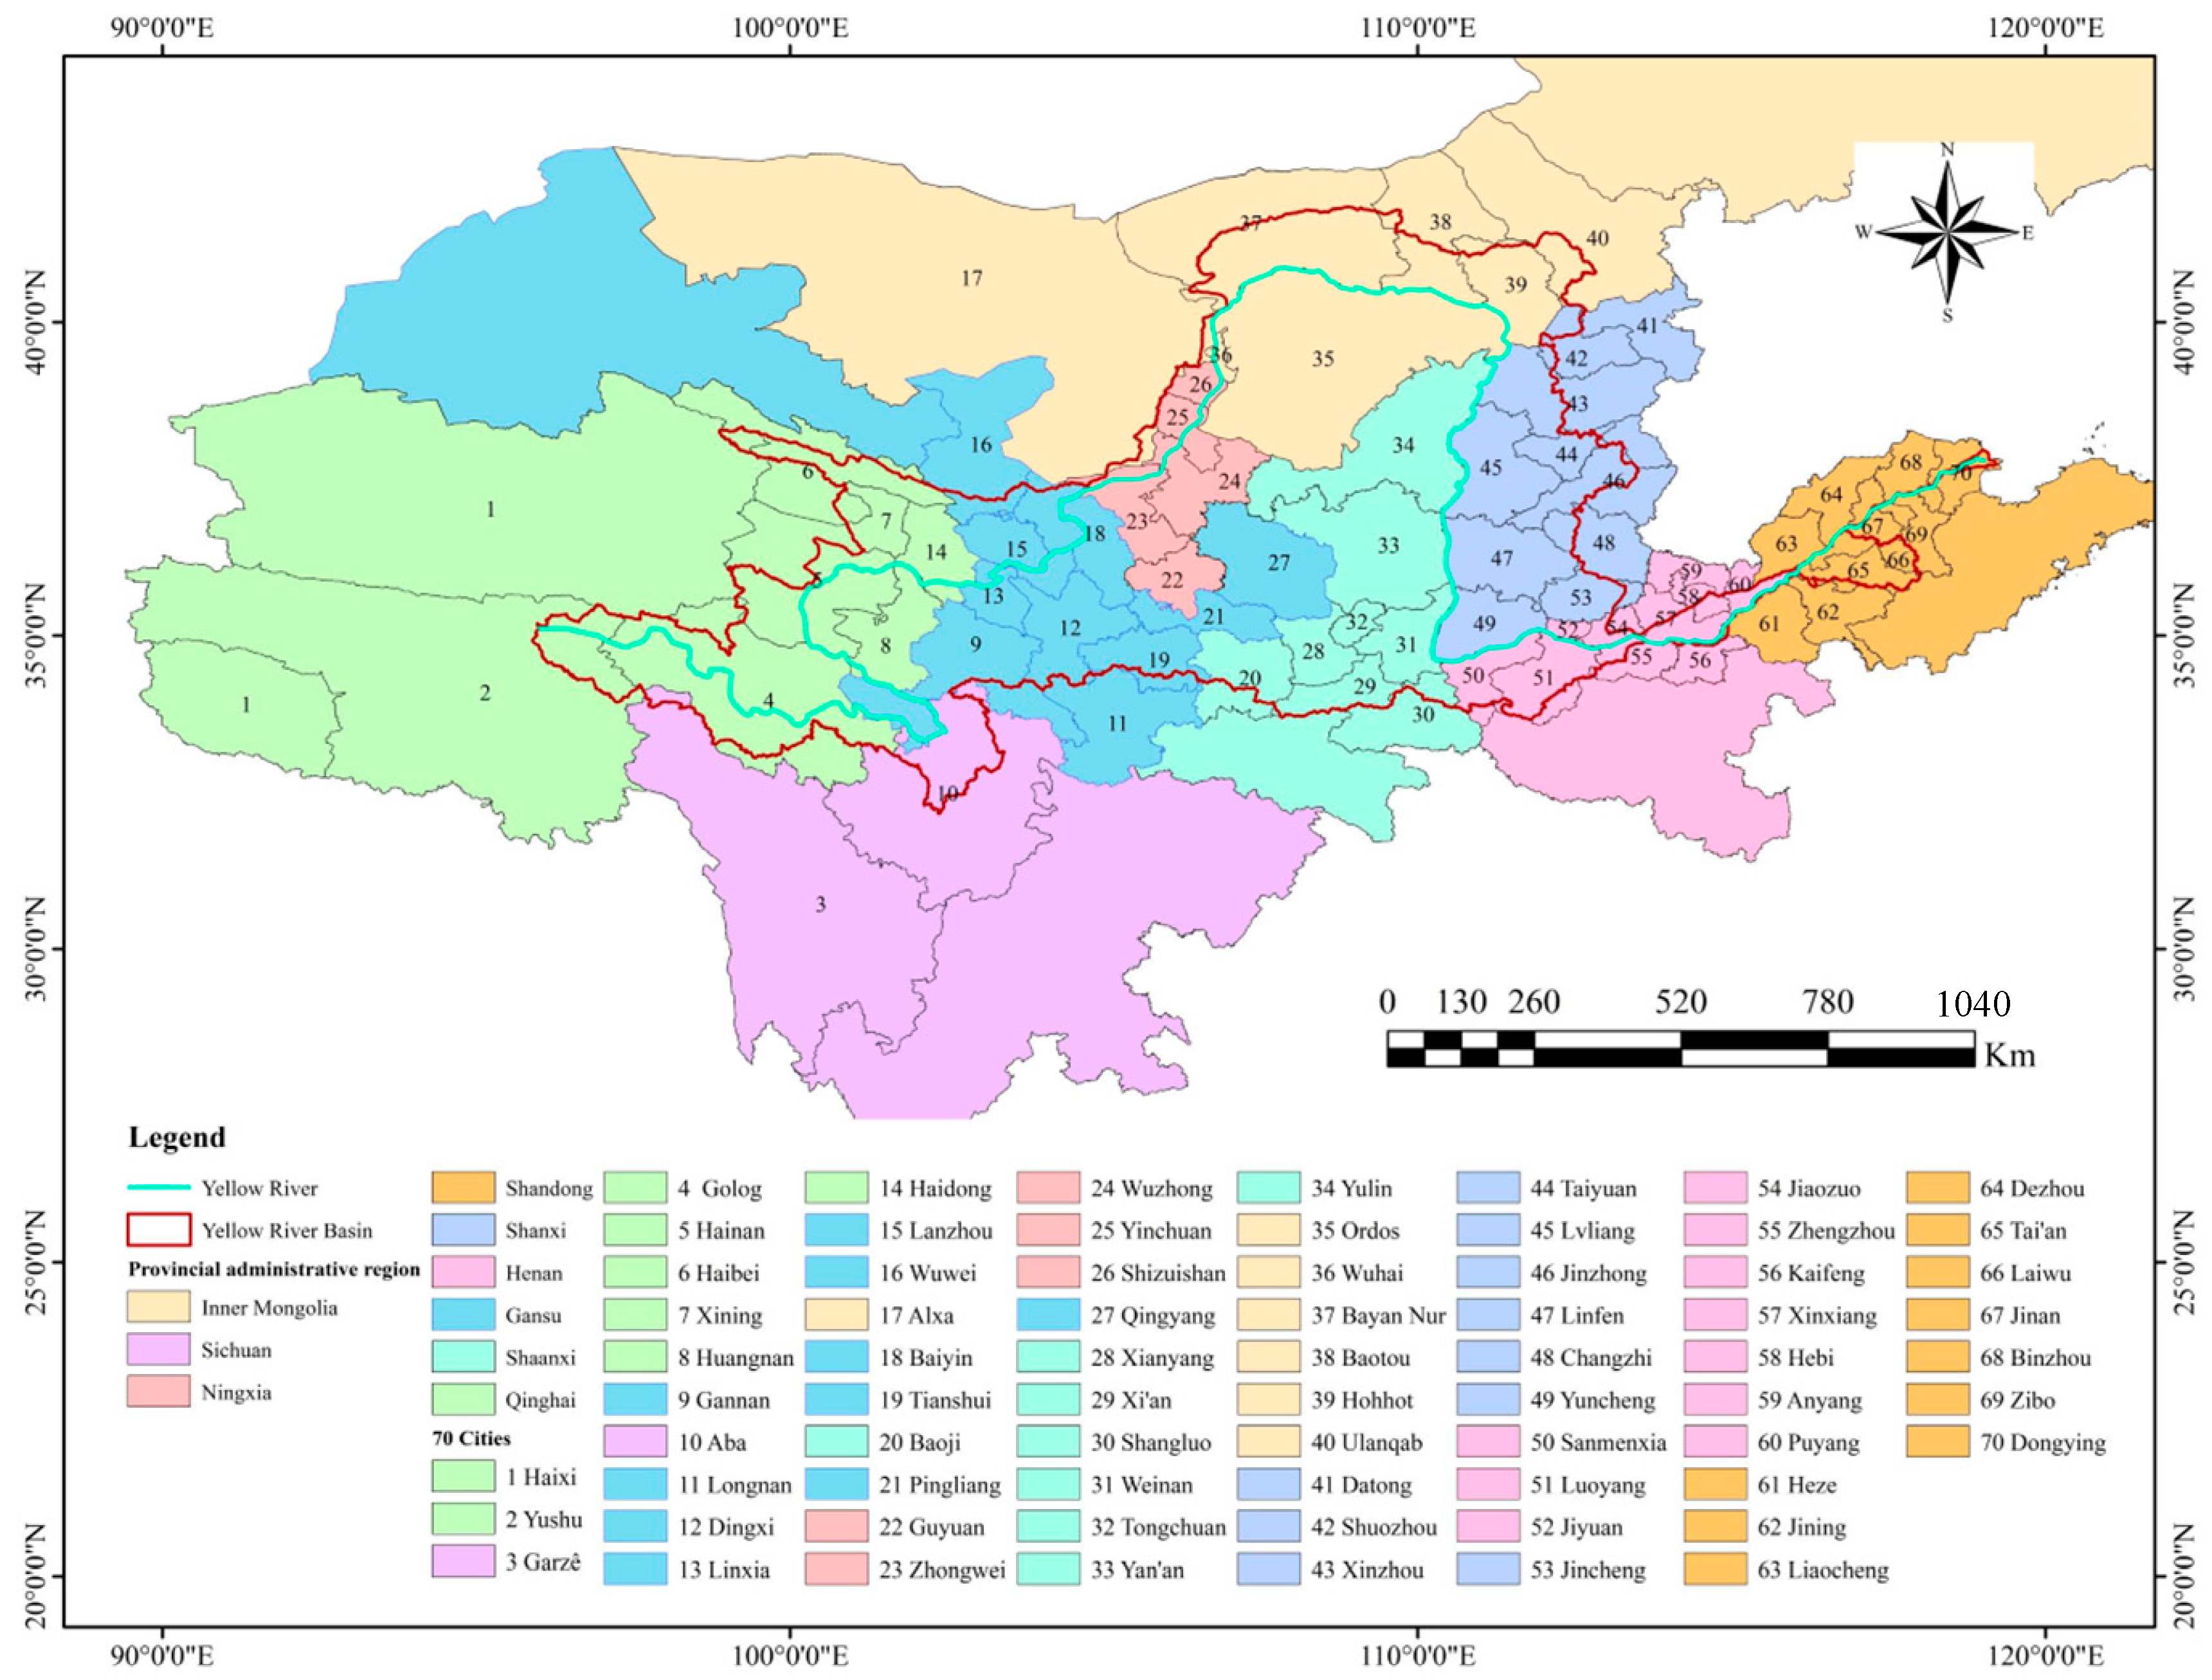
3.1. Overview of the Study Area

The Yellow River is the mother river of China, with a total length of 5464 km. It is also the second largest river in China. It originates from the northern foot of the Bayan Har Mountain on the Qinghai Plateau. It flows through Qinghai, Sichuan, Gansu, Ningxia, Inner Mongolia, Shaanxi, Shanxi, Henan, and Shandong, from west to east (Figure 4). The latitude of the Yellow River ranges from 34° N to 40° N, and its longitude ranges from 95° E to 120° E. The upstream is the river source to Hekou Town in Inner Mongolia, and the middle reaches from Hekou Town to Zhengzhou Taohuayu.
Due to the particularity of its geographical location, the Yellow River basin presents the characteristics of “less water and more sand, but different sources of water and sand”. With the development of regional economy, the industrial and agricultural water demands continue to rise. Coupled with the uneven spatio-temporal distribution of water resources, water shortages have become a limiting factor for the economic development of the Yellow River basin.
Due to the high population density and narrow river channels in the lower reaches of the Yellow River, the Henan and Shandong provinces have relatively small areas in the basin. In the Shandong Province, particularly, the basin area is 13,600 km2, accounting for only 1.7% of the total basin area. The Yellow River water distribution research scope defined here is based on the natural boundary of the basin. As demonstrated in Figure 5, the research scope includes 70 water distribution units. By processing this set of data, the water distribution results of the nine provinces are calculated according to the water distribution method of transboundary rivers.

3.2. Data Source and Description

The Yellow River flows through nine provinces. In addition, the water supply needs to account for Hebei and Tianjin. Based on the distribution method of the water volume of transboundary rivers, the provinces shall be systematically and reasonably distributed water. According to calculation needs, the original data of the Yellow River basin and regions collected from the Yellow River Water Resources Bulletin, and the statistical yearbooks of localities and cities are, presented in Table 1. Among them, the predicted water consumption in each region of the Yellow River basin in 2030 is mainly based on “implementing the most stringent water resource management”. The total water consumption control target in the “institutional assessment method” is obtained with each region’s comprehensive water resource planning and bulletin data.
After an in-depth demonstration, the Yellow River’s water supply capacity determined by the 1987 water distribution scheme is 37 billion m3. This study first allocates 37 billion m3 of water available to the Yellow River reasonably among the provinces. If the available water is adjusted, the corresponding water distribution of each province can also be obtained according to the dynamic correction formula. In our calculation, 2017 is the current water-use year. When calculating the degree of harmony, the water consumption in the past 10 years is used as the original data, and the water consumption of each region in the 1987 water distribution scheme is adjusted according to the degree of harmony to achieve the maximum value.
To sum up, based on the concept, principles, and rules of water distribution mentioned in Section 2.1, the original data in Table 1 are used to calculate the results of water distribution in the Yellow River basin through the four calculation methods proposed in Section 2.2. In the calculation process, the general water allocation rules and the Yellow River basin population, regional development status, as well as the current situation of water resource utilization, are combined to calculate the actual water allocation results, to improve the Yellow River basin water allocation in a scientific and practical manner.

4. Results and Discussion

4.1. New Water Distribution Scheme for the Yellow River

To facilitate the comparison with the Yellow River 1987 distribution scheme, the new Yellow River distribution scheme obtained in this section is called the “19ZQT” distribution scheme. This scheme is based on the Yellow River water distribution and systematic water distribution factors from a macro perspective, hence it can be viewed as a reference.

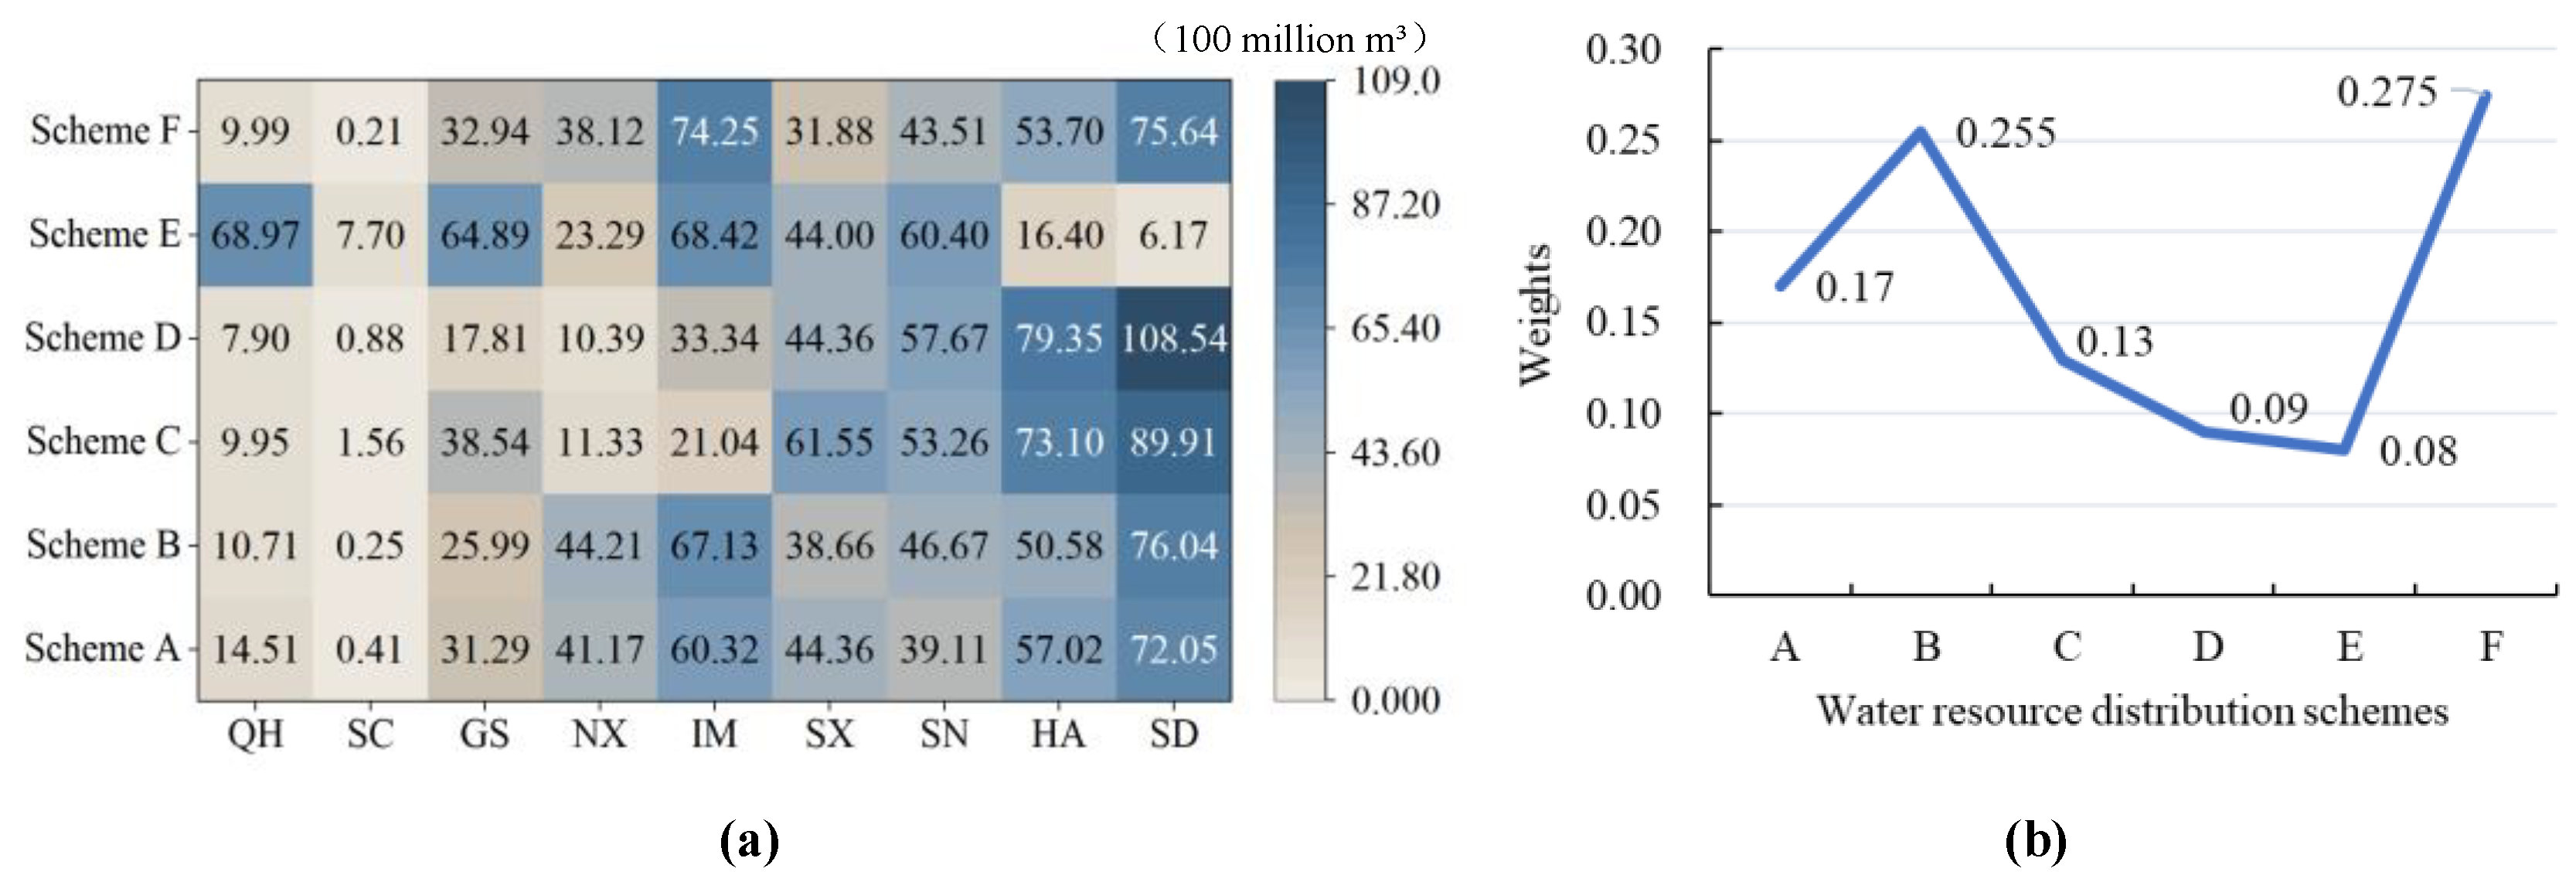
4.1.1. Calculation of Water Distribution Corresponding to Each Scheme

After in-depth analysis by experts, the water available for the Yellow River, calculated according to the 1987 water distribution scheme, is 37 billion m3. In this section, a reasonable water distribution among the provinces is performed. If the available water is adjusted, the water distribution of each province can also be calculated by referring to the dynamic adjustment formula. In this calculation, six water distribution schemes are obtained according to Equations (1)–(5) and the original water distribution scheme. Among them, scheme (B) refers to the future water requirement, which is obtained according to the total water consumption control target in the “implementation of the most stringent water resource management system assessment method”, and combined with the comprehensive regional water resource planning and water resource bulletin data. Scheme (F) uses water consumption of the last 10 years as the original data when calculating the degree of harmony. It adjusts the amount of water allocated in the water distribution scheme according to the degree of harmony, to achieve the maximum overall degree of harmony.
First, according to schemes (A) and (B) (Table 2), the water distribution for Hebei and Tianjin is calculated. As shown in Table 2, according to the weight, the final water distribution for Hebei and Tianjin is 976 million m3. Secondly, the remaining water supply of 36.024 billion m3 will be distributed to nine provincial administrative regions in the basin, according to six schemes, as shown in Figure 6a. Finally, according to the weight of each scheme obtained (Figure 6b), the final water quantity and water proportion of each province are calculated (Figure 7), and compared with the 1987 water quantity scheme (Figure 8).

4.1.2. Dynamic Adjustment of Water Distribution

The water distribution scheme is dynamic and changes year-on-year with the change in the amount of water distributed, and can be adapted according to Equation (6). Here, only 30 billion m3 of distributable water of the Yellow River is taken as an example for illustration purposes (refer to Figure 9). Supposing that the distributable water volume is not 30 billion m3, the calculation can be done similarly.

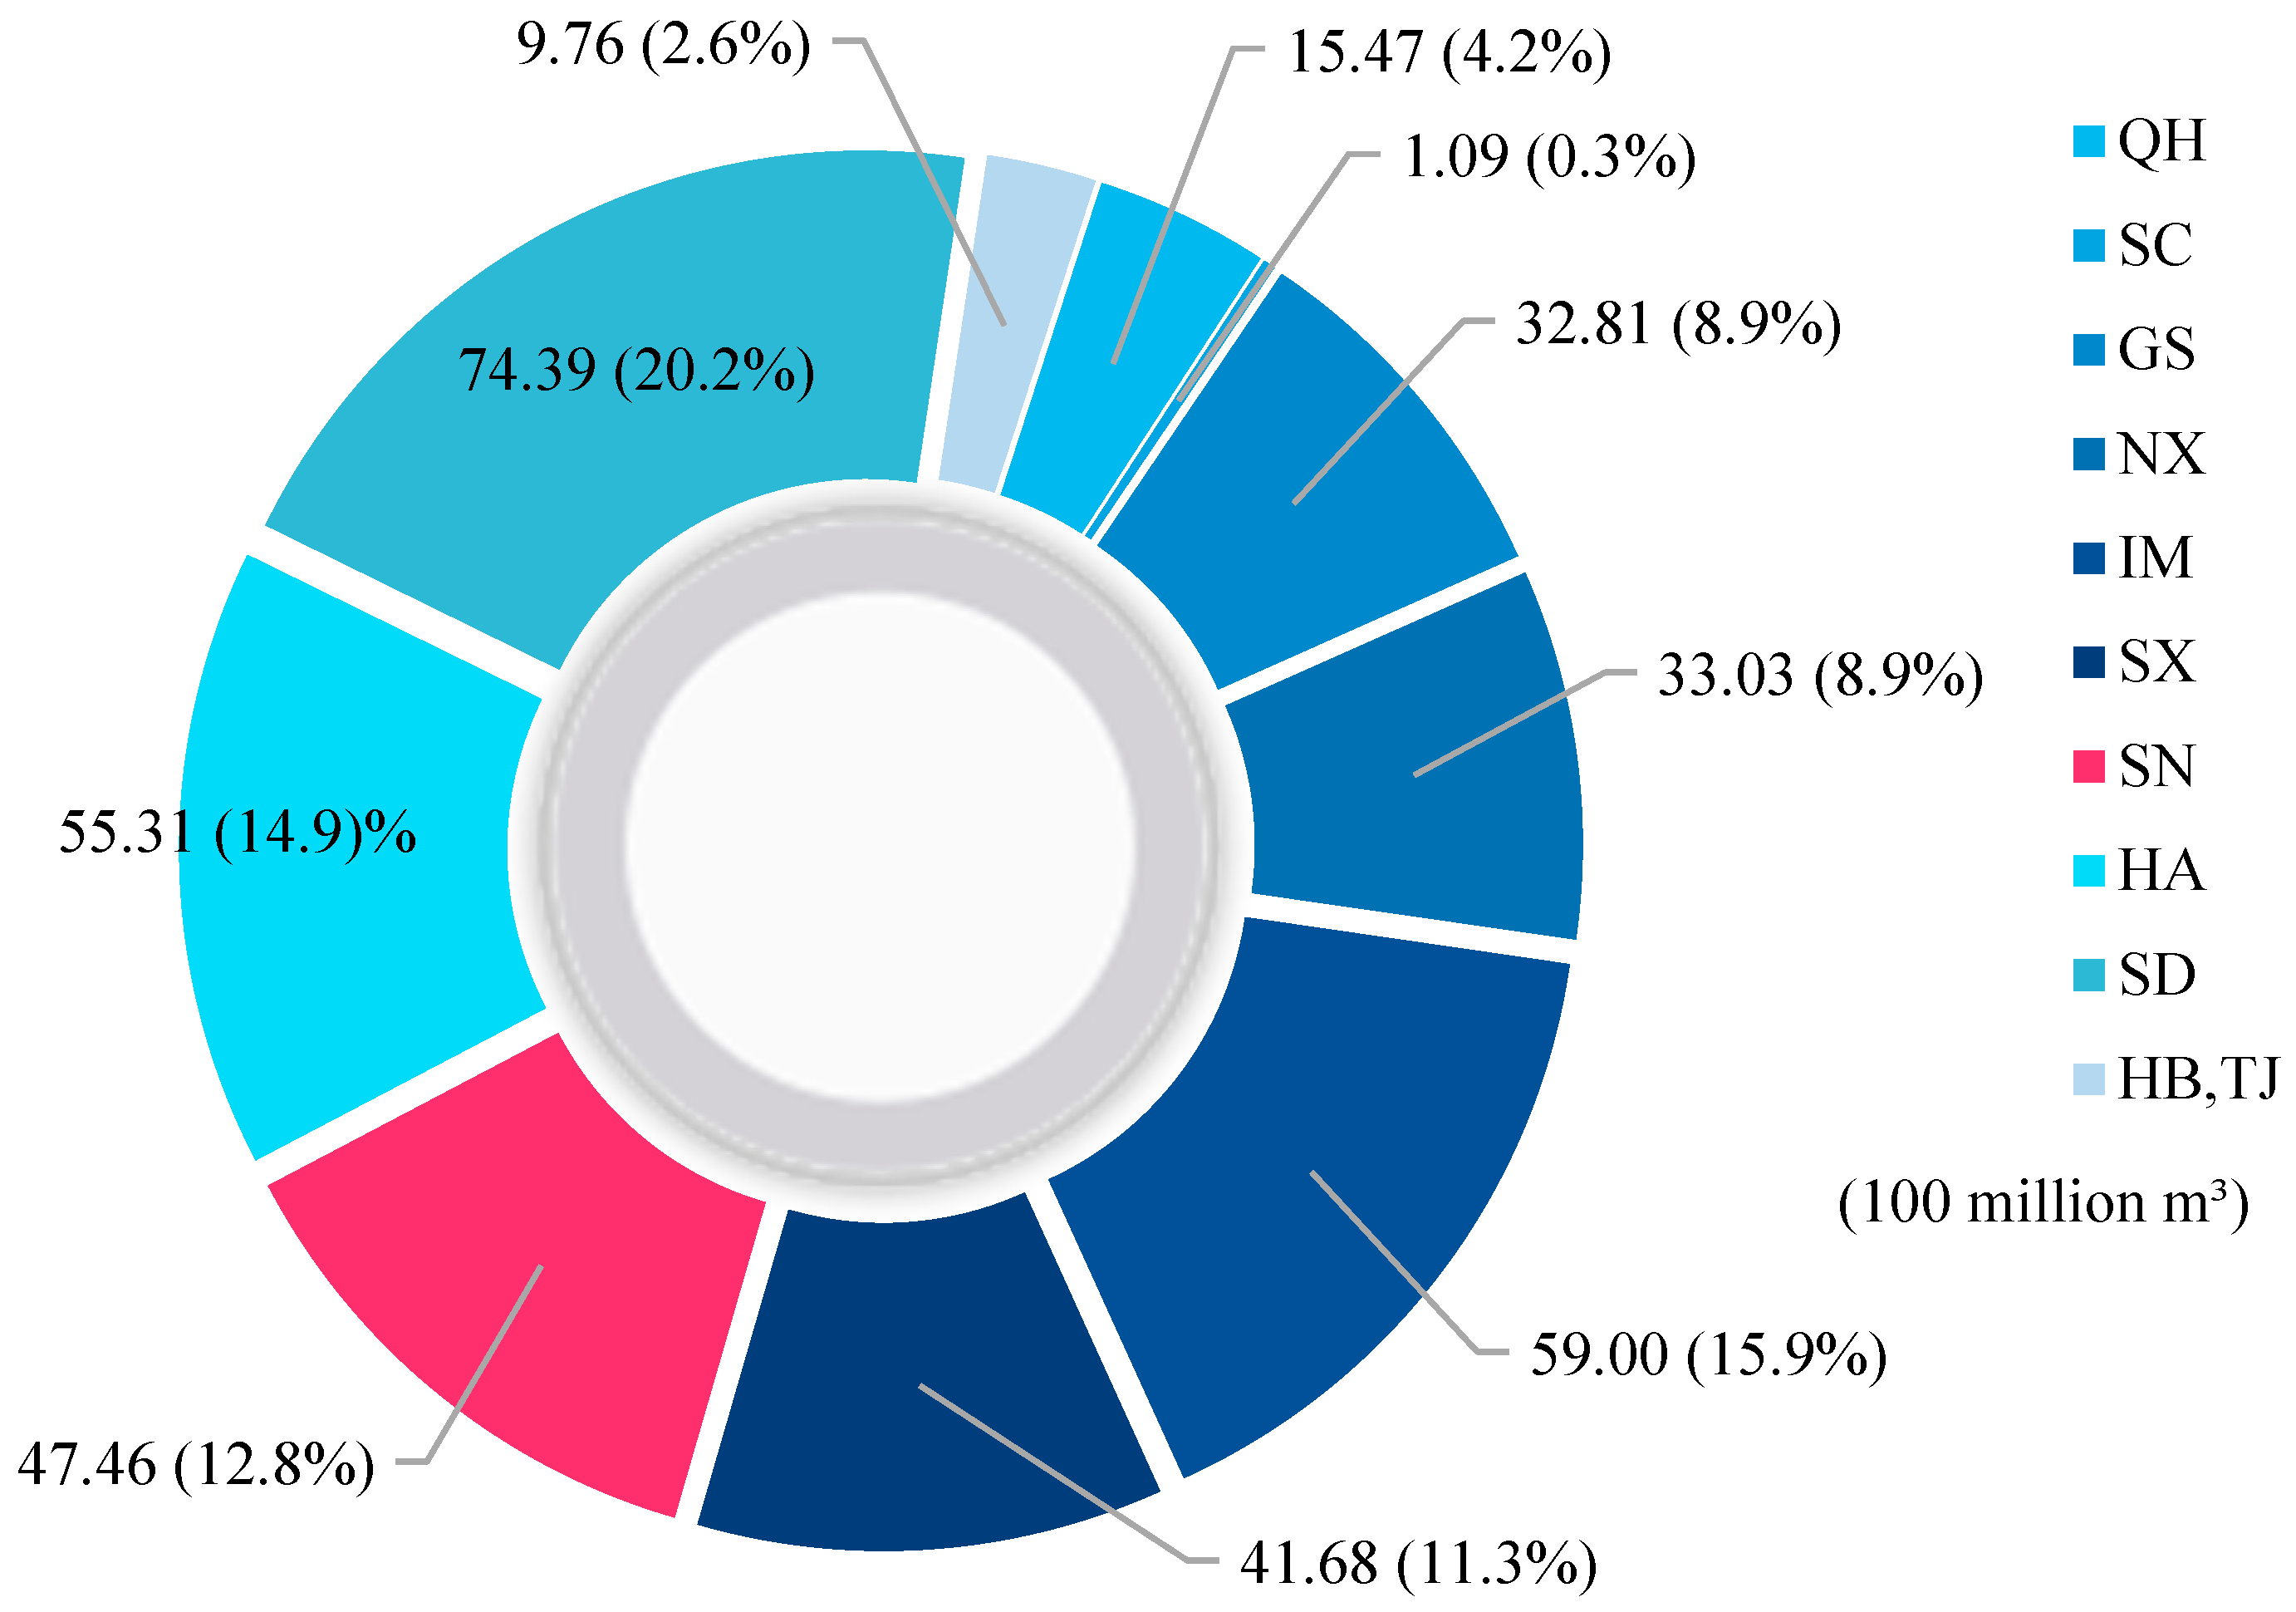
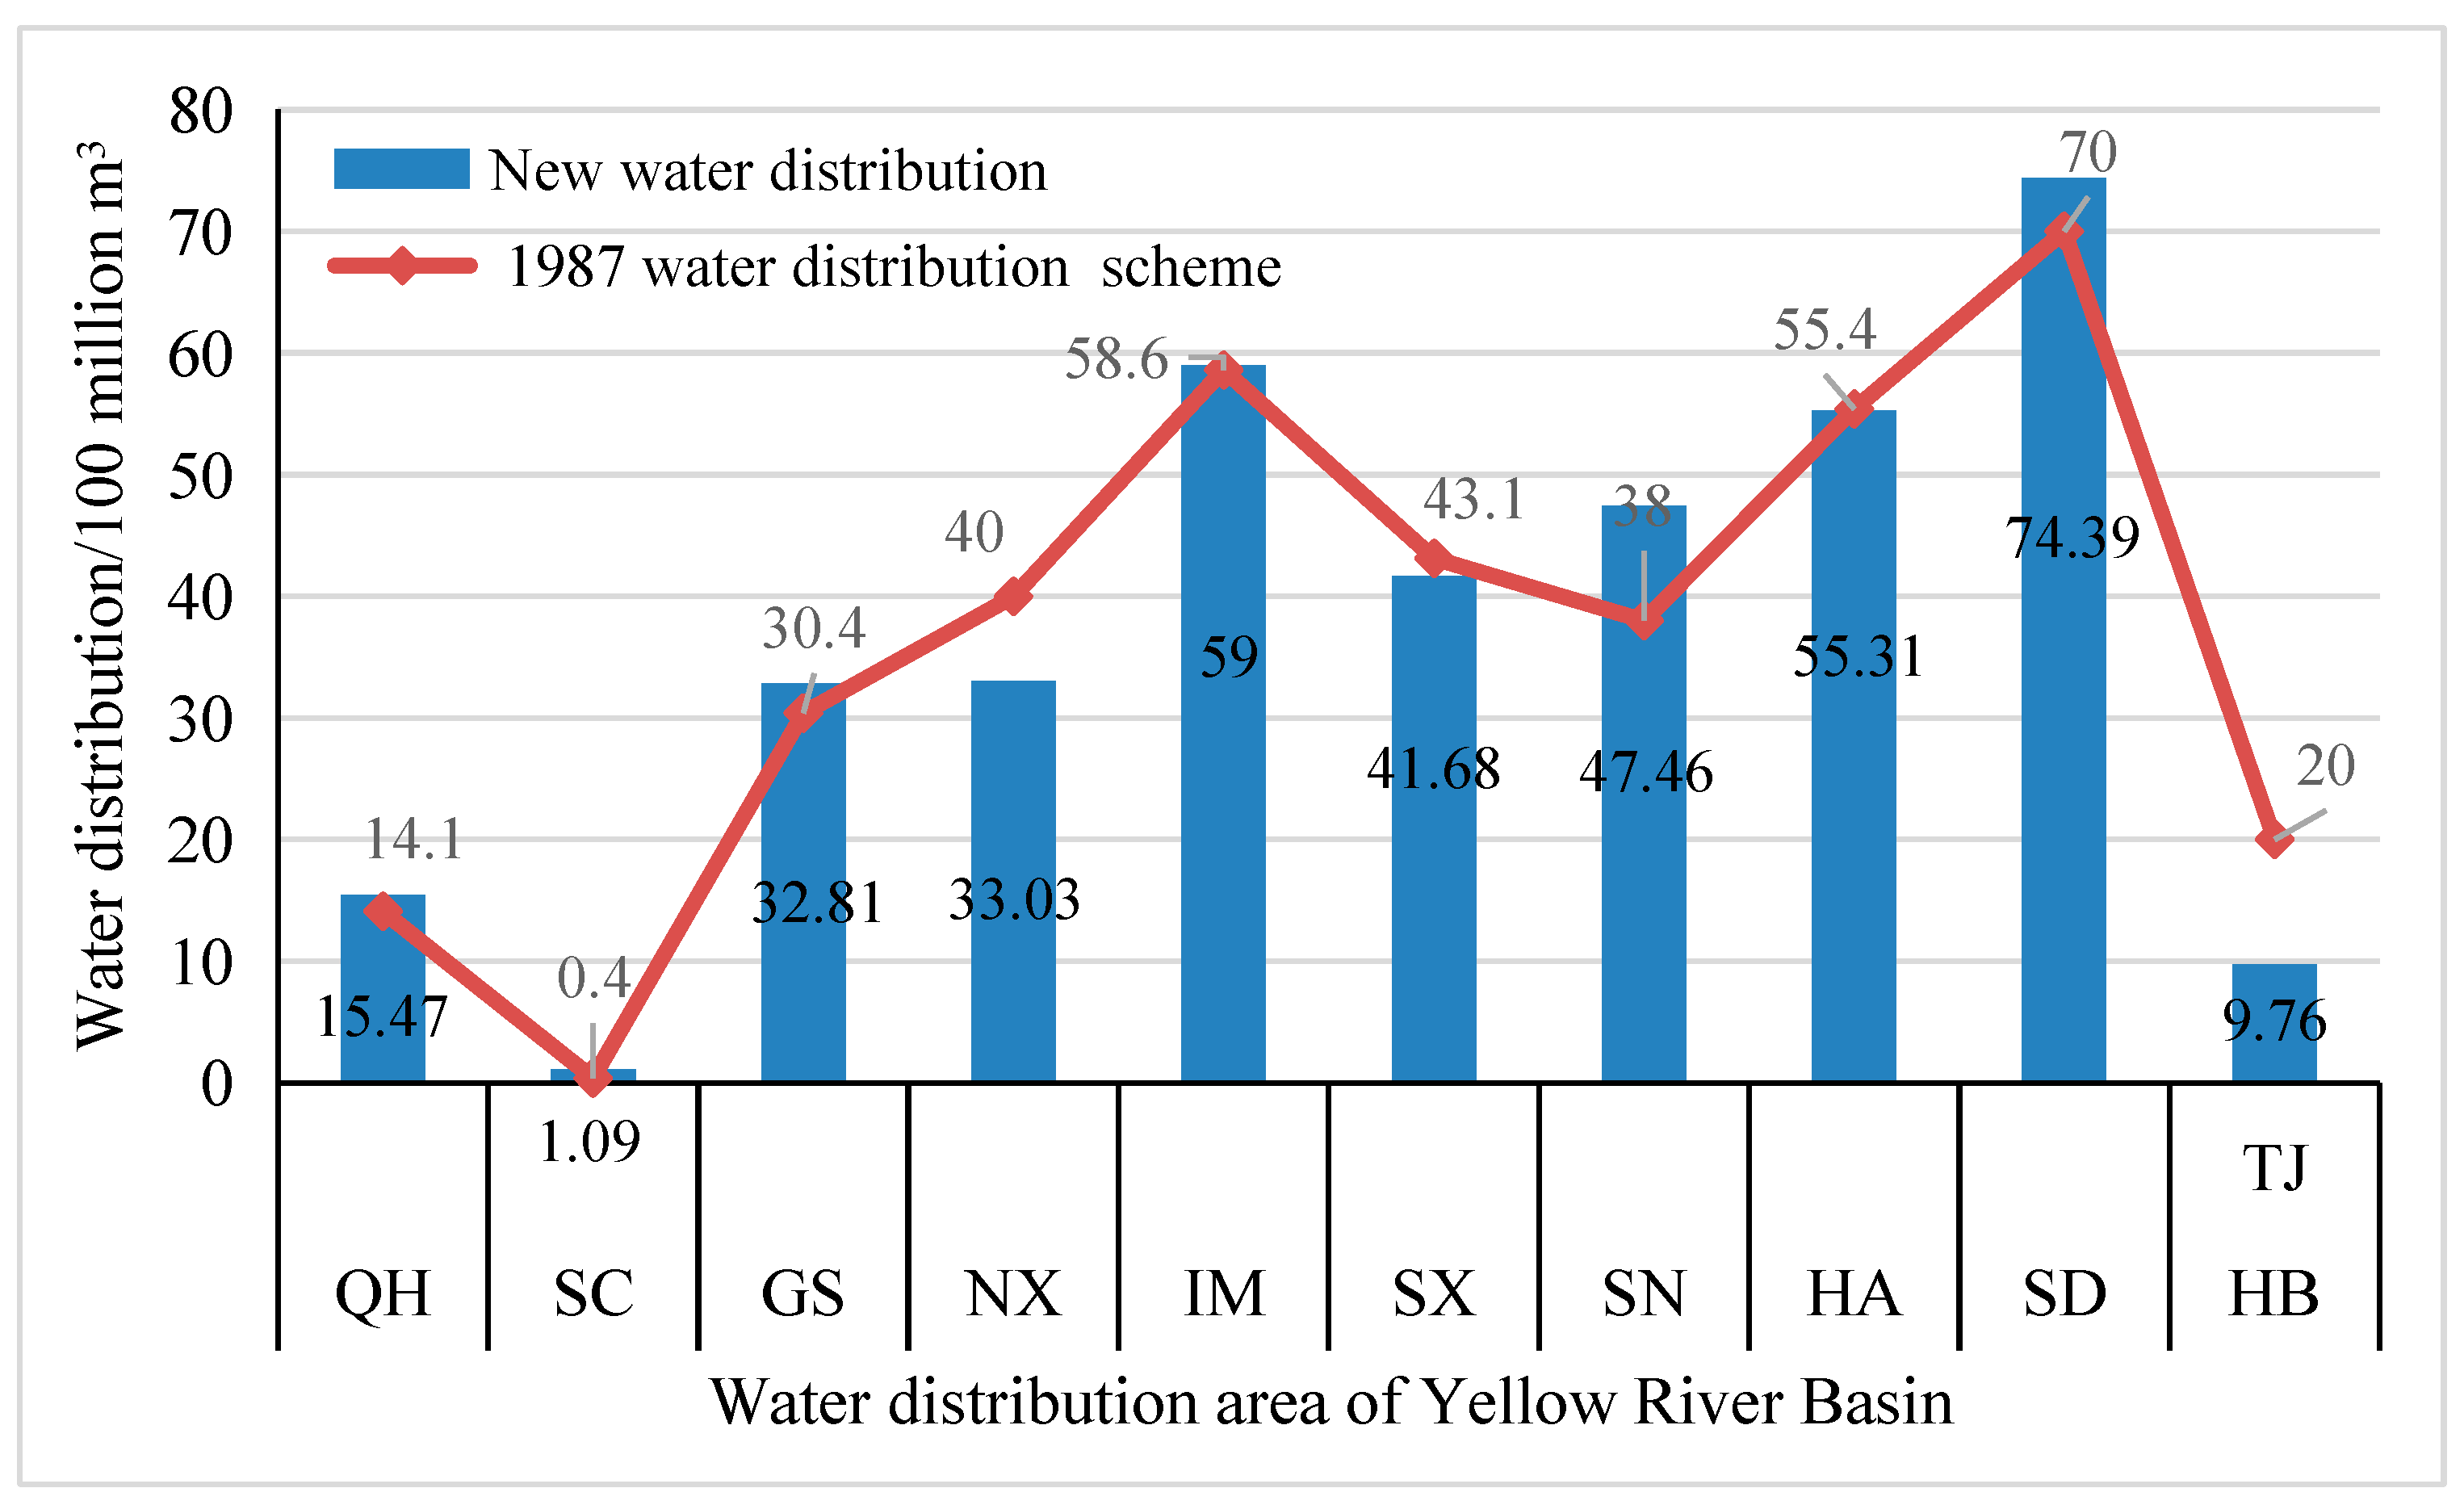
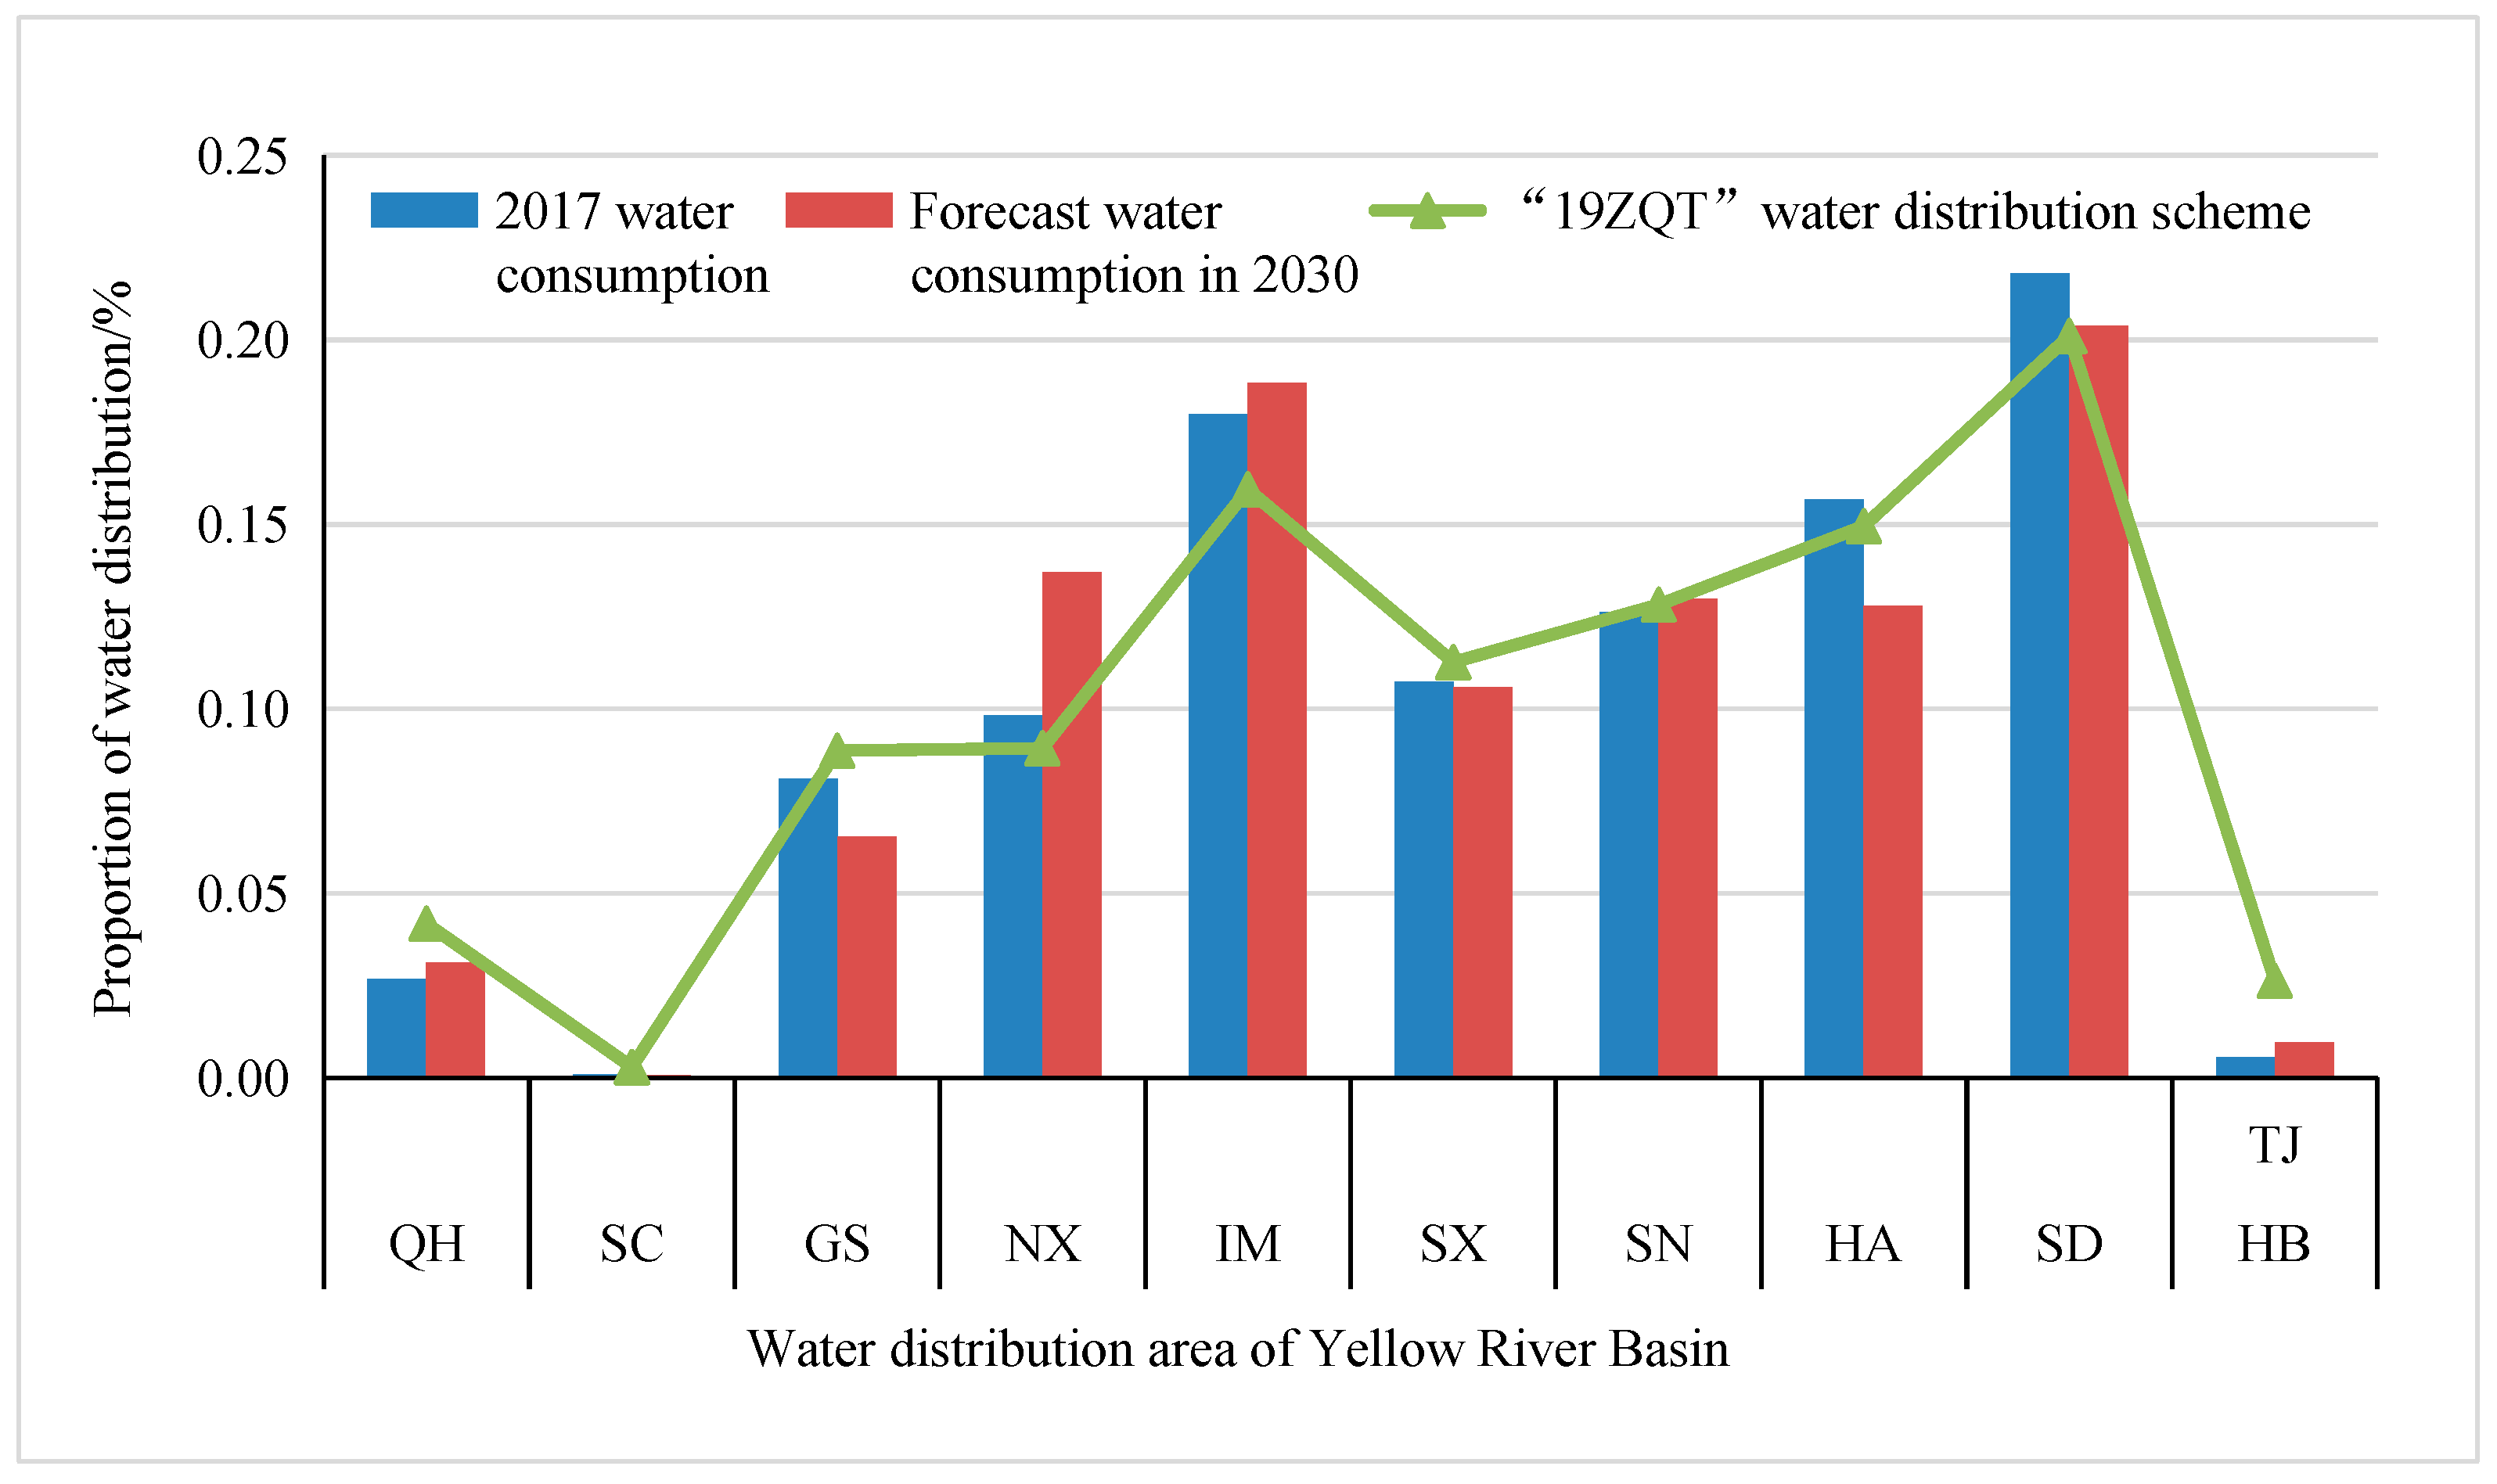
4.2. Analysis of Changes in the Yellow River Water Distribution Scheme

4.2.1. Changes of Water Volume in Various Provinces

Figure 7 indicate that the three regions with the largest water distribution (in descending order) are the Shandong, Inner Mongolia, and Henan provinces. The water distribution in the three regions exceeds 50% of the total water distribution. The water distribution of the Sichuan Province is the smallest, with a proportion of merely 0.3%. Sichuan, Hebei, Tianjin, and Qinghai provinces account for a sum of less than 10% of the total allocated water. The remaining regions are not much different. As can be seen in Figure 8, relative to the 1987 water distribution scheme, the change in water distribution of Hebei and Tianjin is huge under the new scheme (a drop of 51.2%), followed by that of Shaanxi Province (an increase of 24.89%). A minor change appears in the Henan Province, where the water distribution was reduced by 900 million m3.
The source of the Yellow River is located in the Qinghai Province, and Sichuan and Gansu provinces is located in the upper reaches of the Yellow River basin. The area is large and there is plenty of room for further development. The amount of water distribution has increased based on the original scheme. The Ningxia Province is located in the upper reaches of the Yellow River and has a small area. Since its actual water-using population and regional GDP are relatively small, the amount of water allocated to the Ningxia Province has been appropriately reduced. The Inner Mongolia Province is located in the upper reaches of the Yellow River, with much water demand driven by agricultural production and industrial development. Therefore, the water consumption is large, and the water distribution is slightly increased on the basis of the original water volume. Despite the abundance of rivers and water resources, the Shanxi Province is located in a mountainous area, which restricts access to freshwater. Since the actual water consumption over the years has not reached the distributed water volume, the distributed water volume has been reduced on the basis of the original water volume. In recent years, the actual water consumption in the Shaanxi Province is relatively large, and the regional GDP is relatively high, so the distributed water volume has been increased. Henan and Shandong provinces are densely populated, and both provinces have large water demands. Their actual water consumptions have long exceeded their water distribution indicators. The strong economic development in the Shandong Province is consistent with its increased amount of water distribution. However, considering the overall situation in the Henan Province, the water distribution remains unchanged. Contrastingly, Hebei and Tianjin generally use less water from the Yellow River, and their actual water consumption has been far less than the water distribution index for a long time. The water distribution has been dramatically reduced.

4.2.2. Dynamic Adjustment of the Distributable Water Volume

According to the water distribution of each province in the water distribution scheme, the relative size of the allocated water in each province can be observed. However, the water distribution scheme should be adaptive to changes caused by exceptional circumstances (e.g., wet years, dry years or the construction of water transfer projects). To prevent the unexpected challenges of flooding/drought, the distribution of water needs to be adjusted dynamically according to the actual situation. For instance, the distributable water volume of the Yellow River can be changed from 37 billion m3 to 30 billion m3. Similarly, a new water distribution scheme can be developed using the given method.

4.2.3. Comparative Analysis of Water Distribution

This section will compare the results of the new water distribution scheme (the “19ZQT” water distribution scheme) with the actual water consumption (2017) and projected future water consumption (2030) (Table 1). As can be seen in Figure 10, the proportion of water distribution in Qinghai, Gansu, Shanxi, Tianjin, and Hebei is higher than that in 2007 and 2030. In Ningxia, Inner Mongolia, and Shandong, the proportion of water sharing is lower than that in 2007 and 2030, showing a water gap. Inner Mongolia, Tianjin, and Hebei are areas of great overall change. Inner Mongolia’s water-sharing ratio was 2.03% lower than the actual water consumption in 2017, and will be 2.88% lower than the predicted water consumption in 2030. The proportion of water distribution by Tianjin and Hebei increased by 2.09% from 2017, and will increase by 1.68% by 2030. The results show that the new scheme can objectively adjust the distribution of water resources in each region and reduce and improve the utilization efficiency of limited water resources by analyzing and setting rules in each region of the Yellow River basin. However, there will be water shortages in some areas, and new solutions will need to be adjusted and refined to meet water demand, while ensuring water utilization.
To sum up, compared with previous relevant studies [16,19], the SDH method model proposed in this paper pays more attention to the combination of theory and method, clarifies specific water distribution concepts and rules, improves the theoretical basis of water distribution in transboundary rivers, and improves the standardization of water distribution. Based on the 1987 water distribution scheme, the “19ZQT” water distribution scheme allocates water according to the geographical and socio-economic development characteristics of each region, combined with the actual water use situation. This method improves the science and rationality of water distribution results, makes the water distribution scheme more in line with the development level of each region, and makes efficient and reasonable use of water resources. At the same time, it also takes into account the changes caused by special circumstances, and improves the timeliness and flexibility of the water distribution scheme.

5. Conclusions

This paper systematically investigated the water distribution theory of transboundary rivers and summarized some ideas, standards, and principles of water distribution. Based on the “SDH” water distribution method for transboundary rivers, a new water distribution scheme has been constructed for the Yellow River.
(1)
According to the related concepts and characteristics of transboundary rivers, we summarized the theoretical system (i.e., ideas of water distribution, principles of water distribution, rules of water distribution) of transboundary river water distribution. Furthermore, we applied the theory of harmony to the water division of transboundary rivers, and laid the foundation for proposing the calculation method for harmonious water distribution.
(2)
On the basis of the theoretical system of water distribution in transboundary rivers, we constructed a “synthesis–dynamic–harmonious water distribution method” (SDH). We applied the SDH method to estimate the Yellow River water distribution and establish a new water distribution scheme, the “19ZQT” water distribution scheme.
(3)
The new water distribution scheme is calculated by the “SDH” transboundary water distribution method. The results show that in the “19ZQT” water distribution scheme, there are six rules corresponding to the water distribution scheme that can reflect the main influencing factors of water distribution. However, the amount of water available under different water distribution schemes may vary in the same area.
(4)
Under the “19ZQT” water distribution scheme, Shandong, Inner Mongolia, and Henan have the largest water distribution, and the three regions account for 50% of the total water distribution. Sichuan has the smallest water distribution, accounting for only 0.3% of the total. Compared with the 1987 water distribution scheme, the water distribution in Hebei and Tianjin has changed greatly, decreasing by 51.2%, whilst in Shaanxi, it has increased by 24.89%.
Based on the theoretical system of transboundary river flow distribution, this paper studies the water distribution in the Yellow River basin by the means of the SDH method model. Combining theory and method, this paper proposes a “19ZQT” water distribution scheme. However, the research content still has the following deficiencies: first, the discussion of methodology is not mature enough. The current research focuses more on the construction of a theoretical system and the combination of methods, and the in-depth study of specific water distribution methods is an important research direction in the future. Second, the study of traffic needs to be further developed. At present, the research on water distribution only considers the aspect of water quantity, while the research on flow highlights the temporal and spatial characteristics of water, which is an inevitable research trend and also a potential focus of future research.

Author Contributions

M.Q.: software, formal analysis, investigation, data curation, writing—original draft, visualization. Q.Z.: conceptualization, methodology, validation, writing—review and editing, supervision, funding acquisition. Q.W. and B.W.: methodology, validation, writing—original draft, writing—review and editing, supervision. J.M. and J.Z.: writing—review and editing. All authors have read and agreed to the published version of the manuscript.

Funding

This work was funded by the National Key Research and Development Program of China (No. 2021YFC3200201), the Major Science and Technology Projects for the Public Welfare of the Henan Province (No. 201300311500), and the Natural Sciences Foundation of China (No. 52279027).

Data Availability Statement

Publicly available datasets were analyzed in this study. These data can be found and downloaded on relevant websites.

Conflicts of Interest

The authors declare no conflict of interest.

References

  1. Lu, S.B.; Lian, Z.D.; Sun, H.P.; Wu, X.H.; Bai, X.; Wang, C.C. Simulating trans-boundary watershed water resources conflict. Resour. Policy 2021, 73, 102139. [Google Scholar] [CrossRef]
  2. Philpot, S.; Hipel, K.; Johnson, P. Strategic analysis of a water rights conflict in the south western United States. J. Environ. Manag. 2016, 180, 247–256. [Google Scholar] [CrossRef]
  3. Veisi, K.; Bijani, M.; Abbasi, E. A human ecological analysis of water conflict in rural areas: Evidence from Iran. Glob. Ecol. Conserv. 2020, 23, e01050. [Google Scholar] [CrossRef]
  4. Xie, P.X.; Zhuo, L.; Yang, X.; Huang, H.R.; Gao, X.R.; Wu, P. Spatial-temporal variations in blue and green water resources, water footprints and water scarcities in a large river basin: A case for the Yellow River basin. J. Hydrol. 2020, 590, 125222. [Google Scholar] [CrossRef]
  5. Liu, K.K.; Li, C.H.; Yang, X.L.; Hu, J.; Xia, X.H. Water Resources Supply-Consumption (Demand) Balance Analyses in the Yellow River Basin in 2009. Procedia Environ. Sci. 2012, 13, 1956–1965. [Google Scholar] [CrossRef] [Green Version]
  6. Kallioras, A.; Pliakas, F.; Diamantis, I. The legislative framework and policy for the water resources management of transboundary rivers in Europe: The case of Nestos/Mesta River, between Greece and Bulgaria. Environ. Sci. Policy 2006, 9, 291–301. [Google Scholar] [CrossRef]
  7. Sneddon, C.; Fox, C. Rethinking transboundary waters: A critical hydropolitics of the Mekong basin. Political Geogr. 2006, 25, 181–202. [Google Scholar] [CrossRef]
  8. Zhong, F.L.; Xu, Z.M.; Watian, S.P.; Li, J.; Qiushan, Z.H. Analysis on the change of water division policy and system in Heihe River Basin. Water Conserv. Econ. 2014, 32, 37–42+73. [Google Scholar]
  9. Shams, A.K.; Muhammad, N.S. Towards sustainable transboundary water cooperation between Afghanistan and Pakistan: A case study of Kabul River. Ain Shams Eng. J. 2023, 14, 101842. [Google Scholar] [CrossRef]
  10. Sheng, J.C.; Qiu, W.G. Inter-basin water transfer policies and water-use technical efficiency: China’s South-North Water Transfer Project. Socio-Econ. Plan. Sci. 2023, 85, 101432. [Google Scholar] [CrossRef]
  11. Mylopoulos, Y.A.; Kolokytha, E.G. Integrated water management in shared water resources: The EU Water Framework Directive implementation in Greece. Phys. Chem. Earth Parts A/B/C 2008, 33, 347–353. [Google Scholar] [CrossRef]
  12. Chikozho, C. Pathways for building capacity and ensuring effective transboundary water resources management in Africa: Revisiting the key issues, opportunities and challenges. Phys. Chem. Earth Parts A/B/C 2014, 76–78, 72–82. [Google Scholar] [CrossRef]
  13. Rai, S.P.; Sharma, N.; Lohani, A.K. Risk assessment for transboundary rivers using fuzzy synthetic evaluation technique. J. Hydrol. 2014, 519, 1551–1559. [Google Scholar] [CrossRef]
  14. Čerkasova, N.; Umgiesser, G.; Ertürk, A. Modelling framework for flow, sediments and nutrient loads in a large transboundary river watershed: A climate change impact assessment of the Nemunas River watershed. J. Hydrol. 2021, 598, 126422. [Google Scholar] [CrossRef]
  15. Li, D.N.; Zhao, J.S.; Govindaraju, R.S. Water benefits sharing under transboundary cooperation in the Lancang-Mekong River Basin. J. Hydrol. 2019, 577, 123989. [Google Scholar] [CrossRef]
  16. Avarideh, F.; Attari, J.; Moridi, A. Modelling Equitable and Reasonable Water Sharing in Transboundary Rivers: The Case of Sirwan-Diyala River. Water Resour. Manag. 2017, 31, 1191–1207. [Google Scholar] [CrossRef]
  17. Yuan, L.; He, W.J.; Degefu, D.M.; Liao, Z.Y.; Wu, X.; An, M.; Zhang, Z.F.; Ramsey, T.S. Transboundary water sharing problem; a theoretical analysis using evolutionary game and system dynamics. J. Hydrol. 2019, 582, 124521. [Google Scholar] [CrossRef]
  18. Li, J.Y.; Cui, L.B.; Dou, M.; Ali, A. Water resources allocation model based on ecological priority in the arid region. Environ. Res. 2021, 199, 111201. [Google Scholar]
  19. Dadmand, F.; Naji-Azimi, Z.; Farimani, N.M.; Davary, K. Sustainable allocation of water resources in water-scarcity conditions using robust fuzzy stochastic programming. J. Clean. Prod. 2020, 276, 123812. [Google Scholar] [CrossRef]
  20. Yang, Z.F.; Sun, T.; Cui, B.S.; Chen, B.; Chen, G.Q. Environmental flow requirements for integrated water resources allocation in the Yellow River Basin, China. Commun. Nonlinear Sci. Numer. Simul. 2009, 14, 2469–2481. [Google Scholar] [CrossRef]
  21. Wei, S.K.; Zhao, J.D.; Tong, X.G. Impacts of socio-economic status and environmental attitudes of locals on E-flow allocation in Weihe River Basin, China. HydroResearch 2020, 3, 158–165. [Google Scholar] [CrossRef]
  22. Di, D.Y.; Wu, Z.N.; Wang, H.L.; Huang, S.Q. Multi-objective optimization for water allocation of the Yellow River basin based on fluid mechanics, emergy theory, and dynamic differential game. J. Clean. Prod. 2021, 312, 127643. [Google Scholar] [CrossRef]
  23. Jia, S.F.; Liang, Y. Suggestions for strategic allocation of the Yellow River water resources under the new situation. Resour. Sci. 2020, 42, 29–36. [Google Scholar] [CrossRef]
  24. Zuo, Q.T.; Wu, B.B.; Zhang, W.; Ma, J.X. A method of water distribution in transboundary rivers and the new calculation scheme of the Yellow River water distribution. Resour. Sci. 2020, 42, 37–45. [Google Scholar] [CrossRef]
  25. Wang, Y.; Peng, S.M.; Zheng, X.K.; Shang, W.X.; Jiang, G.Q.; Zhou, X.N. Adaptability assessment and promotion strategy of the Yellow River water allocation scheme. Adv. Water Sci. 2019, 30, 632–642. [Google Scholar]
  26. Jiang, X.H.; Xia, J.; Huang, Q.; Long, A.H.; Dong, G.T.; Song, J.X. Adaptability analysis of the Heihe River “97” Rater Diversion Scheme. Acta Geogr. Sin. 2019, 74, 103–116. [Google Scholar]
  27. Zuo, Q.T.; Zhao, H.; Mao, C.C.; Ma, J.X.; Cui, G.T. Quantitative analysis of human-water relationships and harmony-based regulation in the Tarim River Basin. J. Hydrol. Eng. 2015, 20, 05014030. [Google Scholar] [CrossRef]
  28. Zuo, Q.T.; Han, C.H.; Liu, J.; Ma, J.X. A new method for water quality assessment: By harmony degree equation. Environ. Monit. Assess. 2018, 190, 162. [Google Scholar] [CrossRef]
  29. Ahmadi, M.S.; Sušnik, J.; Veerbeek, W.; Zevenbergen, C. Towards a global day zero? Assessment of current and future water supply and demand in 12 rapidly developing megacities. Sustain. Cities Soc. 2020, 61, 102295. [Google Scholar] [CrossRef]
  30. Schwartz, J.S.J. Near-Earth water sources: Ethics and fairness. Adv. Space Res. 2016, 58, 402–407. [Google Scholar] [CrossRef]
  31. Munguía-López, A.C.; Sampat, A.; Rubio-Castro, E.; Ponce-Ortega, J.M.; Zavala, V. Fairness-guided design of water distribution networks for agricultural lands. Comput. Chem. Eng. 2019, 130, 106547. [Google Scholar] [CrossRef]
  32. Magiera, E.; Froelich, W. Integrated Support System for Efficient Water Usage and Resources Management (ISS-EWATUS). Procedia Eng. 2014, 89, 1066–1072. [Google Scholar] [CrossRef] [Green Version]
  33. Fantozzi, M.; Popescu, I.; Farnham, T.; Archetti, F.; Mogre, P.; Tsouchnika, E.; Chiesa, C.; Tsertou, A.; Castro Gama, M.; Bimpas, M. ICT for Efficient Water Resources Management: The ICeWater Energy Management and Control Approach. Procedia Eng. 2014, 70, 633–640. [Google Scholar] [CrossRef]
  34. Eyni, A.; Emami Skardi, M.J.; Kerachian, R. A regret-based behavioral model for shared water resources management: Application of the correlated equilibrium concept. Sci. Total Environ. 2021, 759, 143892. [Google Scholar] [CrossRef] [PubMed]
  35. Li, T.; Lu, Q. Thoughts on ecological civilization in Yellow River management: A case study of solving the problem of disconnection of Yellow River. Yellow River Civiliz. Sustain. Dev. 2014, 2, 63–75. [Google Scholar]
  36. Zuo, Q.T. Harmony Theory: Theory, Method and Application; Science Press: Beijing, China, 2016. [Google Scholar]
  37. Liu, T.H. Water allocation scheme of Nan-pan River in Guizhou Province. Heilongjiang Hydraul. Sci. Technol. 2018, 46, 75–77. [Google Scholar]
  38. Zheng, C.J. The Sino-Kazakh transboundary water resources cooperation under the Belt and Road Initiative. Pac. J. 2018, 26, 63–71. [Google Scholar]
  39. Janjua, S.; Hassan, I. Use of bankruptcy methods for resolving interprovincial water conflicts over transboundary river: Case study of Indus River in Pakistan. River Res. Appl. 2020, 36, 1334–1344. [Google Scholar] [CrossRef]
  40. Zhang, Y.L.; Lu, Y.Y.; Zhou, Q.; Wu, F. Optimal water allocation scheme based on trade-offs between economic and ecological water demands in the Heihe River Basin of northwest China. Sci. Total Environ. 2020, 703, 134958. [Google Scholar] [CrossRef]
  41. Berhe, F.T.; Melesse, A.M.; Hailu, D.; Sileshi, Y. MODSIM-based water allocation modeling of Awash River Basin, Ethiopia. Catena 2013, 109, 118–128. [Google Scholar] [CrossRef]
  42. Hu, Z.N.; Wei, C.T.; Yao, L.M.; Li, L.; Li, C.Z. A multi-objective optimization model with conditional value-at-risk constraints for water allocation equality. J. Hydrol. 2016, 542, 330–342. [Google Scholar] [CrossRef]
  43. Dai, C.; Qin, X.S.; Chen, Y.; Guo, H.C. Dealing with equality and benefit for water allocation in a lake watershed: A Gini-coefficient based stochastic optimization approach. J. Hydrol. 2018, 561, 322–334. [Google Scholar] [CrossRef]
  44. Xu, J.P.; Lv, C.L.; Yao, L.M.; Hou, S.H. Intergenerational equity based optimal water allocation for sustainable development: A case study on the upper reaches of Minjiang River, China. J. Hydrol. 2019, 568, 835–848. [Google Scholar] [CrossRef]
  45. Saucedo-Ramírez, O.A.; Mahlknecht, J.; González-Bravo, R. Optimization of water allocation networks in highly engineered basins: The case of Guandu River basin, Rio de Janeiro State, Brazil. J. Clean. Prod. 2022, 358, 131787. [Google Scholar] [CrossRef]
  46. Zhu, Y.X.; Liang, S.K.; Yang, F.; Yang, H.M.; Ma, J.X. Research on Harmonious Water Diversion Concept and Real-time Scheduling in Yellow River Irrigation Area. Yellow River 2014, 36, 57–59. [Google Scholar]
Figure 1. The framework of the theoretical system of water distribution in transboundary rivers.
Water 15 01207 g001
Figure 2. A schematic diagram of water distribution principles of transboundary rivers.
Water 15 01207 g002
Figure 3. Calculation process of water distribution in transboundary rivers.
Water 15 01207 g003
Figure 4. Geographical map of the Yellow River basin.
Water 15 01207 g004
Figure 5. An overview map of 70 prefecture-level administrative regions in the Yellow River basin.
Water 15 01207 g005
Figure 6. (a) Water distributions of the six water distribution schemes. (b) The weights of the six water distribution schemes.
Water 15 01207 g006
Figure 7. Results of the Yellow River water distribution scheme with 37 billion m3 of water.
Water 15 01207 g007
Figure 8. Comparison between the new water distribution scheme and the 1987 water distribution scheme.
Water 15 01207 g008
Figure 9. A water distribution scheme for the Yellow River, with a water supply capacity of 30 billion m3.
Water 15 01207 g009
Figure 10. Comparison between the proportion of water allocated under the new scheme, and the proportion of water used in 2017, and projected to be used in 2030, in the Yellow River basin.
Water 15 01207 g010
Table 1. Calculation of raw data for the new water distribution scheme for the Yellow River.
Key IndicatorsUnitQHSCGSNXIMSXSNHASDHB
TJ
2008 water
consumption
100 million m313.820.2434.4641.7675.2433.1846.9554.2276.377.30
2009 water
consumption
100 million m312.540.2533.9140.7681.0332.1945.2157.7780.258.66
2010 water
consumption
100 million m312.070.2534.3038.4980.9635.2543.9358.1881.2810.15
2011 water
consumption
100 million m312.150.2437.2140.2783.1439.0345.3765.3084.9613.60
2012 water
consumption
100 million m310.090.2636.5541.3176.5139.4249.5370.7587.906.80
2013 water
consumption
100 million m310.560.3634.7042.6785.4540.6051.3070.4587.193.47
2014 water
consumption
100 million m310.500.3333.9742.5583.6740.8951.1463.2698.376.38
2015 water
consumption
100 million m310.780.3433.2642.5079.3443.4751.6360.93104.615.19
2016 water
consumption
100 million m311.240.2433.4339.8576.2344.6551.1060.4691.993.71
2017 water
consumption
100 million m311.170.2133.7840.9574.9744.7952.6865.3290.922.30
Forecast water
consumption in 2030
100 million m319.960.5241.8087.59120.2367.6383.0181.74130.196.10
Total population104 persons598.5894.012318.52681.781265.763702.393203.774397.275408.92——
GDP100 million yuan2656.53295.165987.293490.6111,204.3514,911.1519,383.9726,668.6636,479.96——
Basin area104 km215.221.7014.325.145.109.7113.333.621.36——
Notes: The labels “QH”, “SC”, “GS”, “NX”, “IM”, “SN”, “SX”, “HA”, “SD”, “HB”, and “TJ” refer to the provinces and regions of Qinghai, Sichuan, Gansu, Ningxia, Inner Mongolia, Shaanxi, Shanxi, Henan, Shandong, Hebei, and Tianjin, respectively.
Table 2. Calculation results of water distribution and weights of the two water distribution schemes. (100 million m3).
Distribution
Scheme
QHSCGSNXIMSXSNHASDHB
TJ
Weights
Scheme A14.100.4030.4040.0058.6043.1038.0055.4070.00200.40
Scheme B10.920.2626.4945.0468.4039.3947.5551.5377.482.940.60
Disclaimer/Publisher’s Note: The statements, opinions and data contained in all publications are solely those of the individual author(s) and contributor(s) and not of MDPI and/or the editor(s). MDPI and/or the editor(s) disclaim responsibility for any injury to people or property resulting from any ideas, methods, instructions or products referred to in the content.

