Article

Modified Lignocellulosic Waste for the Amelioration of Water Quality: Adsorptive Removal of Congo Red and Nitrate Using Modified Poplar Sawdust

by
Natalija Velić
1,
Marija Stjepanović
1,*,
Stefan Pavlović
2,
Saeed Bagherifam
3,
Predrag Banković
2 and
Nataša Jović-Jovičić
2
1
Faculty of Food Technology Osijek, J. J. Strossmayer University of Osijek, Franje Kuhača 18, 31000 Osijek, Croatia
2
University of Belgrade—Institute of Chemistry, Technology and Metallurgy, National Institute of the Republic of Serbia, Department of Catalysis and Chemical Engineering, Njegoševa 12, 11000 Belgrade, Serbia
3
Northern Analytical Lab Services (NALS)/Environmental & Climate Solutions Innovation Hub, Materials Technology & Environmental Research, University of Northern British Columbia, 3333 University Way, Prince George, BC V2N 4Z9, Canada
*
Author to whom correspondence should be addressed.
Water 2023, 15(21), 3776; https://doi.org/10.3390/w15213776
Submission received: 15 September 2023 / Revised: 25 October 2023 / Accepted: 26 October 2023 / Published: 28 October 2023

Abstract

:
Since the synthetic dye Congo red and nitrate are notorious contributors to water pollution due to their persistent and potentially toxic nature, it is necessary to develop new efficient methods to remove them from water bodies. Native lignocellulosic materials as biosorbents are mostly inferior, i.e., the adsorption capacities of native materials are lower. Therefore, attempts have been made to improve the adsorption capacities of such materials by physical and/or chemical methods, including the production of biochar. In this study, adsorptive removal was investigated using a novel biosorbent (mPWS) obtained by modifying poplar (waste) sawdust through quaternisation. The characterisation of mPWS included SEM/EDX, FTIR, and MIP analysis. The adsorption of CR and nitrate onto mPWS was studied in a batch system, as a function of contact time (1–240 min), biosorbent concentration (1–8 g·dm−3), and initial adsorbate concentration (25–200 mg·dm−3). In all experiments, a high removal of both adsorbates, from 60 to over 90%, was achieved. Langmuir and Freundlich adsorption isotherm models were used in order to describe equilibrium adsorption data, while pseudo-first-order and pseudo-second-order kinetic models, and the intraparticle diffusion model, were used to describe possible adsorption mechanisms. The Langmuir model fit the adsorption data of CR well, while the nitrate adsorption process was better interpreted with the Freundlich isotherm model. The kinetics data for both CR and nitrate agreed with the pseudo-second-order kinetics model, while analysis using the intraparticle diffusion model indicated two rate-limiting steps during the adsorption process. Based on the results, it can be concluded that the tested novel biosorbent can be effectively used for the removal of CR and nitrate from water (with its adsorption capacities being 70.3 mg·g−1 and 43.6 mg·g−1, respectively).

1. Introduction

Over the past century, water pollution has posed global environmental challenges, threatening not only the aquatic ecosystem but also public health on a massive scale. Of the vast array of pollutants, Congo red dye is widely used in industry, while nitrates are generally associated with the global use of nitrogen fertilizer in agriculture. Consequently, they have emerged as notorious contributors to water pollution, due to their persistent and potentially toxic nature.
Congo red (CR), a quintessential synthetic azo dye, is chemically designated as the sodium salt of 3, 3′-([1,1′-biphenyl]-4,4′-diyl) bis (4-aminonaphthalene-1-sulfonic acid) [1]. This compound finds extensive application in sectors such as the print industry, pigmentation, lumber, textiles, and in dyeing processes, as well as plastic manufacturing [1,2]. Although CR has been widely used in various industries, it is intrinsically toxic, imperilling both human and aquatic life through entering food webs, due to its resistance to biodegradation and accumulation in environmental systems. Furthermore, azo dyes are known as the substances whose cleavage products, such as aromatic amines, are considered mutagenic, and CR is even carcinogenic for humans, due to the presence of aromatic amine groups [3]. The importance of nitrate and CR elimination from water bodies necessitates the continual enhancement and optimization of prevailing methodologies. A promising strategy is the use of natural renewable resources to fabricate efficient adsorbents.
Nitrate is predominantly introduced into water bodies through agricultural runoff loaded with nitrogen-based fertilizers. Its presence in drinking water at levels exceeding the World Health Organization’s (WHO) maximum allowable concentration of 10 mg/L might lead to a condition known as methemoglobinemia or ‘blue baby syndrome’ in infants [4,5]. Moreover, elevated concentrations of nitrate (and phosphate) in water bodies can disrupt aquatic ecosystems, causing eutrophication, a process that leads to the depletion of oxygen in water, thereby impacting aquatic life adversely. Hence, the removal of nitrate ions from aqueous solutions poses a worldwide environmental challenge due to their high water-solubility.
Amid these challenges, the development of innovative, cost-effective, and sustainable water treatment strategies is gaining momentum. Consequently, multifarious physicochemical strategies for the removal of CR and nitrate from aqueous solutions have been investigated and refined, to name a few: ion exchange [6], reverse osmosis [7], and electrodialysis [8], as well as adsorption using a wide array of materials, including organosilicates [9], organoclays [5], chitin [10], Fe and Cr hydroxides [11], chitosan [12], and silica [13].
Numerous endeavours have been undertaken to modify lignocellulosic industrial by-products for the amelioration of water quality. The food production sector produces a substantial quantity of residue, often perceived as having minimal economic value and potentially contributing to ecological degradation [14]. The affinity between the adsorbates and the inherent functional groups within these lignocellulosic waste derivatives substrates, such as hydroxyl (-OH) and carboxyl (-COOH) groups, determine the industrial applications and efficiency of lignocellulosic by-products. While these functional moieties are ubiquitous among lignocellulosic materials, their prevalence varies based on the specific waste material. To augment the surface characteristics of these adsorbents or to amplify the count of accessible functional groups conducive for adsorptive engagements, extensive research has explored various refinement techniques for lignocellulosic residues. This includes treatments with both inorganic and organic acids, basic solutions, saline mixtures, oxidizing agents, and a plethora of other chemical compounds [14,15]. Sawdust, a wood industry byproduct, stands out due to its wide availability, renewability, and unique structure conducive to absorption and modification. However, despite its potential, it suffers from a few limitations, such as its hydrophobic nature and limited active sites, which might restrict its efficiency as an adsorbent in its raw form [16]. Therefore, the strategy of chemically modifying the sawdust to improve its adsorption capacity comes into play.
In this study, we have attempted to address these issues, and propose the use of chemically modified poplar sawdust, using epichlorohydrin, ethylenediamine, and triethylamine, for the effective removal of Congo red and nitrate from water. This research presents a detailed investigation into the synthesis, characterization, and adsorptive performance of modified poplar sawdust. We aim to underscore its potential as an economical and efficient biosorbent for water treatment, contributing to the broader understanding and advancement of using modified lignocellulosic waste materials in water pollution control. Our findings offer valuable insights into the practicalities of using chemically modified poplar sawdust for water treatment.

2. Experimental

2.1. Materials and Methods

2.1.1. Modification of Lignocellulose Material

Poplar waste (Populus euroamericana, Dode-Guinier) biomass/sawdust (PWS) was kindly donated by “Hrvatske šume d.o.o.”. The sample was oven dried at 50 °C for 48 h and passed through the sieve, with a mesh size of 1 mm, using a vibratory sieve shaker (AS 200 Digit, Retsch GmbH, Haan, Germany) to ensure the particle size of the sample was below 1 mm.
The chemical modification of the poplar sawdust was performed by mixing 2 g of poplar sawdust with 16 cm3 of N,N-dimethylformamide (Gram-Mol, Zagreb, Croatia) and 13 cm3 epichlorohydrin (Sigma Aldrich, Darmstadt, Germany) at 70 °C. After 45 min, 2.5 cm3 of ethylenediamine (Sigma Aldrich, Burlington, MA, USA) was added and stirred for another 45 min at 80 °C. The addition of 13 cm3 triethylamine (Fisher Scientific, Loughborough, UK) to the mixture resulted in the introduction of amine groups [17]. This mixture was stirred for 2 h at 80 °C. After the modification procedure, the material (modified poplar waste sawdust—mPWS) was washed with demineralised water and dried at 100 °C for 24 h.

2.1.2. Test Model Pollutants

The textile dye Congo red (CR) (with the molecular formula C32H22N6Na2O6S2; MW = 696.66 g·mol−1) was supplied by Carlo Erba Reagents, France. The CR was of analytical reagent grade with a purity level ≤ 100%. Stock solutions of 1000 mg·dm−3 were prepared by dissolving the appropriate amount of the dye in distilled water.
The KNO3, p.a., (MW = 101.11 g·mol−1) was purchased from Gram-Mol, Croatia. A stock solution of 1000 mg·dm−3 was obtained by dissolving 7.218 g KNO3 in 1 dm3 demineralised water. The solutions of KNO3 and CR used for the calibration and adsorption experiments were prepared by diluting stock solutions with demineralised water.

2.1.3. Characterisation

The surface morphology was examined using SEM (scanning electronic microscopy) analysis (microscope JEOL JSM 6390LV, JEOL, Tokyo, Japan), with the previous application of gold on the samples (BALTEC SCD 005). The SEM was operated at 15 kV with a magnification of 3000. Elemental analysis of the gold-coated sample surface was investigated using an energy-dispersive X-ray spectroscopy (EDX) micro analyser (Oxford Instruments INCA Penta FET-x3, Abingdon, UK).
A Fourier transform infrared (FTIR) spectrometer (Cary 630, Agilent Technologies, Santa Clara, CA, USA) was used for the detection of surface functional groups affecting the adsorption process. The spectra were recorded from 4000 to 500 cm−1.
Mercury Intrusion Porosimetry (MIP) measurements were performed in the fully automated conventional Carlo Erba Porosimeter 2000 instrument (pressure range: 0.1–200 MPa; pores with a diameter between 7.5 and 15,000 nm). The acquisition of analytical data was performed using the Milestone Software 200. Two subsequent intrusion–extrusion runs (run I and run II) were conducted. The samples were evacuated for 2 h in a dilatometer placed in the Macropores Unit 120.
The point of zero charge (PZC) of the adsorbent was determined according to a well-known procedure described in previous literature [18]. Twenty mL of 0.01 M solution of NaCl, previously set with pH values in the range from two to twelve, was added over 20 mg of mPS and shaken for 24 h at 25 °C. After that, the supernatant was separated, and the final pH (pHf) value was measured for each sample. The initial and final pH values were correlated, while the pH of PZC represents the intersection point between the curve pHf vs. pHi and the bisector line.

2.1.4. Batch Adsorption Experiments

The adsorption of CR and NO3 onto chemically modified poplar sawdust (mPWS) was studied in an aqueous solution in a batch system, with respect to contact time, biosorbent concentration, and initial adsorbate concentration. The experimental conditions for each adsorption study are listed in Table 1.
The adsorption experiments of CR and NO3 were performed at 25 °C in a thermostated shaker (Memmert WNE 14 and SV 1422) using a constant volume of adsorbate solution V = 50.00 cm3. After the predetermined adsorption time, the solid phase was separated from the solutions by filtration and centrifugation for 10 min at 17000 rpm (centrifuge MPW M-UNIVERSAL). A pH meter HACH Lange senslONTM + pH31 was used to control the pH of the solution.
A Thermo Scientific Evolution 220 UV-Vis spectrophotometer was used to monitor the CR and NO3 concentrations before and after the adsorption (λmax = 495 nm and λmax = 324 nm, respectively). The amount of the adsorbed CR/NO3 after time t, qt (mg·g−1) was calculated using the following mass balance relationship, given by Equation (1):
q t = ( γ 0 γ t ) · V m ads
where γ0 is the initial adsorbate concentration, γt is the concentration of adsorbates in solution after time t, mads is the mass of the adsorbent (g), and V is the volume of adsorbate solution (dm3).

2.1.5. Adsorption Data Modelling

Langmuir and Freundlich adsorption isotherm models were used in order to describe the equilibrium adsorption data of CR and nitrate onto mPWS. The general non-linear form of the Langmuir equation for adsorption from a solution is given by Equation (2):
q e = q max · K L · γ e 1 + K L · γ e
where γe is the concentration of adsorbate solution at equilibrium (mg·dm−3), qe is the amount of adsorbate per mass of adsorbent at equilibrium (mg·g−1), qmax is the maximum adsorption capacity for monolayer coverage (mg·g−1), and KL is the Langmuir constant (dm3·mg−1), which represents the affinity between the adsorbate and the adsorbent. The Langmuir equilibrium parameter (RL) is given by Equation (3):
R L = 1 1 + K L · γ 0
where γ0 (mg·dm−3) is the highest initial dye concentration.
The Freundlich isotherm is expressed by Equation (4):
q e = K F · γ e 1 / n
where qe is the amount of adsorbate per mass of adsorbent at equilibrium (mg·g−1), KF is the Freundlich constant (mg·g−1·(dm3·mg−1)1/n), γe is the concentration of the adsorbate solution at equilibrium (mg·dm−3), and 1/n is an empirical constant indicating the adsorption intensity of the system.
The experimental data for CR and NO3 adsorption onto mPWS were fitted with the pseudo-first-order kinetics model developed by Lagergen [19], suitable for heterogeneous adsorption systems, and with a pseudo-second-order kinetics model. The Weber and Morris [20] intraparticle diffusion model was also applied to describe the rate-controlling step in the investigate adsorption systems.
The pseudo-first-order kinetic model in non-linear form is given by Equation (5) [21]:
q t = q e ( 1 e k 1 t )
where qt and qe are the amounts of adsorbate adsorbed (mg·g−1) at a predetermined time t and at equilibrium, respectively, and k1 is the pseudo-first-order rate constant (min–1).
The pseudo-second-order model in non-linear form is given by Equation (6) [22]:
q t = q e 2 · k 2 · t 1 + q e · k 2 · t
where qt and qe are the amounts of adsorbate per mass of adsorbent at the time t, and equilibrium (mg·g−1), respectively, and k2 is the pseudo-second-order constant (min–1), also used to describe the rate of adsorption equilibrium [23].
The Weber and Morris intraparticle diffusion model is presented as following Equation (7):
q t = C id + k · t 1 / 2
where Cid is the intercept that represents the boundary layer thickness (mg·g−1) and k is the Weber and Morris constant.

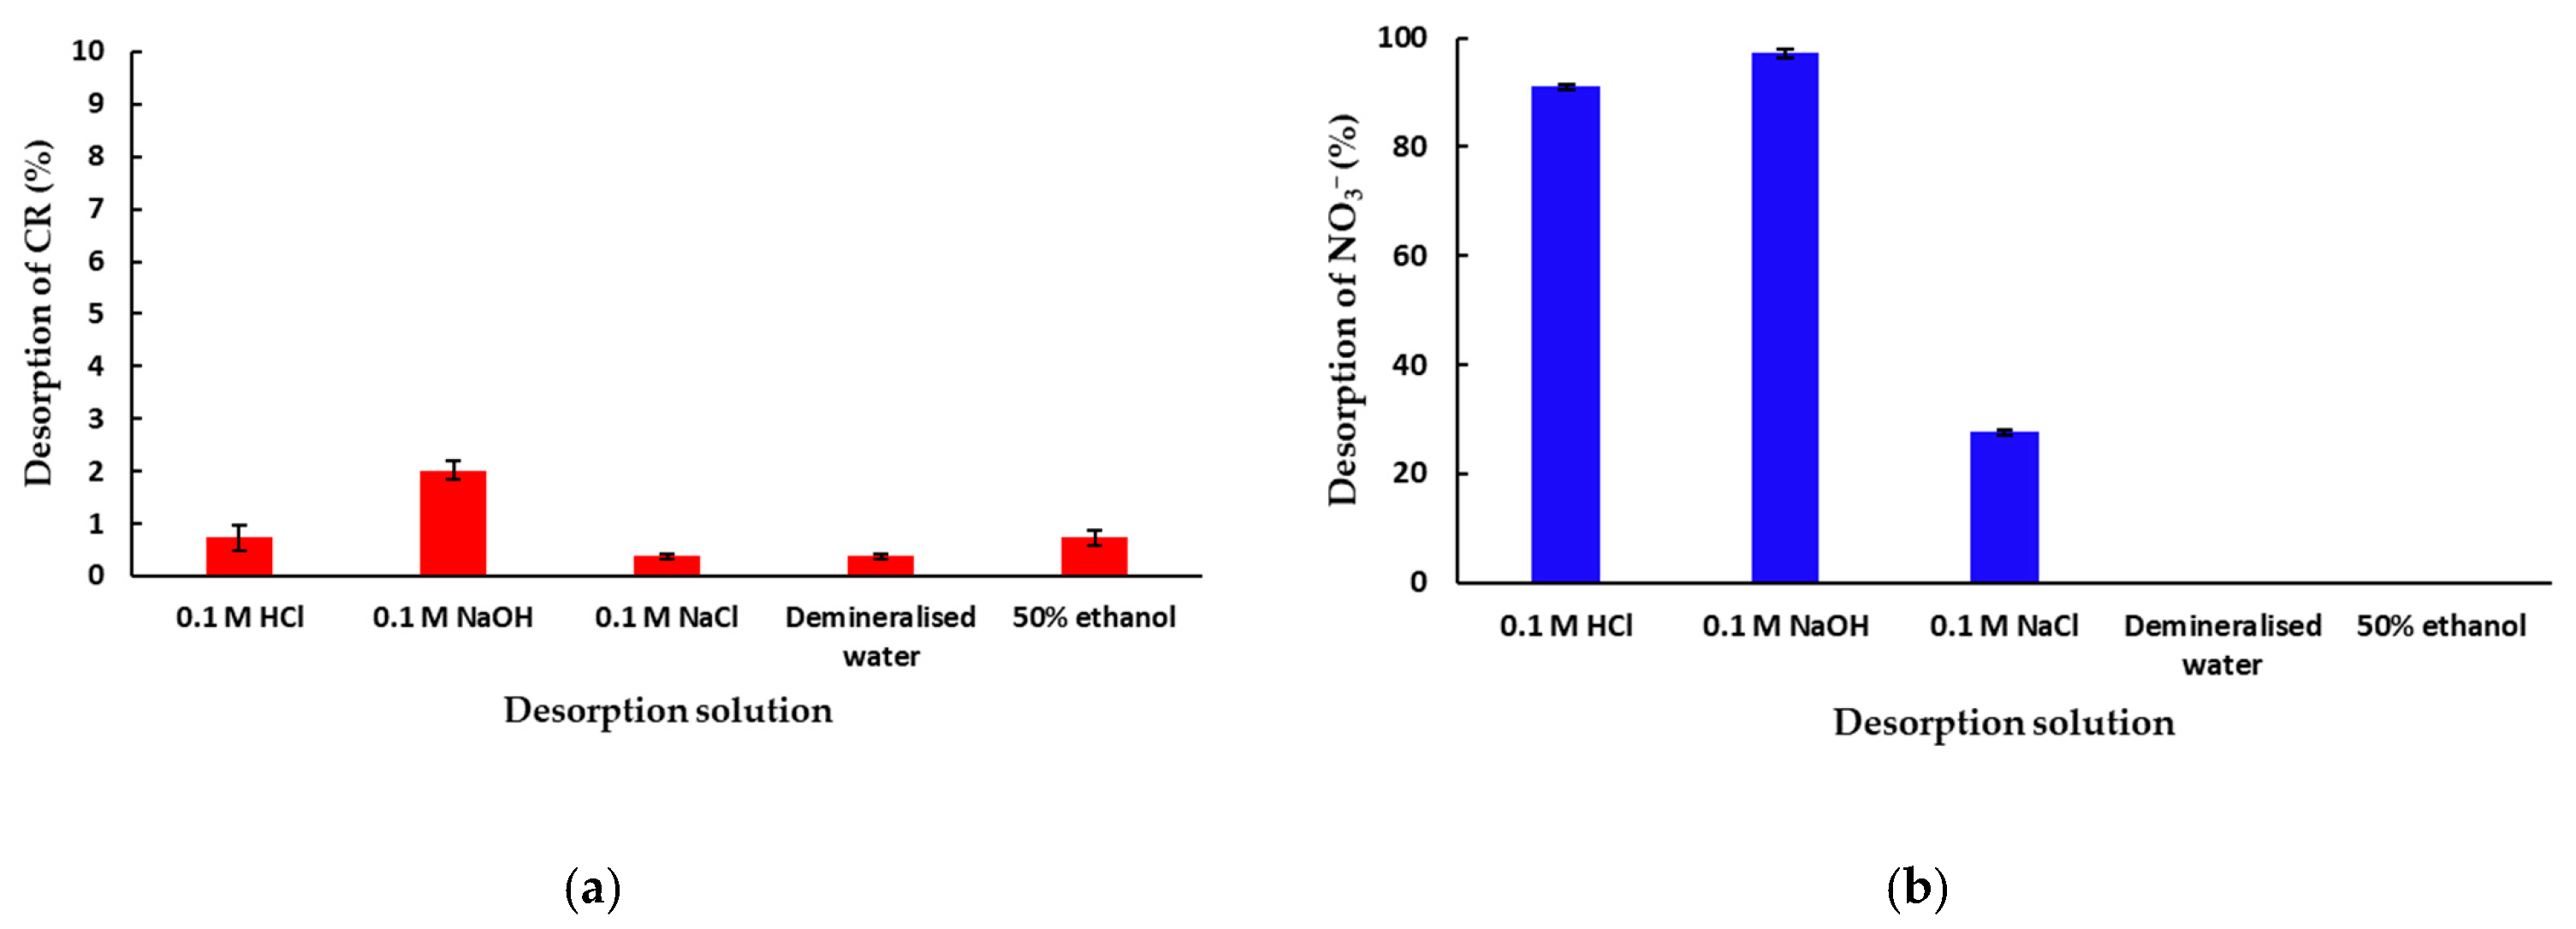
2.1.6. Desorption Experiments

Desorption was performed in order to estimate optimal experimental conditions for potential adsorbents regeneration. Prior to the desorption, the mPWS was saturated by CR/NO3, using 200 mg of mPWS dispersed into 50 mL of CR/NO3 with an initial concentration of 100 mg·dm−3. The adsorption-prior desorption was performed at the native pH of each adsorbate, for 24 h at 25 °C. After saturation, adsorbate/mPWS was separated, washed, and dried at 50 °C until at a constant mass. In desorption experiments, 50 mg of CR/mPWS or NO3/mPWS was dispersed in 50 mL of 0.1 M HCl, 0.1 M NaOH, 0.1 M NaCl, 50% solution of ethanol and demineralised water and shaken for 180 min at 25 °C.
The percent of desorbed CR or NO3 ions (%) was calculated according to Equation (8):
D = ( γ D · V D ) q e · m · 100 %
where γD (mg·dm−3) is the concentration of CR/NO3 ions in the solution after desorption, V (cm3) is volume of the solution, m (mg) is the mass of the saturated mPWS by CR/NO3, and qe (mg·g−1) is the amount of the adsorbed CR/NO3 on the adsorbent.

3. Results and Discussion

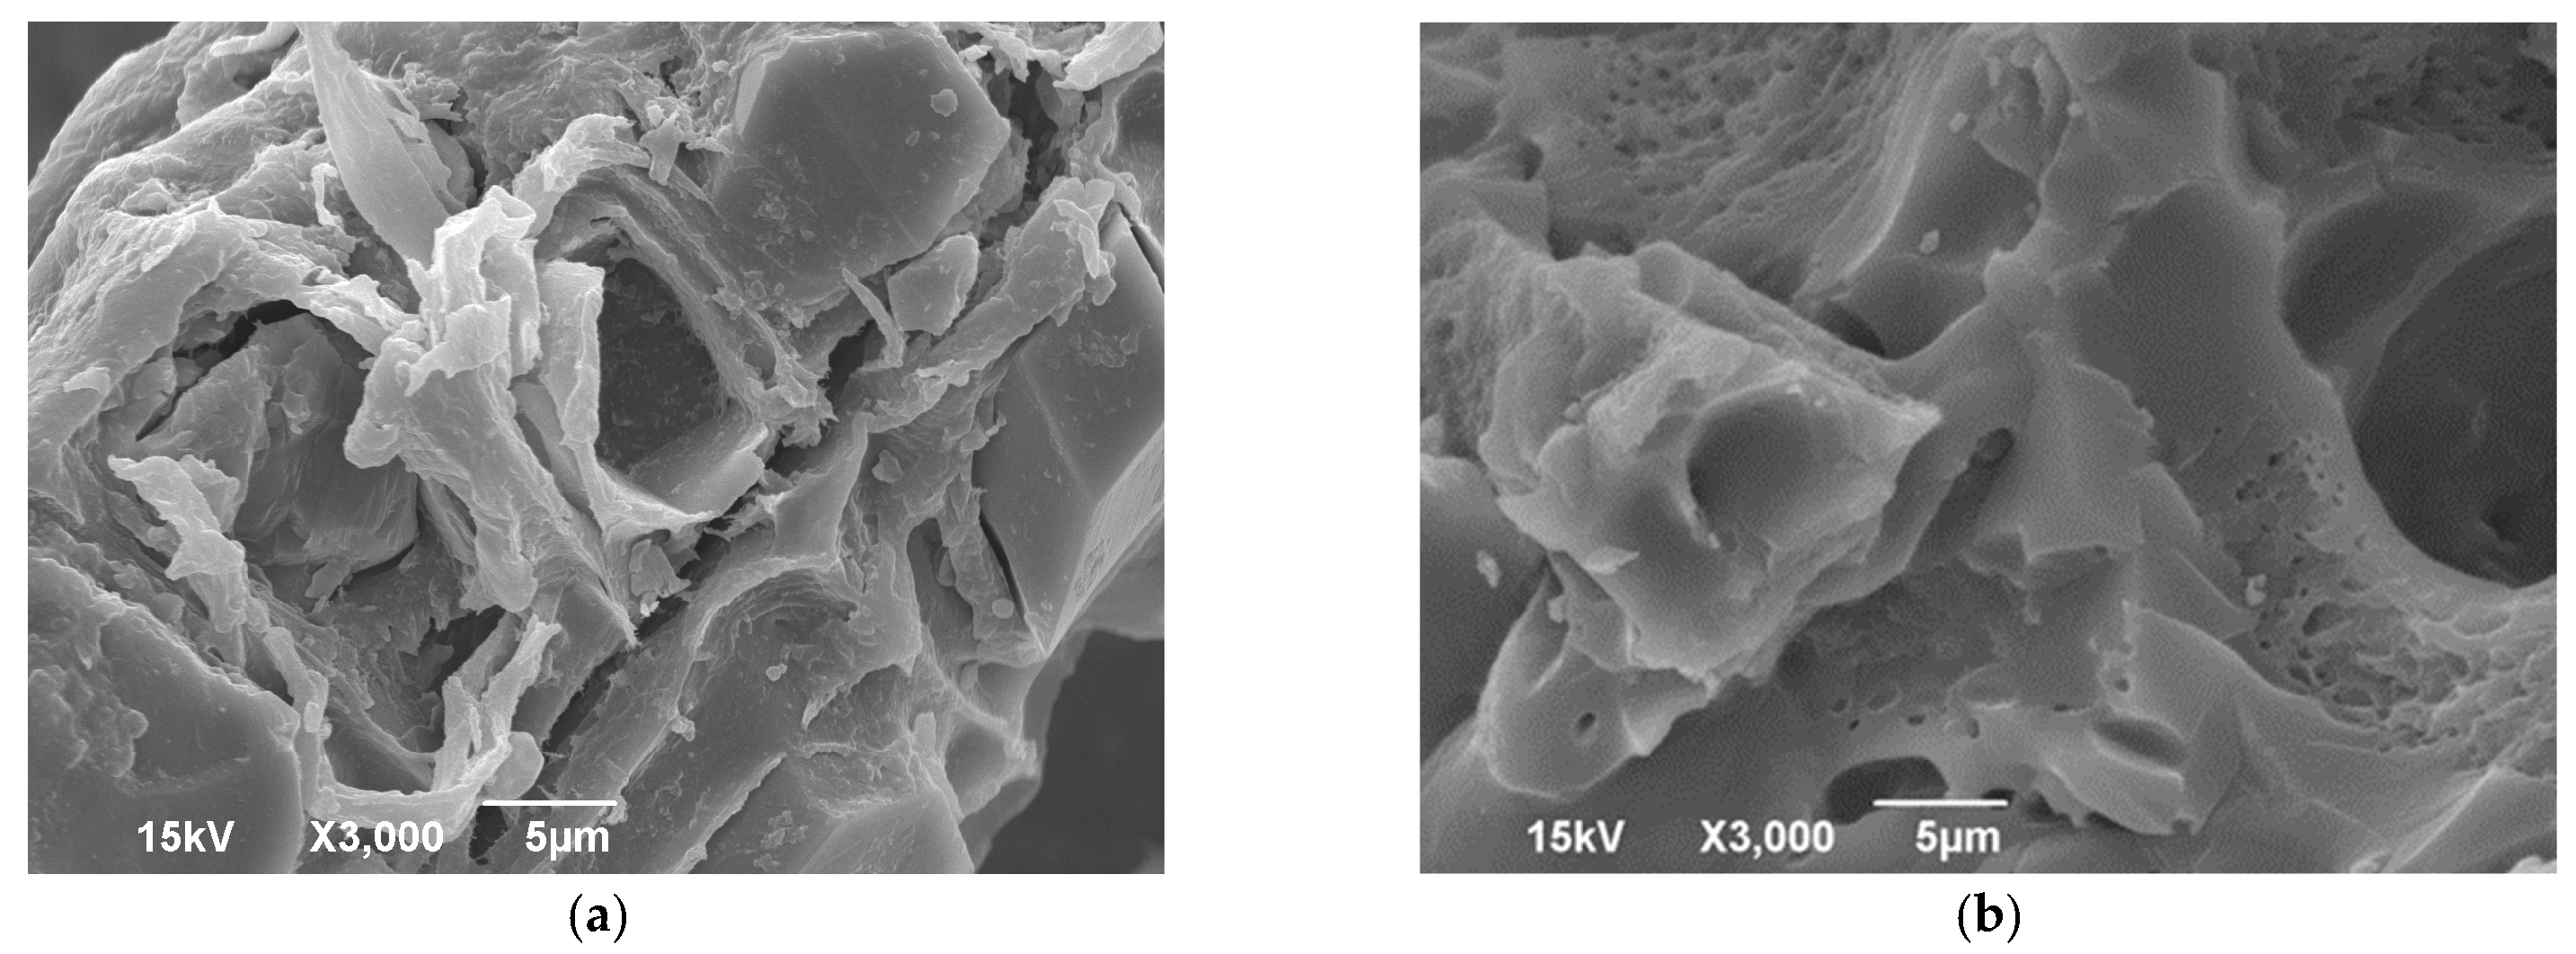
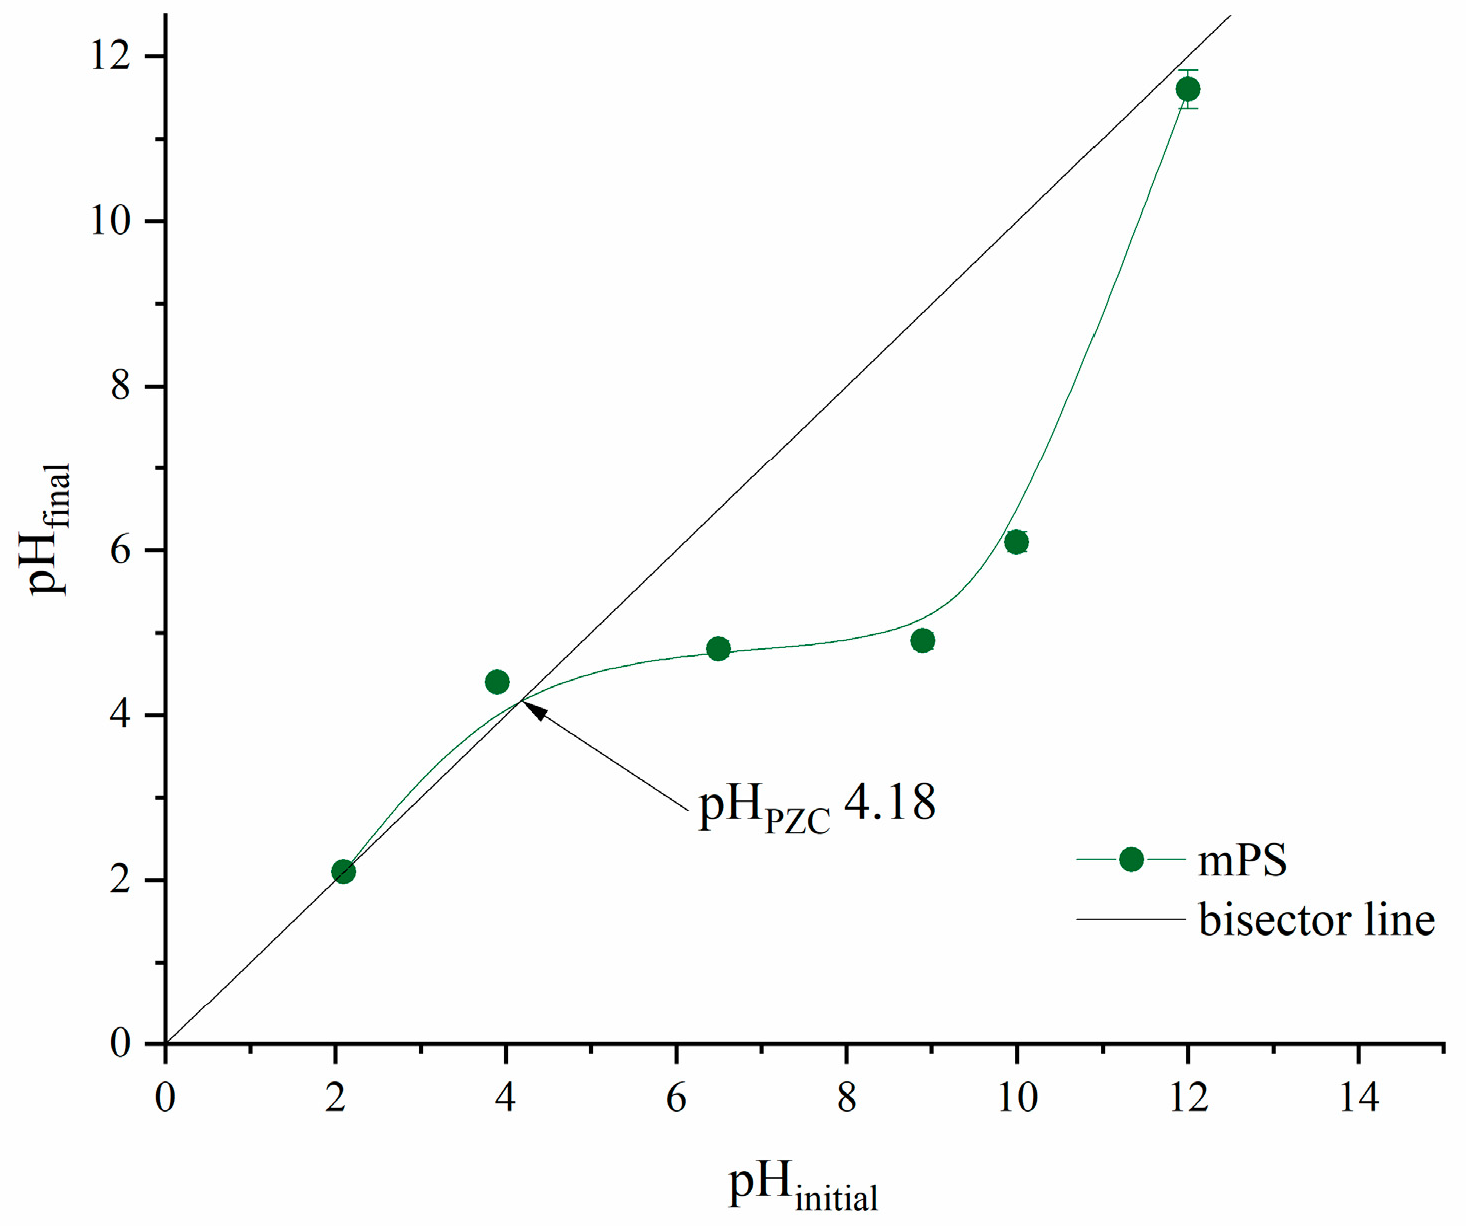
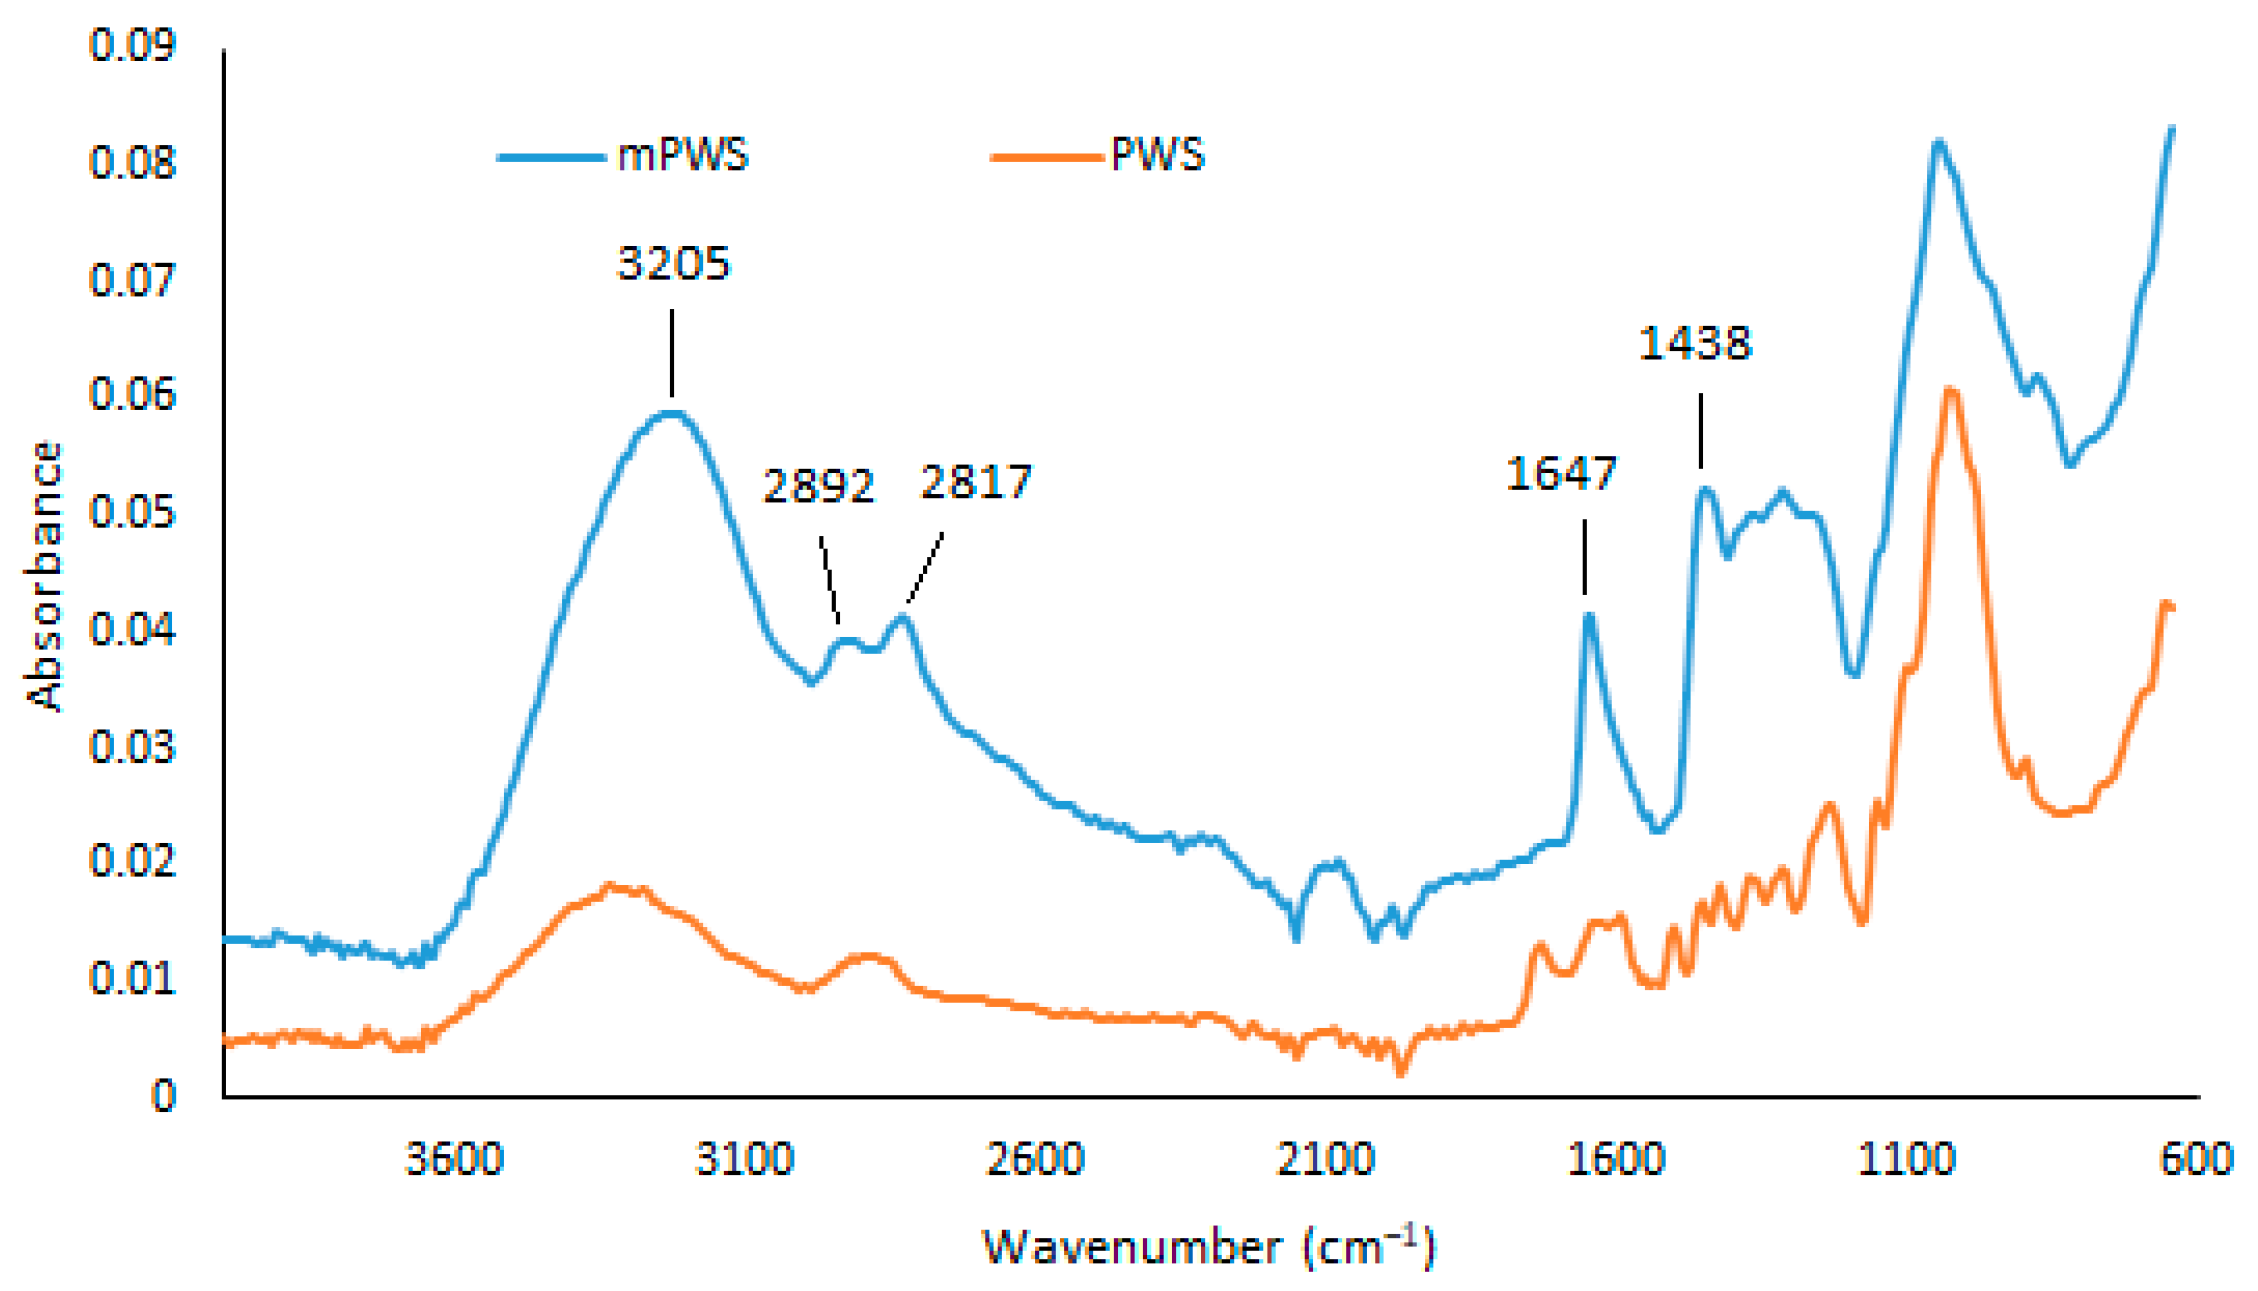
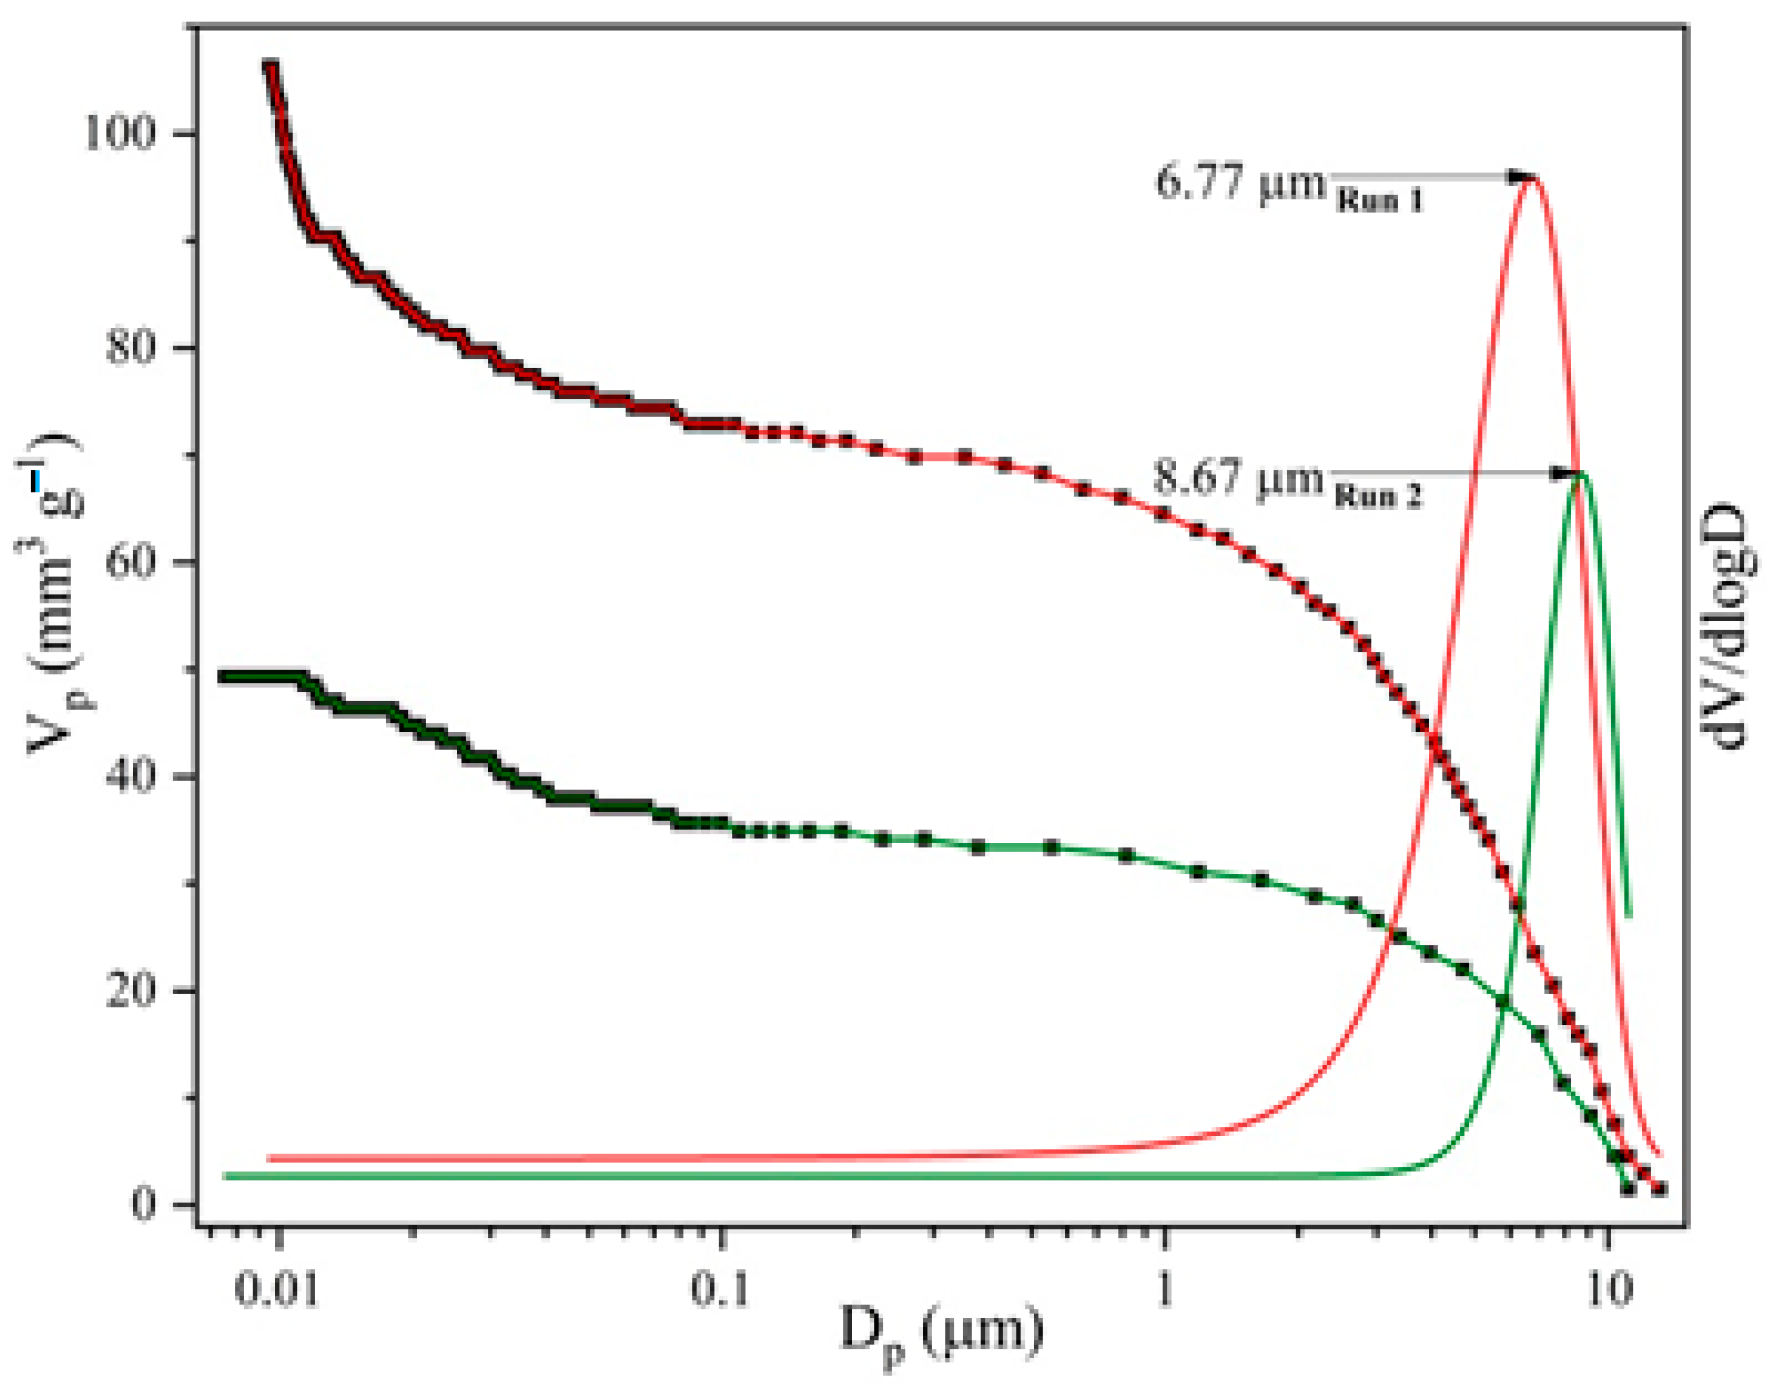
3.1. Characterisation of the Adsorbent

The morphological properties of the biosorbent surface were analysed by SEM imaging. Figure 1 shows more visible pores and cavities in the mPWS compared to native poplar sawdust, which is consistent with other studies using the same modification procedure [24,25]. The results of the EDX analysis (Table 2) show that mPWS contains significant amounts of N and Cl in addition to the C, O, and Ca present in native poplar sawdust. This confirms that the modification process was successful and resulted in the formation of a quaternary ammonium salt, with chlorine as the anion of the salt.
As shown in Figure 2, FTIR analysis of the mPWS reveals a broad vibration band at 3205 cm−1, which represents hydroxyl groups (-OH). The peaks at 2892 cm−1 and 2817 cm−1 can be assigned to the C-H stretching vibrations of the -CH2 and -CH3 groups, respectively. Aromatic cyclic groups could be assigned to the peak at 1647 cm−1, while the peak at 1438 cm−1 could be associated with quaternary ammonium groups, introduced into the native poplar sawdust during the modification procedure. Similar results are also reported elsewhere [26,27].
The MIP results (total pore volume, specific surface area, average pore diameter, bulk density, porosity, and pore size distribution (PSD)) of the synthesized samples are shown in Figure 3 and Table 3, for two consecutive intrusion cycles (I and II).
The importance of the first and second intrusion cycles lies in the removal of voids and interparticle space, which are characteristic of powdery materials. In the first intrusion cycle (run I), mercury fills that space, while in the second intrusion cycle (run II) it fills only the space of accessible pores [28]. The MIP results of the analysed samples indicate the more prominent difference in total intruded Hg volume and porosity (about 54%) between two consecutive runs, which could be ascribed to the presence of interparticle space. However, such a difference is not only a result of the presence of interparticle space, but also of the ink-bottle effect, which significantly affects the trustworthiness of pore size features. In the intrusion cycle, the pressure increase forces mercury to intrude through throat pores to reach interior ink-bottle pores, which cannot be freely extruded out in the extrusion cycle, leaving mercury to remain irreversibly entrapped in the interior ink-bottle pores, making it unavailable for the second intrusion cycle [29]. Generally, the porosity of the analysed sample is low; this is in accordance with the nature of the sample, wood scraps, which present a material made of tiny tracheae and tracheids that carry food through the plant. Also, the value of the specific surface area determined by mercury intrusion porosimetry is very low, which is in agreement both with the value of the total porosity and with the size of the pores that prevail in the analysed sample [30]. The PSD curves (Figure 3) indicate the macropore nature of the analysed sample, the maximum sizes of which are centred at diameters between 7 and 9 µm.
In order to explain the effect of specific pH conditions on the adsorption process, the point of zero charge of mPWS was determined and is shown in Figure 4.
The point of zero charge is the pH value where the surface of the investigated adsorbent is neutral, i.e., it possesses an equal number of electrostatically positive and negative surface groups. According to the results presented in Figure 4, the pH of the PZC is 4.18. At any pH below 4.18, the surface of mPWS is positively charged, which is favourable for the adsorption of pollutants in anionic forms. On the other hand, when the pH value of the adsorbate solution is above 4.18, the mPWS surface has negative charge, and therefore electrostatic interactions with pollutants in cationic form could be accrued.

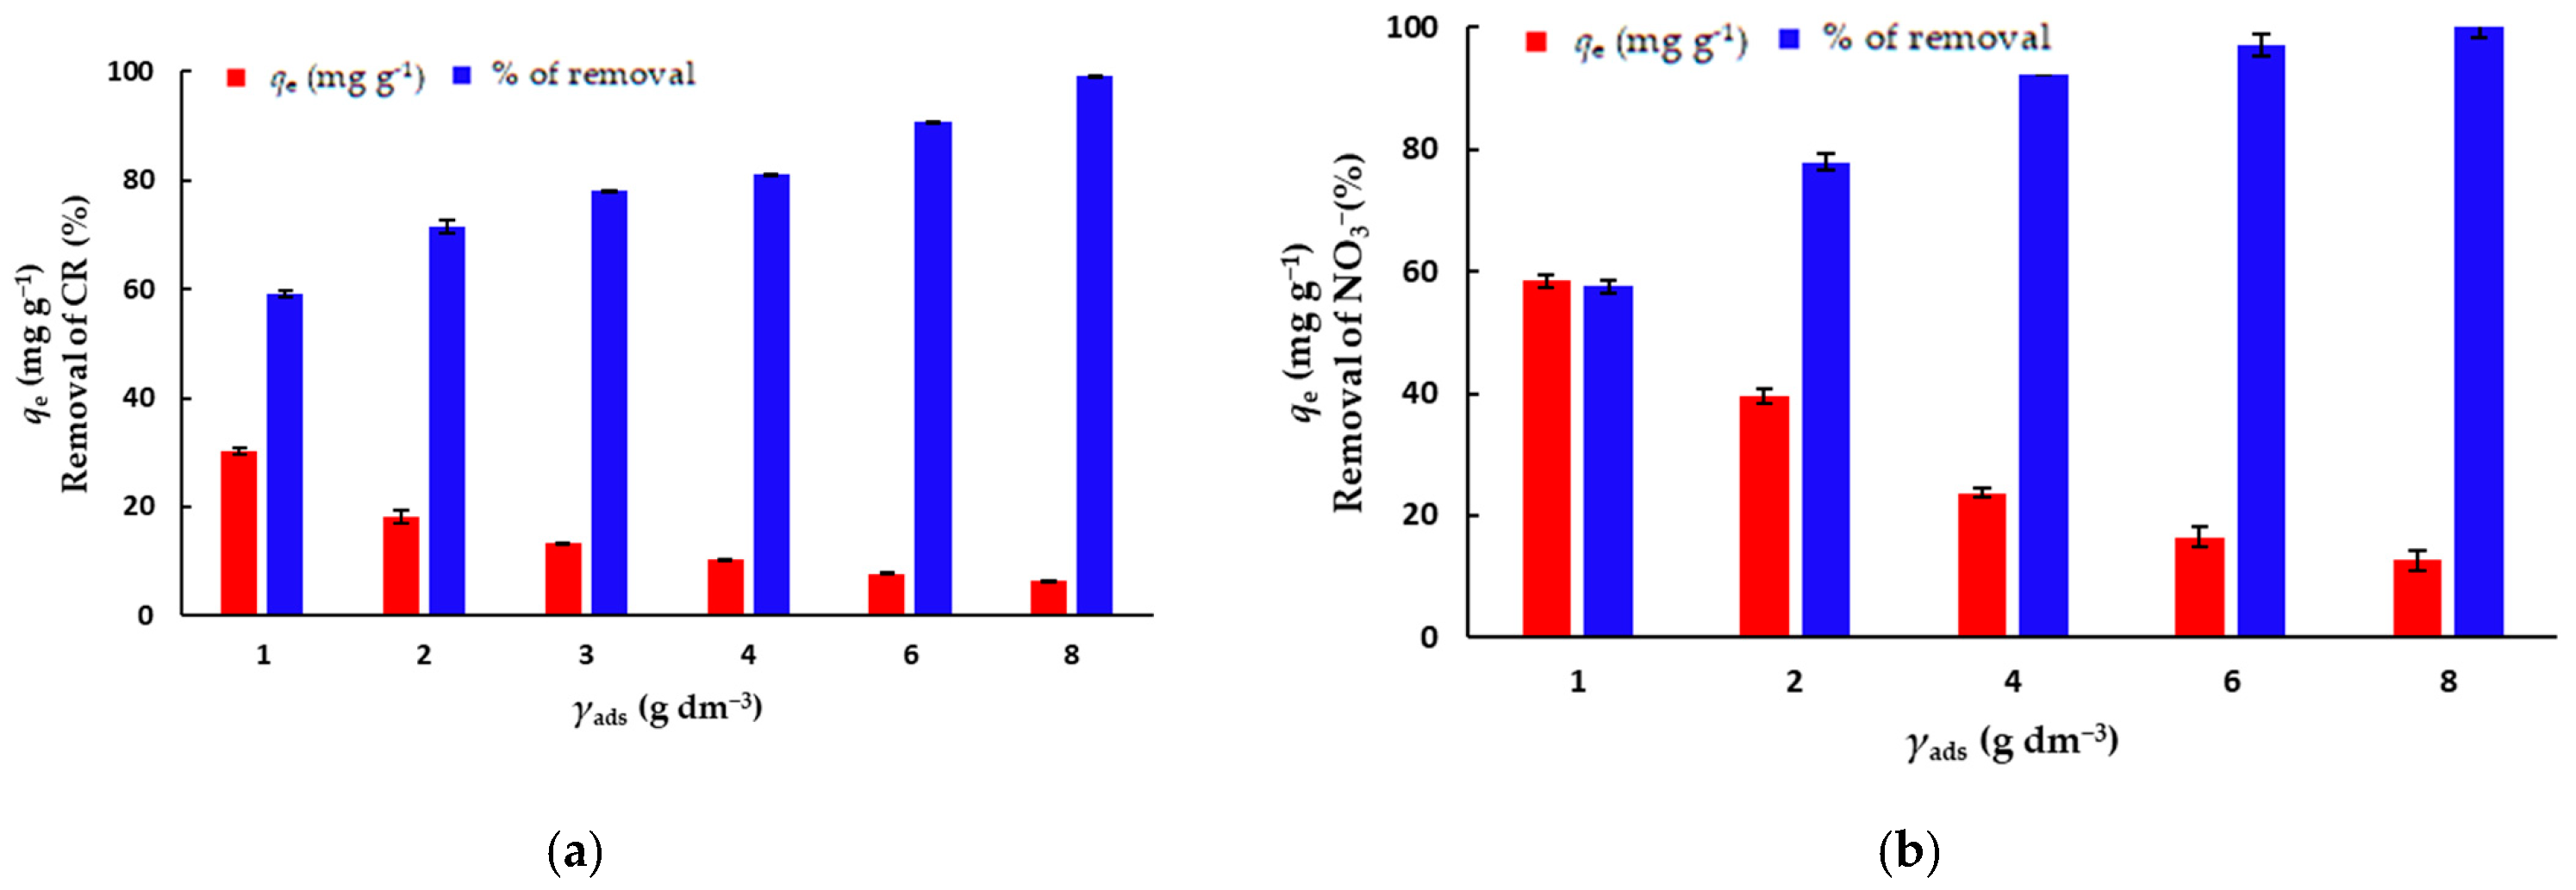
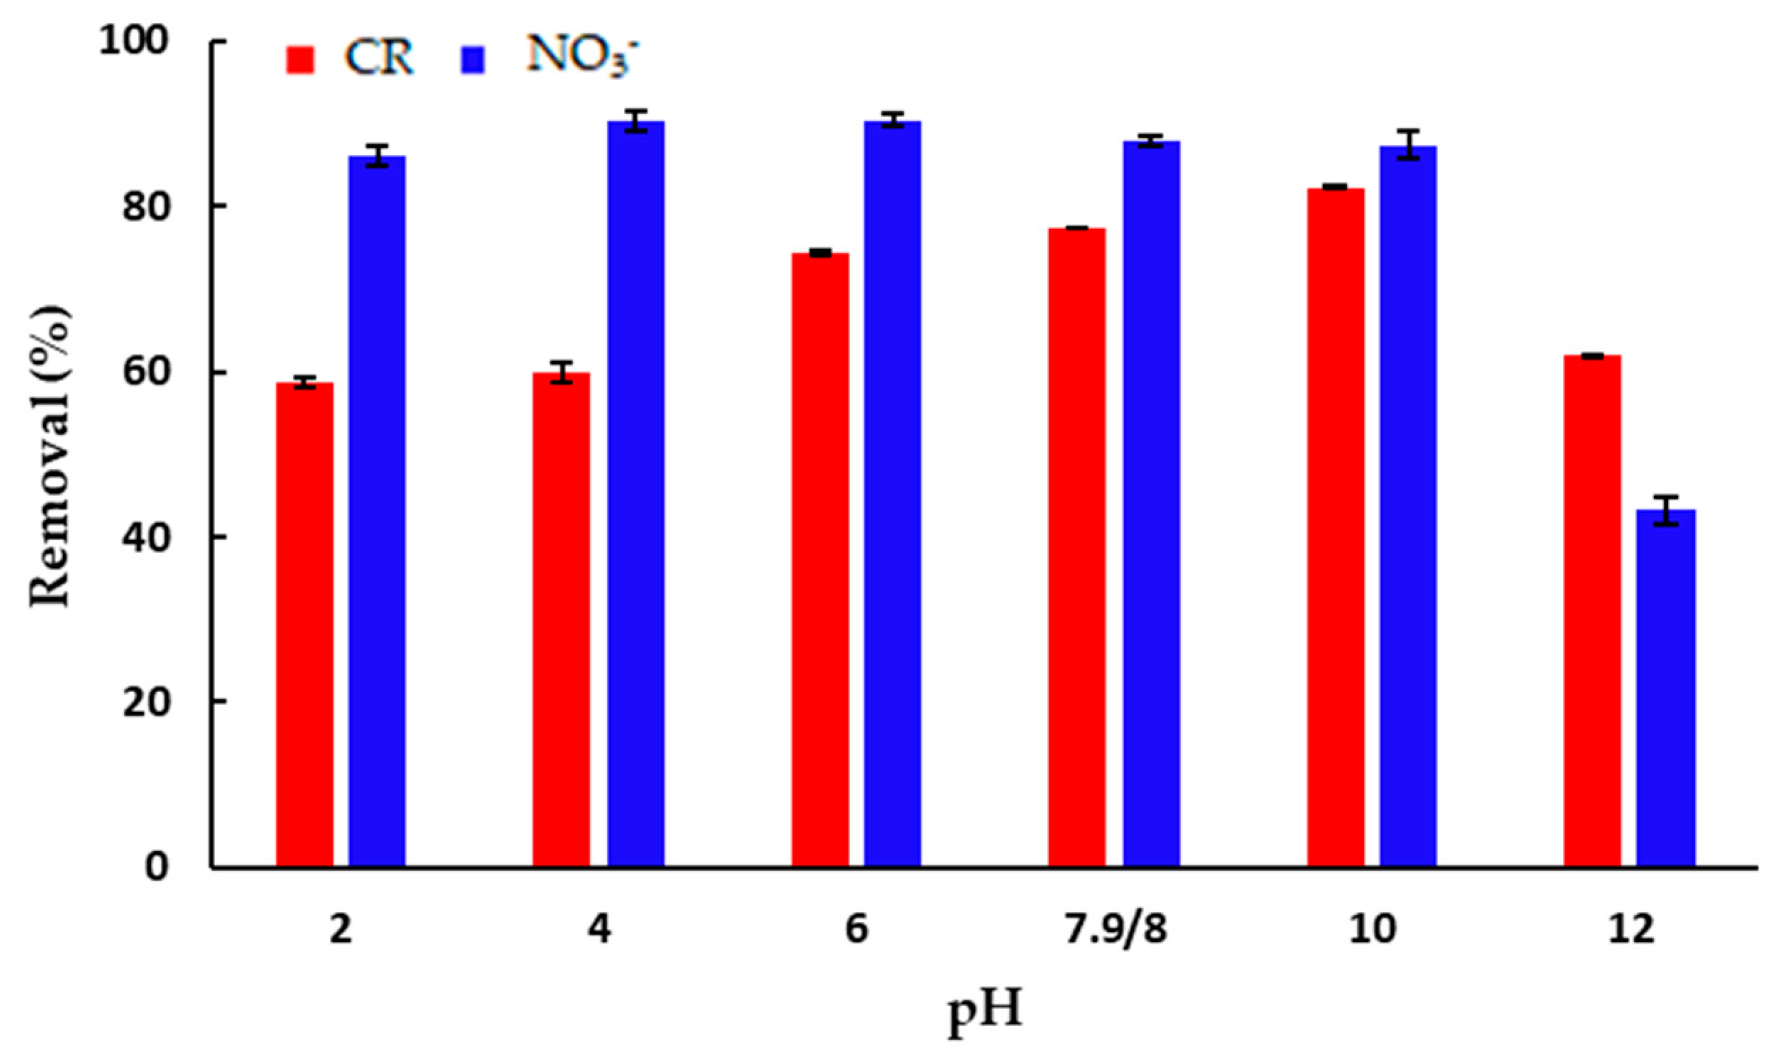
3.2. Batch Adsorption Studies

The concentration of the biosorbent is an important parameter for batch adsorption studies because this factor determines the capacity of an adsorbent for a given initial concentration of the adsorbate [31]. In order to determine the optimal concentration of mPWS to be used in further experiments, the batch adsorption experiments were performed with different mPWS concentrations, ranging from 1 to 8 g·dm−3, for the adsorption of both CR dye and NO3 ions, keeping other adsorption parameters constant (Table 1). The concentrations of the biosorbent for further adsorption experiments were chosen with respect to both the percentage removal of the adsorbate and the amount of adsorbate adsorbed onto the biosorbent (qe), which was 3 g·dm−3 and 4 g·dm−3 for CR and NO3, respectively.
The effects of the biosorbent concentration on the amount of adsorbed pollutant on the equilibrium time (qe) and percentage of removal (%) are shown in Figure 5a,b. The results show that the effect of the biosorbent concentration has a greater impact on the removal of CR than of NO3 ions, as an increase in biosorbent concentration from 1 to 8 g·dm−3 leads to an increase in removal from 59.3% to 99.3%, and from 81.4% to 100%, for CR and NO3 ions, respectively. At the same time, the effect of the amount of the adsorbed CR/NO3 on the equilibrium time follows the opposite trend, which is due to the increase in the mass of the biosorbent (Equation (1)).
One of the most important parameters of the adsorption process is the optimal pH value where the adsorbent efficiency is the highest. The effect of the pH value of the initial solution on the amount of the adsorbed CR and NO3 ions per mass of mPWS is shown in Figure 6.
The percent of adsorption of CR onto mPWS (Figure 6) has the lowest values, close to 60%, in strongly acidic and alkaline conditions, i.e., pH 2 and pH 12. The amount of adsorbed dye increases from mild acidic conditions (pH 6) over the native pH of 7.9, and finally reaches the maximum of adsorbed dye at pH 10. At the optimal pH of 10 for CR, the surface of the adsorbent is dominantly negatively charged (pHPZC = 4.18) while CR exists in anionic form. Based on this, the electrostatic interaction between the adsorbate and the adsorbent cannot be the dominant mechanism of interaction, and other types of interaction, including hydrogen bonding and π-π interaction, also exist. Although the percentage of adsorbed CR at the optimal pH of 10 is over 80%, the adsorption of CR from solution at the native pH of 7.9 is more than 94% of the adsorbed pollutant at the optimal pH. Using this result, performing adsorption at the native pH seems to be reasonable.
The efficiency of adsorption of NO3 anions seems to be almost constant over the pH range from two to ten (Figure 6), and significantly lower in strongly alkaline conditions of pH 12. Although the net surface charge of mPWS is negative above a pH of 4.18, it seems that the amount of positively charged surface groups is enough to remove over 80% of NO3 anions present in the solution under the selected experimental conditions.
In order to investigate the potential of mPWS regeneration after the adsorption of CR and NO3 anions, a desorption study was performed. The effect of selected eluents (0.1 M HCl, 0.1 M NaOH, 0.1 M NaCl, demineralised water and 50% ethanol) on the percentage of the desorbed CR or NO3 ions is presented in Figure 7a,b, respectively.
Based on the result shown in Figure 7a, the desorption of CR from mPWS under the investigated conditions is very low, with the highest value of desorbed CR being 2% from 0.1 M NaOH solution. Additionally, the experiment was performed under the same parameters with organic solvents, namely, isopropanol, acetone, methylene chloride, and n-hexane, and the amount of desorbed CR was found to be even under the values presented in Figure 7a, i.e., below 0.2%. This result indicates a very strong interaction of CR with mPWS, probably via different interaction mechanisms. Therefore, the mPWS cannot be regenerated after CR adsorption using a conventional eluents procedure, and some microbiological or advanced oxidation process for mPWS regeneration can be additionally studied. Alternatively, coloured sawdust can be used in constructions. The results in Figure 7b show very high values of desorption: over 91% with 0.1 M HCl solution, 97% with 0.1 M NaOH solution, and 27% with 0.1 M NaCl solution. No desorption occurred when demineralised water or 50% ethanol was used. This indicates ion exchange is the dominant adsorption mechanism, since the saturated mPWS can be regenerated with HCl, NaOH, and NaCl solutions.

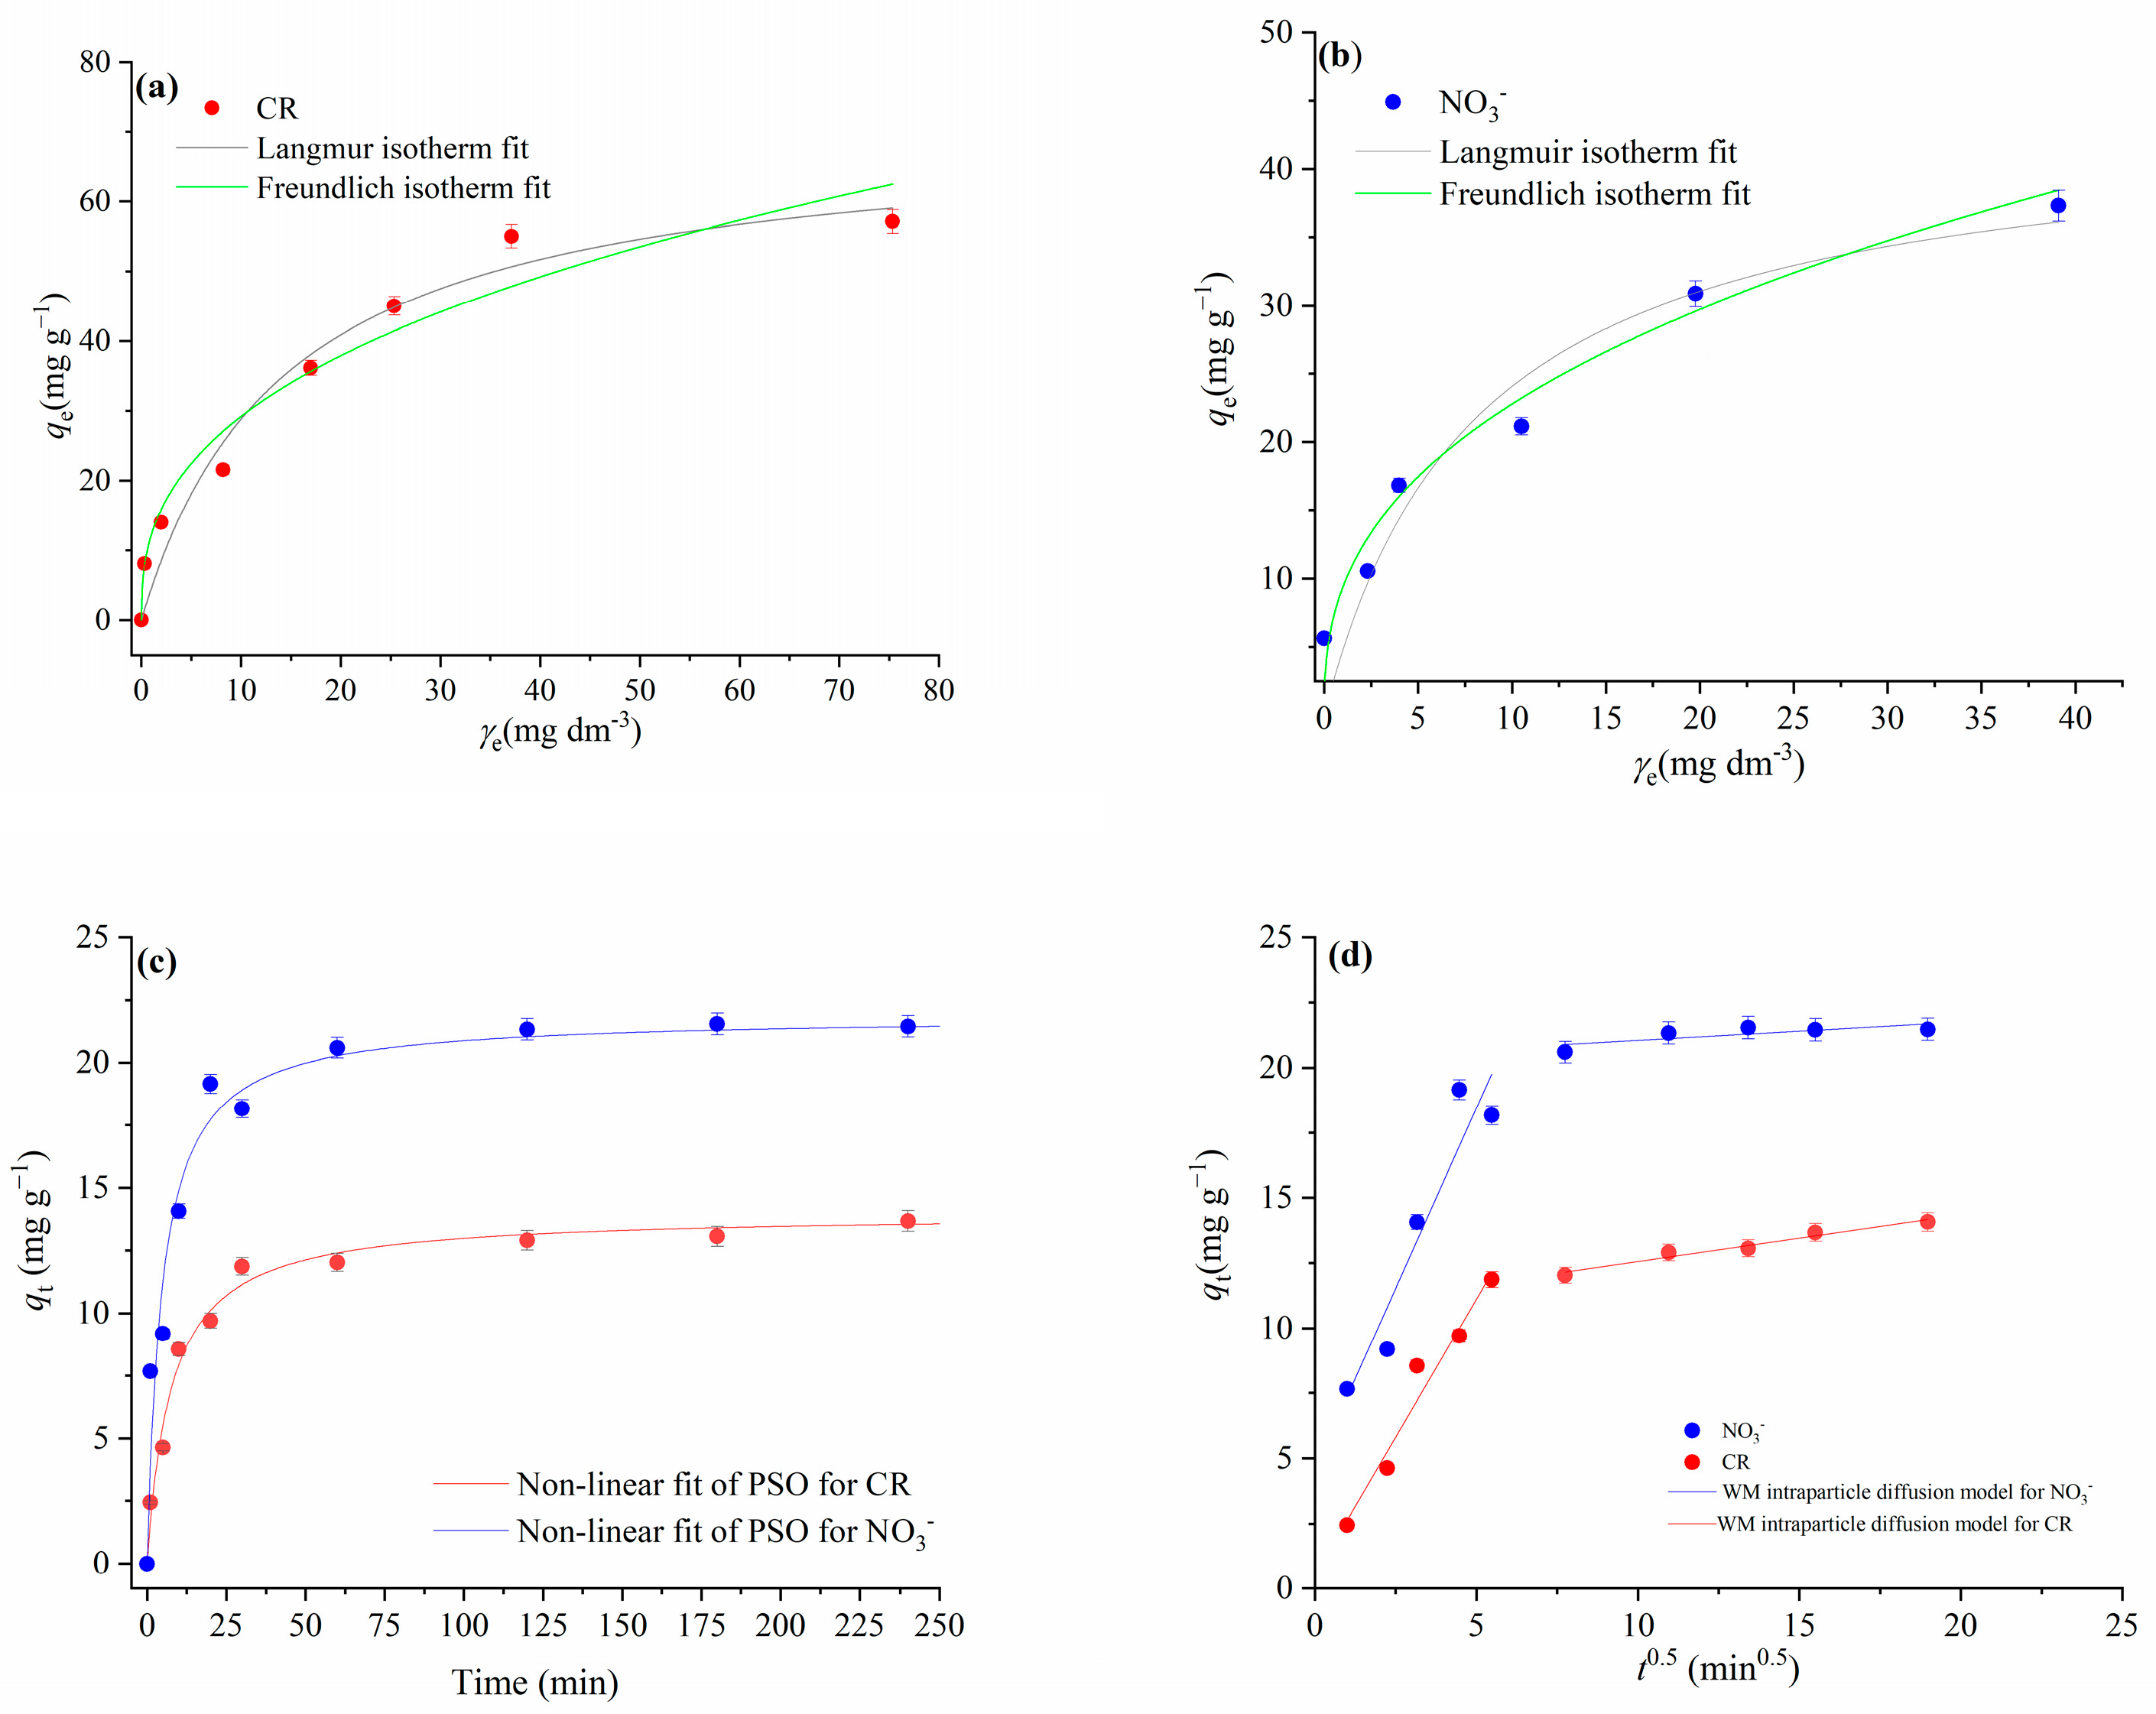
3.3. Isotherm and Kinetic Modelling of the Experimental Adsorption Data

Adsorption isotherms describe how the adsorbate molecules are distributed between the solid and liquid phases in a state of equilibrium and provide information about the adsorption capacity of the adsorbent used [32].
The adsorption isotherms of the Langmuir and Freundlich models for the adsorption of NO3 ions and CR onto mPWS are shown in Figure 8a,b, respectively; Figure 8c represents the non-linear fits of the pseudo-second-order kinetics model, as the most appropriate one for both adsorbates, while the linear fits of adsorption segments for CR and NO3 are presented in Figure 8d.
The calculated parameters for all investigated isotherms and kinetics models are shown in Table 4.
The coefficients of determination (R2) obtained for the CR adsorption show better agreement with the Langmuir isotherm model than the Freundlich isotherm model (Table 4). The Langmuir model for CR adsorption predicted theoretical values of 70.33 mg·g−1 and 0.367 for the adsorption capacity and equilibrium parameter (RL), respectively. Based on these results, CR adsorption onto mPWS can be described as a favourable homogenous process in the form of monolayer surface coverage. On the other hand, the results given in Figure 3b and Table 4 indicate that the adsorption of NO3 followed the Freundlich isotherm model, with a coefficient of determination (R2) value of 0.963, indicating adsorption at energetically heterogeneous adsorption sites.
Research on the kinetics of the adsorption process is important because it provides information on possible adsorption mechanisms and provides a theoretical basis for the development and application of adsorbents on an industrial scale (Gupta and Bhattacharya, 2011). The applicability of the pseudo-first-order kinetic model and pseudo-second-order kinetic model were tested for the adsorption of CR and NO3 ions onto mPWS. The best-fit model was selected based on the obtained values of the linear coefficients of correlation R2 (Table 4). Comparing the R2 values between these two investigated models, higher values were obtained for the non-linear fit of the pseudo-second-order kinetic model for both NO3 and CR adsorption. There is an accepted assumption that adsorption kinetics can be described with the pseudo-second-order model when the interaction between the adsorbate and adsorbents takes place over an ion-exchange reaction on the surface, with respect to the number of adsorption sites available for the exchange [23]. Since the chemically introduced alkylammonium cation groups on the mPSV surface represent cationic active sites for the ion exchange reaction with -SO3 groups CR or NO3, it is possible to consider the ion-exchange adsorption mechanism as the dominant one.
Other possible mechanisms (Figure 9) may include two types of interactions (strong interactions such as hydrogen bonding and electrostatic attraction) and weak interactions (π–π interactions).
The Weber–Morris intraparticle diffusion model was applied on experimental kinetics data in order to predict the rate-limiting step, characteristic of the investigated adsorption systems.
For CR adsorption, there are two linear portions, both with very good linearity agreement, i.e., the coefficients of determination were 0.960 and 0.986 for the first and second linear portion, respectively. The first, sharper portion is attributed to the diffusion of CR through the solution to the external surface of the adsorbent or to the boundary layer diffusion. However, since the Cid (intercept) has a low value of 0.5, the boundary layer effect can be considered negligible [33]. The second linear portion can be attributed to the gradual equilibrium phase, with intraparticle diffusion as the dominant process.
The plot of qt versus t0.5 for the NO3 adsorption (Figure 5d) showed two straight segments. The first one is linear, with the value of the coefficient of determination (R2) being 0.902 (Table 3), but does not pass through the origin, indicating that intraparticle diffusion is not the rate-limiting step. The first slope can be attributed to the diffusion of NO3 through the solution to the external surface of the adsorbent. Since the Cid has a value of 4.60, this value, indicating the effective role of the boundary layer on the adsorption rate, is in agreement with the literature [33]. The second segment for the NO3 adsorption showed poor linearity (R2 = 0.605), therefore cannot be used to depict intraparticle diffusion.

3.4. Adsorption Capacities of Poplar Sawdust-Based Sorbents

The maximum adsorption capacity obtained in this work was 70.3 mg·g−1 and 43.6 mg·g−1 for CR and NO3, respectively. Compared to our previous study [15] using native poplar sawdust to remove CR, with a reported adsorption capacity of 8 mg·g−1, the significant increase in adsorption capacity after chemical modification is evident. Table 5 summarises the adsorption capacities of poplar sawdust-based adsorbents and other biosorbents for various adsorbates, including CR and other synthetic dyes, antibiotics, pesticides, and metals. It can be seen that the adsorption capacity of modified poplar sawdust is higher than that of native poplar sawdust for most adsorbates, which is consistent with our results.

4. Conclusions

Elevated levels of Congo red and nitrate in environmental systems are recognized as posing significant environmental and health hazards. In response to this challenge, poplar sawdust was modified through quaternization to enhance its sorption performance. Through performing adsorption tests, we showed that the quaternised modified poplar sawdust exhibited a high affinity for these contaminants, with removal efficiencies of up to 90% being achieved. Isotherm data were best described by the Langmuir model (CR) and the Freundlich model (nitrate), while the adsorption kinetics were best aligned with the pseudo-second-order mechanism. The maximum adsorption capacity of modified poplar sawdust was found to be 70.3 and 43.6 mg·g−1 for Congo red and nitrate, respectively. The underlying adsorption mechanisms were attributed to two rate-limiting stages, likely driven by ion exchange processes, hydrogen bonding, and electrostatic attractions. From these findings, it is suggested that the tested modified sawdust shows promise as a cost-effective and efficient biosorbent for mitigating the presence of Congo red and nitrate in water systems.

Author Contributions

Conceptualization, N.V., N.J.-J. and M.S.; methodology, N.V., N.J.-J. and M.S.; validation, N.V. and P.B.; formal analysis, N.J.-J., M.S. and S.P.; investigation, N.J.-J., M.S. and S.P.; resources, N.V. and P.B.; writing—original draft preparation, N.J.-J., M.S., S.B. and S.P.; writing—review and editing, N.V. and S.B.; visualization, N.J.-J., M.S. and S.P.; supervision, N.V. and N.J.-J. All authors have read and agreed to the published version of the manuscript.

Funding

This work was financially supported by the Ministry of Science, Technological Development and Innovation of the Republic of Serbia (Grant No. 451-03-47/2023-01/200026) and by the Faculty of Food Technology Osijek, J. J. Strossmayer University of Osijek, Croatia.

Data Availability Statement

The data that support the findings of this study are available from the corresponding author.

Acknowledgments

The authors would like to thank Vladimir B. Pavlović, and Saša Despotović, of the Faculty of Agriculture, University of Belgrade, Serbia, for the SEM/EDX recordings and Mirela Kopjar, of the Faculty of Food Technology Osijek, for FTIR spectra recordings, using equipment funded by project HRZZ- UIP-2013-11-6949.

Conflicts of Interest

The authors declare no conflict of interest.

References

  1. Radoor, S.; Karayil, J.; Parameswaranpillai, J.; Siengchin, S. Removal of anionic dye Congo red from aqueous environment using polyvinyl alcohol/sodium alginate/ZSM-5 zeolite membrane. Sci. Rep. 2020, 10, 15452. [Google Scholar] [CrossRef]
  2. Pielesz, A. The process of the reduction of azo dyes used in dyeing textiles on the basis of infrared spectroscopy analysis. J. Mol. Struct. 1999, 511–512, 337–344. [Google Scholar] [CrossRef]
  3. Jalandoni-Buan, A.C.; Decena-Soliven, A.L.A.; Cao, E.P.; Barraquio, V.L.; Barraquio, W.L. Characterization and identification of Congo red decolorizing bacteria from monocultures and consortia. Philipp. J. Sci. 2010, 139, 71–78. [Google Scholar]
  4. Stjepanović, M.; Velić, N.; Habuda-Stanić, M. Modified Hazelnut Shells as a Novel Adsorbent for the Removal of Nitrate from Wastewater. Water 2022, 14, 816. [Google Scholar] [CrossRef]
  5. Bagherifam, S.; Komarneni, S.; Lakzian, A.; Fotovat, A.; Khorasani, R.; Huang, W.; Ma, J.; Hong, S.; Cannon, F.S.; Wang, Y. Highly selective removal of nitrate and perchlorate by organoclay. Appl. Clay Sci. 2014, 95, 126–132. [Google Scholar] [CrossRef]
  6. Hekmatzadeh, A.A.; Karimi-Jashni, A.; Talebbeydokhti, N.; Kløve, B. Adsorption kinetics of nitrate ions on ion exchange resin. Desalination 2013, 326, 125–134. [Google Scholar] [CrossRef]
  7. Schoeman, J.J.; Steyn, A. Nitrate removal with reverse osmosis in a rural area in South Africa. Desalination 2003, 155, 15–26. [Google Scholar] [CrossRef]
  8. Bi, J.; Peng, C.; Xu, H.; Ahmed, A.-S. Removal of nitrate from groundwater using the technology of electrodialysis and electrodeionization. Desalin. Water Treat. 2011, 34, 394–401. [Google Scholar] [CrossRef]
  9. Seliem, M.K.; Komarneni, S.; Byrne, T.; Cannon, F.S.; Shahien, M.G.; Khalil, A.A.; Abd El-Gaid, I.M. Removal of nitrate by synthetic organosilicas and organoclay: Kinetic and isotherm studies. Sep. Purif. Technol. 2013, 110, 181–187. [Google Scholar] [CrossRef]
  10. Mc Kay, G.; Blair, H.S.; Gardner, J. Rate studies for the adsorption of dyestuffs onto chitin. J. Colloid Interface Sci. 1983, 95, 108–119. [Google Scholar] [CrossRef]
  11. Namasivayam, C.; Jeyakumar, R.; Yamuna, R.T. Dye removal from wastewater by adsorption on “waste” Fe(III)/Cr(III) hydroxide. Waste Manag. 1994, 14, 643–648. [Google Scholar] [CrossRef]
  12. Juang, R.S.; Tseng, R.L.; Wu, F.C.; Lee, S.H. Adsorption behavior of reactive dyes from aqueous solutions on chitosan. J. Chem. Technol. Biotechnol. 1997, 70, 391–399. [Google Scholar] [CrossRef]
  13. McKay, G. Analytical solution using a pore diffusion model for a pseudoirreversible isotherm for the adsorption of basic dye on silica. AIChE J. 1984, 30, 692–697. [Google Scholar] [CrossRef]
  14. Stjepanović, M.; Velić, N.; Lončarić, A.; Gašo-Sokač, D.; Bušić, V.; Habuda-Stanić, M. Adsorptive removal of nitrate from wastewater using modified lignocellulosic waste material. J. Mol. Liq. 2019, 285, 535–544. [Google Scholar] [CrossRef]
  15. Stjepanović, M.; Velić, N.; Galić, A.; Kosović, I.; Jakovljević, T.; Habuda-Stanić, M. From waste to biosorbent: Removal of congo red from water by waste wood biomass. Water 2021, 13, 279. [Google Scholar] [CrossRef]
  16. Demcak, S.; Balintova, M.; Hurakova, M.; Frontasyeva, M.V.; Zinicovscaia, I.; Yushin, N. Utilization of poplar wood sawdust for heavy metals removal from model solutions. Nov. Biotechnol. Chim. 2017, 16, 26–31. [Google Scholar] [CrossRef]
  17. Keränen, A.; Leiviskä, T.; Gao, B.Y.; Hormi, O.; Tanskanen, J. Preparation of novel anion exchangers from pine sawdust and bark, spruce bark, birch bark and peat for the removal of nitrate. Chem. Eng. Sci. 2013, 98, 59–68. [Google Scholar] [CrossRef]
  18. Stevanović, G.; Jović-Jovičić, N.; Krstić, J.; Milutinović-Nikolić, A.; Banković, P.; Popović, A.; Ajduković, M. Nanocomposite Co-catalysts, based on smectite and biowaste-derived carbon, as peroxymonosulfate activators in degradation of tartrazine. Appl. Clay Sci. 2022, 230, 106718. [Google Scholar] [CrossRef]
  19. Kalmár, J.; Kéri, M.; Erdei, Z.; Bányai, I.; Lázár, I.; Lente, G.; Fábián, I. The pore network and the adsorption characteristics of mesoporous silica aerogel: Adsorption kinetics on a timescale of seconds. RSC Adv. 2015, 5, 107237–107246. [Google Scholar] [CrossRef]
  20. Weber, W.J.; Morris, J.C. Kinetics of adsorption on carbon from solution. J. Sanit. Eng. Div. 1963, 2, 31–60. [Google Scholar] [CrossRef]
  21. Lagergren, S. About the theory of so-called adsorption of soluble substances. K. Sven. Vetenskapsakademiens Handl. 1898, 24, 1–39. [Google Scholar]
  22. Ho, Y.S.; McKay, G. The sorption of lead(II) ions on peat. Water Res. 1999, 33, 578–584. [Google Scholar] [CrossRef]
  23. Plazinski, W.; Rudzinski, W.; Plazinska, A. Theoretical models of sorption kinetics including a surface reaction mechanism: A review. Adv. Colloid Interface Sci. 2009, 152, 2–13. [Google Scholar] [CrossRef] [PubMed]
  24. Yang, W.; Wang, J.; Shi, X.; Tang, H.; Wang, X.; Wang, S.; Zhang, W.; Lu, J. Preferential Nitrate Removal from Water Using a New Recyclable Polystyrene Adsorbent Functionalized with Triethylamine Groups. Ind. Eng. Chem. Res. 2020, 59, 5194–5201. [Google Scholar] [CrossRef]
  25. Keränen, A.; Leiviskä, T.; Hormi, O.; Tanskanen, J. Preparation of cationized pine sawdust for nitrate removal: Optimization of reaction conditions. J. Environ. Manag. 2015, 160, 105–112. [Google Scholar] [CrossRef] [PubMed]
  26. Wu, Y.; Wang, Y.; Wang, J.; Xu, S.; Yu, L.; Philippe, C.; Wintgens, T. Nitrate removal from water by new polymeric adsorbent modified with amino and quaternary ammonium groups: Batch and column adsorption study. J. Taiwan Inst. Chem. Eng. 2016, 66, 191–199. [Google Scholar] [CrossRef]
  27. Banu, H.T.; Meenakshi, S. Synthesis of a novel quaternized form of melamine–formaldehyde resin for the removal of nitrate from water. J. Water Process Eng. 2017, 16, 81–89. [Google Scholar] [CrossRef]
  28. Emeruwa, E.; Jarrige, J.; Mexmain, J.; Bernardin, M. Application of mercury porosimetry to powder (UO2) analysis. J. Nucl. Mater. 1991, 184, 53–58. [Google Scholar] [CrossRef]
  29. Zhang, Y.; Wu, K.; Yang, Z.; Ye, G. A reappraisal of the ink-bottle effect and pore structure of cementitious materials using intrusion-extrusion cyclic mercury porosimetry. Cem. Concr. Res. 2022, 161, 106942. [Google Scholar] [CrossRef]
  30. Argalis, P.P.; Sinka, M.; Bajare, D. Recycling of Cement–Wood Board Production Waste into a Low-Strength Cementitious Binder. Recycling 2022, 7, 76. [Google Scholar] [CrossRef]
  31. Bulut, Y.; Aydin, H. A kinetics and thermodynamics study of methylene blue adsorption on wheat shells. Desalination 2006, 194, 259–267. [Google Scholar] [CrossRef]
  32. Hameed, B.H.; Ahmad, A.A. Batch adsorption of methylene blue from aqueous solution by garlic peel, an agricultural waste biomass. J. Hazard. Mater. 2009, 164, 870–875. [Google Scholar] [CrossRef]
  33. Wu, F.C.; Tseng, R.L.; Juang, R.S. Initial behavior of intraparticle diffusion model used in the description of adsorption kinetics. Chem. Eng. J. 2009, 153, 1–8. [Google Scholar] [CrossRef]
  34. Harja, M.; Buema, G.; Bucur, D. Recent advances in removal of Congo Red dye by adsorption using an industrial waste. Sci. Rep. 2022, 12, 6087. [Google Scholar] [CrossRef] [PubMed]
  35. Litefti, K.; Freire, M.S.; Stitou, M.; González-Álvarez, J. Adsorption of an anionic dye (Congo red) from aqueous solutions by pine bark. Sci. Rep. 2019, 9, 16530. [Google Scholar] [CrossRef] [PubMed]
  36. Dbik, A.; Bentahar, S.; El Khomri, M.; El Messaoudi, N.; Lacherai, A. Adsorption of Congo red dye from aqueous solutions using tunics of the corm of the saffron. Mater. Today Proc. 2020, 22, 134–139. [Google Scholar] [CrossRef]
  37. Wanyonyi, W.C.; Onyari, J.M.; Shiundu, P.M. Adsorption of congo red dye from aqueous solutions using roots of eichhornia crassipes: Kinetic and equilibrium studies. Energy Procedia 2014, 50, 862–869. [Google Scholar] [CrossRef]
  38. Gupta, V.; Nayak, A.; Bhushan, B.; Kumar, V. Assessment of Biosorption Potential of Poplar Sawdust for Removal of Dyes from Wastewater under Single and Binary System. Int. J. Recent Technol. Eng. 2020, 8, 24–33. [Google Scholar] [CrossRef]
  39. Kezerle, A.; Velić, N.; Hasenay, D.; Kovačević, D. Lignocellulosic Materials as Dye Adsorbents: Adsorption of Methylene Blue and Congo Red on Brewers’ Spent Grain. Croat. Chem. Acta 2018, 91, 53–64. [Google Scholar] [CrossRef]
  40. Velić, N.; Stjepanović, M.; Begović, L.; Habuda-Stanić, M.; Velić, D.; Jakovljević, T. Valorisation of waste wood biomass as biosorbent for the removal of synthetic dye methylene blue from aqueous solutions. South-East Eur. For. 2018, 9, 115–122. [Google Scholar] [CrossRef]
  41. Qin, X.; Zeng, X.; Cheng, S.; Xing, B.; Jiang, D.; Zhao, S.; Shi, C.; Zhang, Z.; Wang, Q.; Zhang, C. Preparation and evaluation of poplar waste derived adsorbent for dye removal. Arab. J. Chem. 2023, 16, 104913. [Google Scholar] [CrossRef]
  42. Yıldız, D.; Demir, I.; Demiral, H. Adsorption of malachite green on to poplar sawdust activated carbon. Sep. Sci. Technol. 2023, 58, 2099–2114. [Google Scholar] [CrossRef]
  43. Chen, A.; Wang, N.; Tian, Z.; Wei, X.; Lei, C. One-step synthesis of readily recyclable poplar sawdust-based porous carbon for the adsorption of tetracycline. Ind. Crops Prod. 2023, 197, 116621. [Google Scholar] [CrossRef]
  44. Nayak, A.; Bhushan, B.; Sharma, P.K.; Gupta, V. Development of Magnetic Nanoparticles from Poplar Sawdust for Removal of Pesticides from Aqueous Solution. J. Graph. Era Univ. 2018, 6, 55–70. [Google Scholar]
  45. Acar, F.N.; Eren, Z. Removal of Cu(II) ions by activated poplar sawdust (Samsun Clone) from aqueous solutions. J. Hazard. Mater. 2006, 137, 909–914. [Google Scholar] [CrossRef] [PubMed]
  46. Šćiban, M.; Klašnja, M.; Škrbić, B. Modified softwood sawdust as adsorbent of heavy metal ions from water. J. Hazard. Mater. 2006, 136, 266–271. [Google Scholar] [CrossRef] [PubMed]
  47. Božić, D.; Stanković, V.; Gorgievski, M.; Bogdanović, G.; Kovačević, R. Adsorption of heavy metal ions by sawdust of deciduous trees. J. Hazard. Mater. 2009, 171, 684–692. [Google Scholar] [CrossRef]
  48. Kovacova, Z.; Demcak, S.; Balintova, M.; Pla, C.; Zinicovscaia, I. Influence of wooden sawdust treatments on Cu(II) and Zn(II) removal from water. Materials 2020, 13, 3575. [Google Scholar] [CrossRef]
  49. Lubis, L.H.; Husin, A.; Masyitah, Z. Nitrate (NO3−) removal from wastewater by adsorption using modified kaolin. IOP Conf. Ser. Earth Environ. Sci. 2022, 963, 012038. [Google Scholar] [CrossRef]
  50. Revilla, P.N.D.; Concepcion Maguyon-Detras, M.; Migo, V.P.; Alfafara, C.G. Nitrate removal from aqueous solution by adsorption using municipal solid waste-derived activated biochar. IOP Conf. Ser. Mater. Sci. Eng. 2020, 778, 012135. [Google Scholar] [CrossRef]
  51. Battas, A.; El Gaidoumi, A.; Ksakas, A.; Kherbeche, A. Adsorption study for the removal of nitrate from water using local clay. Sci. World J. 2019, 2019, 9529618. [Google Scholar] [CrossRef] [PubMed]
Figure 1. Scanning electron microscopy (SEM) of (a) PWS and (b) mPWS.
Water 15 03776 g001
Figure 2. FTIR spectra of PWS and mPWS.
Water 15 03776 g002
Figure 3. Pore size distribution curves for analysed mPWS.
Water 15 03776 g003
Figure 4. The point of zero charge of mPWS.
Water 15 03776 g004
Figure 5. The effect of the biosorbent concentration on the removal of (a) CR (γCR = 50 mg·dm−3) and (b) nitrate ions (γNO3 = 100 mg·dm−3).
Water 15 03776 g005
Figure 6. The effect of pH on the adsorption of: CR (γ = 50 mg·dm−3) and NO3 (γ = 100 mg·dm−3). All experiments were performed at 25 °C over 180 min, using an adsorbent concentration of 3 g·dm−3 (for CR) and 4 g dm −3 (for NO3 adsorption).
Water 15 03776 g006
Figure 7. Desorption of (a) CR and (b) NO3 anions from previously saturated adsorbent/mPWS (50 mg of CR or NO3 saturated mPWS in 50 mL of desorption solution, at 25 °C over180 min).
Water 15 03776 g007
Figure 8. Results of experimental adsorption data modeling for CR and nitrate ions onto mPWS: (a) Langmuir and Freundlich isotherm models for CR adsorption (γ0CR = (25, 50, 75, 100, 150, 200, and 250) mg·dm−3, γmPWS = 3 g·dm−3, t =180 min); (b) Langmuir and Freundlich isotherm models for nitrate ions adsorption (γ0NO3 = (25–250) mg·dm−3, γmPWS = 4 g·dm−3, t = 180 min); (c) non-linear fit of pseudo-second-order kinetics for NO3 adsorption (γ0NO3 = 100 mg·dm−3, γmPWS = 4 g·dm−3) and CR adsorption (γ0CR = 50 mg·dm−3, γmPWS = 3 g·dm−3); (d) Weber and Morris intraparticle diffusion plot for the adsorption of NO3 (γ0NO3 = 100 mg·dm−3, γmPWS = 4 g·dm−3, t = 1–240 min) and CR (γ0CR = 50 mg·dm−3, γmPWS = 3 g·dm−3, t = 1–240 min).
Water 15 03776 g008
Figure 9. Proposed mechanisms of CR and nitrate adsorption onto mPWS.
Water 15 03776 g009
Table 1. The specifications of the experimental conditions applied for adsorption study of CR and NO3 removal onto mPWS.
T = 25 °C
The Effect of the Adsorption Parameters
Biosorbent
Concentration,
γ (g·dm−3)
Adsorbate
Concentration,
γ (mg·dm−3)
pHContact Time (min)
Adsorption of CR
Biosorbent con.1, 2, 3, 4, 6 and 850Native (7.9)180
Contact time350Native (7.9)1–240
Initial adsorbate con.325–250Native (7.9)180
Effect of pH3502–12180
Adsorption of NO3
Biosorbent con.1, 2, 4, 6, and 8100Native (6.69)180
Contact time4100Native (6.69)1–240
Initial adsorbate con.425–200Native (6.69)180
Effect of pH41002–12180
Table 2. EDX analysis of PWS and mPWS.
PWSmPWS
ElementWt%Wt%
C51.5058.91
O39.1713.10
N-14.84
Ca9.330.00
Cu0.00-
Cl-13.15
Total:100.00100.00
Table 3. Results of the mercury intrusion porosimetry of mPWS *.
SampleRuna Vtot
(mm3·g−1)
b SHg
(m2·g−1)
c Dav
(μm)
d BD
(g·cm−3)
e P
(%)
mPWSI106.309.46.771.2613.39
111.919.97.071.3314.13
112.149.97.131.4214.21
II49.362.568.331.266.21
51.452.678.691.316.47
51.122.658.661.306.62
Note(s): a—total pore volume, b—specific surface area, c—pore diameter average, d—bulk density, e—porosity. * The sample was analysed in triplicate for both consecutive cycles, in order to determine the reproducibility of the results and to determine the statistical error. The measurements showed that the relative error for Run I was 5.8%, while for Run II it was 4.3%. The slight difference in the errors is due to the difference in the shape and quality of the pores created after the first intrusion cycle.
Table 4. The modelling of experimental adsorption data for CR and NO3 using Langmuir and Freundlich isotherm models as well as pseudo-first-order, pseudo-second-order, and intra-particle diffusion as kinetics models.
mPWBAdsorbates
CRNO3
qeexp (mg·g−1)14.1321.54
Freundlich equation
KF (mg·g−1·(dm3·mg−1)1/n)12.2479.421
n2.652.61
R20.9550.963
X221.1622.672
Langmuir equation
qmax (mg·g−1)70.343.6
KL (dm3 mg−1)0.0690.124
RL0.3670.244
R20.9600.928
X219.213.0
Pseudo-first-order kinetic model
qe calc (mg·g−1)13.0520.96
k1/min−10.0880.121
R20.9710.932
Pseudo-second-order kinetic model
qecalc (mg·g−1)14.5921.85
k2 × 10−3 (g·mg−1min−1)9.409.86
R20.9870.956
Intraparticle diffusion model, 1st linear plot
k1 (mg·g−1 min−1/2)2.122.77
Cid10.504.60
R120.9600.902
Intraparticle diffusion model, 2nd linear plot
k2/mg·g−1 min−20.1460.071
R220.9860.605
Table 5. Adsorption capacities of biosorbents made from poplar sawdust.
AdsorbentAdsorbateModifying AgentsAdsorption
Capacity (mg·g−1)
Reference
Fly ashCongo red-22.12[34]
Poplar sawdustCongo red-8[15]
Pine barkCongo red-3.92[35]
Tunics of the corm of the saffronCongo red-6.2[36]
Roots of Eichhornia crassipesCongo red-5.28[37]
Poplar sawdustMethylene blue
Congo red
-
-
23.8
19.6
[38]
Brewers’ spent grainMethylene blue
Congo red
-37.45
19.65
[39]
Poplar sawdustMethylene blue-42.37[40]
Poplar sawdustMethylene blueNa2CO3254.21[41]
Poplar sawdustMalachite greenCarbonization + H3PO4150[42]
Poplar sawdustTetracyclineKHCO3, FeCl3 · 6H2O + high-temperature carbonization288.2[43]
Poplar sawdustMethoxychlor
Methylparathion
FeCl3 · 6H2O, FeSO4 · 7H2O, NH4OH163.9
77.5
[44]
Poplar sawdustCu(II)H2SO413.95[45]
Poplar sawdustCu(II)NaOH6.92[46]
Cd
Cu
Mn
Ni
Zn
-
-
-
-
-
3.5
9.9
1.0
4.6
2.17
[47]
Poplar sawdustCu(II)-
NaOH
KOH
3.97
8.20
7.86
[48]
Poplar sawdustCu(II)-
NaOH
KOH
2.69
6.34
5.73
[48]
KaolinNO3Cetyltrimethylammonium bromide (CTABr)0.813[49]
Municipal solid waste-derived activated biocharNO3pyrolisis2.11[50]
Greenish clayNO3-27.77[51]
Pine sawdustN-NO3N,N-dimethylformamide, Epichlorohydrin, ethylenediamine, triethylamine29.5[25]
Brewers’ spent grainN-NO3N,N-dimethylformamide, Epichlorohydrin, ethylenediamine, triethylamine25.97[14]
Poplar sawdustCongo red
NO3
N,N-dimethylformamide, Epichlorohydrin, ethylenediamine, triethylamine70.3
43.6
This work
Disclaimer/Publisher’s Note: The statements, opinions and data contained in all publications are solely those of the individual author(s) and contributor(s) and not of MDPI and/or the editor(s). MDPI and/or the editor(s) disclaim responsibility for any injury to people or property resulting from any ideas, methods, instructions or products referred to in the content.

