1. Introduction
Loess, a loose sediment primarily formed by wind during the Quaternary period [
1], boasts a global distribution covering an estimated 13 million square kilometers, accounting for approximately 9.3% of the Earth’s land area [
2]. Notably, China claims the world’s most extensive distribution of loess, with an expanse encompassing roughly 631,000 square kilometers, amounting to approximately 6.0% of the nation’s total land area. The Loess Plateau in Northwestern China represents a significant segment of this distribution, comprising approximately 72.4%. It is pertinent to underscore that loess landslides rank among the most severe geological hazards prevalent in Northwestern China [
3]. The distinctive structural characteristics of loess render it exceptionally vulnerable to rapid strength reduction in response to moisture infiltration.
Among the myriad of triggers, intense rainfall stands out as the paramount catalyst for loess landslides, responsible for more than 90% of the overall damage inflicted on loess slopes [
4]. The manifestation of rainfall-induced loess landslides in Northwestern China exhibits a profound correlation with the temporal and spatial patterns of rainfall [
5]. A tragic landslide event unfolded on the northern slope of the Bailu Plateau in Shijiadao Village, Shaanxi Province in September 2011, claiming the lives of 32 individuals and injuring 5 others following several days of torrential rain [
6]. Similarly, a colossal landslide that ravaged the Ili region of Xinjiang in May 2002 resulted in more than 30 casualties associated with an accumulation of debris of about 2275.5 × 10 cubic meters. The occurrence of a landslide led to the formation of a barrier lake, posing a severe threat to the lives and property of downstream communities [
7]. Therefore, comprehending the mechanisms governing the vulnerability of loess slopes to rainfall-induced infiltration is an urgent and paramount concern. Addressing this issue can potentially ameliorate a myriad of slope destabilization challenges ignited by rainfall in loess-prone regions.
The investigation of rainfall-induced loess landslides encompasses three primary dimensions [
6]. This paper primarily focuses on exploring the processes of rainfall infiltration within loess, employing two methodological approaches: mathematical modeling and physical modeling tests and monitoring. The second dimension concentrates on the evolution of mechanical properties in slope soils during rainfall events. Lastly, the third dimension delves into examining loess slope stability amid rainfall. Of paramount importance among these facets is the study of rainfall infiltration into loess, a critical research frontier. Terzaghi [
8] introduced the principle of effective stress, uncovering the mechanism of pore water pressure during rainfall infiltration in landslide disasters. Collins et al. [
9] found that the permeability of the slope geotechnical body determines the depth of slip surface burial through a large number of case studies. Onyelowe et al. [
10] analyzed landslide hazards in southern Luxembourg and concluded that after prolonged rainfall, inadequate drainage rates of slope soils can lead to increased pore water pressure buildup and eventual landslides. Emberson et al. [
11] found that rainfall-induced landslides occurred more frequently in rugged and steep terrain by analyzing the statistics of 16 rainfall-induced landslides around the world. Mehmood et al. [
12] conducted artificial rainfall experiments on a slope in Tatta Pani, deriving a cumulative rainfall threshold for triggering rockfall.
Chen, Liu and Yan [
13,
14,
15] adopted the finite unit method to simulate the whole process of rainfall infiltration on slopes and concluded that both rainfall intensity and duration significantly influence slope stability. Some other scholars [
16,
17,
18] conducted indoor rainfall landslide modeling tests and closely monitored the water content, pore water pressure, and vertical stress. They concluded that rainfall infiltration and damage development were pivotal factors contributing to slope development.
The utilization of microscopic techniques to assess the properties of rock and soil bodies has witnessed significant advancements in soil microstructure observation, particularly with the widespread application of optical observation methods, most notably the scanning electron microscope (SEM) [
19,
20,
21]. This adoption has substantially propelled the development of soil microstructure research [
22,
23]. A large number of scholars have conducted extensive investigations into soil microstructure, encompassing studies on particle-to-particle contact relationships and particle fragmentation, yielding numerous research findings [
24,
25]. Currently, microstructure assessments involve various testing methods, including scanning electron microscopy (SEM), X-ray computed tomography (CT), nuclear magnetic resonance (NMR), X-ray diffraction (XPD), energy spectrum analysis (EDS), mercury-in-pressure (MIP), and nitrogen adsorption [
26]. Among these methods, SEM imaging stands out as a particularly valuable tool for its ability to directly depict the morphology and structure of soil particles and pores. The SEM-based analysis was chosen as the primary microscopic research tool in this study due to its convenience and rapid image acquisition.
The total area covered by Xinjiang loess spans approximately 190,000 square kilometers, representing 29.6% of China’s entire loess territory. It is noteworthy, however, that prior research efforts in China have predominantly concentrated on the Loess Plateau, while fewer studies have been conducted on the loess of the Ili River Valley in Xinjiang [
27]. The distinctive geographical “horn” shape of the Ili region results in abundant rainfall. Unique loess characteristics and a humid climate have contributed to a substantial number of loess landslides, with formation mechanisms and destructive behaviors that differ from those in other loess regions [
28]. In recent years, the Ili region has experienced a significant upsurge in geological disasters. According to data from the Ili State Geological and Environmental Monitoring Station, a total of 342 geological disasters occurred in the area from 2005 to 2021, with landslides constituting a substantial 68% of these incidents [
29,
30]. Prior research findings indicate that the Ili region’s loess exhibits heightened sensitivity to rainwater infiltration, and that precipitation plays a pivotal role in both triggering and exacerbating loess landslides within this locale [
31,
32,
33,
34]. Consequently, it is imperative to achieve a more profound comprehension of the processes and mechanisms underpinning rainfall-induced loess landslides in the Ili River Valley. Previous studies on landslide physical modeling have predominantly revolved around the infiltration and transport of water within loess slopes and the characterization of associated alterations in critical soil parameters like moisture content, pore water pressure, and vertical stresses. However, limited attention has been directed towards establishing connections between the microscopic and macroscopic behaviors of soil during rainfall infiltration in loess landslides.
Given the distinctive structural nature of loess landslides prevalent in the Ili River Valley and the intricate infiltration conditions, this study aims to comprehensively investigate the destabilization and deformation mechanisms of rainfall-induced loess landslides in this region. Furthermore, it seeks to elucidate the microscopic alterations within the soil during rainfall infiltration. This paper conducted a series of physical modeling experiments and microscopic investigations of loess landslides, simulating sustained rainfall conditions. These experiments aim to analyze the evolution of pore water pressure, vertical stresses, and microscopic parameters throughout rainfall infiltration. Additionally, they facilitated the examination of macro–micro deformation and damage patterns within the slope body. The findings contribute to understanding the destabilization modes and mechanisms underlying typical rainfall-induced loess landslides in the Ili River Valley and serve as a valuable theoretical foundation for future initiatives focused on local disaster prevention and mitigation.
2. Experimental Scheme
2.1. Overview of the Study Area
As illustrated in
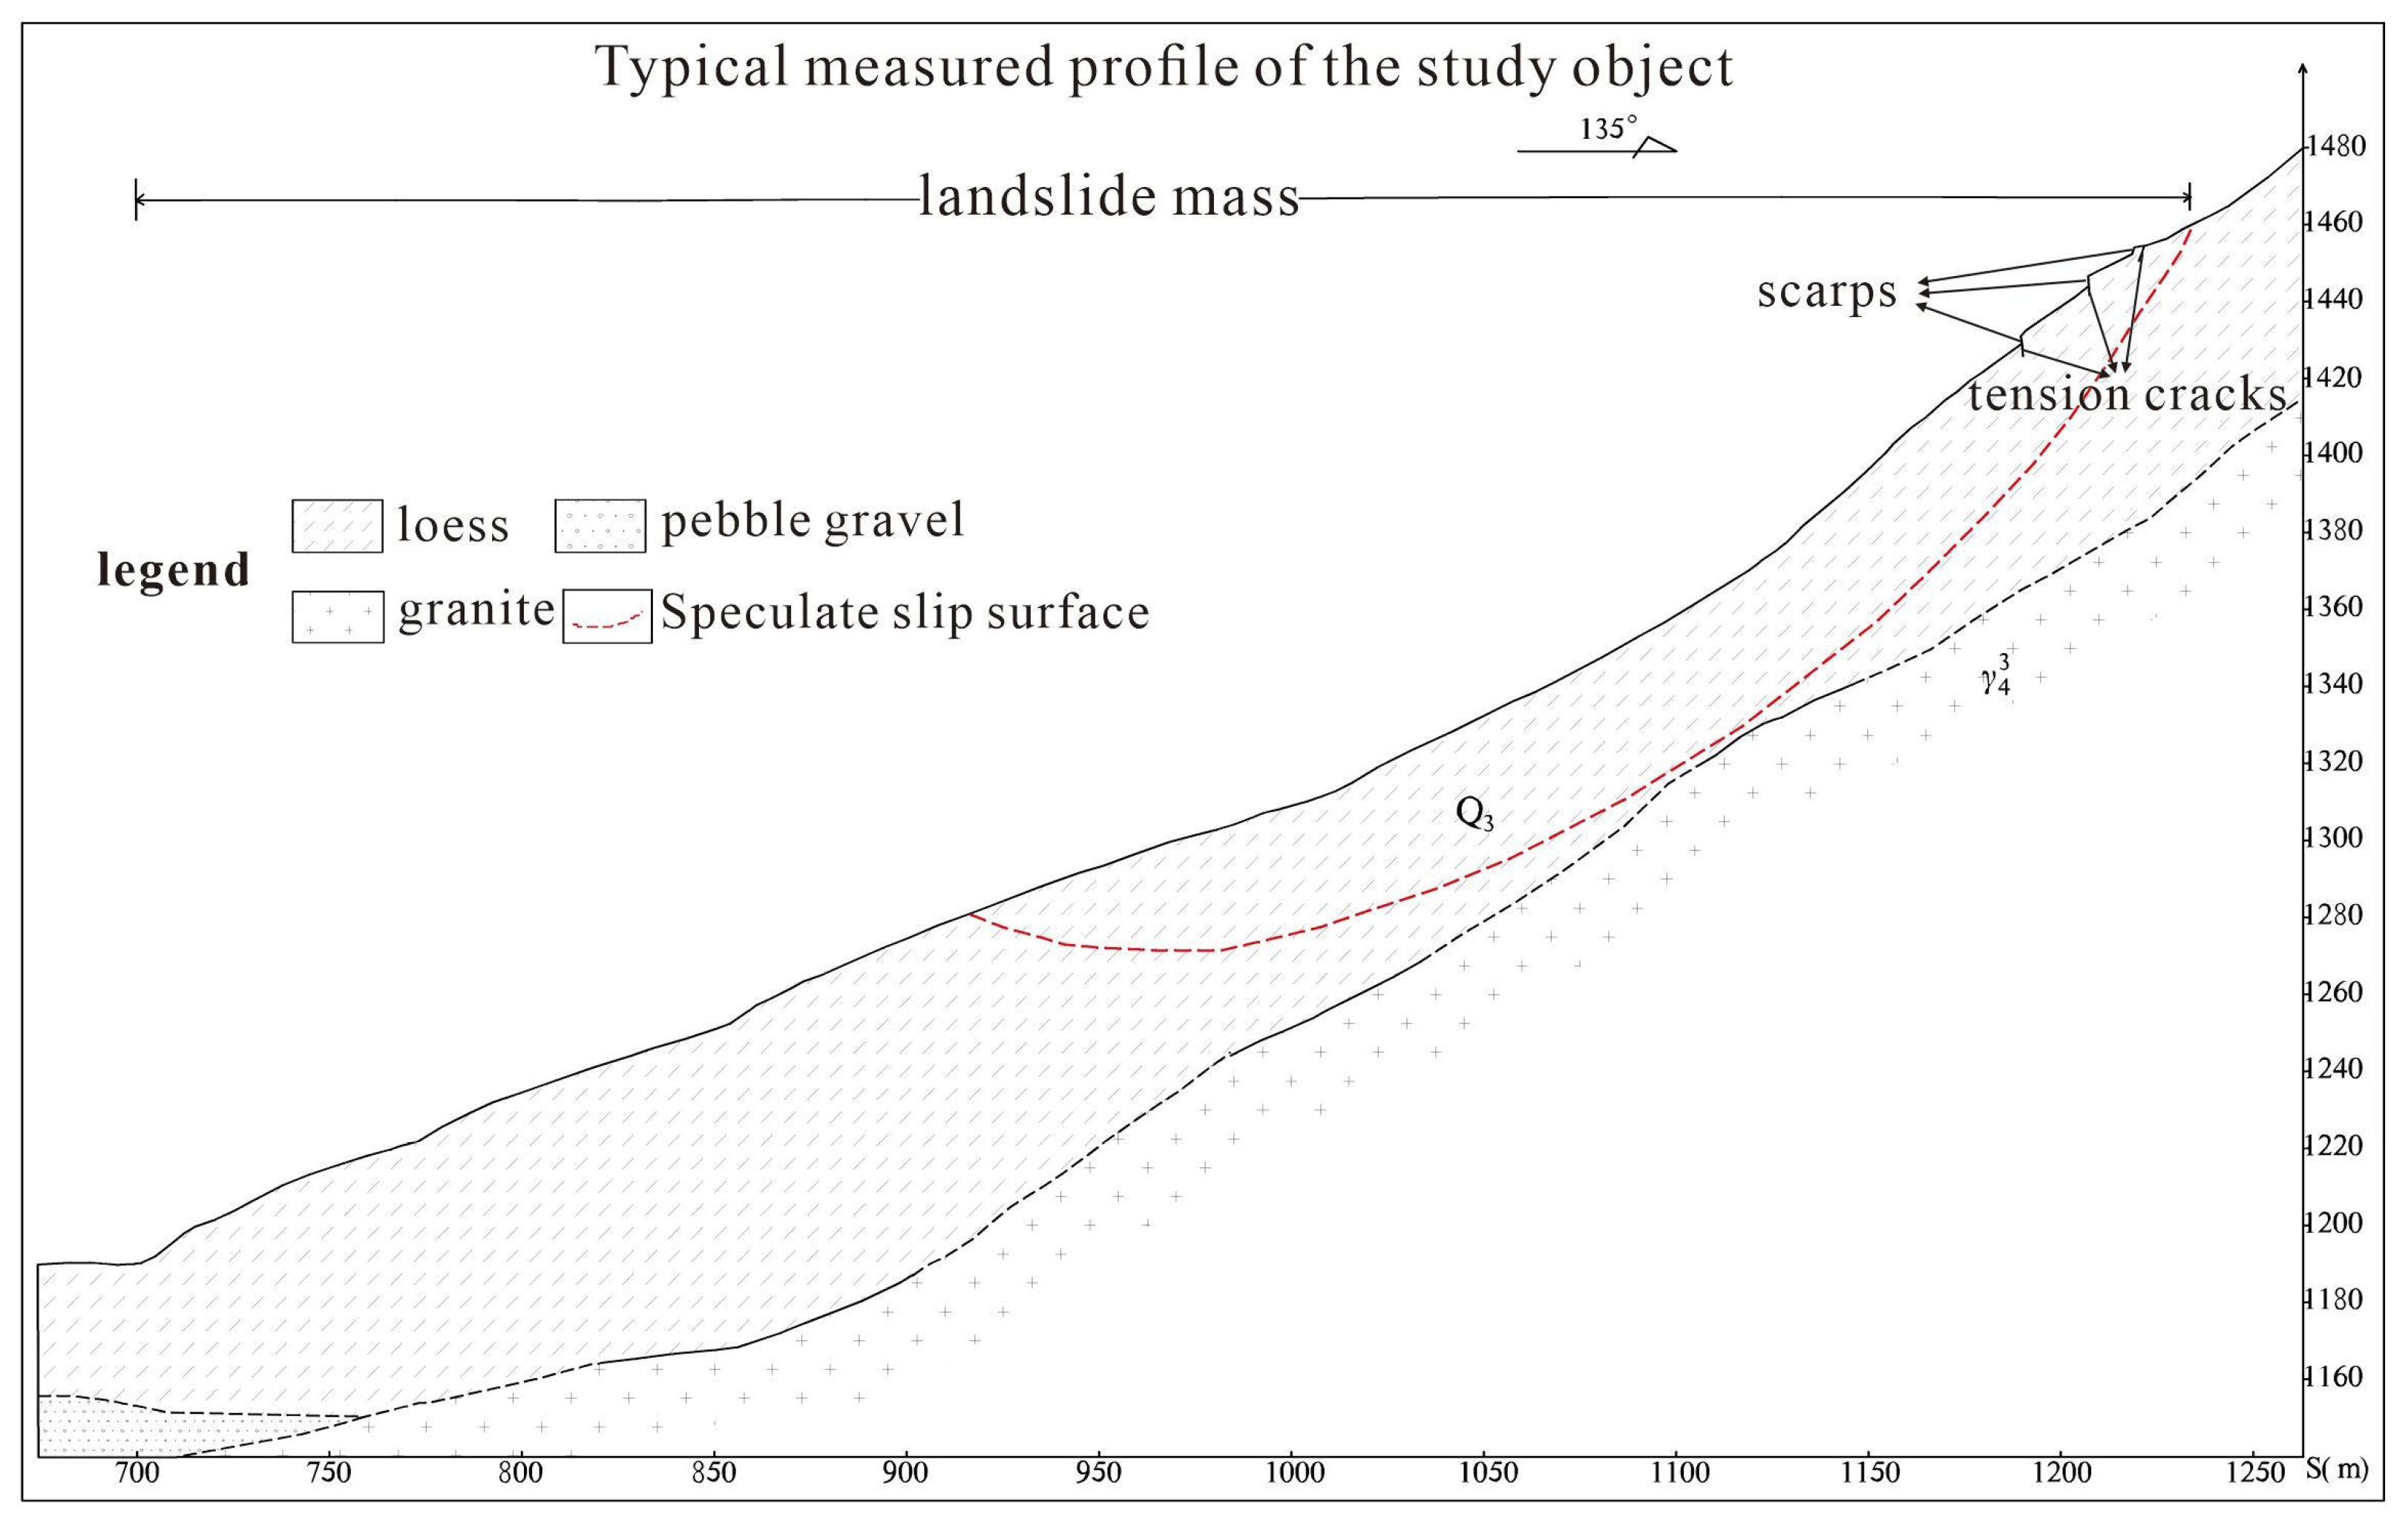
Figure 1a–c, the study site is situated in Xinyuan County, within the Ili Region of Xinjiang, China. This paper focuses on a potential landslide location characterized by its distinctive “semicircular” morphology. The area is bordered by gullies on its eastern and western boundaries, extending from the northern foothill to the southern ridge, as depicted in
Figure 1d. Presently, numerous tension cracks have emerged along the rear edge of the landslide mass, exhibiting a Y-shaped pattern with bifurcation towards the southeast. The overall inclination trends northwest and these cracks have been filled with loose soil, giving rise to a scarp, as observed in
Figure 1e,f. The surface layer of the landslide consists of loess, underlain by granite bedrock. The overlying stratum is relatively thick, and the depth of the slip surface varies between 30 and 38 m, categorizing the landslide as a large, deep-seated loess layer landslide. The loess exhibits high mechanical strength in its dry state; however, upon saturation, the influence of water induces a significant reduction in the soil’s shear strength, rendering it highly susceptible to disintegration and collapse. Fundamental physical properties of the landslide soil are detailed in
Table 1.
2.2. Physical Simulation Tests
To elucidate the evolving patterns of rainfall-induced landslides, a scaled-down simulation test is conducted according to the principles of similarity theory. The primary apparatus employed in this physical simulation for rainfall-induced landslides includes a rainfall simulation system, data acquisition system, and a model box, among others. This comprehensive testing setup is employed to monitor temporal variations in the wetting front, settlement, surface cracking, pore water pressure, and vertical stresses of the landslide model under continuous rainfall.
The dimensions and structural features of the model’s core components are designed by drawing inspiration from the hazardous Kara Haiisu landslide in the study area, as depicted in
Figure 2. These dimensions are proportionally scaled down to ensure a realistic representation. The prototype, measuring 337 m in height and 387 m in length, serves as the basis for this scale reduction. Considering the size of the model box, a similarity ratio of n = 250 is established, resulting in a final model with dimensions of 1.55 m in length, 0.55 m in width, and 1.35 m in height. To closely mimic the actual slope conditions, the upper loess layer in the modeling test was taken from the slide body of the Kara Haiisu landslide in the study area, and the soil samples were air-dried and passed through a 2 mm sieve. Similarity ratios for key properties are set as follows: density (C
ρ = 1), internal friction (C
φ = 1), cohesion (C
C = 1), rainfall strength (C
q =
), and rainfall duration similarity ratio (C
t =
). As for the bedrock, owing to its inherent stability, the modeling material is not proportioned; instead, masonry is utilized to construct the slope, with cement mortar employed to establish a less permeable surface. The physical parameters of the final physical model are summarized in
Table 2 for reference.
The physical simulation in this study only simulates the localization of the target landslide instead of the whole landslide, so the shear interaction between the sidewalls of the model box and the landslide model is not consistent with the shear interaction inside the landslide model body. In order to minimize this effect, petroleum jelly is uniformly coated on the sidewalls of the model box on the area of contact with the soil layer during the stacking of the model, and the sensors are also placed as close as possible to the model’s central axis during the sensor deployment.
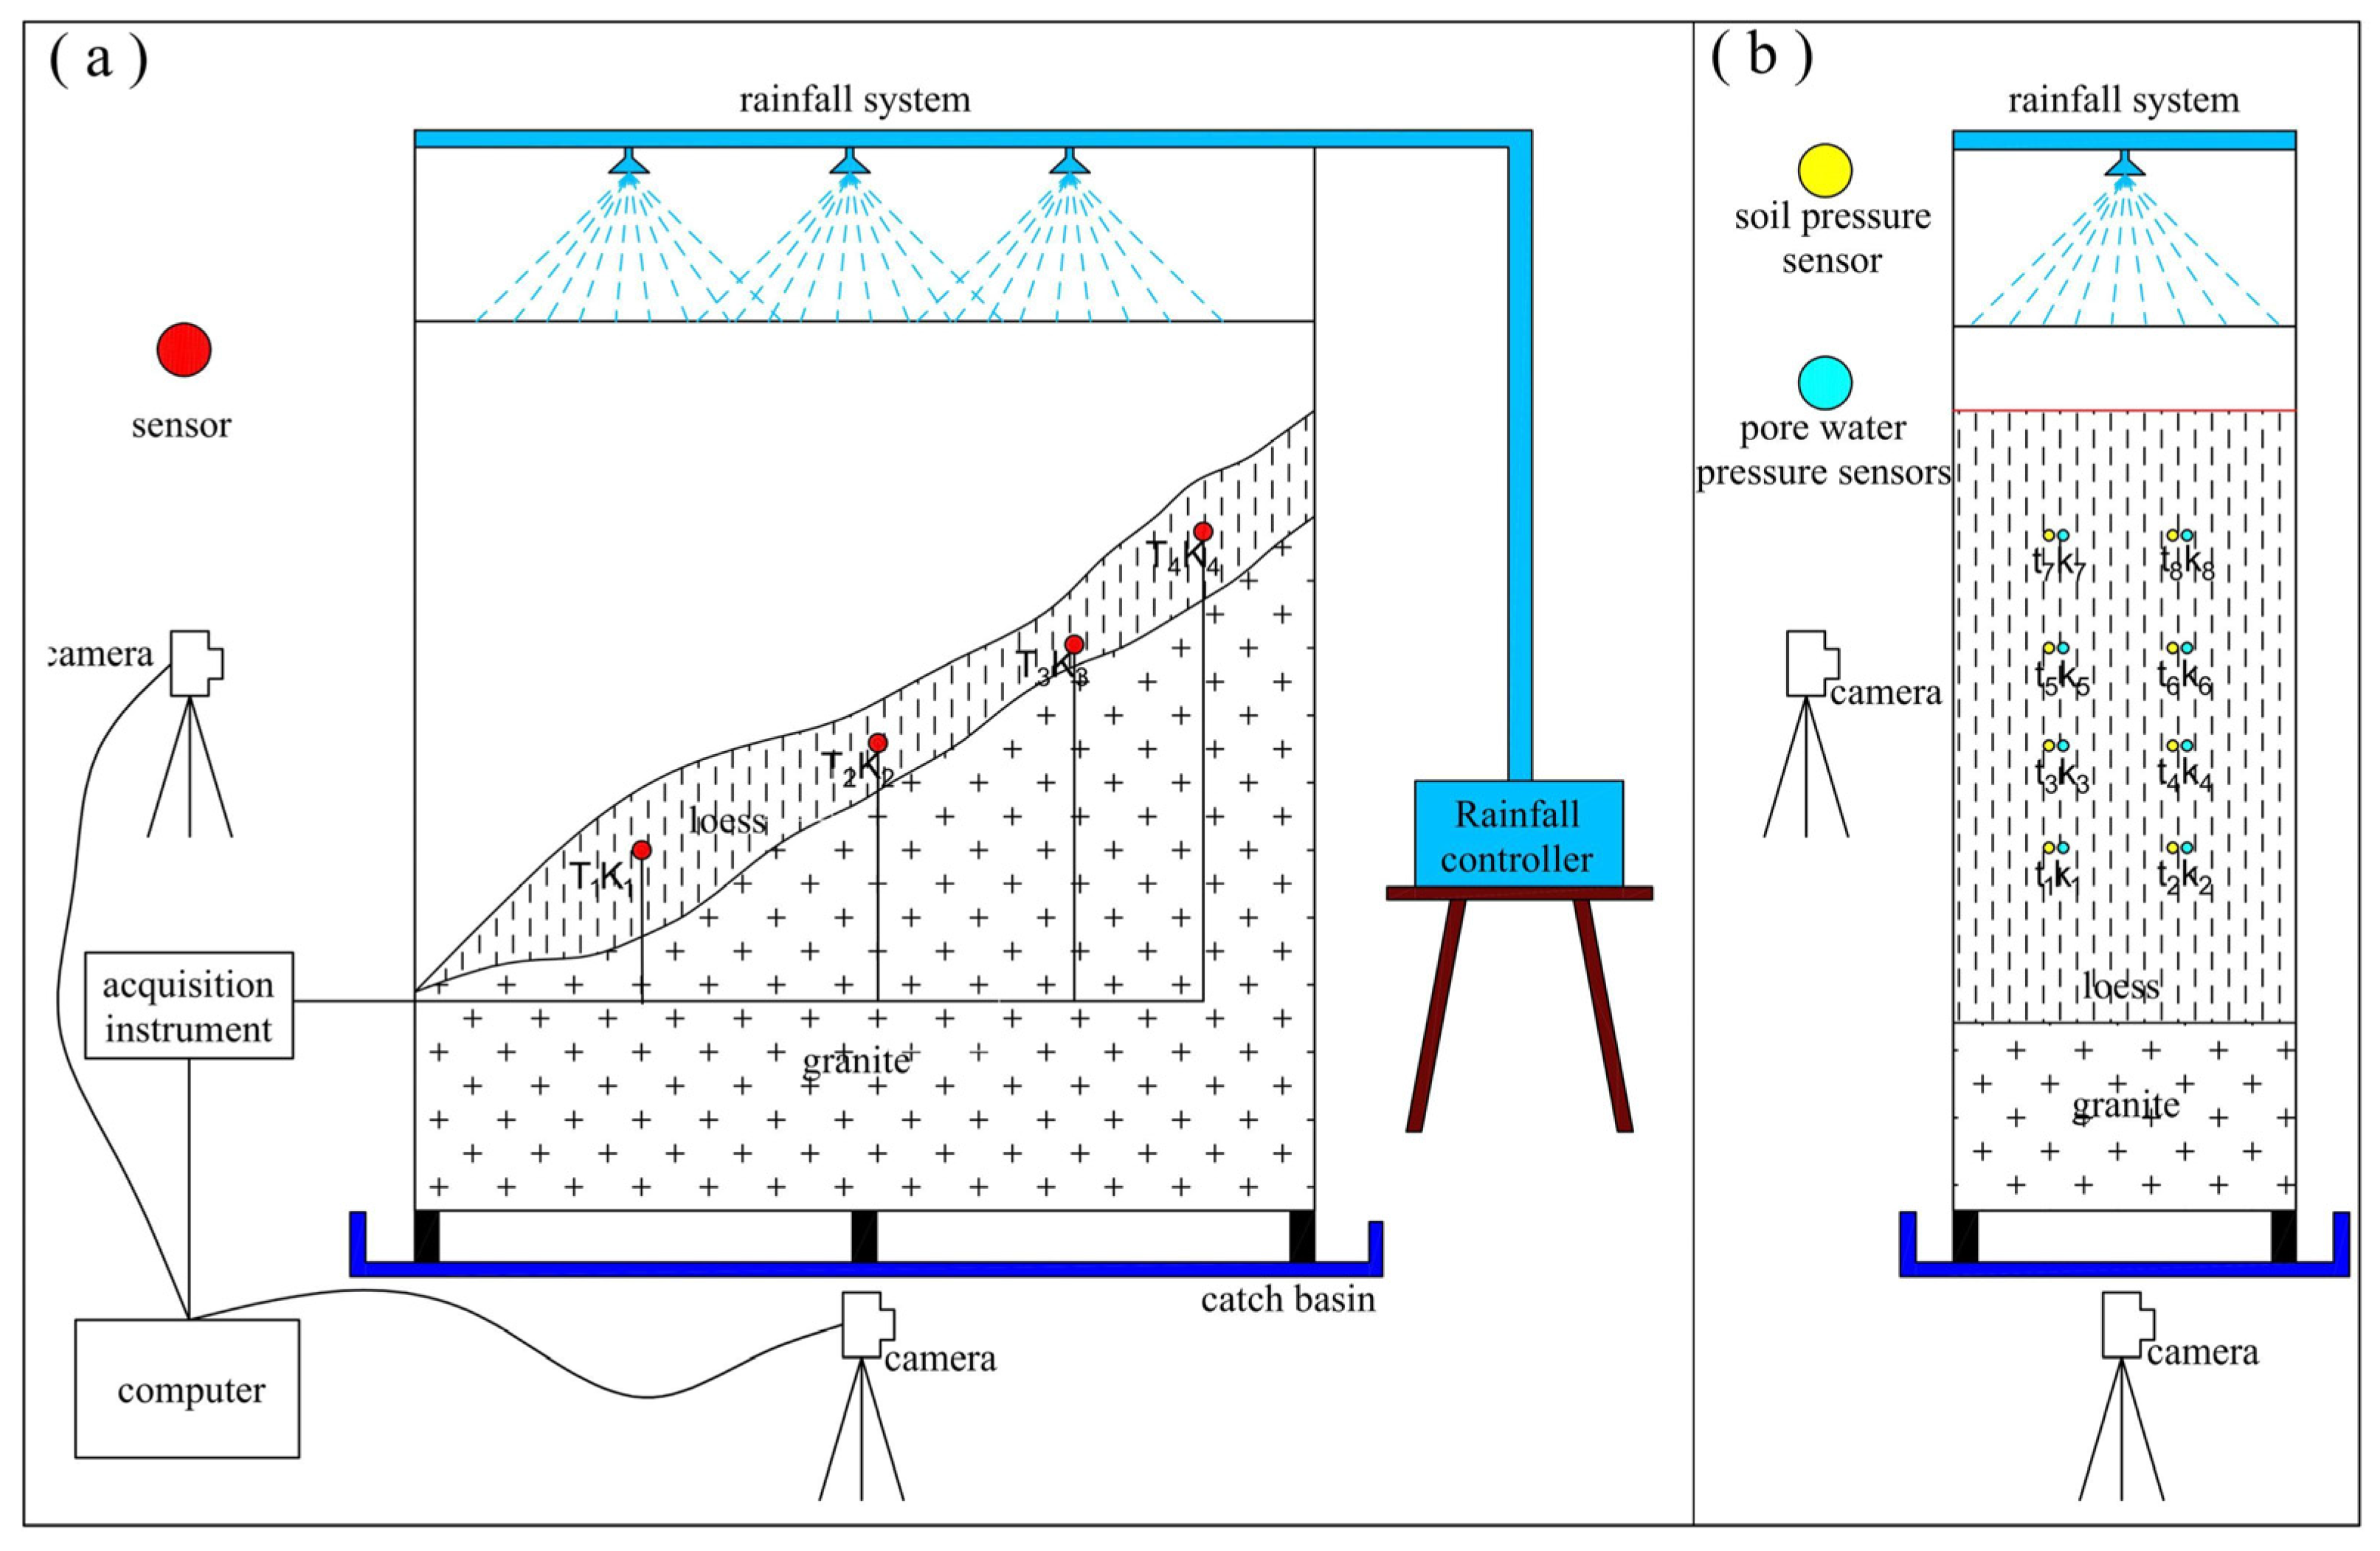
In accordance with the natural moisture content, soil samples are prepared to target a 10% moisture content. These samples are then layered, with each layer approximately 10 cm thick, and placed within the model box. Concurrently, eight BW strain-type soil stress sensors (t
1–t
8) and eight BWK strain-type pore water stress sensors (k
1–k
8) are strategically positioned as per specifications. The buried depth of these 16 sensors is 6.5 cm. Following the completion of this setup, the entire setup is meticulously wrapped in plastic and left undisturbed for 48 h. An illustrative representation of the landslide physical model test configuration and sensor layout is shown in
Figure 3.
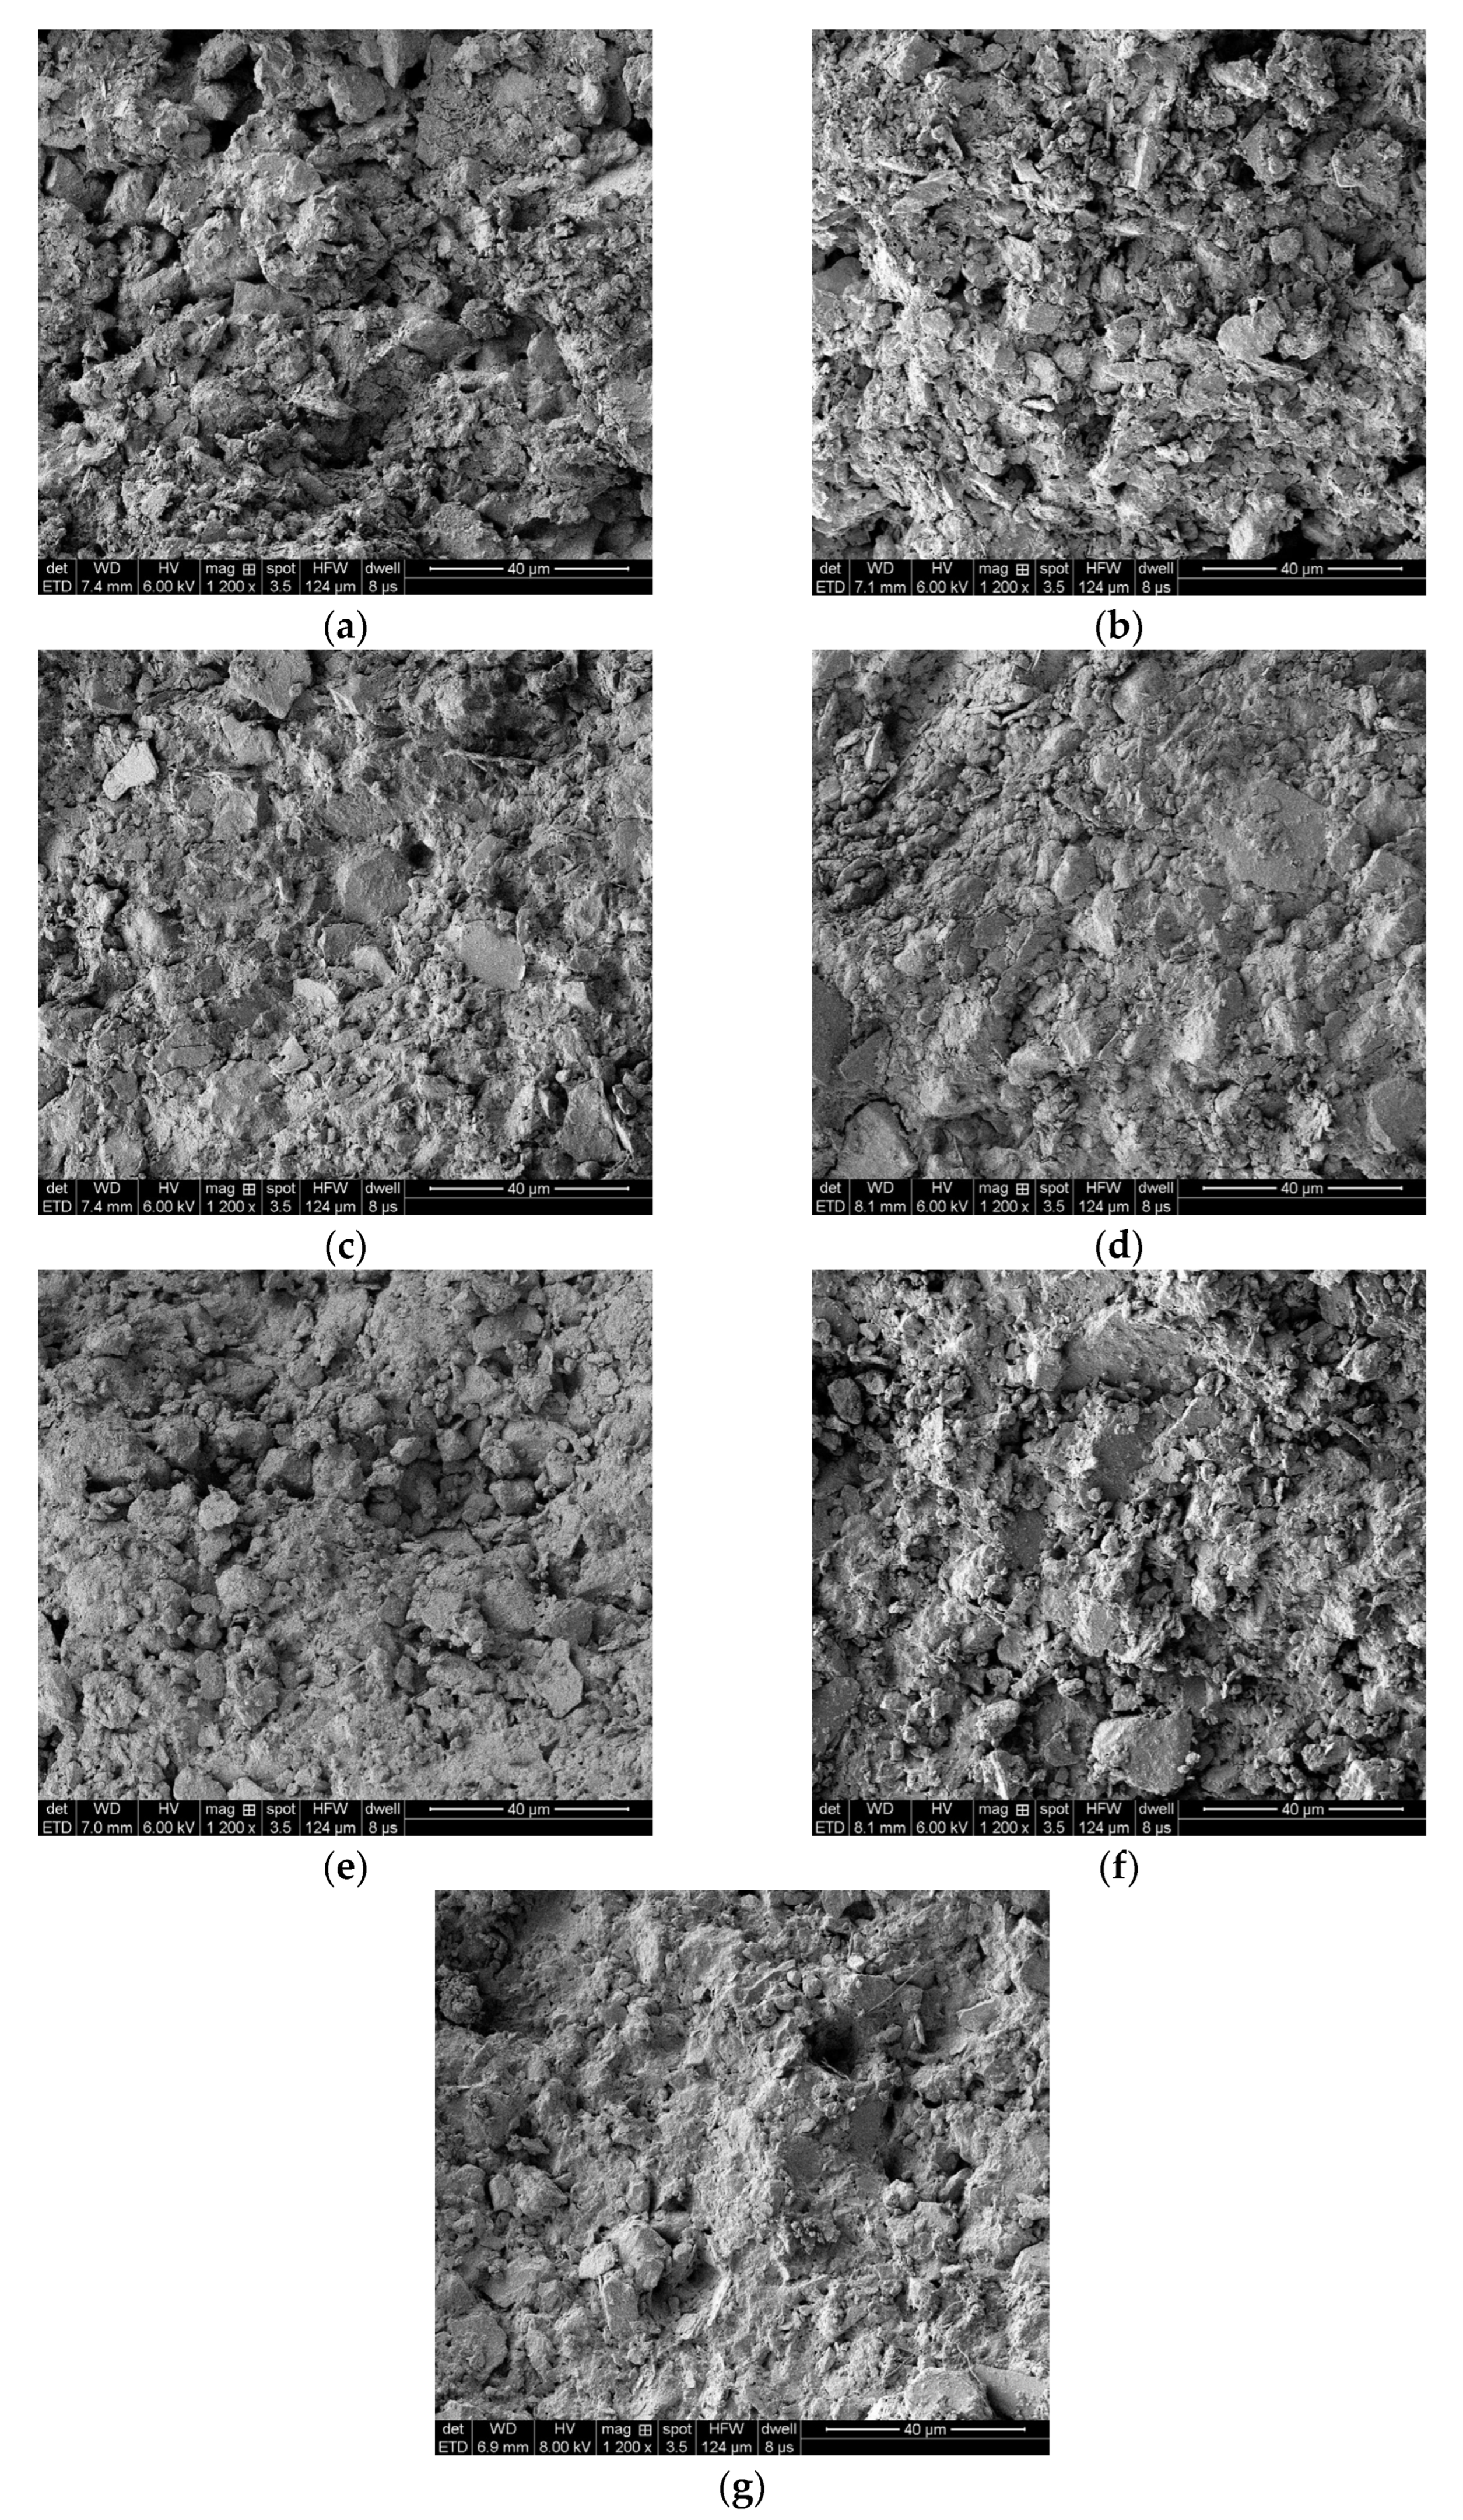
2.3. Scanning Electron Microscope Test
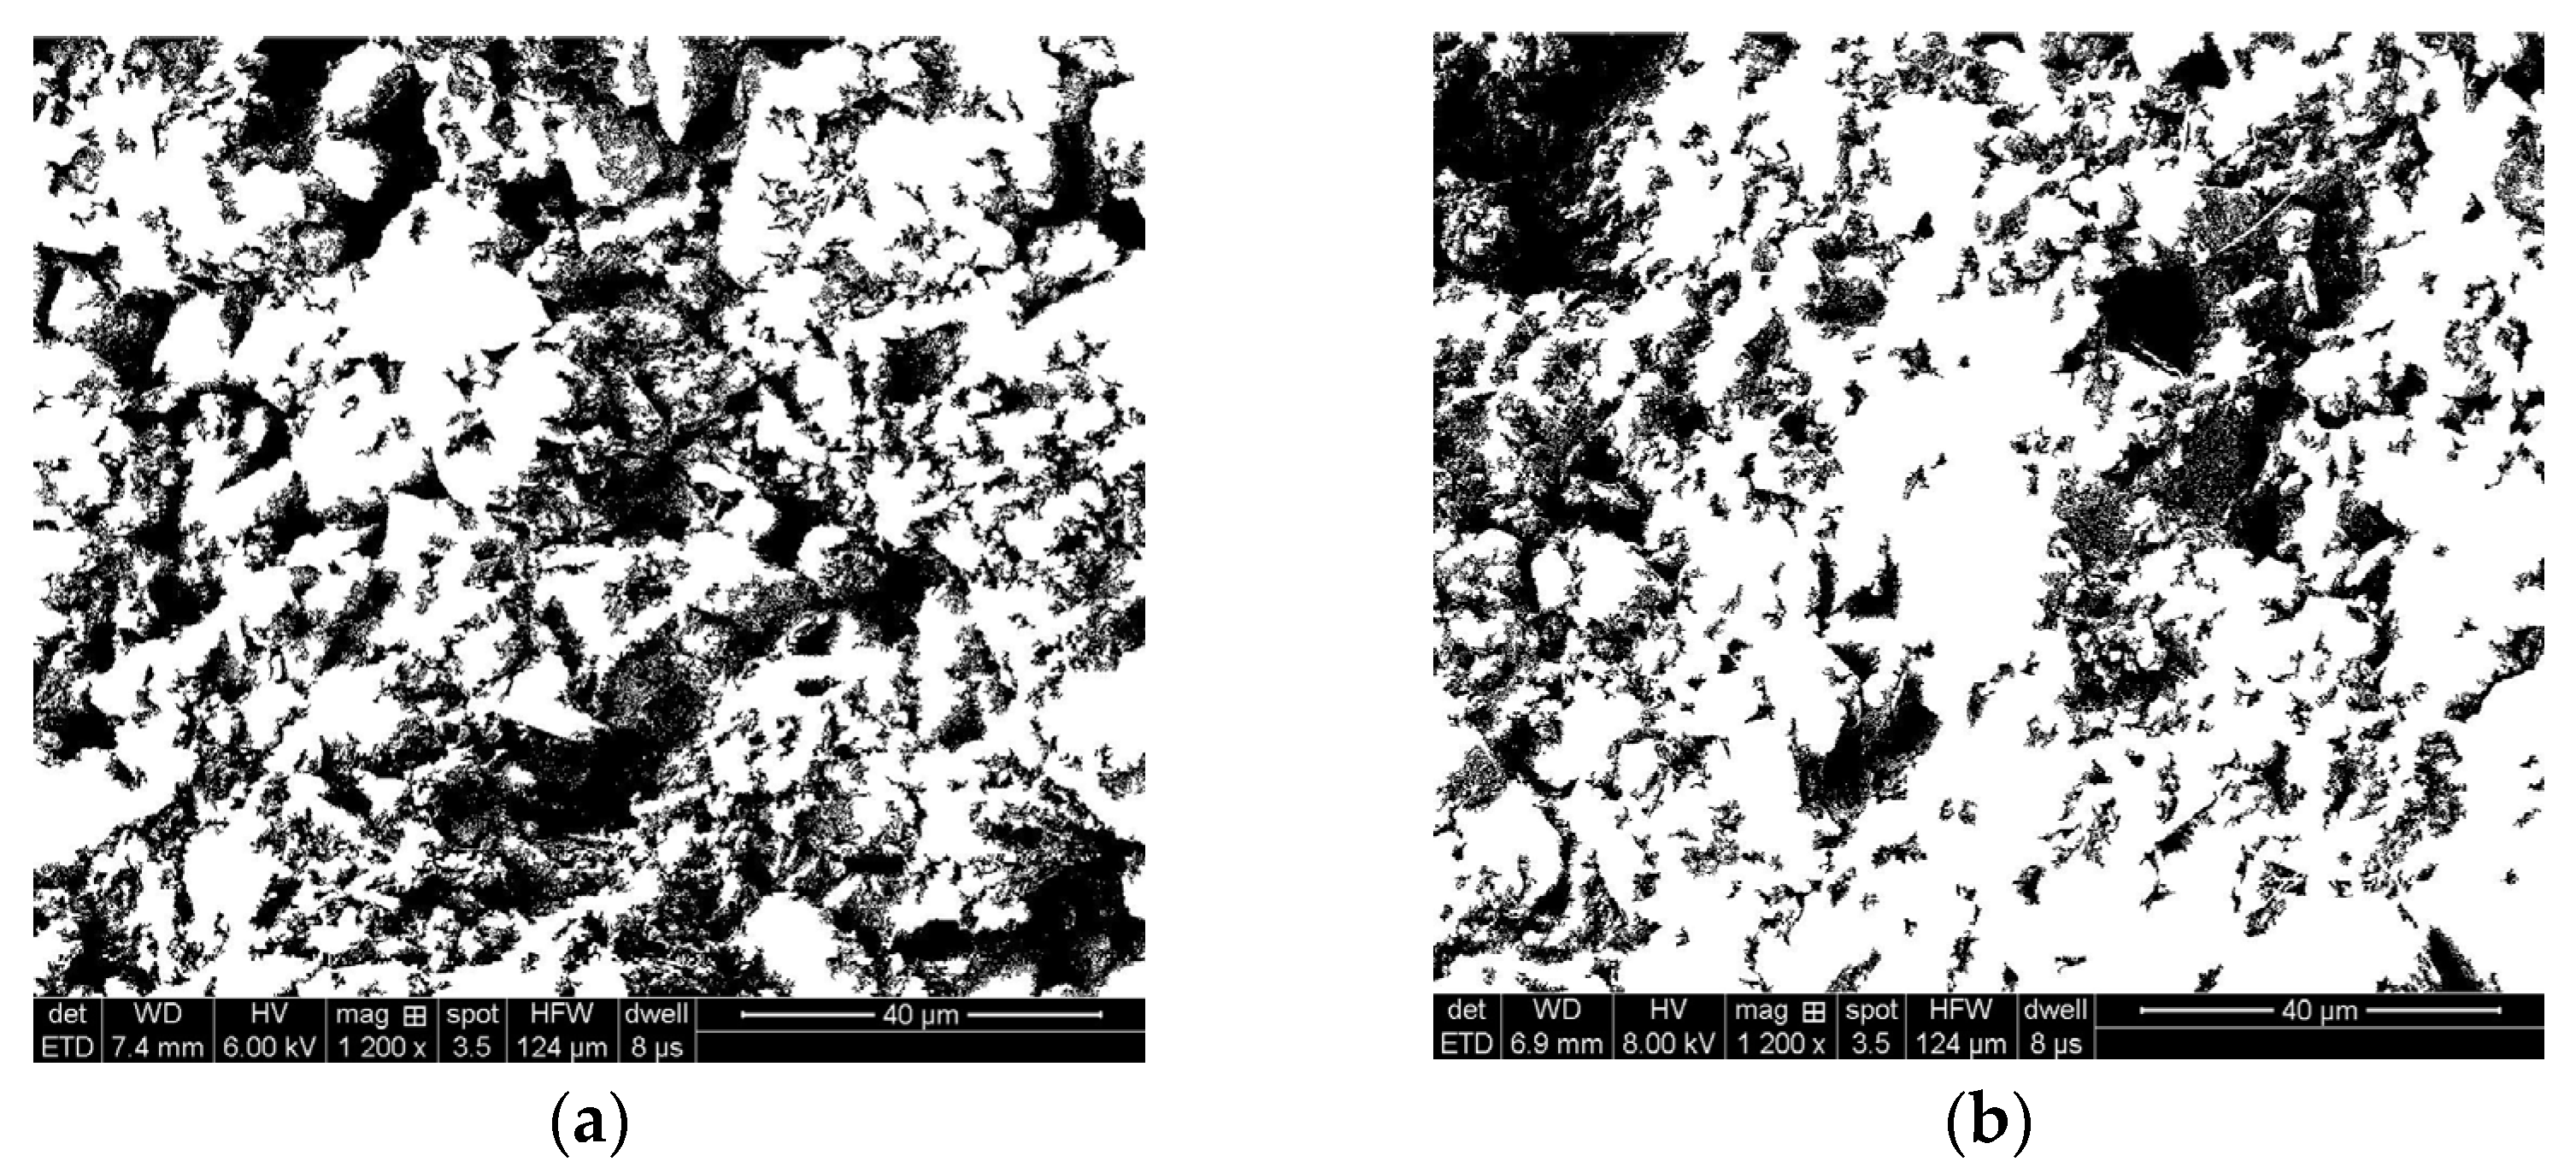
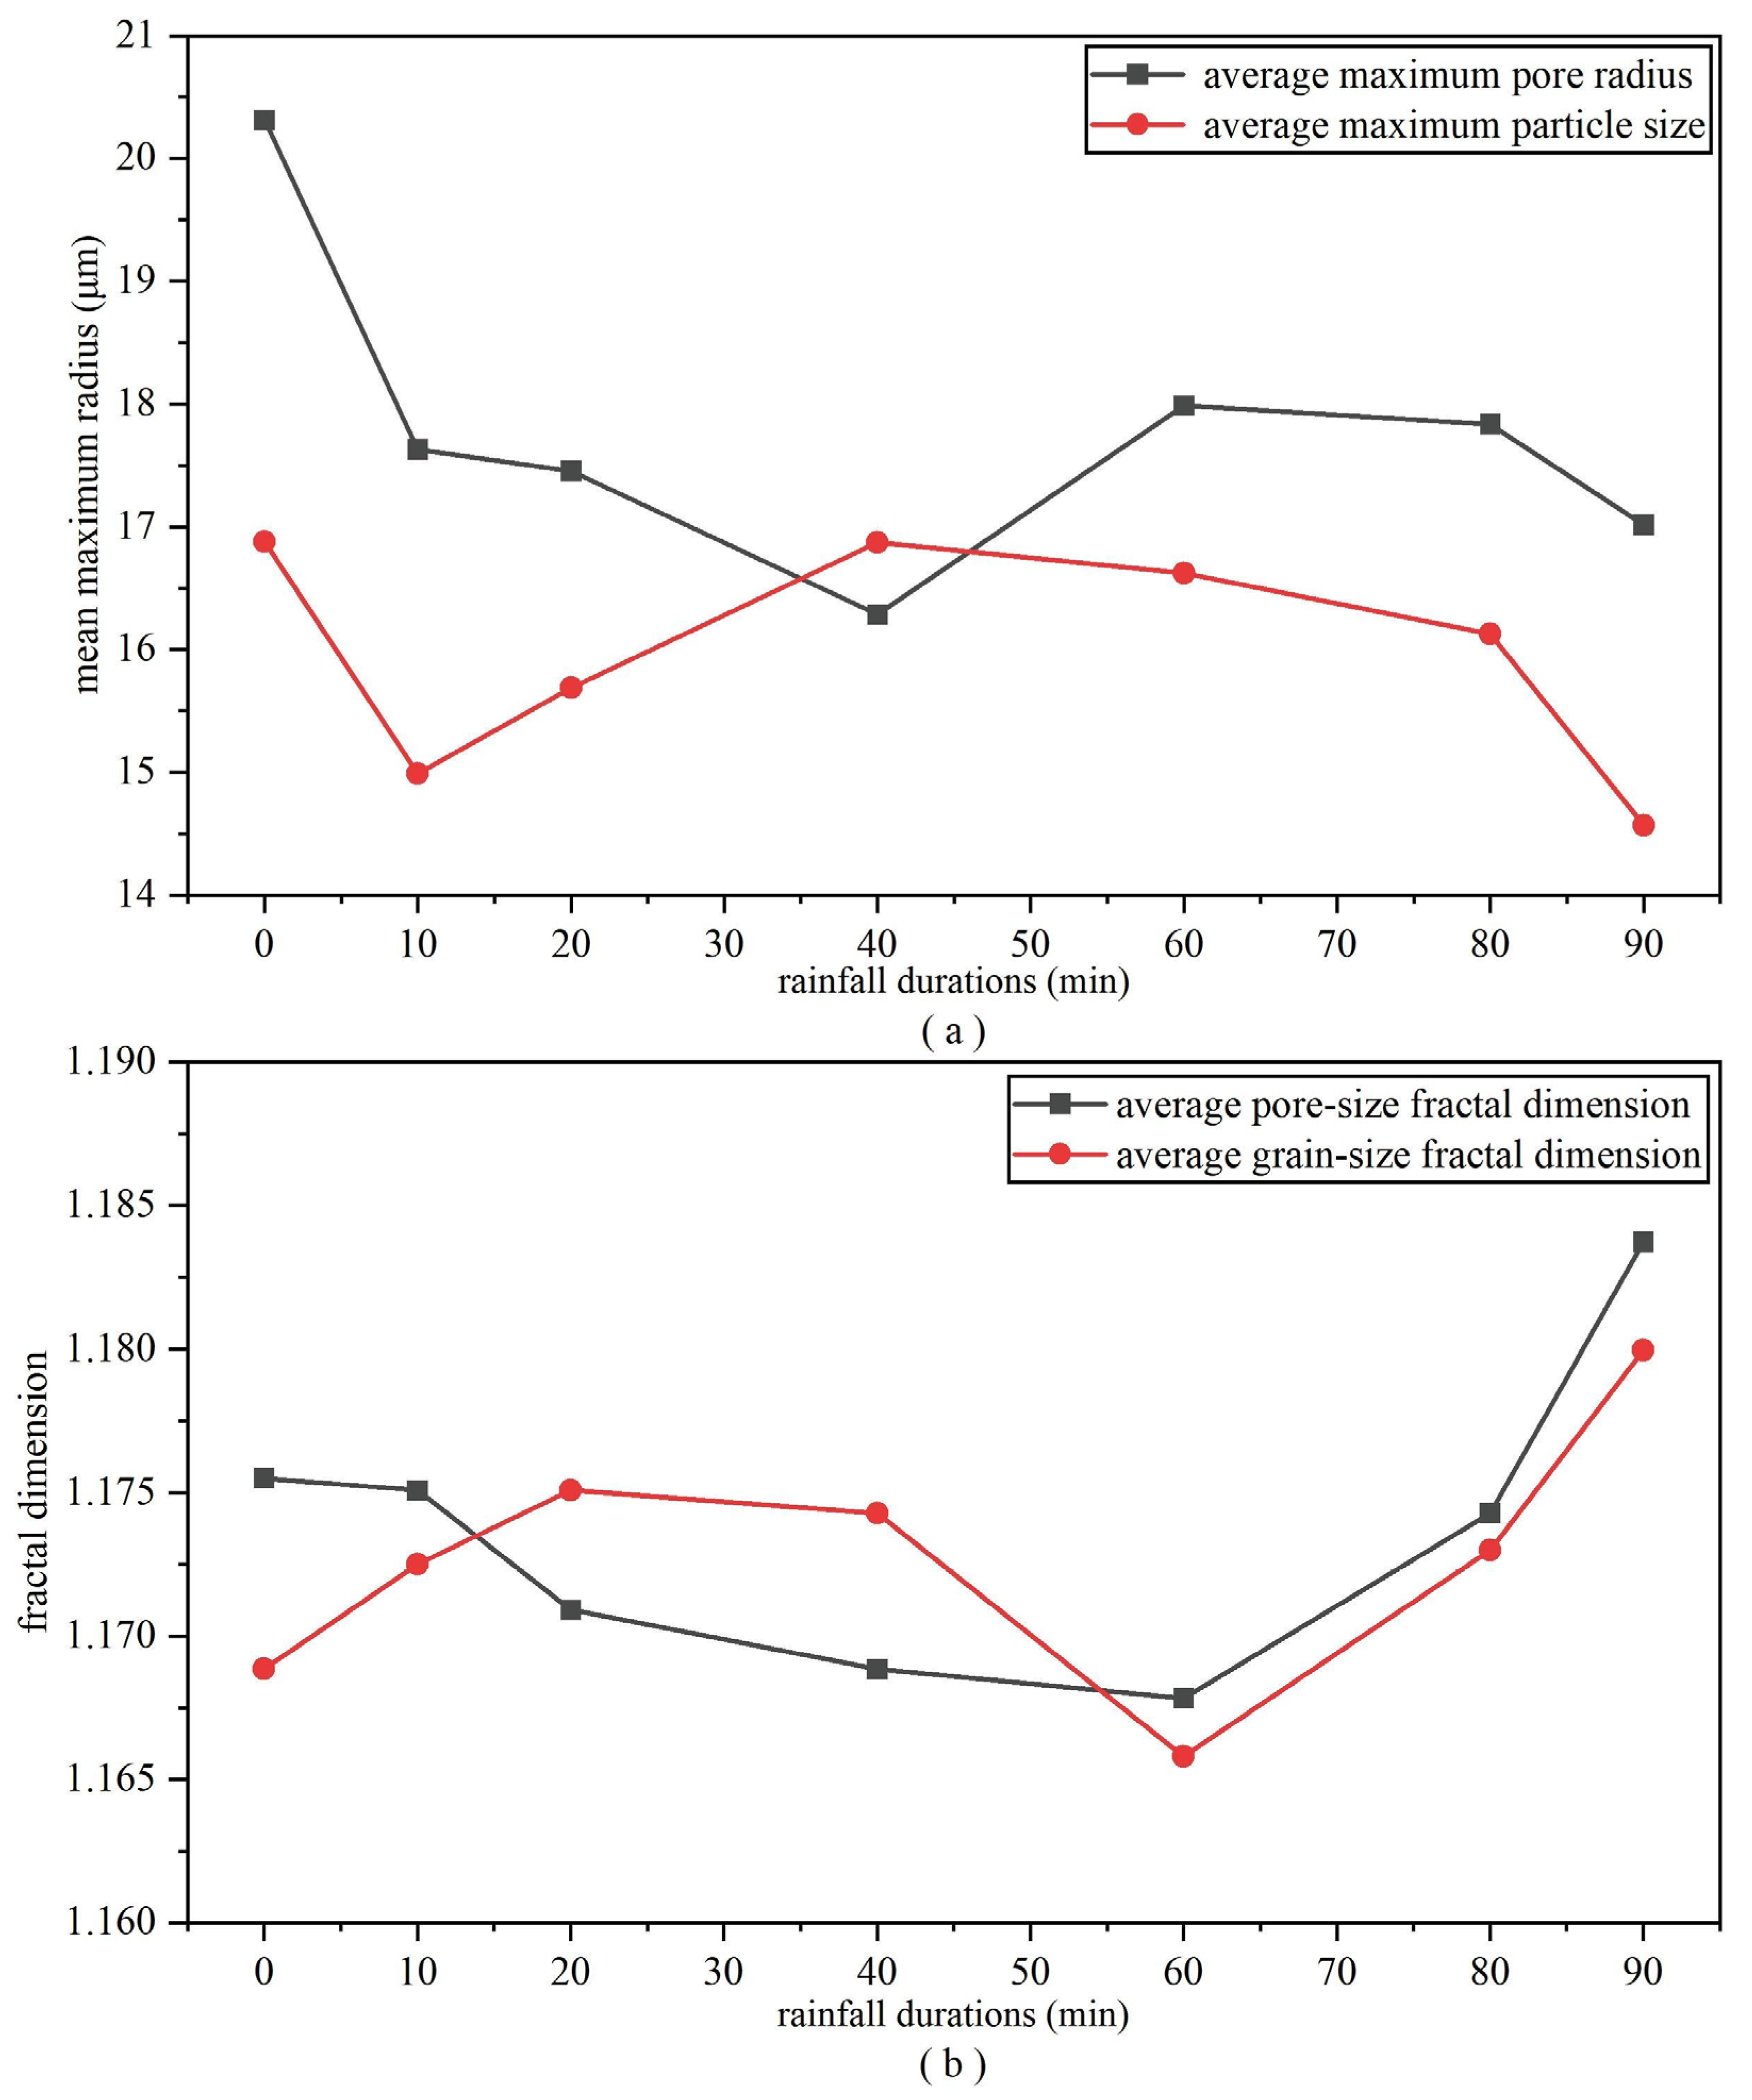
The soil sampling process involved precise extraction from the physical model using a ring cutter (Ø 61.6 mm) at various intervals: prior to rainfall, at 10 min, 20 min, 40 min, 60 min, and 80 min into the rainfall event, and post-landslide occurrence. Subsequently, scanning electron microscopy tests were conducted utilizing a FEI Quanta 250 FEG model field emission environmental scanning electron microscope. Before analysis, the specimens underwent a drying process and were subsequently sectioned into 2 cm × 1 cm × 1 cm cubes. These cubes were manually split along their centerlines to expose fresh surfaces to reveal the soil body’s structure. Any loose soil particles were gently removed using a suction ear ball. The specimens were affixed to the sample stage using an electrostatic adhesive, followed by a gold-spraying process to facilitate surface scanning of microstructures. SEM images were captured at varying magnifications, including 500×, 1200×, 1500×, 2000×, and 2500×. These SEM images were subjected to preprocessing and binarization using software before being imported into Image-Pro Plus software for the quantitative analysis of the micro-particle structure parameters under consideration.
3. Physical Simulation Tests of Rainfall-Induced Landslides
3.1. Primary Deformation Processes of Landslides
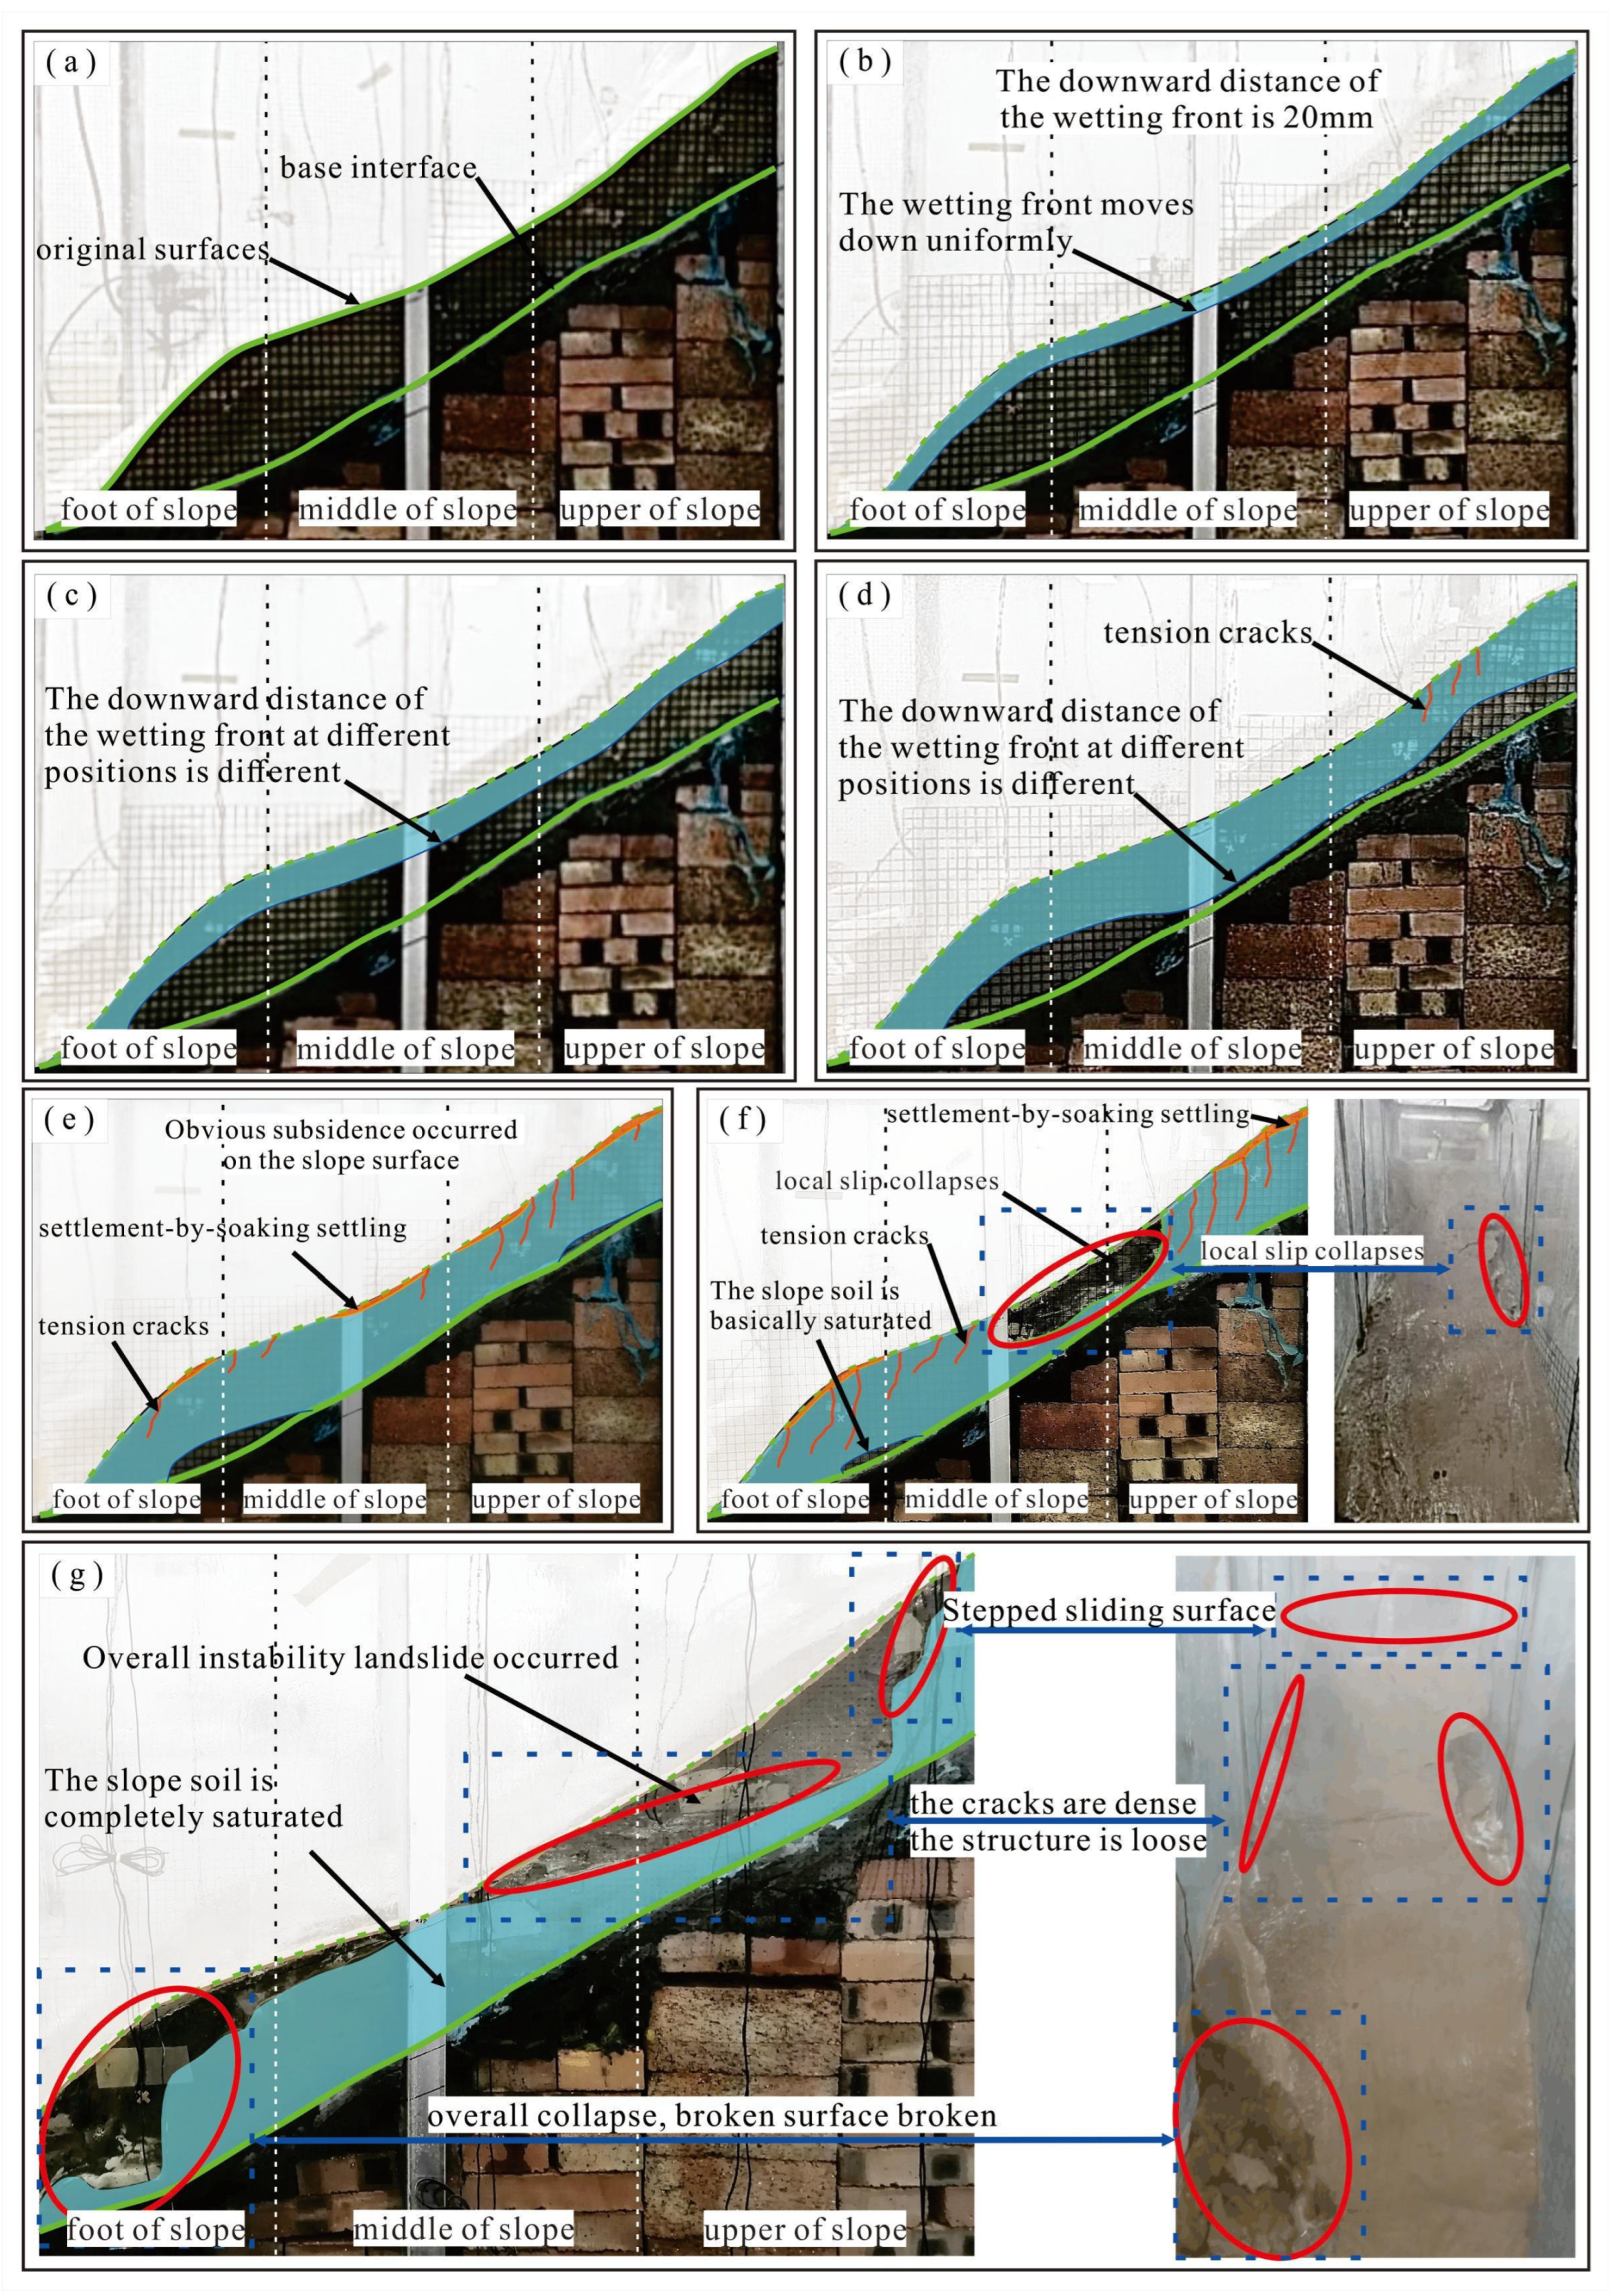
The initial state of the model, as shown in
Figure 4a, had a slope of approximately 35° and a base-cover interface depth of between 14 and 24 cm. Under the influence of a rainfall intensity measuring 2.53 mm/h,
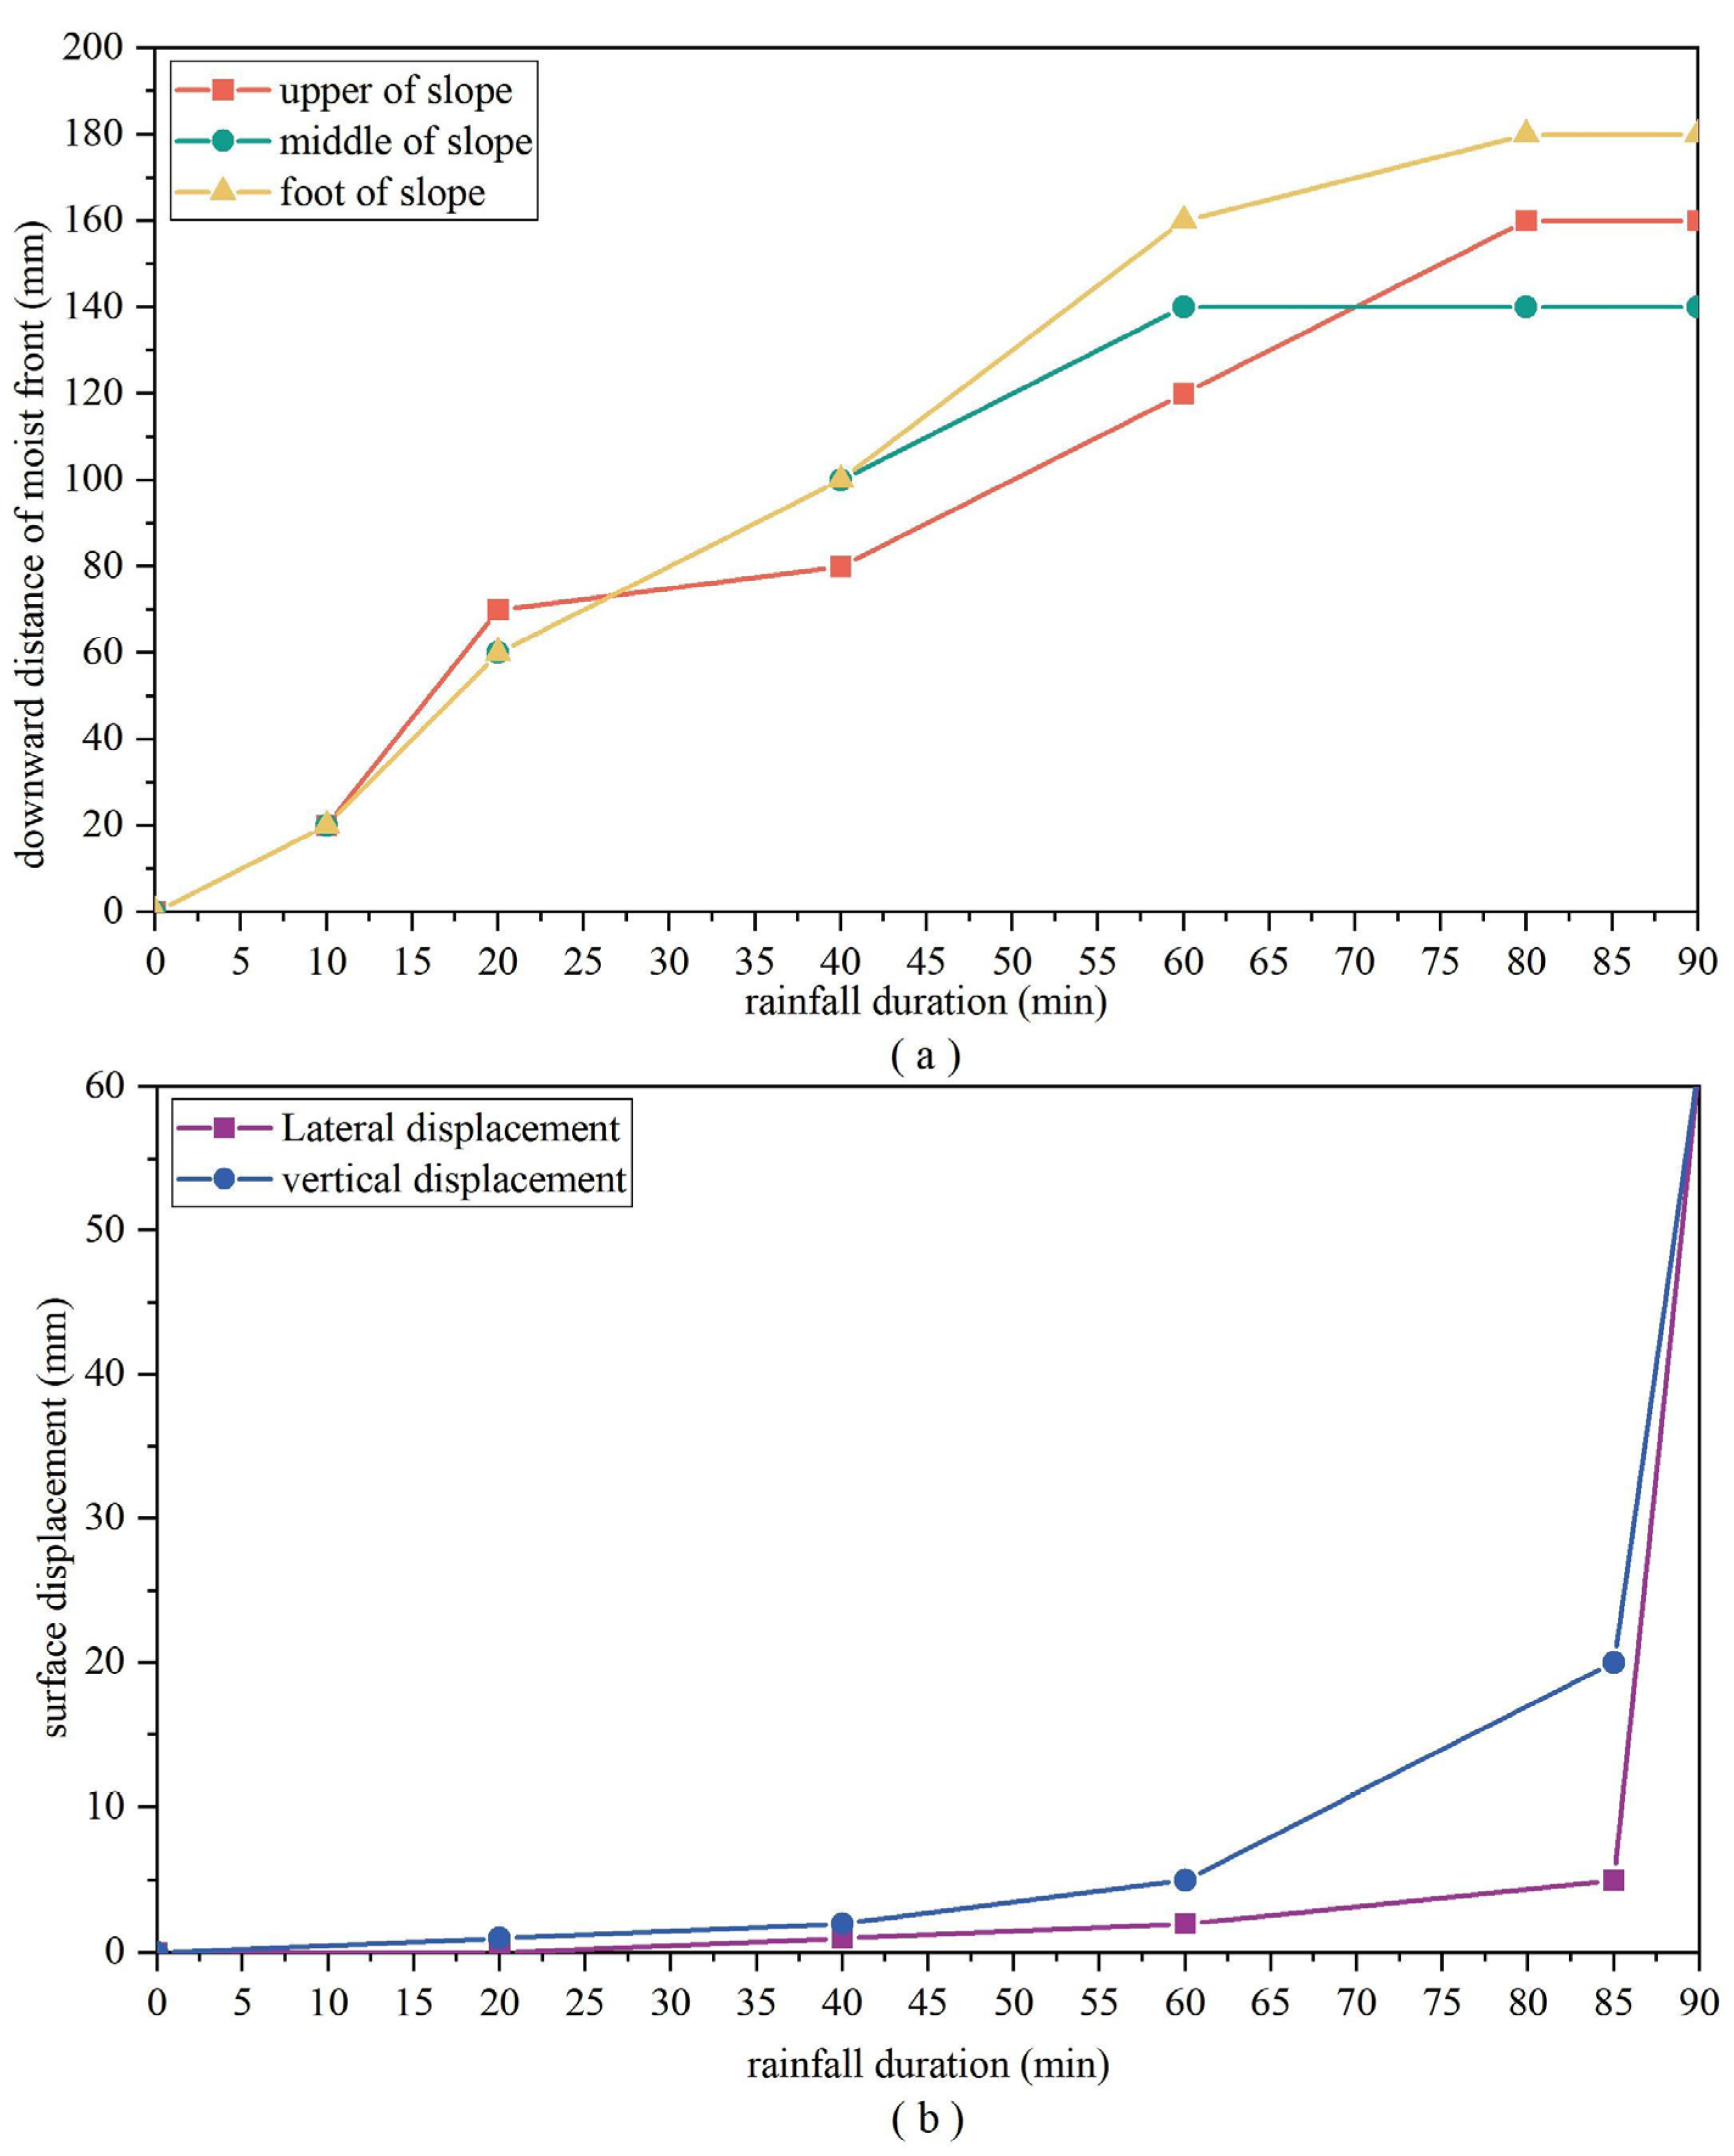
Figure 4b illustrates the model’s state after 10 min of simulated rainfall. The monitor of the wetting front and slope displacement, detailed in
Figure 5, reveals a uniform downward movement of the wetting front. Specifically, the average downward distance across the upper, middle, and lower sections of the slope is 20 mm, and no significant slope displacement is evident during this phase.
The state of the model after 20 min of rainfall is shown in
Figure 4c, where the downward displacement of the wetting front remains uniform throughout. In particular, the middle and lower sections of the slope exhibit an average downward distance of 60 mm, while the upper part records an average downward distance of 70 mm. The slope surface begins to gradually saturate at this juncture, albeit with no pronounced slope displacement.
The state of the model after 40 min of rainfall is illustrated in
Figure 4d. The average downward displacement of the wetting front in the upper section reaches 80 mm, whereas the middle and lower sections measure 100 mm. At this stage, the slope exhibits vertical displacement, albeit relatively minimal, with displacement amounts not exceeding 2 mm. Additionally, horizontal displacement remains insignificant, while minute cracks start to form in the middle and upper parts of the slope.
The model’s condition after 60 min of rainfall is portrayed in
Figure 4e. In the upper section of the slope, the wetting front undergoes an average downward displacement of 120 mm, while the middle section records 140 mm and the lower section shows 160 mm. The saturation of the soil layer intensifies, leading to a progressive increase in the vertical displacement. Lateral displacement also becomes noticeable but remains limited, with displacement amounts within the 2 mm range. During this phase, the slope surface generates flow, and water infiltration along the cracks in the middle and upper sections initiates the development and expansion of small cracks.
Figure 4f illustrates the model’s state after 80 min of rainfall. During this time, the soil layer of the slope becomes fully saturated, resulting in the emergence of slope flow. Vertical displacement continues to surge while lateral displacement gradually intensifies. The slope experiences an escalation in the development and enlargement of cracks, particularly in the upper and middle sections, leading to localized damage. This phase is also marked by minor slip and collapse incidents.
Lastly,
Figure 4g portrays the model’s condition after 85 min of rainfall. The slope’s soil layer is entirely saturated, coexisting with a sharp increase in both lateral and vertical displacement. The slope body slides along existing cracks and disintegrates, culminating in a landslide event. The leading edge of the landslide collapses as a single entity, shattering the slope surface. Horizontal cracks develop in the middle of the landslide, contributing to structural loosening. The rear edge of the landslide collapses, giving rise to the formation of a stepped downward surface.
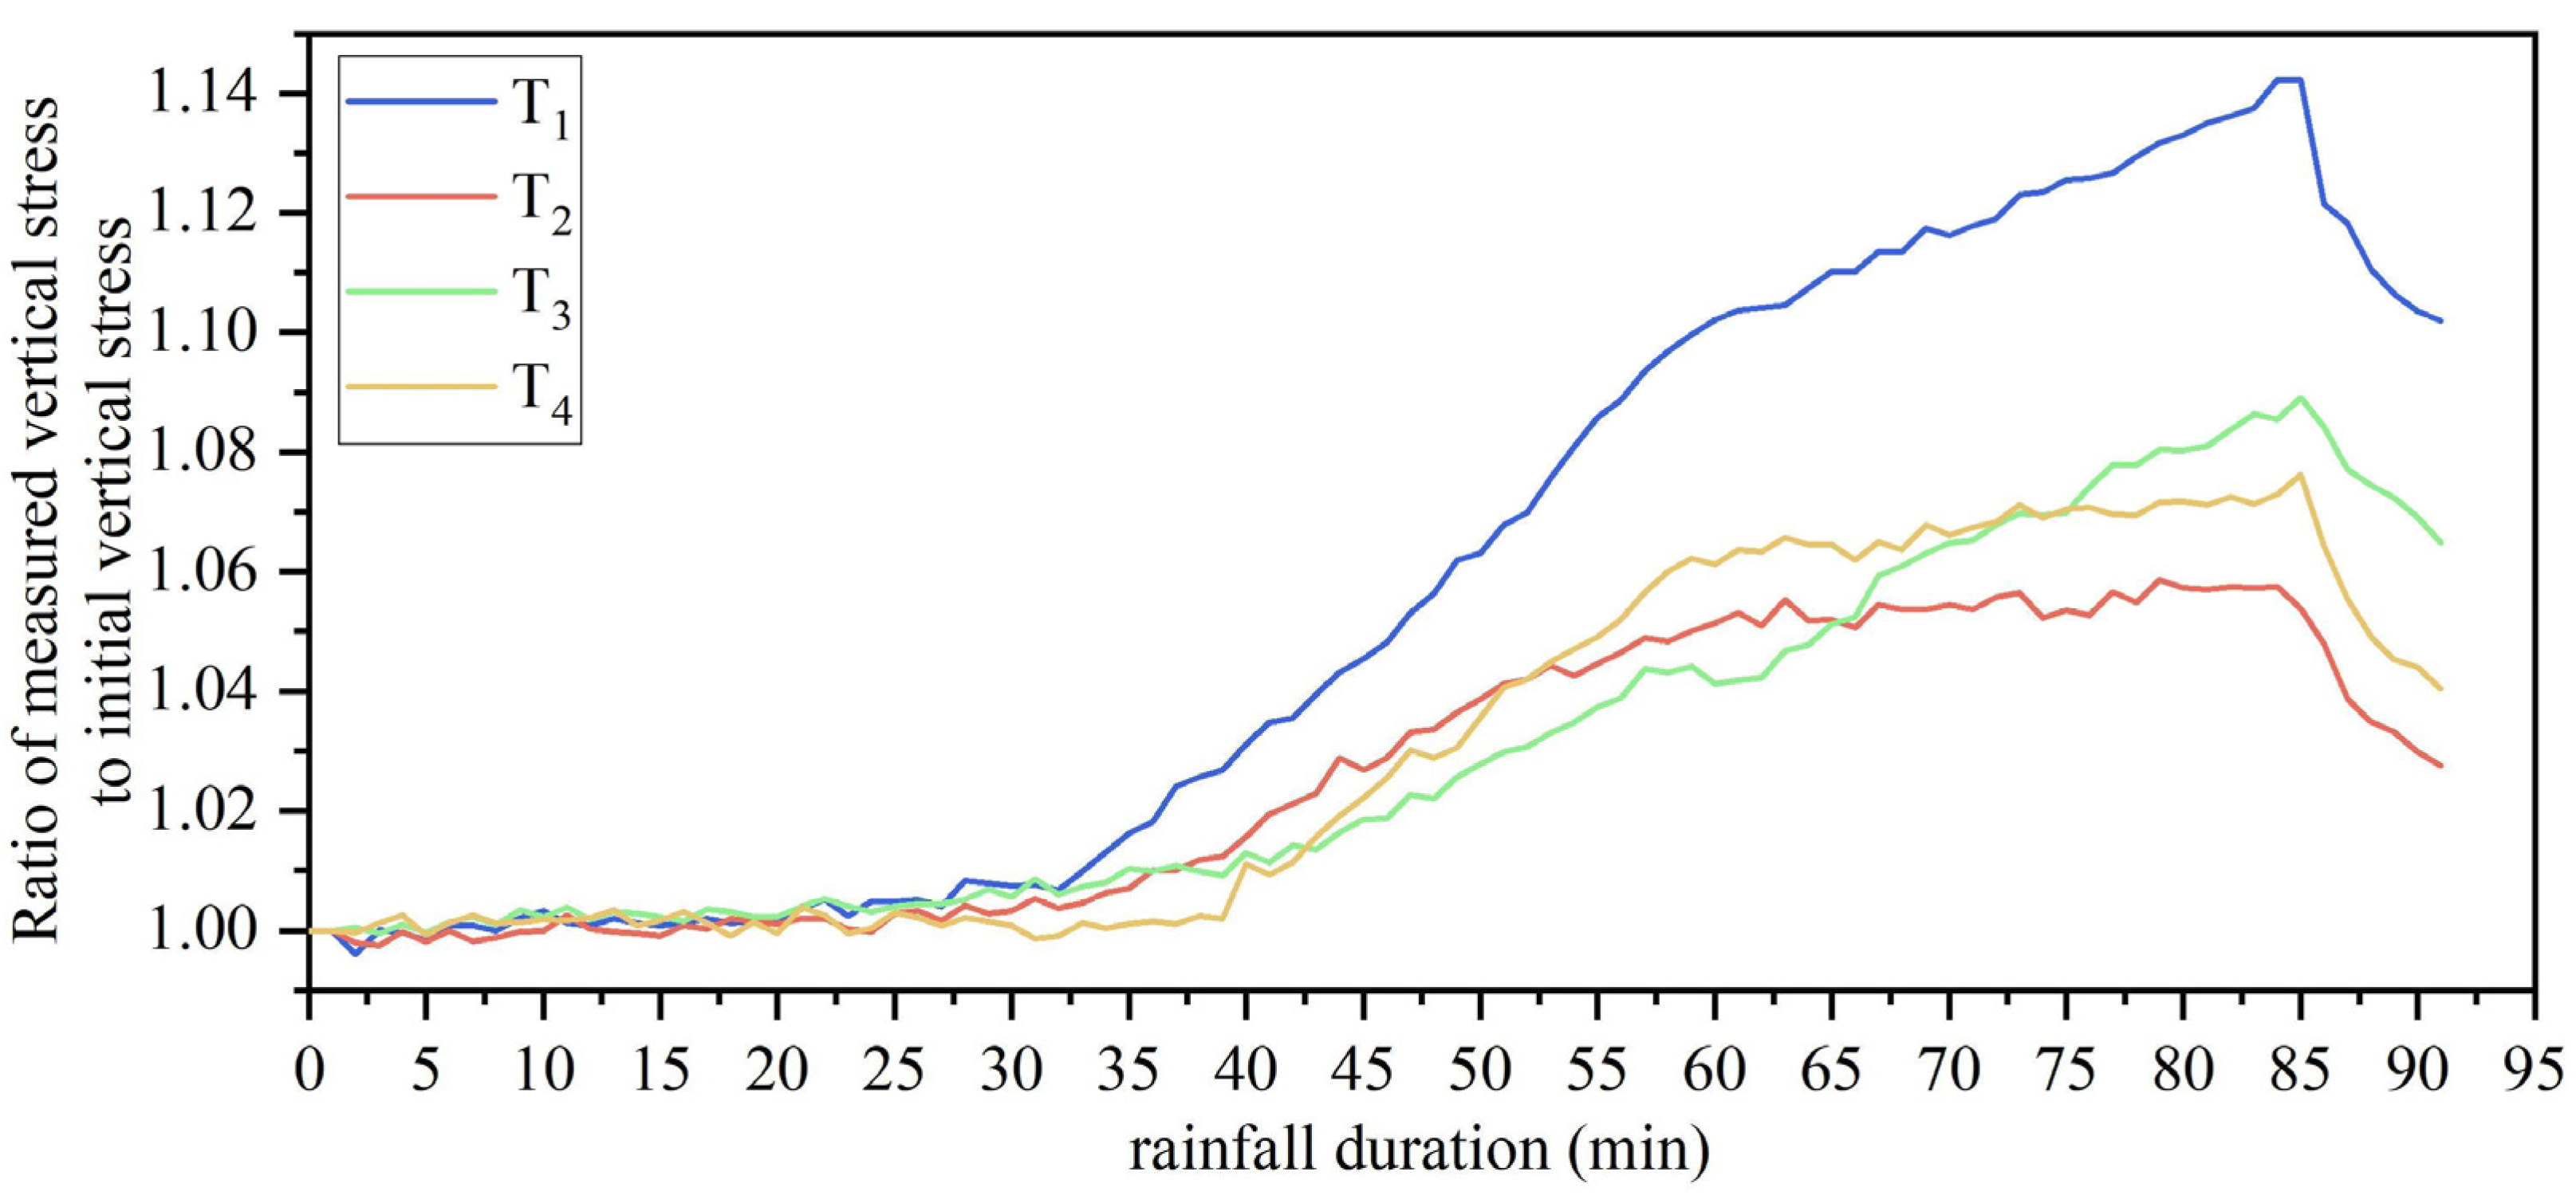
3.2. Analysis of Vertical Stresses Monitoring Test Results
The results of vertical stresses monitoring in the model are displayed in
Figure 6. The T
1 curve represents data obtained by averaging the measurements from vertical stresses sensors t
1 and t
2. Similarly, the T
2 curve derives from the average of t
3 and t
4 measurements, the T
3 curve from t
5 and t
6, and the T
4 curve from t
7 and t
8.
With a rainfall intensity of 2.53 mm/h, vertical stress increments in all sections of the model remain minimal for rainfall durations less than 40 min. Beyond the 40 min mark, there is a sharp escalation in vertical stress increment. Notably, at T1, located at the foot of the slope, this increment accelerates rapidly, advancing nearly 10 min ahead of other sections along the slope. Beyond the 60 min threshold, these increments persist with an upward trend but at a decelerated pace. It is worth noting that the growth rate of vertical stress increments at T3, situated in the middle and upper part of the slope, remain relatively consistent until the occurrence of landslide damage, at which point they experience a sharp decrease. Up until the point of landslide damage, the soil pressure increment at T1, located at the foot of the slope, stands as the most substantial. Following the landslide, T3, in the upper-middle part of the slope, exhibits the next highest soil pressure increment, succeeded by T4, located in the upper portion of the slope. T2, found in the lower-middle part of the slope, demonstrates the smallest soil pressure increment.
Referring to
Figure 6, it is evident that as heavy rainfall persists, rainwater infiltrates continuously, thereby increasing the self-weight of the slope. The base of the slope not only supports the self-weight of its segment but also sustains the pressure transmitted from the upper and middle sections of the slope. Consequently, the incremental rate and growth of soil pressure at T
1, located at the foot of the slope, surpass that of the upper and middle portions.
Post the 40 min threshold of uninterrupted rainfall, the upper-middle segment of the slope commences the formation of fissures, which gradually widen with the prolonged duration of rainfall. At the 58 min mark, during rainfall, these cracks compromise the structural integrity of the upper and upper-middle sections of the slope. This, in turn, diminishes the pressure exerted on the upper-middle part of the slope from the section above, thereby explaining the reduction in soil pressure increment at T3 during the 60 min rainfall period.
As the rainfall persists, the soil on the slope progressively nears saturation, leading to the emergence of slope flow and a subsequent decline in the volume of infiltration. Consequently, the pace of the vertical stress increment in the model experiences a deceleration. Conversely, the cracks in the middle and upper segments of the model persist in expanding, forming an efficient water-conduction pathway for smooth infiltration. This sustained development ensures that the growth rate of vertical stress increment at T3, located in the middle and upper portions of the model, remains consistent and ultimately surpasses that of T2 in the middle and lower sections during the later stages.
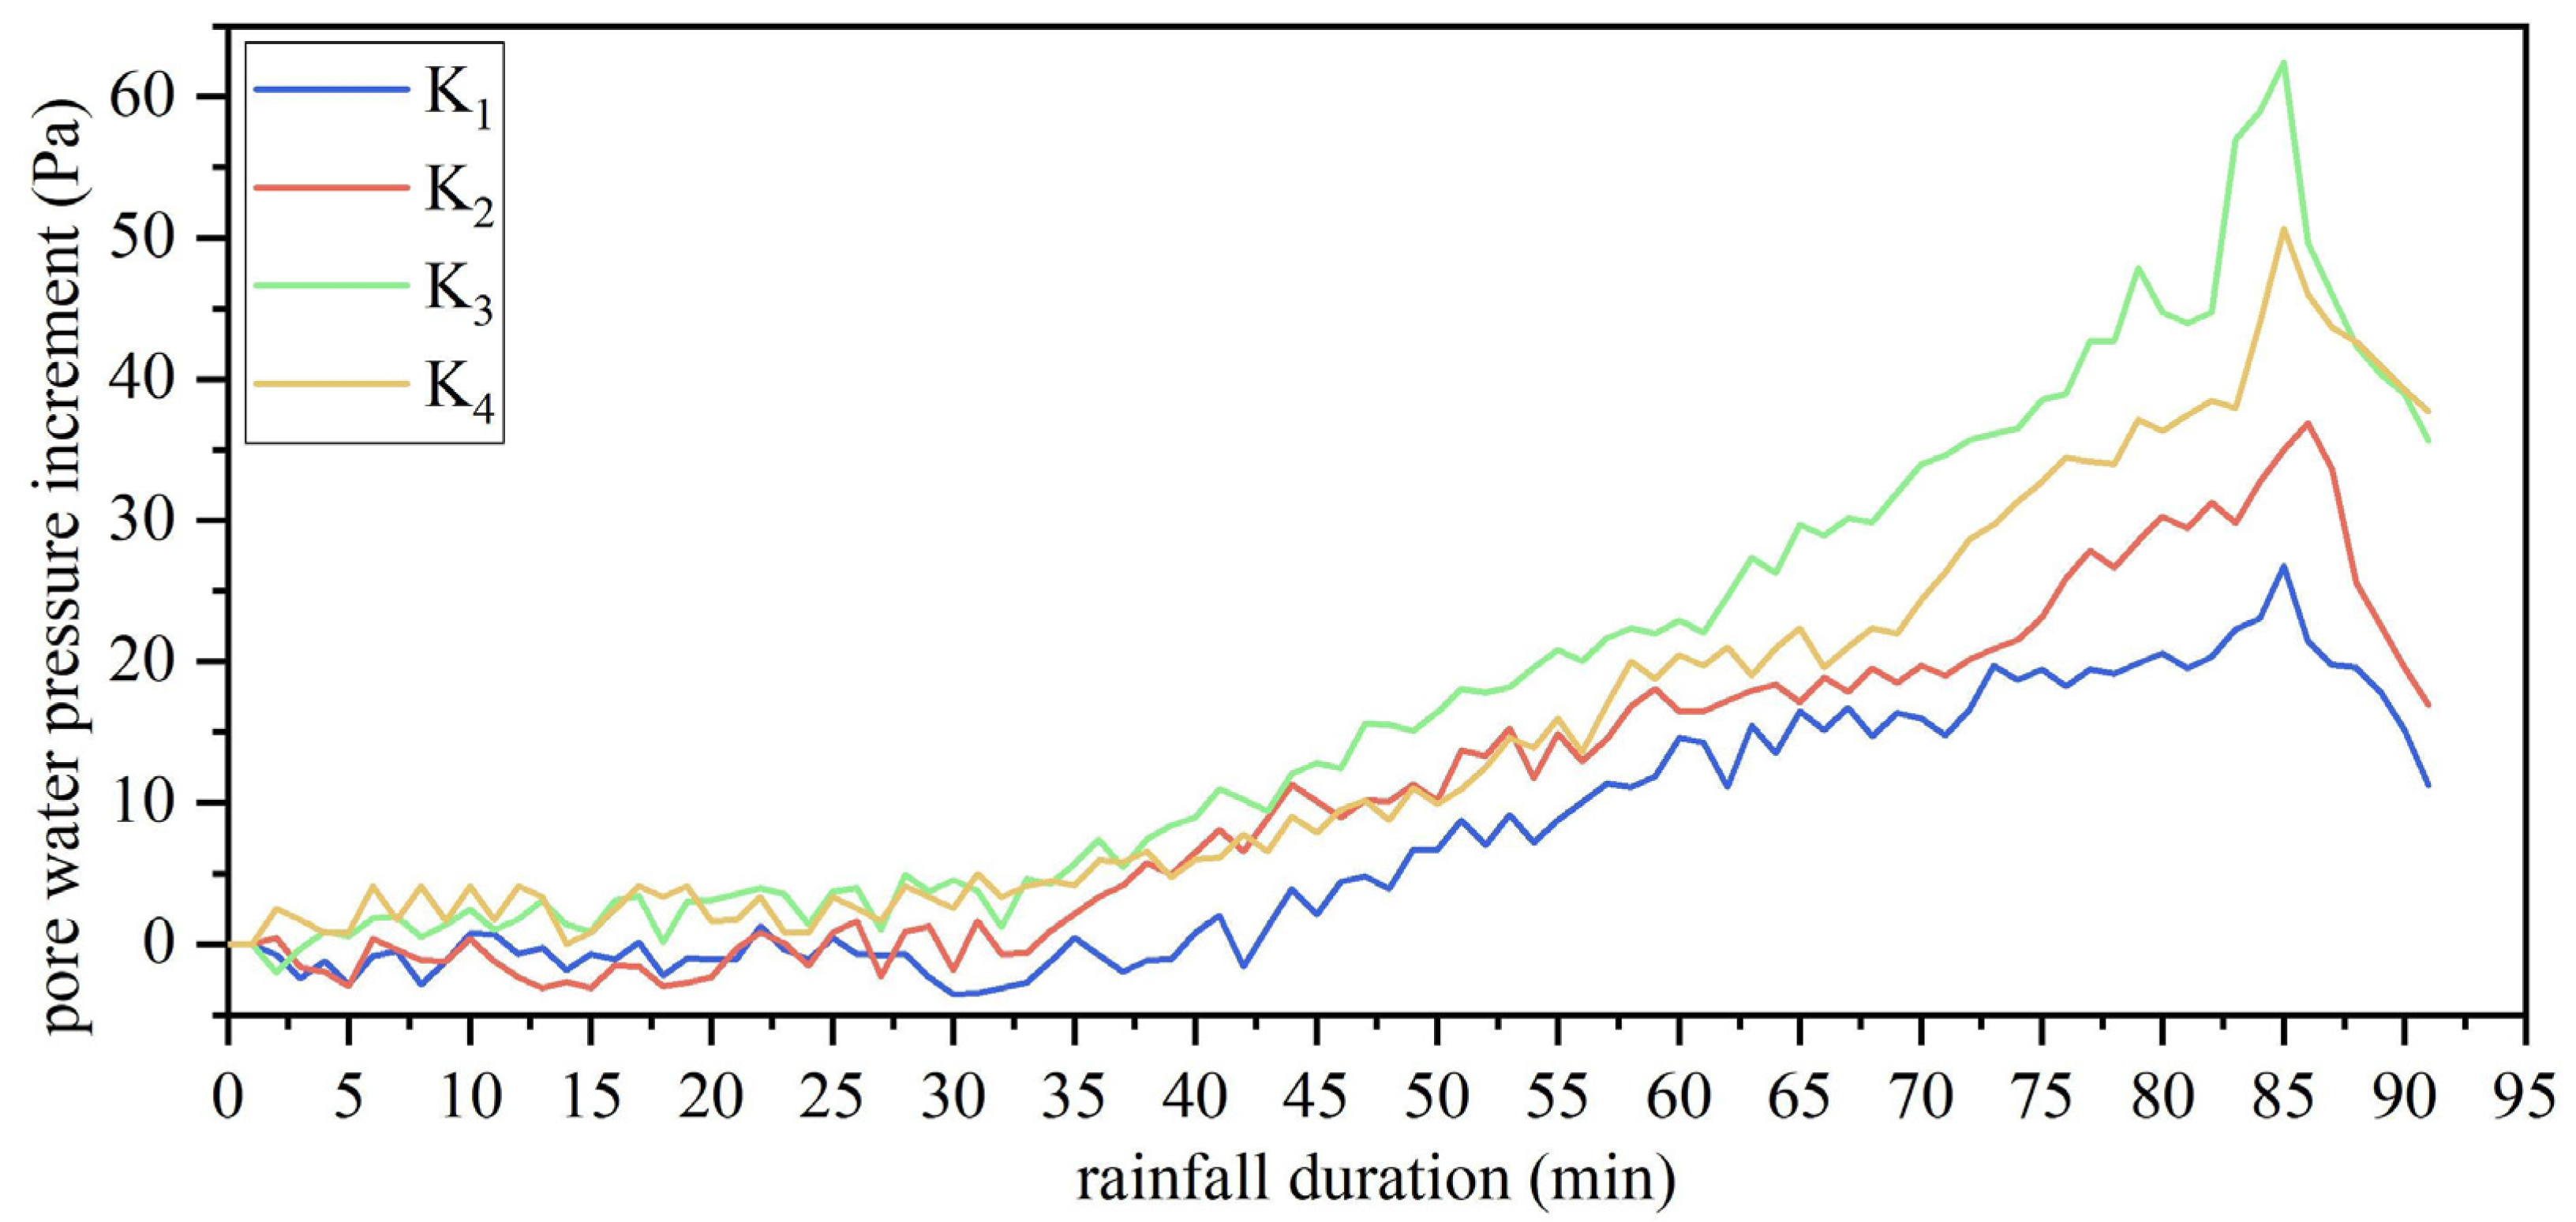
3.3. Analysis of Pore Water Pressure Monitoring Test Results
Figure 7 illustrates the pore water pressure monitoring curve of the model. The K
1 curve is derived from the average of k
1 and k
2 monitoring data, while the K
2 curve is based on the average of k
3 and k
4 monitoring data. Similarly, the K
3 curve is formed from the average of the k
5 and k
6 monitoring data, and the K
4 curve is a result of averaging the k
7 and k
8 monitoring data.
In the context of a rainfall intensity of 2.53 mm/h, each slope section registers a small pore water pressure increment when the rainfall duration is less than 40 min. Subsequently, during the 40 to 80 min timeframe, the pore water pressure increment in all slope sections experiences a gradual increase. The K3 pore water pressure increment, situated in the upper-middle portion of the model, exhibits a more pronounced growth rate than the other segments of the slope, with this growth rate intensifying after the 60 min mark. Beyond 80 min of continuous rainfall, the pore water pressure escalates rapidly across all monitoring sites, reaching its peak upon landslide damage. Following this event, there is a rapid decline in pore water pressure.
As depicted in
Figure 7, the persistence of heavy rainfall leads to rainwater infiltration into various slope sections. However, the downward progression of the wetting front within the slope exhibits variation across these regions. This variance arises from the loess’s propensity for wet subsidence, thus inducing non-uniform vertical displacement within the soil mass. Consequently, tensile stresses develop vertically, forming cracks that act as water infiltration pathways. Consequently, there is a significant increase in pore water pressure within these regions. It is worth noting that the initial areas of cracking maintain this advantage throughout subsequent rainfall periods. This phenomenon results in a consistently higher increment and growth rate of pore water pressure in the upper and middle portions of the slope, particularly in K
3, compared to other areas, during rainfall events lasting less than 40 min.
Following more than 80 min of continuous rainfall, cracks on the slope continue to expand, leading to localized shallow surface slide and collapse events in certain upper and middle slope areas. However, these areas eventually stabilized soon. This dynamic explains the dip and subsequent rise in the K3 curve after the 80 min mark.
5. Discussion
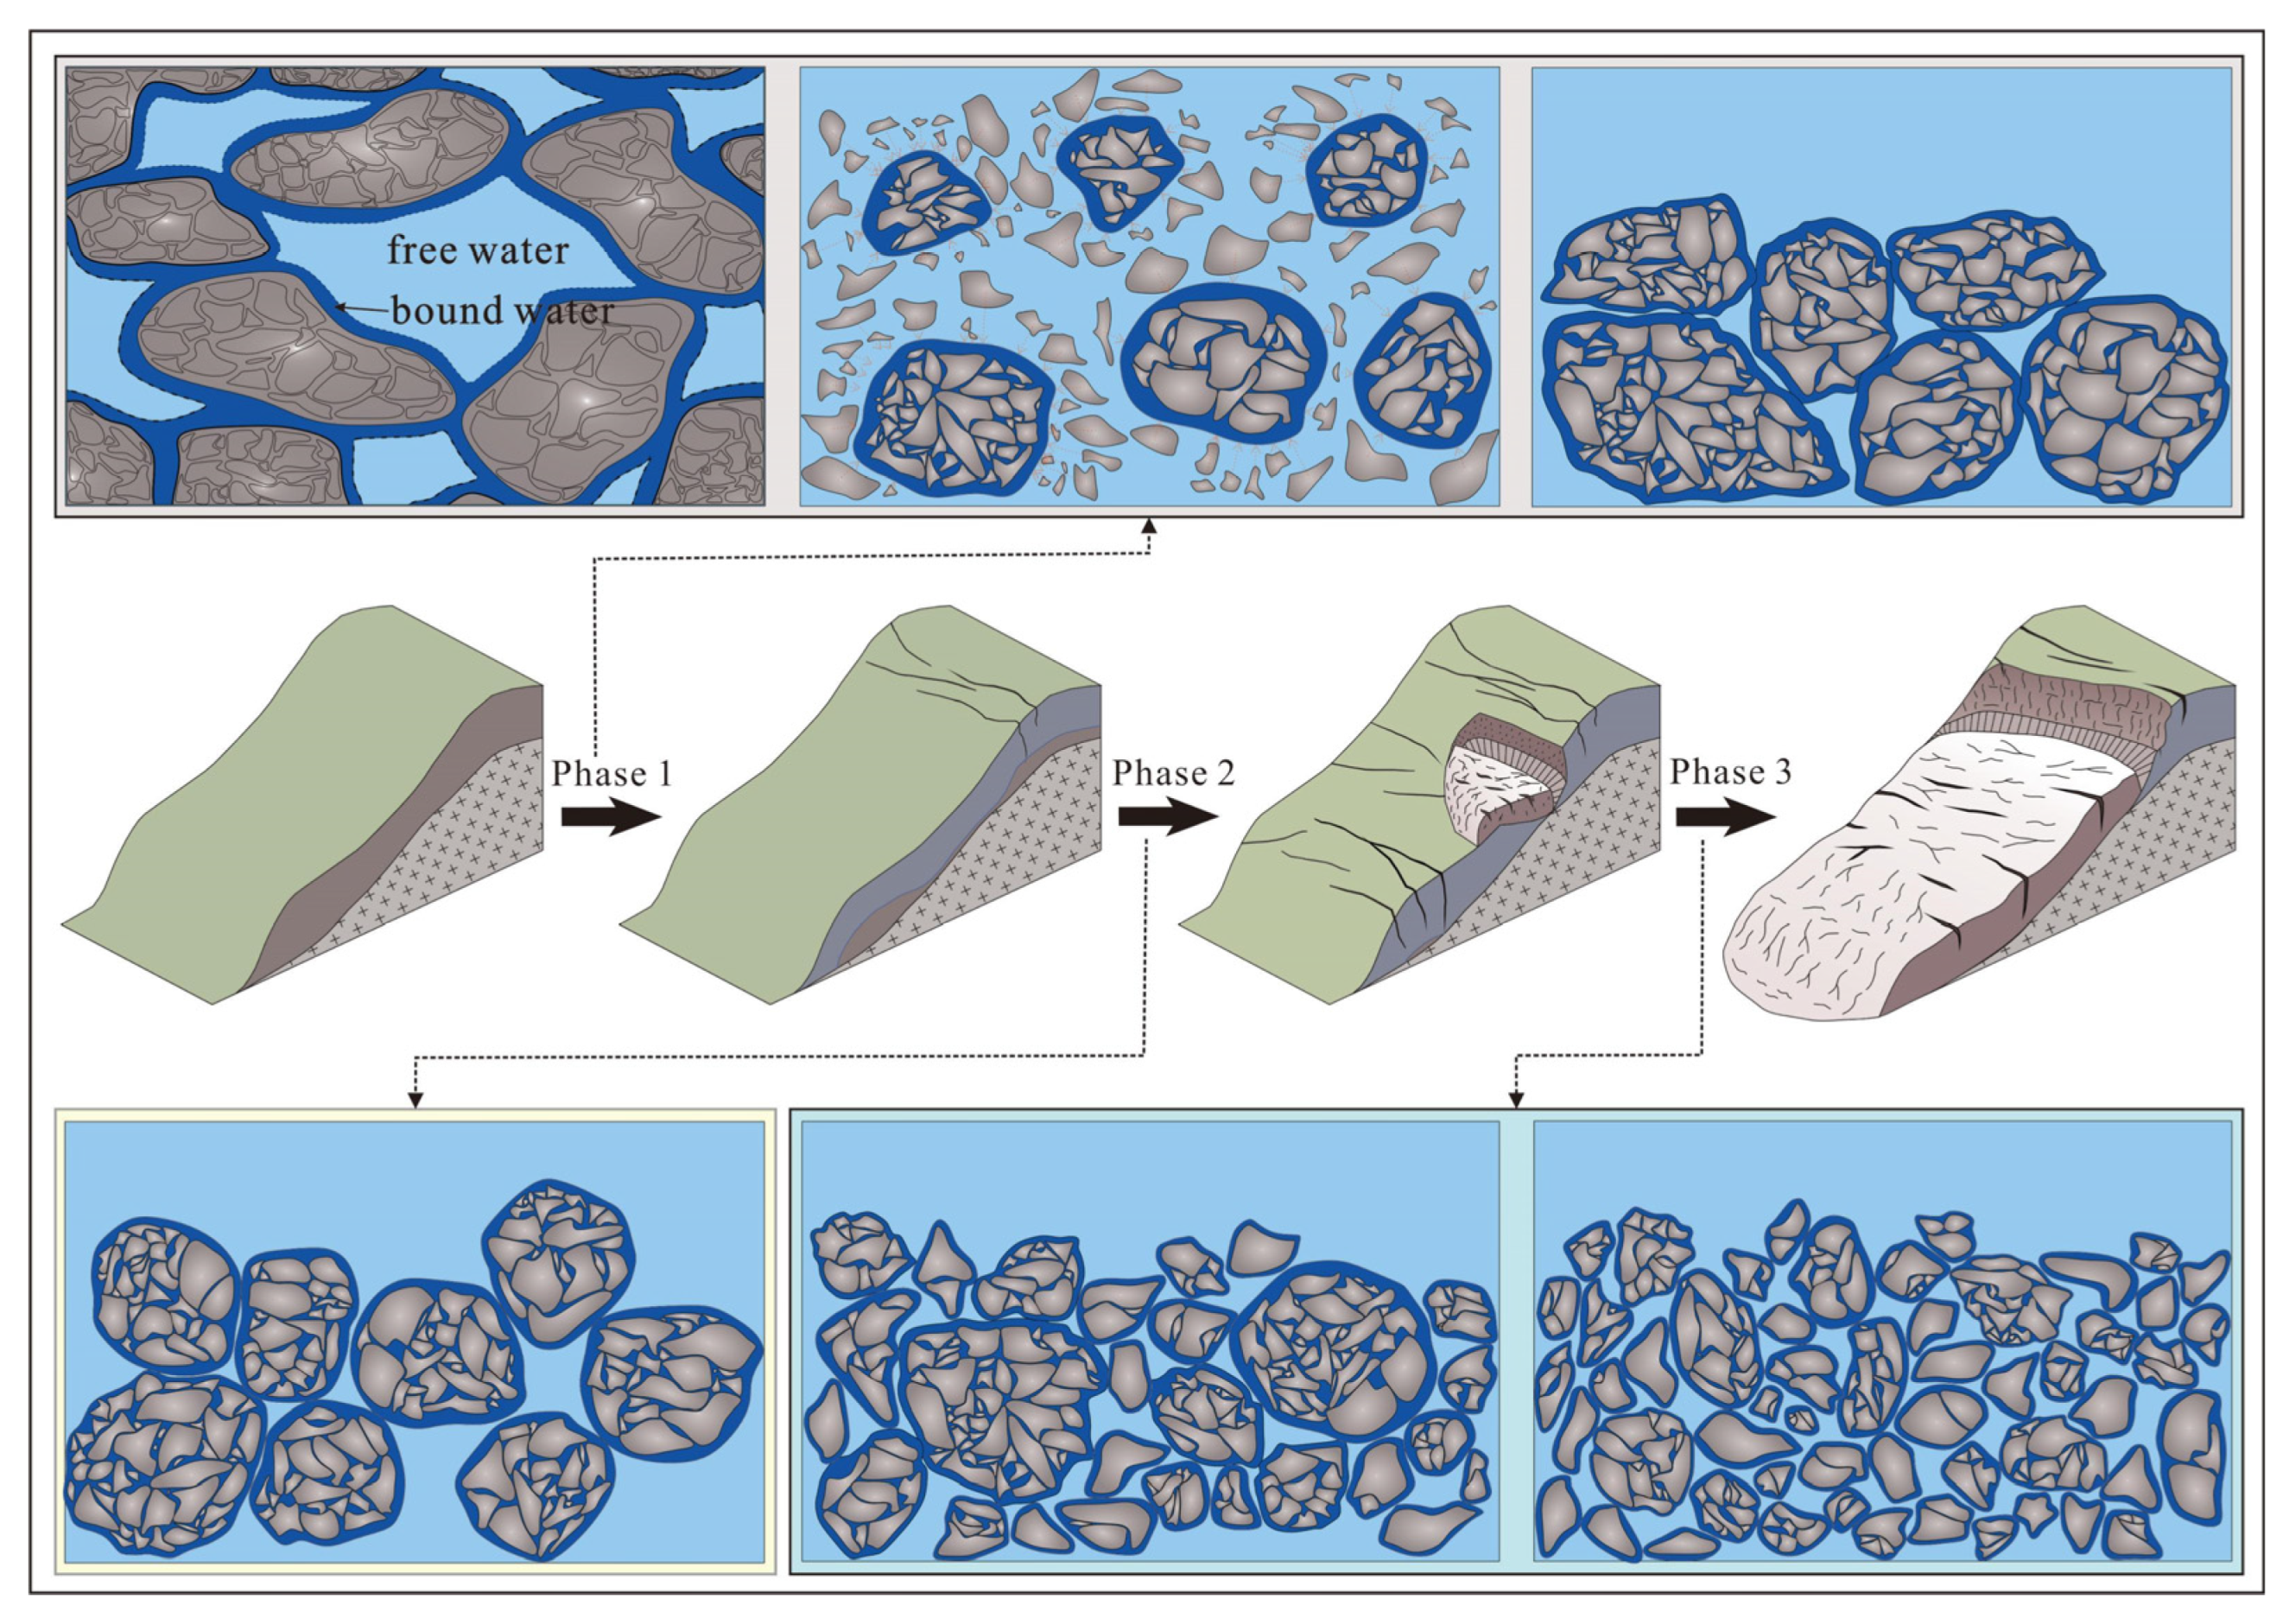
Based on the findings obtained from physical modeling tests and scanning electron microscope analyses, the simulation of this landslide can be divided into three distinct stages, which are discussed in correlation with microscopic observations (refer to
Figure 11):
Phase 1 represents the stage of compression settlement and crack formation. In the initial phase of continuous rainfall, rainwater infiltration gradually saturates the upper soil layer. Various portions of the slope undergo a gradual increase in vertical stresses. At this juncture, the foot of the slope exhibits a slightly advanced increment in vertical stresses compared to other sections. Simultaneously, the increase in pore water pressure precedes the increase in vertical stresses. Immersion in water initiates the fragmentation of soil particles within the saturated layer. The hollow pores of the soil succumb to collapse, eventually being filled by agglomerates formed from the broken small particles. This process leads to soil compaction and sinking. Nonetheless, owing to the uneven slope gradient, the thickness of the saturated layer varies across different regions, resulting in differential subsidence. This differential subsidence generates tensile stress within the soil, ultimately leading to crack formation.
Phase 2 represents the stage of crack development and uniform deformation. Water infiltrates through the vertical joints in the loess while existing upper cracks serve as preferential channels for rainwater infiltration. This concurrent process accelerates local saturation. With the continuous infiltration and transportation of rainfall, cracks propagate downward, eventually evolving into weak structural surfaces. The slope undergoes gradual creep, prompting liquefaction in the loess adjacent to these weak structural surfaces. The initially large clumps of grain structures transform into smaller, rounded clumps from their irregular shapes. During this phase, the vertical stress increment in each section steadily rises. As the slope soil approaches saturation, the rate of vertical stress increment growth diminishes. The presence of cracks compromises the integrity of the upper and middle parts of the slope, leading to a reduction in the transmitted pressure from the upper portion. Consequently, the vertical stress increment in this region declines while the pore water pressure in each section continues to increment slowly.
Phase 3 represents the stage of accelerated deformation and damage. In the late rainfall period, the upper section of the slope experiences minor slipping firstly. The original agglomerate structure disintegrates, causing the particle structure to become complex and the soil to loosen to facilitate rainwater infiltration. Cracks persist in their development and expansion, eventually merging to form a hazardous sliding surface. The slope continues to creep, intensifying liquefaction in the loess near the sliding surface and decreasing the strength. This culminates in the sudden onset of a landslide, characterized by a fractured slope surface and prominent cracks. The rear edge of the sliding surface adopts a stepped configuration, marked by the significant fragmentation of agglomerates. The pore space enlarges, and the soil structure loosens. During this phase, the rainwater infiltrates to the lower bedrock, a water-saturated layer is formed, the soil within the water-saturated layer is gradually offset by the buoyancy of the water and the soil’s self-weight, reducing the vertical effective stress, so that the friction strength of the soil is reduced, and ultimately leading to the occurrence of landslides.
In summary, the development process of rainfall-induced loess landslides in the Ili region of Xinjiang, China can be delineated as follows: initial atmospheric rainfall triggers rainwater infiltration and vertical joint infiltration, leading to granular fragmentation, pore collapse, and slope subsidence, thus resulting in differential subsidence and tensile cracks. These cracks subsequently act as primary infiltration channels, initiating slope creep and slight liquefaction. Over time, the cracks expand and develop, sustaining creep and inducing substantial liquefaction. Local slip collapses, and agglomerate disintegration and pore expansion follow. Ultimately, the attenuation of vertical effective stress and loss of strength causes a sudden deep-seated landslide. This process is characterized by an initial phase of slow creep accumulation, followed by prolonged equal velocity deformation, and culminating in a final phase of rapid, sudden sliding damage.

 ,
, 
