Abstract
Suspended sediments have profound impacts on marine primary productivity and the ecological environment. The Yellow River estuary and its vicinity waters, with a high dynamic range of suspended sediment concentration (SSC), have important eco-environmental functions for the sustainable development in this region. The multispectral imager (MI) on board China’s first Sustainable Development Goals Science Satellite 1 (SDGSAT-1) features seven high-resolution bands (10 m). This study employs multispectral imagery obtained from SDGSAT-1 with single-band and band-ratio models to monitor the SSC in the Yellow River estuary and its vicinity waters. The results show that SDGSAT-1 images can be used to estimate the SSC in the Yellow River estuary and its vicinity waters. The overall pattern of the SSC exhibits a notable pattern of higher concentrations in nearshore areas and lower concentrations in offshore areas, and the retrieved SSC can attain values surpassing 1000 mg/L in nearshore areas. The R2 values of both the single-band and the band-ratio models for SSC inversion exceed 0.7. The single-band model R(854) demonstrates superior performance, achieving the highest R2 value of 0.93 and the lowest mean absolute percentage error (MAPE) of 44.04%. The single-band model based on SDGSAT-1 R(854) tends to outperform the band-ratio models for waters with algal blooms, which may be used for inversions of SSC and/or suspended particulate matter (SPM) in the waters full of algal blooms and suspended sediments. The monitoring results by SDGSAT-1 suggest that the complex SSC distributions in the Yellow River estuary and its vicinity waters were highly impacted by the river sediments discharge, tide, currents and wind-induced waves.
1. Introduction
The suspended sediment concentration (SSC) is a key parameter of waters, and previous studies have shown a good correlation between water turbidity and SSC [1]. Due to factors such as soil erosion and sediment deposition in the Loess Plateau in China, the SSC concentration within the Yellow River estuary is generally high, with differences in concentration of up to several hundred or even thousands of mg/L compared to its vicinity waters [2]. Suspended sediments can elevate water turbidity, intensifying the absorption and scattering of solar radiation and subsequently impacting primary productivity and the carbon–nitrogen cycle within marine ecosystems [3,4]. Furthermore, suspended sediments serve as significant carriers of pollutants and organic matter, entering the ocean via riverine inputs and fostering conditions conducive to extensive algal proliferation, thereby jeopardizing the marine ecosystem’s habitat for aquatic organisms [5,6,7]. Hence, conducting an investigation of SSC in the Yellow River estuary and its vicinity waters holds significant importance for the quantitative analysis of water quality and ecological management in this region.
Regarding investigations on water body SSC, there are currently mainly traditional point measurements and satellite remote sensing inversion methods. Satellite remote sensing inversion surpasses traditional methods by enabling extensive, continuous monitoring that fulfils the temporal and spatial analysis needs for SSC across the entire sea area. Extensive prior research has established remote sensing technology as an effective means of measuring water quality parameters [4,5]. Several satellite sensors, including the Coastal Zone Color Scanner (CZCS), Sea-viewing Wide Field of View Sensor (Sea-WIFS), Moderate Resolution Imaging Spectroradiometer (MODIS), Hyperspectral Imager for the Coastal Ocean (HICO), and Coastal Zone Imager (CZI), are currently utilized for the inversion of suspended sediment concentration (SSC) in water color remote sensing [8,9,10,11,12,13,14]. However, the spatial resolution of these marine color sensors is relatively low, which makes it difficult to achieve fine-scale monitoring of water quality parameters. Land observation satellites are also extensively employed for water quality monitoring, such as Sentinel-2, Landsat-8, GF-1, and others [15,16,17]. However, these satellites exhibit fewer spectral bands with high spatial resolution, narrower image swath widths, lower temporal resolution, and a lack of dedicated bands for nearshore coastal area monitoring. Regarding the remote sensing inversion of SSC in coastal areas, various inversion methods have been proposed, encompassing empirical models, semi-analytical models, analytical models, and neural networks [18,19,20]. Empirical models, which require only a limited amount of input data from measurements, are relatively simple to implement and exhibit strong applicability for regional SSC inversion, as demonstrated in the Yellow River estuary.
In 2021, China’s first Sustainable Development Goals Science Satellite 1 (SDGSAT-1) was launched by China and equipped with a multispectral imager (MI) [21]. The MI offers a swath width of 300 km and an 11-day revisit cycle, comprising seven spectral bands with a spatial resolution of 10 m. This satellite, to some degree, mitigates the constraints of previous satellites in monitoring SSC. Due to the novelty of the SDGSAT-1 satellite in China, there is a scarcity of reported research on SSC monitoring based on this satellite, and further investigation into the applicability of empirical models on its imagery is urgently needed.
Therefore, this study utilizes the multispectral imagery from the SDGSAT-1 MI sensor, in conjunction with in situ SSC measurements, to construct empirical models. The applicability of these models to the imagery from this innovative satellite is analyzed, and the spatiotemporal distribution of SSC in the Yellow River estuary and its vicinity waters region is examined. The findings are anticipated to provide a reference for water quality assessment and implementation of ecological management in coastal zones.
2. Datasets and Methods
2.1. Study Area
The study area is centered around the Yellow River estuary and its vicinity waters (37.11° N—40.21° N, 118.73° E—121.22° E), encompassing the Yellow River estuary, Laizhou Bay, and the central area of the Bohai Sea (Figure 1b). The Yellow River estuary is located in Huanghekou Town, Kenli District, Dongying City, Shandong Province, at the intersection of the Bohai Sea and Laizhou Bay (Figure 1c). Due to soil and water loss on the Loess Plateau and other reasons, the Yellow River estuary experiences notably high suspended sediment concentrations (SSCs), and the SSCs of the coastal waters vary greatly [2]. The Yellow River estuary and its vicinity waters are typical areas for SSC remote sensing inversion research, and monitoring the SSC in this area holds significant implications for assessing the inversion capabilities of new satellite (SDGSAT-1) data.
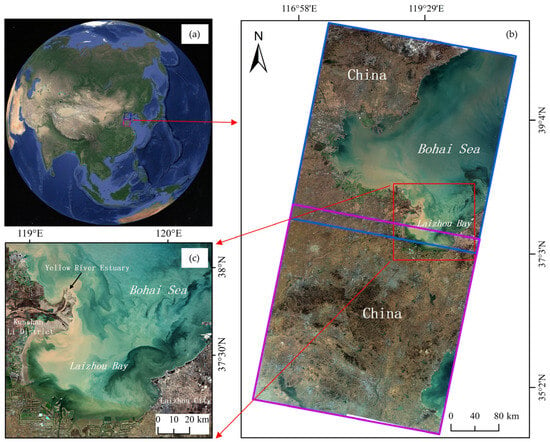
Figure 1.
(a) Study area overview. (b,c) True-color images of the study area based on SDGSAT-1 satellite imagery captured on 12 November 2021. The image within the blue or purple border in (b) represents a standard SDGSAT-1 multispectral image. (c) The image magnified from the red rectangular region in (b).
2.2. Datasets
The satellite image data used in this study include multispectral images of SDGSAT-1, Sentinel-2, Landsat-8, HJ-1 and MODIS (Table 1), which were downloaded from the SDGSAT-1 data open system, the European Space Agency website (https://scihub.copernicus.eu/, accessed on 21 March 2023), the US Geological Survey website (https://earthexplorer.usgs.gov/, accessed on 21 March 2023), the China Centre for Resources Satellite Data and Application website (https://www.cresda.com/, accessed on 28 November 2022), and the website of the National Aeronautics and Space Administration (NASA) of the United States (https://ladsweb.modaps.eosdis.nasa.gov/, accessed on 29 November 2022), respectively. Among them, the L4A level data of SDGSAT-1 MI are the result of orthorectification using ground control points and digital elevation models based on level 1 standard products. When generating SSC data, the auxiliary data encompass not only HJ-1 multispectral images but also the in situ SSC, flow and sediment content data from stations. The SSC data were measured by the research group in 2013 (Figure 2a–c), and the flow and sediment content data were downloaded from the official website of the Yellow River Water Conservancy Commission of the Ministry of Water Resources (http://www.yrcc.gov.cn/, accessed on 28 November 2022). For the analysis of anomalous waters, chlorophyll-a (Chl-a) data were derived from MODIS imagery and obtained from the watercolor products available on NASA’s Ocean Color website (https://oceancolor.gsfc.nasa.gov/, accessed on 2 March 2023). In addition, the tidal data and reanalysis wind field data used in the result analysis were downloaded from the official website of the tide table (https://www.cnss.com.cn/tide/, accessed on 2 March 2023) and the official website of the European Centre for Medium-Range Weather Forecasts (https://www.ecmwf.int/, accessed on 2 March 2023), respectively.

Table 1.
Remote sensing data information.
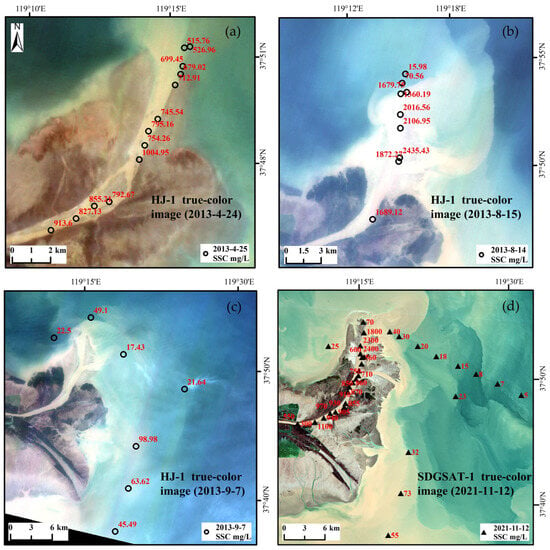
Figure 2.
Distribution of SSC sample data. In figures (a) to (c), black “〇” symbols represent the locations of field-measured SSC data in 2013, with data collected on 25 April (a), 14 August (b), and 7 September (c). The background images in figures (a) to (c) correspond to near-temporal HJ-1 satellite true-color images acquired on 24 April (a), 15 August (b), and 7 September (c), matching the field SSC data collection times. In figure (d), black “▲” symbols represent artificially generated SSC data locations, with the background image corresponding to a true-color image from SDGSAT-1 on 12 November 2021. The red numbers adjacent to the black “〇” and “▲” symbols indicate the SSC values at those locations, measured in mg/L.
Due to the lack of SSC measured data close to the time of SDGSAT-1 images, this study manually generated a batch of SSC data based on the SSC measured data in 2013, referring to the HJ-1 multispectral images and flow and sediment content data of nearby stations close to its time. The validation of the generated data is elaborated in Section 4.1 of the discussion. In true color images (Figure 2a–c), waters with high SSCs are depicted as yellow, and deeper shades of yellow in the water body indicate higher SSCs; the SSC at the Yellow River estuary significantly exceeds that of the surrounding waters, while the SSC within the river channel remains relatively stable. According to Table 2, the sediment content of waters in the Yellow River estuary is related to flow; the higher the flow is, the higher the sediment content. Therefore, based on the above rules, for the SDGSAT-1 multispectral image on 12 November 2021, a batch of point data for SSC was manually generated (Figure 2d) and applied to the construction of an SSC remote sensing inversion model.

Table 2.
Lijin station flow and sediment concentration.
2.3. Data Preprocessing and Methods
Previous studies have indicated that the utilization of the FLAASH model can yield relatively superior results in reflectance retrieval [22,23]. Compared to the measured spectral reflectance, the inversion model established using the atmosphere-corrected reflectance and the measured suspended sediment concentration (SSC) data is superior [2,22,23]. Therefore, in this study, radiometric calibration was first performed on the images, followed by atmospheric correction using the FLAASH model on the multispectral images. The corrected results and SSC data were then used to construct the inversion models. The theoretical formula of the FLAASH model is shown in Equation (1).
where L represents the total radiance received by the pixel at the sensor, R represents the surface reflectance after atmospheric correction, represents the average surface reflectance around the pixel, S represents the atmospheric spherical albedo, La represents the atmospheric backscatter radiance (atmospheric path radiance), and A and B are two coefficients dependent on atmospheric and geometric conditions. A, B, S, and La are derived using the MODTRAN radiative transfer model.
When constructing the SSC inversion model, we first analyzed the correlation between the reflectance of seven bands of SDGSAT-1 multispectral images and the SSC of waters. Then, referring to the correlation and empirical bands [2,24,25,26], single-band and band-ratio models for SSC inversion were constructed, including R(656) (reflectance at 656 nm), R(776), R(854), R(656)/R(556), R(776)/R(553), R(854)/R(553), R(776)/R(656), and R(854)/R(656).
In the evaluation of the SSC inversion model, the evaluation method used is the mean absolute percentage error (MAPE), which is calculated as shown in Equation (2).
where represents the predicted value, represents the actual value, and n represents the number of samples involved in the error calculation.
In Section 4.2 of the discussion, when analyzing the image differences between anomalous waters (e.g., algal blooms, represented by black waters in Figure 1b) and sediment-laden waters, relative differences are calculated using Equation (3).
where RD(i) represents the relative difference between anomalous waters and sediment-laden waters for model factor i and DNaw(i) and DNsw(i) represent the image values of anomalous waters and sediment-laden waters for model factor i, respectively.
3. Results and Analysis
3.1. Construction and Evaluation of SSC Inversion Models
As shown in Figure 3, the reflectance of bands B1, B2, B3, and B4 of the SDGSAT-1 imagery show weak correlations with SSC, with R2 values below 0.5. In contrast, R(656), R(776), and R(854) demonstrate strong correlations with SSC, with R2 values exceeding 0.7. Specifically, both R(776) and R(854) have R2 values greater than 0.9. This is because the SSC in the Yellow River estuary generally has a good correlation with the reflectance of waters in longer wavelengths such as red and near-infrared [2]. The R2 values between the reflectance of the SDGSAT-1 image bands and SSC gradually increase as the wavelength increases, which is consistent with the findings of Zhou Yuan et al. (2018) [27].
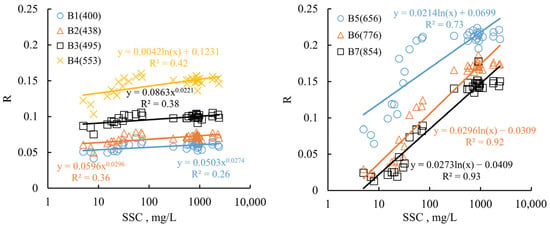
Figure 3.
The correlation between the reflectance of different spectral bands in the SDGSAT-1 multispectral imagery and SSC. The vertical axis (R) represents reflectance.
Figure 4 illustrates the SSC inversion models constructed in this study. The R2 values are at their highest when both the single-band and band-ratio models are formulated as exponential functions. Except for the models R(656) and R(656)/R(553), the R2 values for the other models are all higher than 0.85, and the mean absolute percentage error (MAPE) values are all below 66%. Among them, the single-band model R(854) has the highest R2 value and the lowest MAPE, with an MAPE below 45%. The MAPE values for the single-band models R(776) and R(854) are both lower than those of the band-ratio models. For the band-ratio models, the R(776)/R(553) model has the highest R2 value and the smallest MAPE. When using the same band as the denominator to construct the ratio model, the MAPE of R(776) involved in the model construction is lower than that of R(656) and R(854).
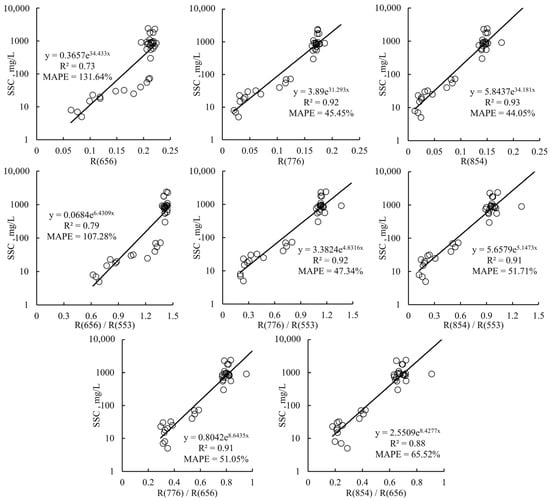
Figure 4.
Models of SSC remote sensing inversion.
3.2. Analysis of Applicability of SSC Inversion Models
The SSC inversion models constructed in this study were applied to the SDGSAT-1 imagery on 12 November 2021, and the results are shown in Figure 5. In the central part of the Bohai Sea, the SSC estimates obtained using the single-band models displayed relatively minimal fluctuations, and subtle changes in SSC were not apparent. In contrast, the SSC estimates based on the band-ratio models showed larger overall variations and were able to capture the fine features of SSC distribution in this area. This is because the band ratio can, to some extent, eliminate the influence of the atmosphere and enhance the contrast of the original weak signals. It is noteworthy that, apart from the models used in Figure 5h,i, the inversion results of the other models indicated high SSC values in nearshore areas, while the SSC values were lower in offshore areas, and the findings are consistent with previous studies [28,29,30,31]. The band-ratio models (Figure 5h,i) appear to overestimate the SSC in offshore regions, possibly due to the presence of anomalous waters in the offshore areas, as indicated by the dark-colored waters of algal blooms in Figure 5a.
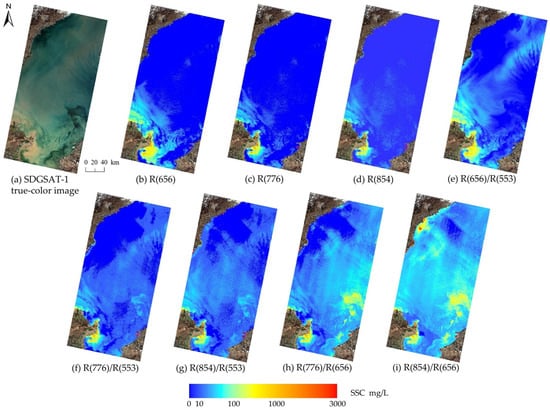
Figure 5.
SSC inversion results are based on different models. (a) SDGSAT-1 true-color image on 12 November 2021. (b–i) present the SSC inversion results using different models. The inversion models include (b) R(656), (c) R(776), (d) R(854), (e) R(656)/R(553), (f) R(776)/R(553), (g) R(854)/R(553), (h) R(776)/R(656), and (i) R(854)/R(656).
To elucidate the overestimation of SSC by the band-ratio models in areas with anomalous waters, some samples of sediment-laden waters, normal waters, and anomalous waters were depicted in the image acquired on 12 November 2021, as shown in Figure 6a. On the same day, the MODIS water color product depicting chlorophyll-a (Chl-a) concentrations is shown in Figure 6b. It can be observed that the anomalous water areas exhibit higher Chl-a concentrations, generally exceeding 7 µg/L; This concentration is notably higher than that in the surrounding normal seawater, likely indicating the presence of algal blooms within the anomalous waters. The reflectance of sediment-laden waters in the visible light spectrum is significantly higher than that of anomalous waters (Figure 6c). The spectral curve of normal waters typically lies between those of sediment-laden and anomalous waters. At longer wavelengths (656 nm, 776 nm, and 854 nm), there is a greater difference in reflectance between sediment-laden waters and anomalous waters. The stronger absorption induced by algal blooms on R(656) may lead to the overestimation of SSC with the band-ratios of R(776)/R(656) and R(854)/R(656).
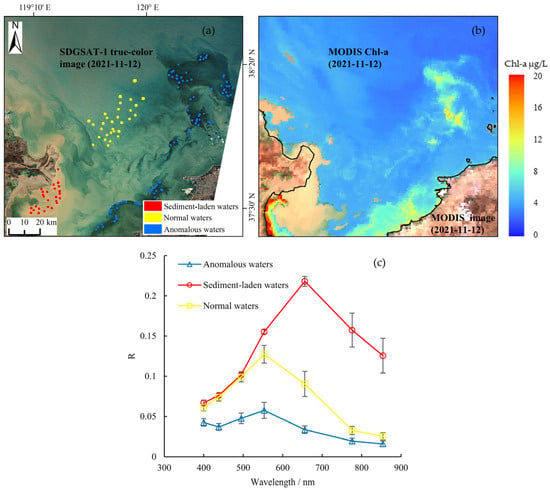
Figure 6.
Distribution and corresponding statistical values of sediment-laden water samples and anomalous water samples. (a) presents the geographical distribution of the samples. (b) presents the distribution of chlorophyll-a concentrations. The terrestrial boundary in (b) is denoted by the black curve. The base images for both (a) and (b) are dated 12 November 2021, with the satellite sensors being SDGSAT-1 MI and MODIS, respectively. (c) presents the spectral curves of the samples.
Zeng et al. (2013) [22] found that the R(Red)/R(Green) model yielded the best inversion results for SSC in the Poyang Lake. Zhang et al. (2018) [32] and Pan et al. (2020) [33] achieved good inversion results for SSC in the Zhoushan coastal waters using a model based on R(Red)/R(Green). Liu et al. (2013) [34] and Shao et al. (2020) [35] found that the R(NIR)/R(Red) model had the smallest mean relative error (MRE) in SSC inversion in the Hangzhou Bay. In the SSC inversions in the Poyang Lake, the Zhoushan coastal waters and the Hangzhou Bay, there were no obvious algal blooms in the study areas, and the ratio models did not overestimate SSC. When algal blooms manifest in the marine environment (as depicted in the black waters in Figure 5a), the suspended particulate matter (SPM) may be dominated by phytoplankton particles rather than suspended sediments (SS), and thus the ratio models for suspended sediment concentration may no longer be applicable. For the Yellow River estuary and its vicinity with complex variation in water constituents, the single-band model based on R(854) is more robust in the SSC inversion.
3.3. Spatiotemporal Characteristics of SSC
Figure 7 shows the SSC in the Yellow River estuary and its vicinity waters for the time span of 2021 to 2022, revealing substantial variations in SSC among different periods. In the SSC inversion results on 6 March 2022, a distinctive strip-like region is observed. This phenomenon can be attributed to the presence of sparse, thin cloud cover in the imagery, influencing the accuracy of the results. Similarly, the SSC inversion results on 25 June 2022 exhibit a similar pattern. The texture features of the thin-cloud area (strip-shaped) in the inversion result differ significantly from those of the high SSC areas (SSC > 70 mg/L, fan-shaped). Therefore, the presence of a small amount of thin clouds does not affect the analysis of the overall spatiotemporal distribution characteristics of SSC in the Yellow River estuary and its vicinity waters.
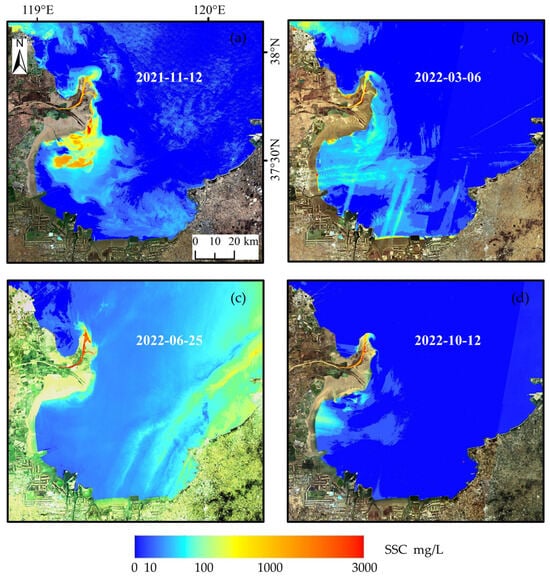
Figure 7.
SSC inversion results at different time periods. The base map image and SSC inversion results shown in (a) are from 12 November 2021. Similarly, the dates for (b–d) are 6 March 2022; 25 June 2022; and 12 October 2022, respectively.
As shown in Figure 7, the SSC in the Yellow River channel on 25 June 2022 is notably higher than those on other dates. This could be attributed to the fact that the Yellow River Basin on 25 June 2022 was in the summer season with increased runoff and suspended sediments. According to the records for the Lijin hydrological station, a high flow of 2460 m3/s was measured on 25 June 2022 (Table 2) and a high SSC was measured in the Yellow River channel. Especially during instances of flood disasters, the SSC within the Yellow River channel could reach even higher levels [36]. Concerning the estuary and coastal waters of Laizhou Bay, the SSC on 12 November 2021 was notably higher than that during the other three observed periods. In certain areas of the northwestern region of Laizhou Bay (highlighted as the red zone in Figure 7a), the SSC even exceeded 2000 mg/L, surpassing the SSC in the river channel. This could be attributed to the fact that the zone in red color shown in Figure 7a is located at the old Yellow River estuary, where a significant amount of historical sediment has accumulated. Additionally, on 12 November 2021 during the image acquisition, Laizhou Bay was undergoing low tide, with a tidal height of approximately 75 cm. The lower tidal level may have caused the exposure of sandy sediments, resulting in the inverted SSC being higher than that of the river channel.
Comparing the two periods with the greatest difference in range (12 October 2022 and 12 November 2021), the tidal level on 12 October 2022 in Laizhou Bay (approximately 140 cm) is noticeably higher than that on 12 November 2021. Furthermore, during the flying-over of the satellite on 12 October 2022, the wind speed in most of Laizhou Bay was less than 5 m/s, while on 12 November 2021, the wind speed was higher than 6 m/s (Figure 8). Previous research findings have consistently demonstrated that the dispersion patterns of suspended sediments are influenced by the dynamics of tidal currents [37,38]. Variations in suspended sediment concentrations are primarily induced by seasonal oscillations in sea surface elevation and wind-induced waves [39], with tidal level fluctuations regarded as short-term variations in sea surface elevation. Similarly, the distribution range of high SSC areas in this study may be related to tidal levels and wind speeds. The broader dispersion of high SSC areas occurs when the tidal level is lower and the wind speed is higher, which may bring stronger at least short-term impacts than the Yellow River discharges.
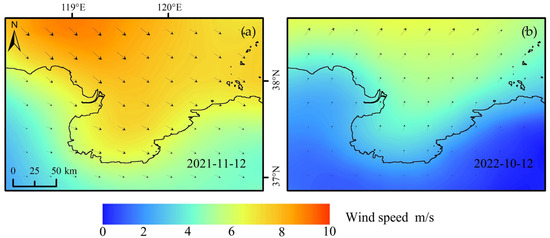
Figure 8.
Surface wind fields during the passage of the SDGSAT-1 satellite. The time difference between satellite passage and wind field data is within 3 min. The wind field data shown in (a,b) correspond to the dates of 12 November 2021 and 12 October 2022, respectively. In the wind field diagram, the arrows indicate the direction of the wind.
4. Discussion
4.1. Cross-Validation on SSC between MODIS and SDGSAT-1
This study employed an indirect approach, relying on SSC inversions using MODIS data, to validate artificially generated SSC point data. An SSC inversion model was established using actual SSC measurements collected in April and September of 2013 within the Yellow River estuary, alongside quasi-synchronous MODIS imagery. The model is defined as log(SSC) = 1.0615 exp(5.7775 × R(858)), with an R2 of 0.85 and an MAPE of 51.82%. This model was applied to MODIS imagery from 12 November 2021 to generate the depicted SSC distribution in Figure 9a. As shown in Figure 9b, the same-day SSC data obtained from SDGSAT-1 imagery were resampled to a resolution of 250 m and co-registered with the MODIS imagery. The spatial distributions of the SSC results derived from SDGSAT-1 imagery and MODIS inversions, as shown in Figure 9a,b, exhibit spatial consistency. Higher SSC values are observed within the Yellow River channel and nearshore areas of the Yellow River estuary, while offshore areas have comparatively lower SSC values. The differences in feather-shaped currents at the Yellow River estuary and fine details of SSC distribution between Figure 9a,b are attributed to the disparity in imaging times between MODIS and SDGSAT-1. The time difference of approximately 3.5 h can lead to distinct tidal current conditions, consequently leading to divergent suspended sediment distributions.
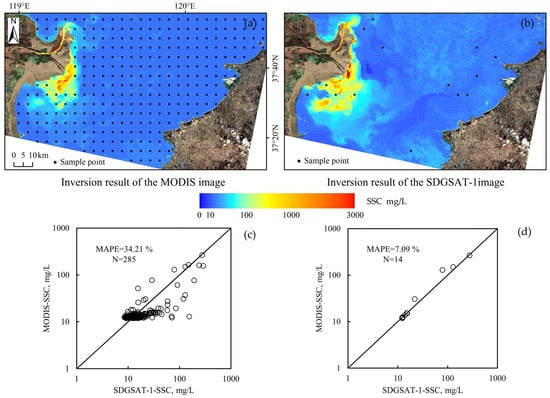
Figure 9.
Verification of artificially generated SSC data. (a) presents the distribution of SSC inverted based on MODIS imagery and sampling points at 5 km intervals. (b) presents the distribution of SSC inverted based on SDGSAT-1 imagery and more closely matched sampling points. The image times for (a,b) are both on 12 November 2021. (c) presents the SSC at the sampling point locations from (a). (d) presents the SSC at the sampling point locations from (b).
The SSC inversions derived from MODIS and SDGSAT-1 imagery at the sampling point locations are presented in Figure 9c, and the SSC values based on SDGSAT-1 data exhibit a consistency with those from MODIS, yielding an R2 of 0.71 and an MAPE of 34.21%. Sampling points with better correspondence based on the true-color imaging and sediment distribution patterns were selected (as shown in Figure 9b), and a higher consistency in the SSC values was observed between MODIS and SDGSAT-1, with an R2 of 0.96 and an MAPE of 7.09%.
4.2. Comparisons in the SSC Inversion Models with Sentinel-2 and Landsat-8
To evaluate the applicability of single-band and band-ratio models for SSC inversion, the inversion models constructed using R(NIR) and R(NIR)/R(Red) model factors were assessed using multispectral images from SDGSAT-1, Sentinel-2, and Landsat-8. The optimal SSC inversion model was constructed using R2 and MAPE as evaluation metrics, as shown in Table 3. For the three types of satellite images, when the functional form is exponential, the optimal SSC inversion model is achieved, with an R2 exceeding 0.85. The MAPE for the single-band model R(NIR) consistently remains below 45% and lower than the MAPE of the band-ratio model R(NIR)/R(Red) for the same satellite.

Table 3.
SSC inversion models for different satellites.
As shown in Figure 10, the ratio model R(NIR)/R(Red) for the SDGSAT-1 multispectral image overestimated the suspended sediment concentration (SSC) in anomalous waters. However, this phenomenon was not evident in the multispectral images of Sentinel-2 and Landsat-8. To investigate this phenomenon, profiles L1 and L2 were plotted, as shown in Figure 11a. Profile L1 is located in the sediment-laden waters, while profile L2 is situated in the anomalous waters, characterized by algal blooms. The spectral curves at these profile positions are depicted in Figure 11b. For all three types of satellite images, profile L1 consistently exhibits higher reflectance in the visible light spectrum than profile L2. For the Sentinel-2 and Landsat-8 images, the relative differences (RD) of profiles L1 and L2 of both the R(NIR) and R(NIR)/R(Red) factors exceed 0.8, as shown in Table 4. For the SDGSAT-1 image, the RD of profiles L1 and L2 of the R(NIR) factor exceeds 0.7, while for the R(NIR)/R(Red) factor, it is below 0.2. The results suggest that for SSC inversion in regions with algal blooms, the single-band model R(NIR) is generally suitable across all three satellite images. However, the ratio model R(NIR)/R(Red) is not applicable for SSC inversion in SDGSAT-1 multispectral images. This finding is intricately linked to the band configurations of the respective satellite images, suggesting that the SSC remote sensing of optically complex water is very sensitive to band settings.
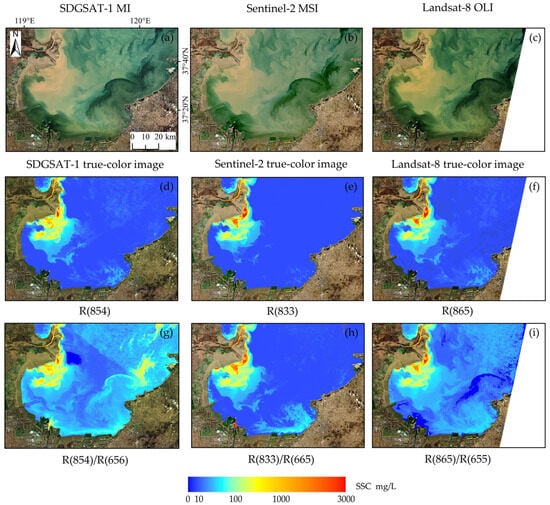
Figure 10.
SSC inversion results are based on different satellites and models. True-color images captured by SDGSAT-1, Sentinel-2, and Landsat-8 are represented by (a–c), respectively, with all images taken on 12 November 2021. (d–i) present the inversion results of SSC. (d,g) present the SSC inversion results based on the SDGSAT-1 multispectral image using the R(854) and R(854)/R(656) models, respectively. (e,h) present the SSC inversion results based on the Sentinel-2 image using the R(833) and R(833)/R(665) models, respectively. (f,i) present the SSC inversion results based on the Landsat-8 image using the R(865) and R(865)/R(655) models, respectively.
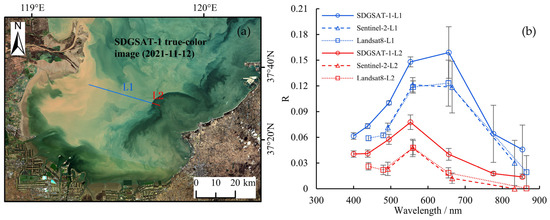
Figure 11.
The profile positions and corresponding spectral curves. (a) presents the geographical positions of the profiles, with the blue line representing profile L1 (sediment-laden waters), the red line representing profile L2 (anomalous waters), and the base map utilizing the SDGSAT-1 image from 12 November 2021. (b) presents the spectral curves at the respective positions of the profiles, with T-shaped error bars indicating standard deviation.

Table 4.
The relative differences in profiles L1 and L2 at the model factors.
5. Conclusions and Prospectives
In this study, we developed SSC inversion models for the waters of the Yellow River estuary and its vicinity waters based on SDGSAT-1 satellite images and analyzed the spatiotemporal variations in SSC. The research results indicate that the reflectance of the red to near-infrared bands in the SDGSAT-1 satellite imagery shows a good correlation with SSC, with an R2 value above 0.7, and the single-band model R(854) has the lowest MAPE among the SSC retrieval models. When estimating the SSC in waters affected by algal blooms, the single-band models developed using SDGSAT-1 imagery demonstrate superior overall stability compared to the band-ratio models. However, the discrepancy in estimating the SSC between the single-band models and band-ratio models of SDGSAT-1 may be further studied and used to discriminate the inorganic particle-dominated suspended sediments and the phytoplankton-dominated suspended particles.
As shown by the results observed by SDGSAT-1, the spatiotemporal distributions of SSC in the Yellow River estuary and its vicinity waters are highly impacted by the river sediment discharge, historic deposition of sediments, tide, currents, winds and human disturbance (e.g., changing the old Yellow River estuary to the current one). To obtain more detailed information on the natural and anthropogenic impacts on the evolutions of the Yellow River Delta and the estuarine waters, the high-resolution thermal infrared imager and the night light imager on SDGSAT-1 satellite together with the multi-spectral imager can be used to map this region more frequently.
Author Contributions
Conceptualization, Q.X.; methodology, Q.X., Y.H., X.Z. and D.S.; software, Y.H.; formal analysis, Y.H. and Q.X.; resources, Q.X. and F.W.; writing—original draft preparation, Y.H. and Q.X.; writing—review and editing, Q.X. and Y.H.; project administration, Q.X.; funding acquisition, Q.X. All authors have read and agreed to the published version of the manuscript.
Funding
This research received financial support from the Seed Project of Yantai Institute of Coastal Zone Research, Chinese Academy of Sciences (YICE351030601), the Instrument Developing Project of the Chinese Academy of Sciences (YJKYYQ20170048), the Strategic Priority Research Program of the Chinese Academy of Sciences (Class A) (XDA19090123, XDA19060501), Key R&D Program of Shandong Province, China (2022CXPT019), and the National Natural Science Foundation of China (42076188).
Data Availability Statement
According to the requirement of the confidentiality agreement, the data used in this paper are not public.
Acknowledgments
The authors are thankful to the anonymous reviewers for their useful suggestions. The SDGSAT-1 data were kindly provided by the International Research Center of Big Data for Sustainable Development Goals (CBAS).
Conflicts of Interest
The authors declare no conflict of interest.
References
- Sun, J.H.; Chai, Y.; Wang, G.L.; Zhang, G.; Li, J. Review on effects of sediment on the water quality of the Yellow River. J. Sediment Res. 2010, 1, 72–80. [Google Scholar] [CrossRef]
- Xing, Q.G.; Lou, M.J.; Tian, L.Q.; Yu, D.F.; Braga, F.; Tosi, L.; Wu, L.L. Quasi-simultaneous measurements of suspended sediments concentration (SSC) of very turbid waters at the Yellow River estuary with the multi-spectral HJ-1 Imageries and in-situ sampling. In Proceedings of the Conference on Ocean Remote Sensing and Monitoring from Space, Beijing, China, 13–16 October 2014. [Google Scholar] [CrossRef]
- Liu, D.Z.; Fu, D.Y.; Shen, C.Y.; Xu, B. Study advances on remote sensing of suspended sediment in estuaries and coastal case II water. Mar. Environ. Sci. 2010, 29, 611–616. [Google Scholar] [CrossRef]
- Cummings, V.J.; Beaumont, J.; Mobilia, V.; Bell, J.J.; Tracey, D.; Clark, M.R.; Barr, N. Responses of a common New Zealand coastal sponge to elevated suspended sediments: Indications of resilience. Mar. Environ. Res. 2020, 155, 104886. [Google Scholar] [CrossRef] [PubMed]
- Chen, X.L.; Yuan, Z.Z.; Li, Y.X.; Wei, Y.K. Spatial and temporal dynamics of suspended sediment concentration in the Pearl River estuary based on remote sensing. Geomat. Inf. Sci. Wuhan Univ. 2005, 8, 677–681. [Google Scholar] [CrossRef]
- Gao, X.L.; Zhou, F.X.; Chen, C.A.; Xing, Q.G. Trace metals in the suspended particulate matter of the Yellow River (Huanghe) estuary: Concentrations, potential mobility, contamination assessment and the fluxes into the Bohai Sea. Cont. Shelf Res. 2015, 104, 25–36. [Google Scholar] [CrossRef]
- Oliveira, M.L.S.; Dotto, G.L.; Pinto, D.; Neckel, A.; Silva, L.F.O. Nanoparticles as vectors of other contaminants in estuarine suspended sediments: Natural and real conditions. Mar. Pollut. Bull. 2021, 168, 112429. [Google Scholar] [CrossRef]
- Xing, Q.G.; Lou, M.J.; Chen, C.Q.; Shi, P. Using in situ and satellite hyperspectral data to estimate the surface suspended sediments concentrations in the Pearl River estuary. IEEE J. Sel. Top. Appl. Earth Obs. Remote Sens. 2013, 6, 731–738. [Google Scholar] [CrossRef]
- Zhang, B.; Li, J.S.; Shen, Q.; Wu, Y.H.; Zhang, F.F.; Wang, S.L.; Yao, Y.; Guo, L.N.; Yin, Z.Y. Recent research progress on long time series and large scale optical remote sensing of inland water. Natl. Remote Sens. Bull. 2021, 25, 37–52. [Google Scholar] [CrossRef]
- Tassan, S.; Sturm, R. An algorithm for the retrieval of sediment content in turbid coastal waters from CZCS data. Int. J. Remote Sens. 1986, 7, 643–655. [Google Scholar] [CrossRef]
- Hu, C.M.; Chen, Z.Q.; Clayton, T.D.; Swarzenski, P.; Brock, J.C.; Muller-Karger, F.E. Assessment of estuarine water-quality indicators using MODIS medium-resolution bands: Initial results from Tampa Bay, FL. Remote Sens. Environ. 2004, 93, 423–441. [Google Scholar] [CrossRef]
- Tang, S.L.; Larouche, P.; Niemi, A.; Michel, C. Regional algorithms for remote-sensing estimates of total suspended matter in the Beaufort Sea. Int. J. Remote Sens. 2013, 34, 6562–6576. [Google Scholar] [CrossRef]
- Liu, X.M.; Qiao, L.L.; Zhong, Y.; Xue, W.J.; Liu, P. Multi-Year winter variations in suspended sediment flux through the Bohai Strait. Remote Sens. 2020, 12, 4066. [Google Scholar] [CrossRef]
- Cai, L.N.; Zhou, M.R.; Liu, J.Q.; Tang, D.L.; Zuo, J.C. HY-1C observations of the impacts of islands on suspended sediment distribution in Zhoushan coastal waters, China. Remote Sens. 2020, 12, 1766. [Google Scholar] [CrossRef]
- Marinho, R.R.; Harmel, T.; Martinez, J.M.; Filizola Junior, N.P. Spatiotemporal dynamics of suspended sediments in the Negro River, Amazon Basin, from in situ and Sentinel-2 remote sensing data. ISPRS Int. J. Geo-Inf. 2021, 10, 86. [Google Scholar] [CrossRef]
- Huang, S.Y.; Liu, J.Q.; Cai, L.N.; Zhou, M.R.; Bu, J.; Xu, J.N. Satellites HY-1C and Landsat 8 combined to observe the influence of bridge on sea surface temperature and suspended sediment concentration in Hangzhou Bay, China. Water 2020, 12, 2595. [Google Scholar] [CrossRef]
- Yao, R.; Cai, L.N.; Liu, J.Q.; Zhou, M.R. GF-1 satellite observations of suspended sediment injection of Yellow River estuary, China. Remote Sens. 2020, 12, 3216. [Google Scholar] [CrossRef]
- Kong, J.L.; Sun, X.M.; Wong, D.W.; Chen, Y.; Yang, J.; Yan, Y.; Wang, L.X. A semi-analytical model for remote sensing retrieval of suspended sediment concentration in the gulf of Bohai, China. Remote Sens. 2015, 7, 5373–5397. [Google Scholar] [CrossRef]
- Han, B.; Loisel, H.; Vantrepotte, V.; Mériaux, X.; Bryère, P.; Ouillon, S.; Dessailly, D.; Xing, Q.G.; Zhu, J.H. Development of a semi-analytical algorithm for the retrieval of suspended particulate matter from remote sensing over clear to very turbid waters. Remote Sens. 2016, 8, 211. [Google Scholar] [CrossRef]
- Jiang, B.; Liu, H.L.; Xing, Q.G.; Cai, J.N.; Zheng, X.Y.; Li, L.; Liu, S.S.; Zheng, Z.M.; Xu, H.Y.; Meng, L. Evaluating traditional empirical models and BPNN models in monitoring the concentrations of Chlorophyll-A and total suspended particulate of eutrophic and turbid waters. Water 2021, 13, 650. [Google Scholar] [CrossRef]
- Cui, Z.Z.; Ma, C.; Zhang, H.; Hu, Y.H.; Yan, L.; Dou, C.Y.; Li, X.-M. Vicarious radiometric calibration of the multispectral imager onboard SDGSAT-1 over the Dunhuang calibration site, China. Remote Sens. 2023, 15, 2578. [Google Scholar] [CrossRef]
- Zeng, Q.; Zhao, Y.; Tian, L.Q.; Chen, X.L. Evaluation on the atmospheric correction methods for water color remote sensing by using HJ-1A/1B CCD image-taking Poyang Lake in China as a case. Spectrosc. Spect. Anal. 2013, 33, 1320–1326. [Google Scholar] [CrossRef]
- Xing, X.D.; Shen, Q.; Li, J.S.; Zhang, F.F.; Pang, Z.G.; Lv, S.Q. Inversion of suspended matter concentration of the river of Manwan Dam regions based on HJ-CCD data. Remote Sens. Technol. Appl. 2016, 31, 682–690. [Google Scholar]
- Zhang, W.; Chen, X.L.; Tian, L.Q.; Chen, L.J. Suspended sediment monitoring in Poyang Lake using HJ-1-A/B CCD imagery. Geomat. Inf. Sci. Wuhan Univ. 2010, 35, 1466–1469+1514. [Google Scholar] [CrossRef]
- Zhang, M.W.; Dong, Q.; Cui, T.W.; Xue, C.J.; Zhang, S.L. Suspended sediment monitoring and assessment for Yellow River estuary from Landsat TM and ETM+ imagery. Remote Sens. Environ. 2014, 146, 136–147. [Google Scholar] [CrossRef]
- Yu, S.Y.; Mantravadi, V.S. Study on distribution characteristics of suspended sediment in Yellow River estuary based on remote sensing. J. Indian Soc. Remote. 2019, 47, 1507–1513. [Google Scholar] [CrossRef]
- Zhou, Y.; Hao, Y.L.; Liu, D.W.; Cui, T.W.; Yu, R.H.; Zhang, Z.L. Estimation of suspended particulate matter concentration based on Landsat8 data in the Yellow River estuary. J. Mar. Sci. 2018, 36, 35–45. [Google Scholar] [CrossRef]
- Liu, Y.X.; Huang, H.J.; Yang, X.Y. The transportation and deposition of suspended sediment and its dynamic mechanism analysis based on Landsat images in the Laizhou Bay. Haiyang Xuebao 2013, 35, 43–53. [Google Scholar] [CrossRef]
- Mu, B.; Cui, T.W.; Qin, P.; Gong, J.L.; Xiao, Y.F.; Zheng, R.E. Remote sensing retrieval and temporal-spatial distribution characteristics of particulate organic carbon concentration in seawater near Yellow River estuary. Acta Opt. Sin. 2017, 37, 33–43. [Google Scholar] [CrossRef]
- Jiang, L.J.; Wang, Q.; Xu, Y.; Zhan, C.; Wang, H.Y.; Liu, Y.L.; Jiang, L.L. Multi-temporalanalysis of water color variation in Laizhou Bay based on remote sensing images. Oceanol. Limnol. Sin. 2018, 49, 551–559. [Google Scholar]
- Chu, Y.H.; Wu, W.J.; Li, P.; Cheng, S.W. Temporal and spatial dynamics of suspended sediment and its driving mechanism in the Yellow River estuary. Haiyang Xuebao 2022, 44, 150–163. [Google Scholar]
- Zhang, M.C.; Guo, B.Y. Retrieval of suspended sediment concentration in Zhoushan coastal area satellite based on GF-1. Ocean Dev. Manag. 2018, 35, 126–131. [Google Scholar]
- Pan, L.J.; Guo, B.Y. Remote sensing research of suspended sediment concentration in Zhoushan archipelago sea area based on Landsat8 data. Ocean Dev. Manag. 2020, 37, 82–90. [Google Scholar]
- Liu, W.B.; Yu, Z.F.; Zhou, B.; Jiang, J.G.; Pan, Y.L.; Ling, Z.Y. Assessment of suspended sediment concentration at the Hangzhou Bay using HJ CCD imagery. Natl. Remote Sens. Bull. 2013, 17, 905–918. [Google Scholar] [CrossRef]
- Shao, Y.J.; Hu, Y.K.; Zhou, B.; Chen, F.; He, X.Q.; Wang, G.J.; Yuan, X.H.; Zhou, Y.L.; Yu, Z.F. Remote sensing monitoring of suspended sediment concentration based on GF-4 satellite in the Hangzhou Bay. Haiyang Xuebao 2020, 42, 134–142. [Google Scholar] [CrossRef]
- Shen, G.Q.; Zhang, Y.F.; Zhang, M. Characteristics on floods and sediment transport in the Lower Yellow River since the Xiaolangdi Reservoir impoundment. J. Sediment. Res. 2020, 45, 59–66. [Google Scholar] [CrossRef]
- Bi, N.; Yang, Z.S.; Wang, H.J.; Fan, D.J.; Sun, X.X.; Lei, K. Seasonal variation of suspended-sediment transport through the southern Bohai Strait. Estuar. Coast. Shelf S. 2011, 93, 239–247. [Google Scholar] [CrossRef]
- Xie, B.; Bao, R.; Yin, D.X.; Zhu, L.H.; Hu, R.J.; Cai, W.W.; Liu, T.; Lin, C.R.; Lu, P.F. The spatio-temporal distribution and transport of suspended sediment in Laizhou Bay: Insights from hydrological and sedimentological investigations. Front. Earth Sci. 2022, 10, 994258. [Google Scholar] [CrossRef]
- Jin, S.; Fagherazzi, S.; Fichot, C.G.; Wu, X.; Liu, Y.X.; Zheng, X.Y.; Zou, T.; Xing, Q.G. Drivers of suspended sediment dynamics along the shorelines of the Yellow River Delta detected from satellite data. Earth Surf. Proc. Land. 2023. Early View. [Google Scholar] [CrossRef]
Disclaimer/Publisher’s Note: The statements, opinions and data contained in all publications are solely those of the individual author(s) and contributor(s) and not of MDPI and/or the editor(s). MDPI and/or the editor(s) disclaim responsibility for any injury to people or property resulting from any ideas, methods, instructions or products referred to in the content. |
© 2023 by the authors. Licensee MDPI, Basel, Switzerland. This article is an open access article distributed under the terms and conditions of the Creative Commons Attribution (CC BY) license (https://creativecommons.org/licenses/by/4.0/).