

Divergent Geochemical Pathways of Carbonate Aquifer Evolution in a Classic Karst Terrain: (2) Groundwater Source Delineation Using Regional Water Chemistry Data


Abstract
1. Introduction
2. Prior Work
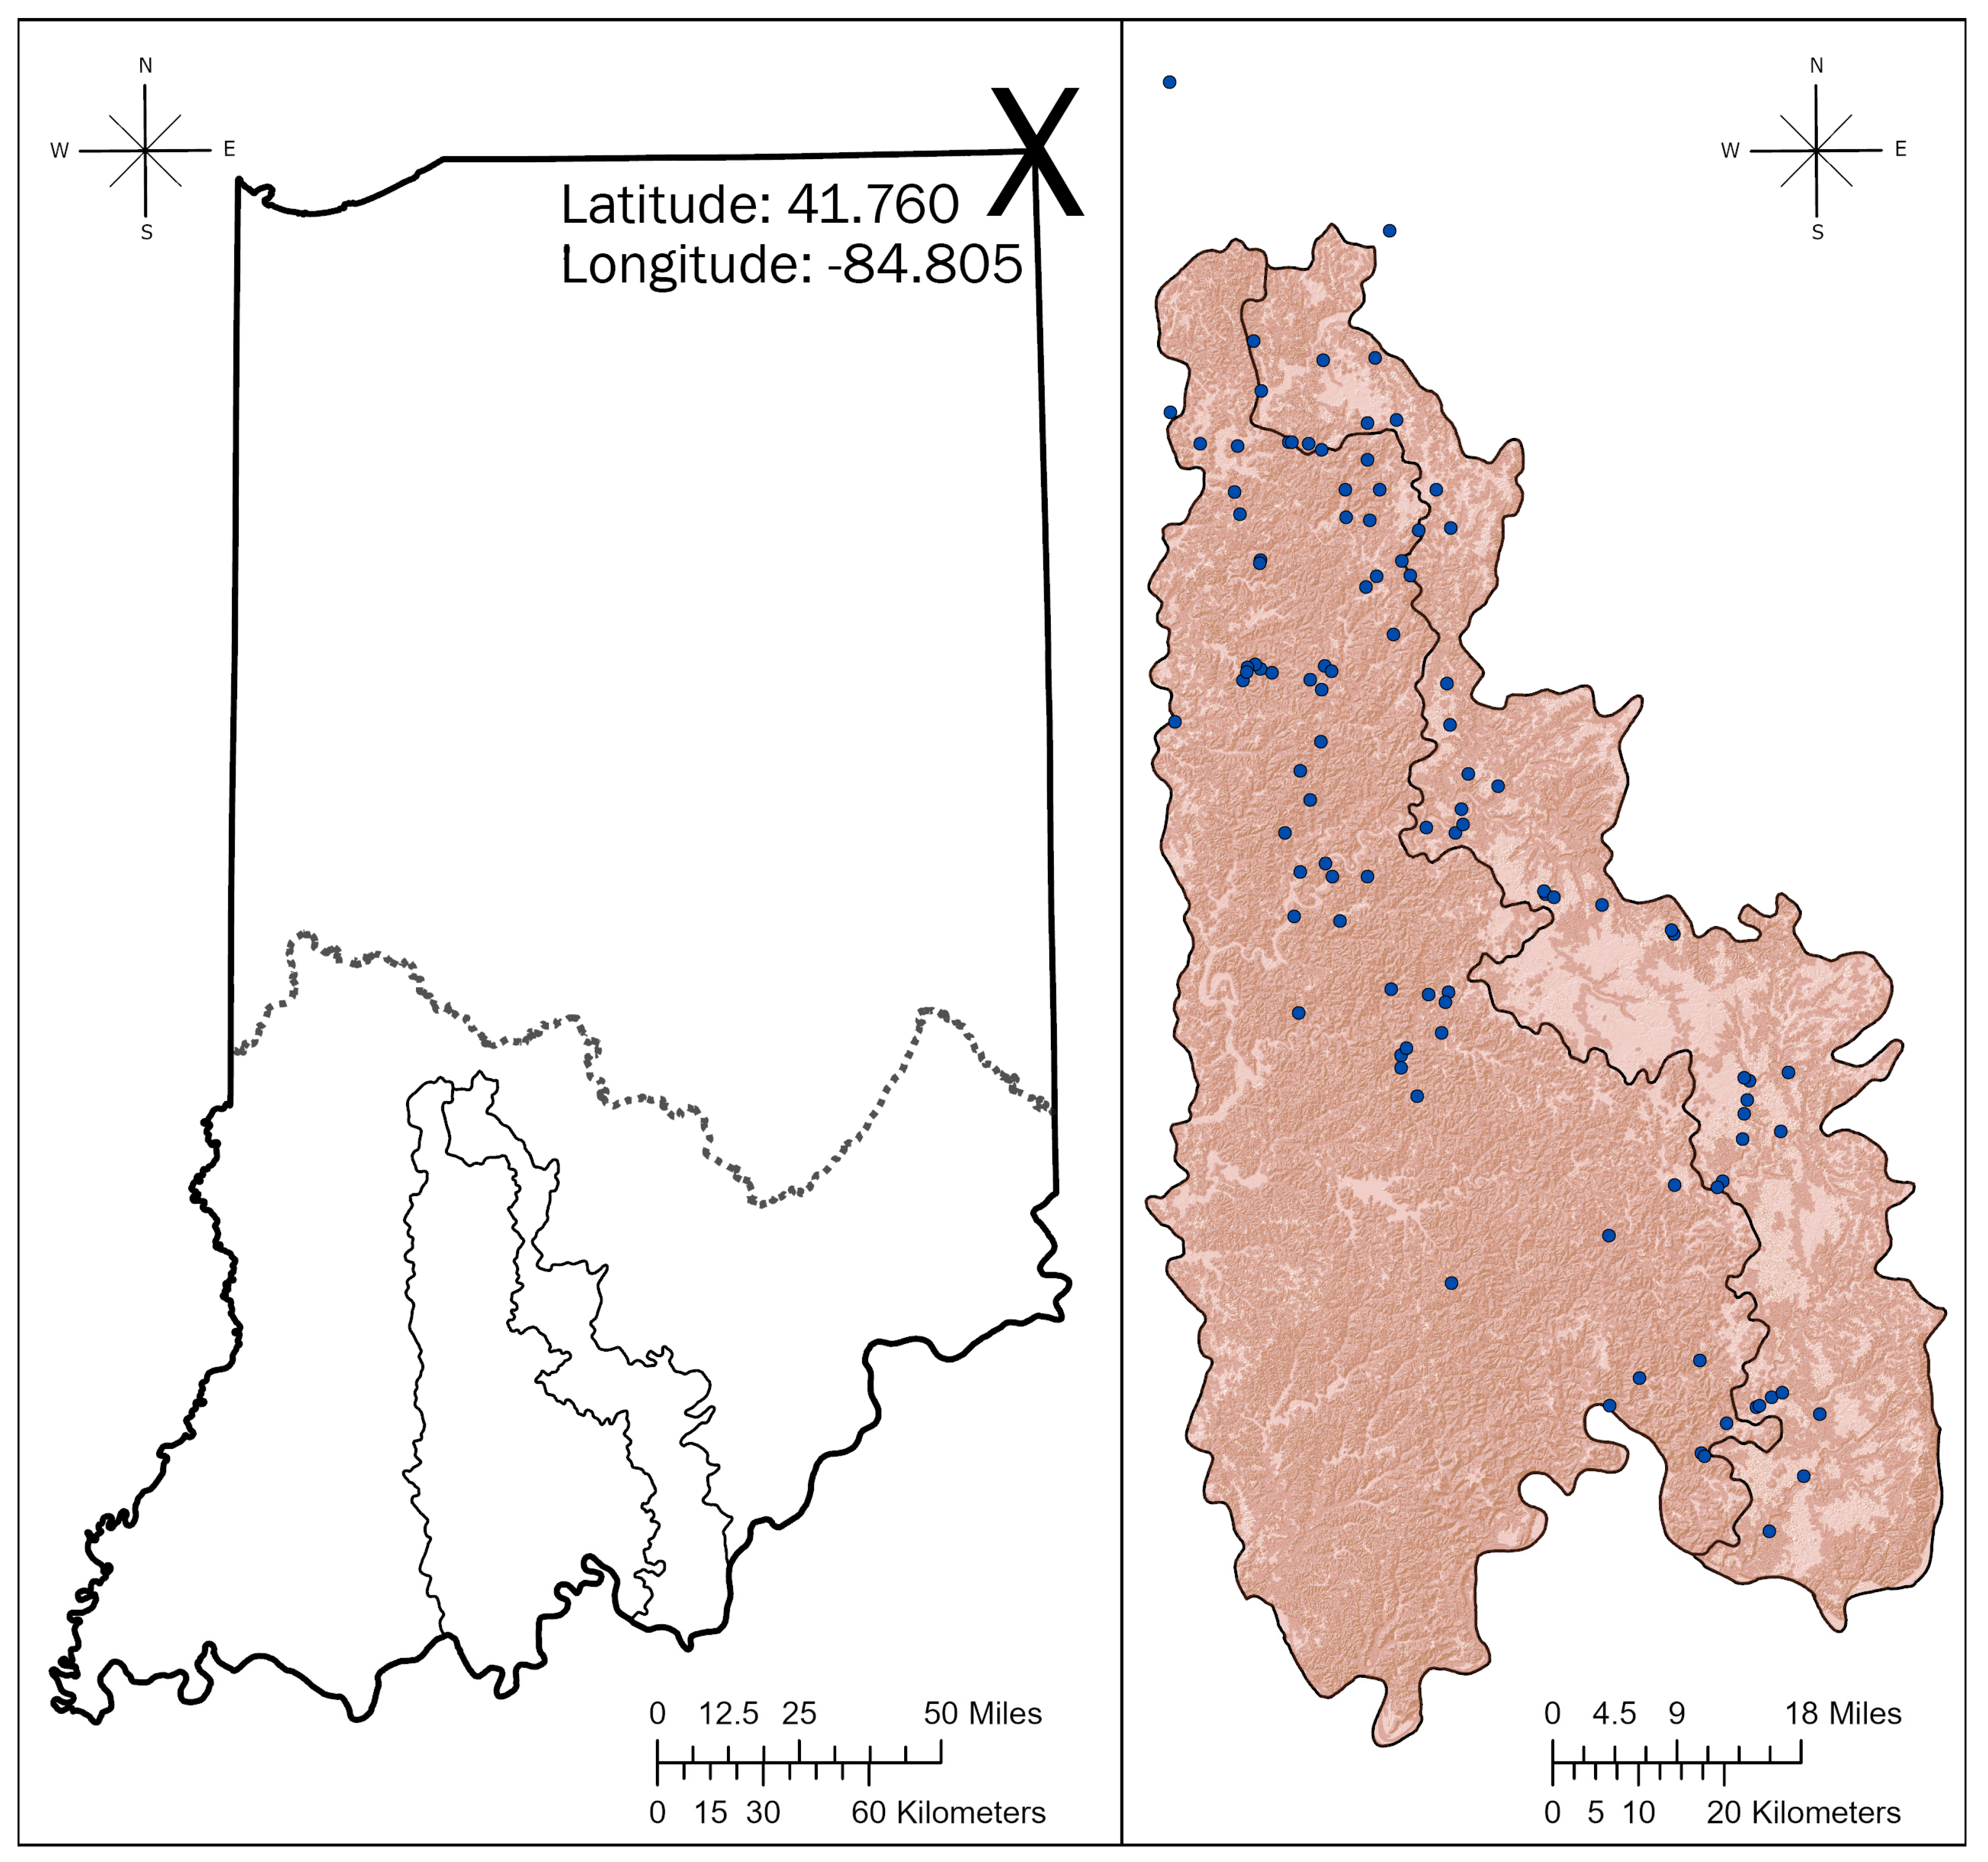
3. Regional Groundwater Aquifers
The Mitchell Aquifer
4. Methods
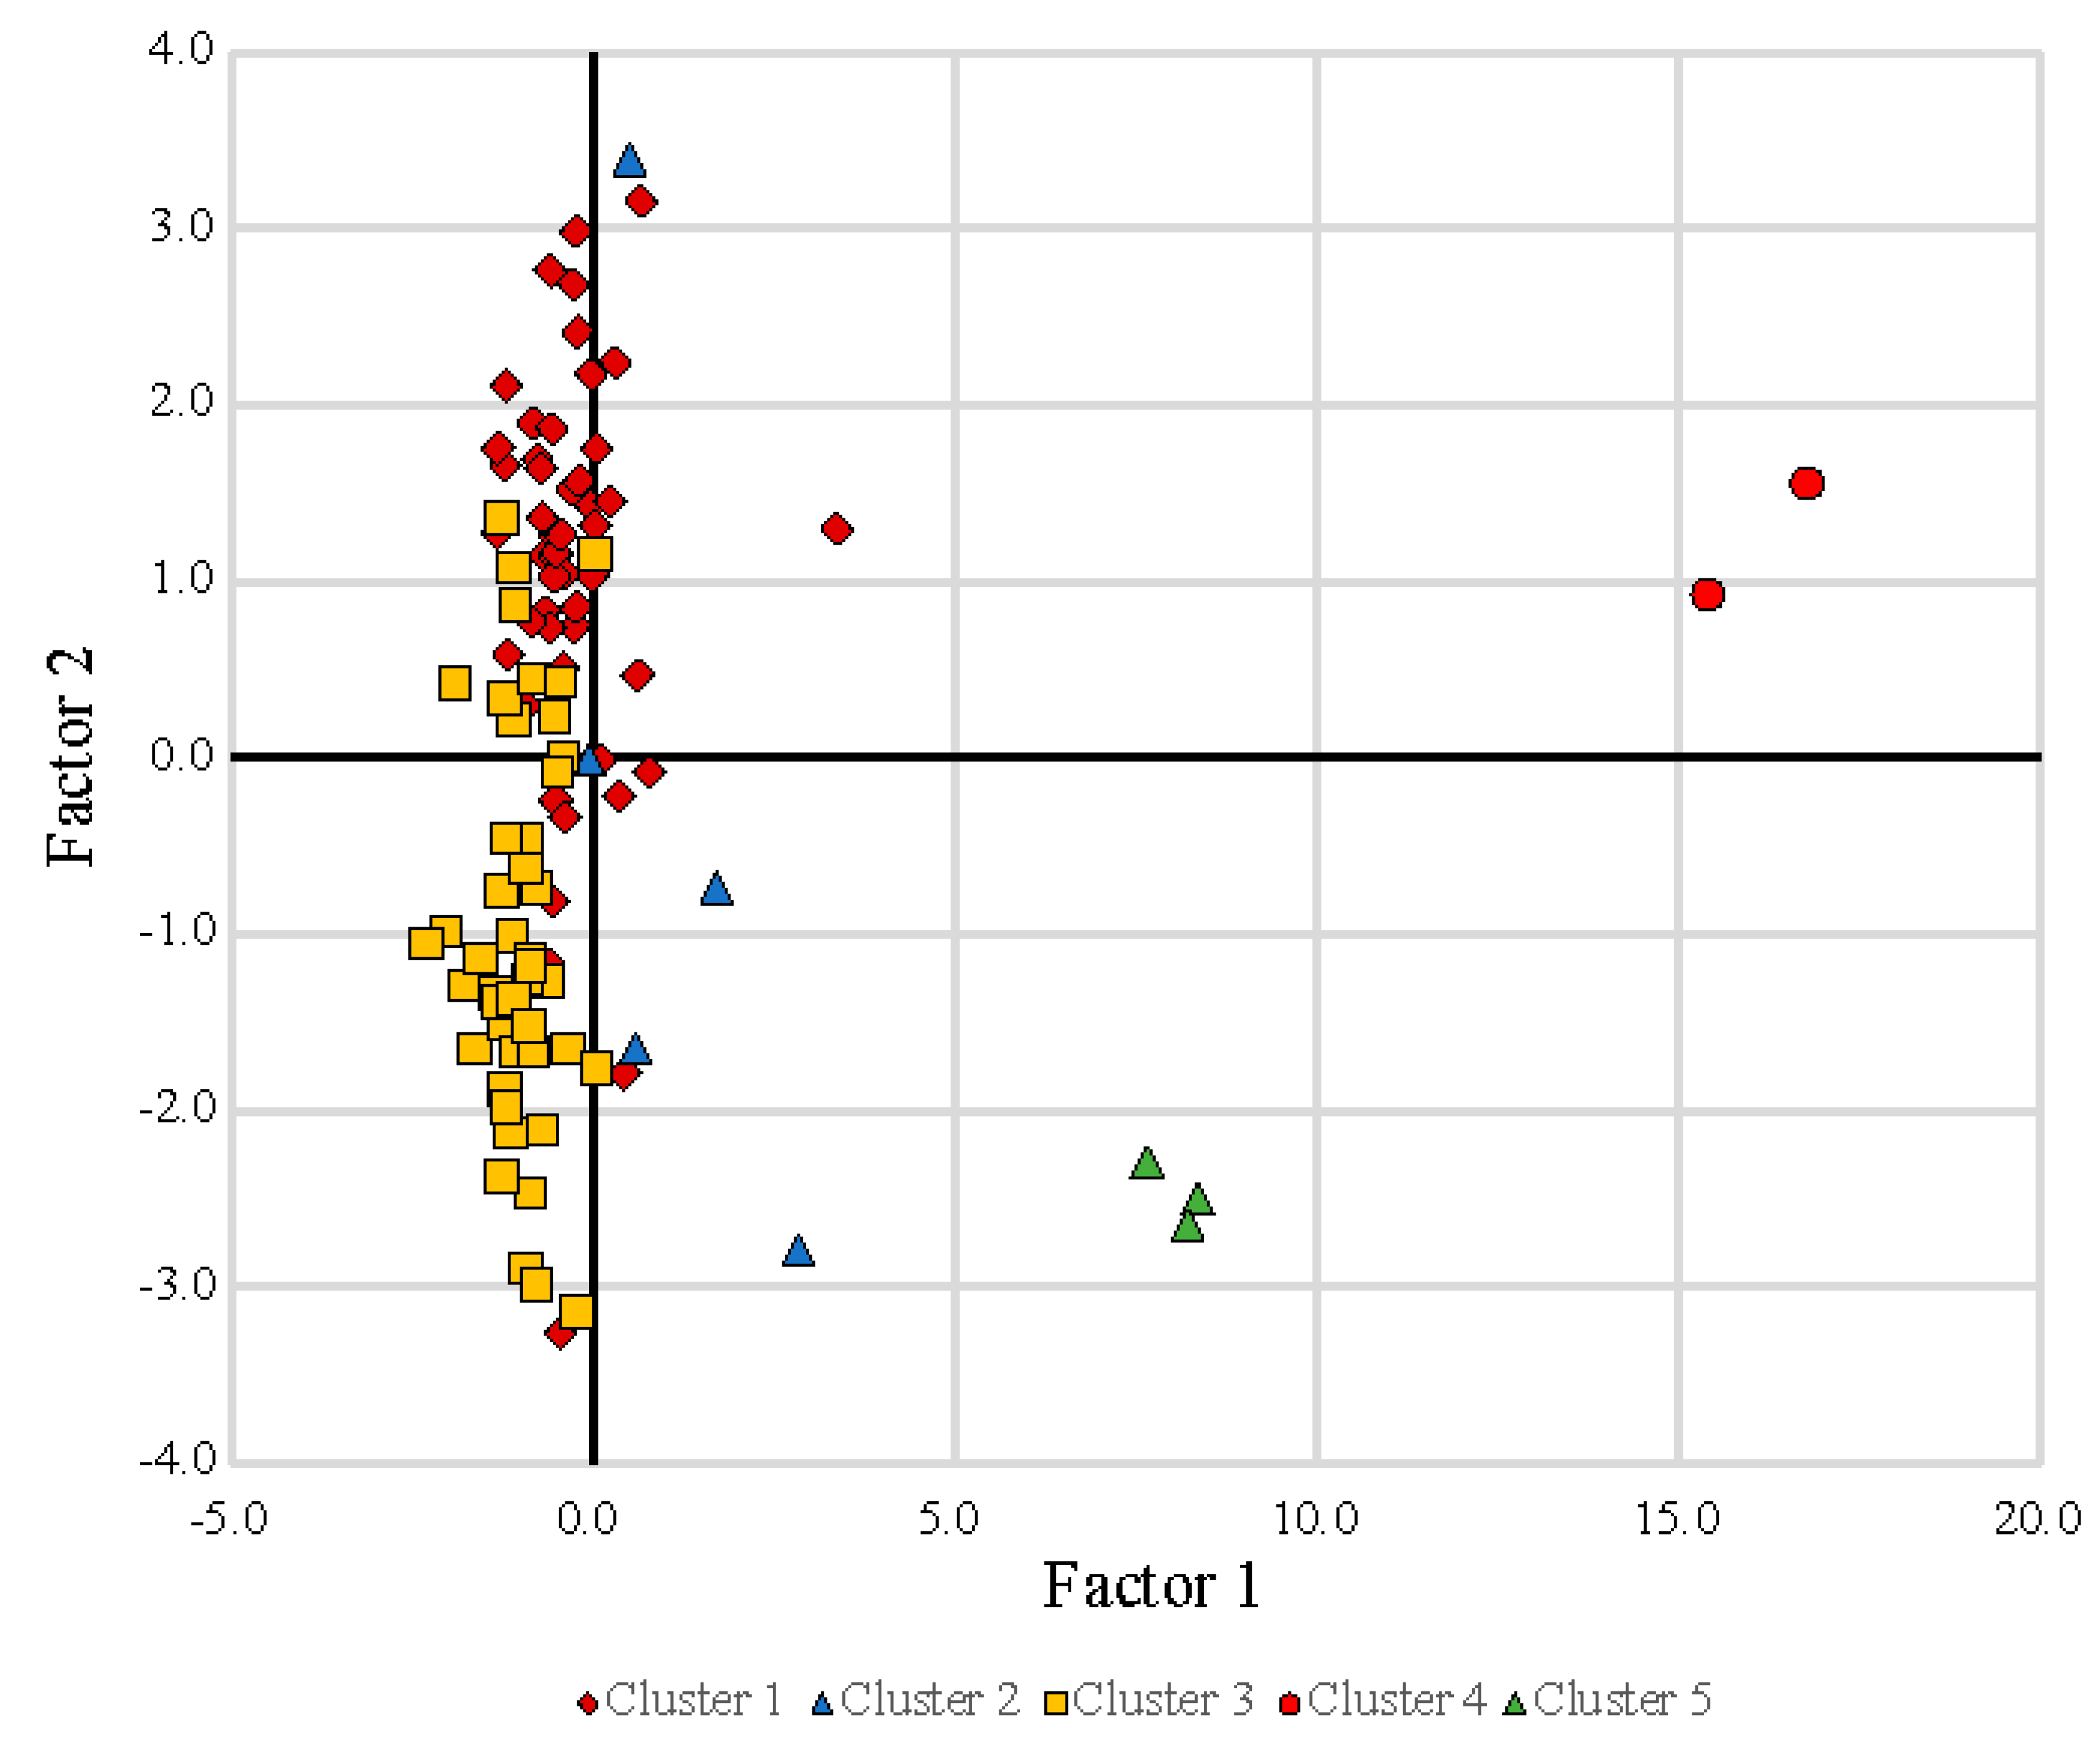
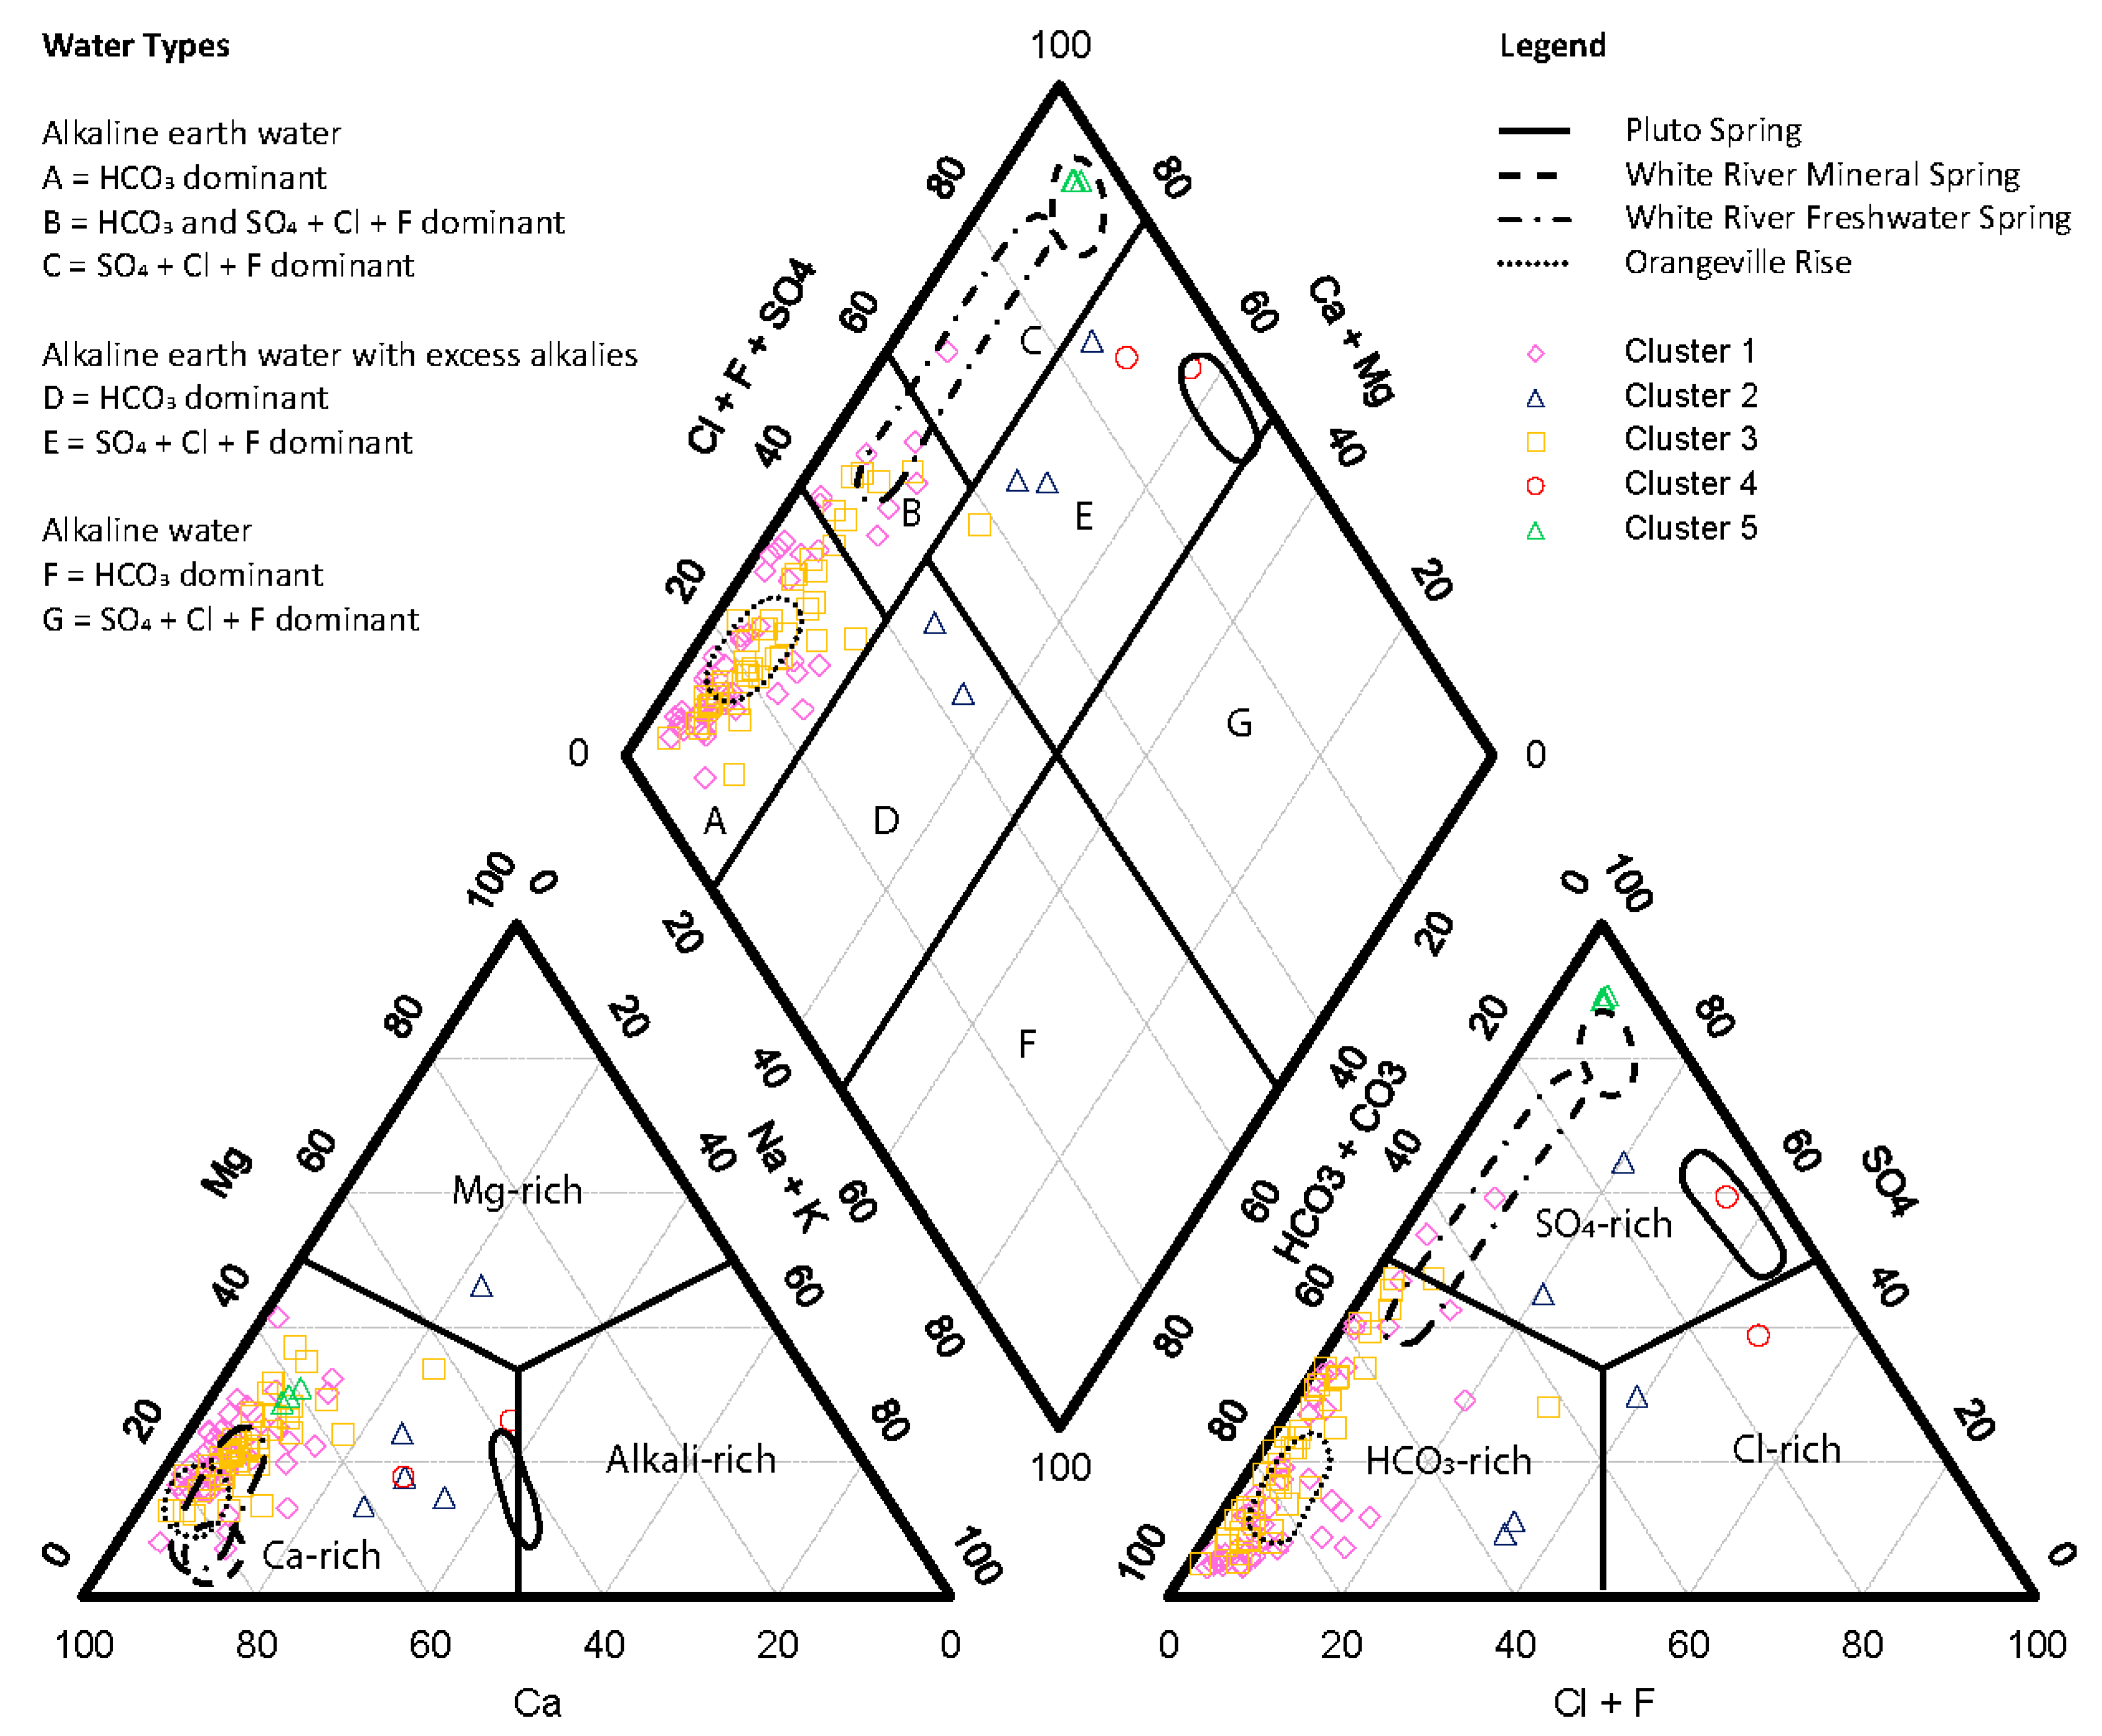
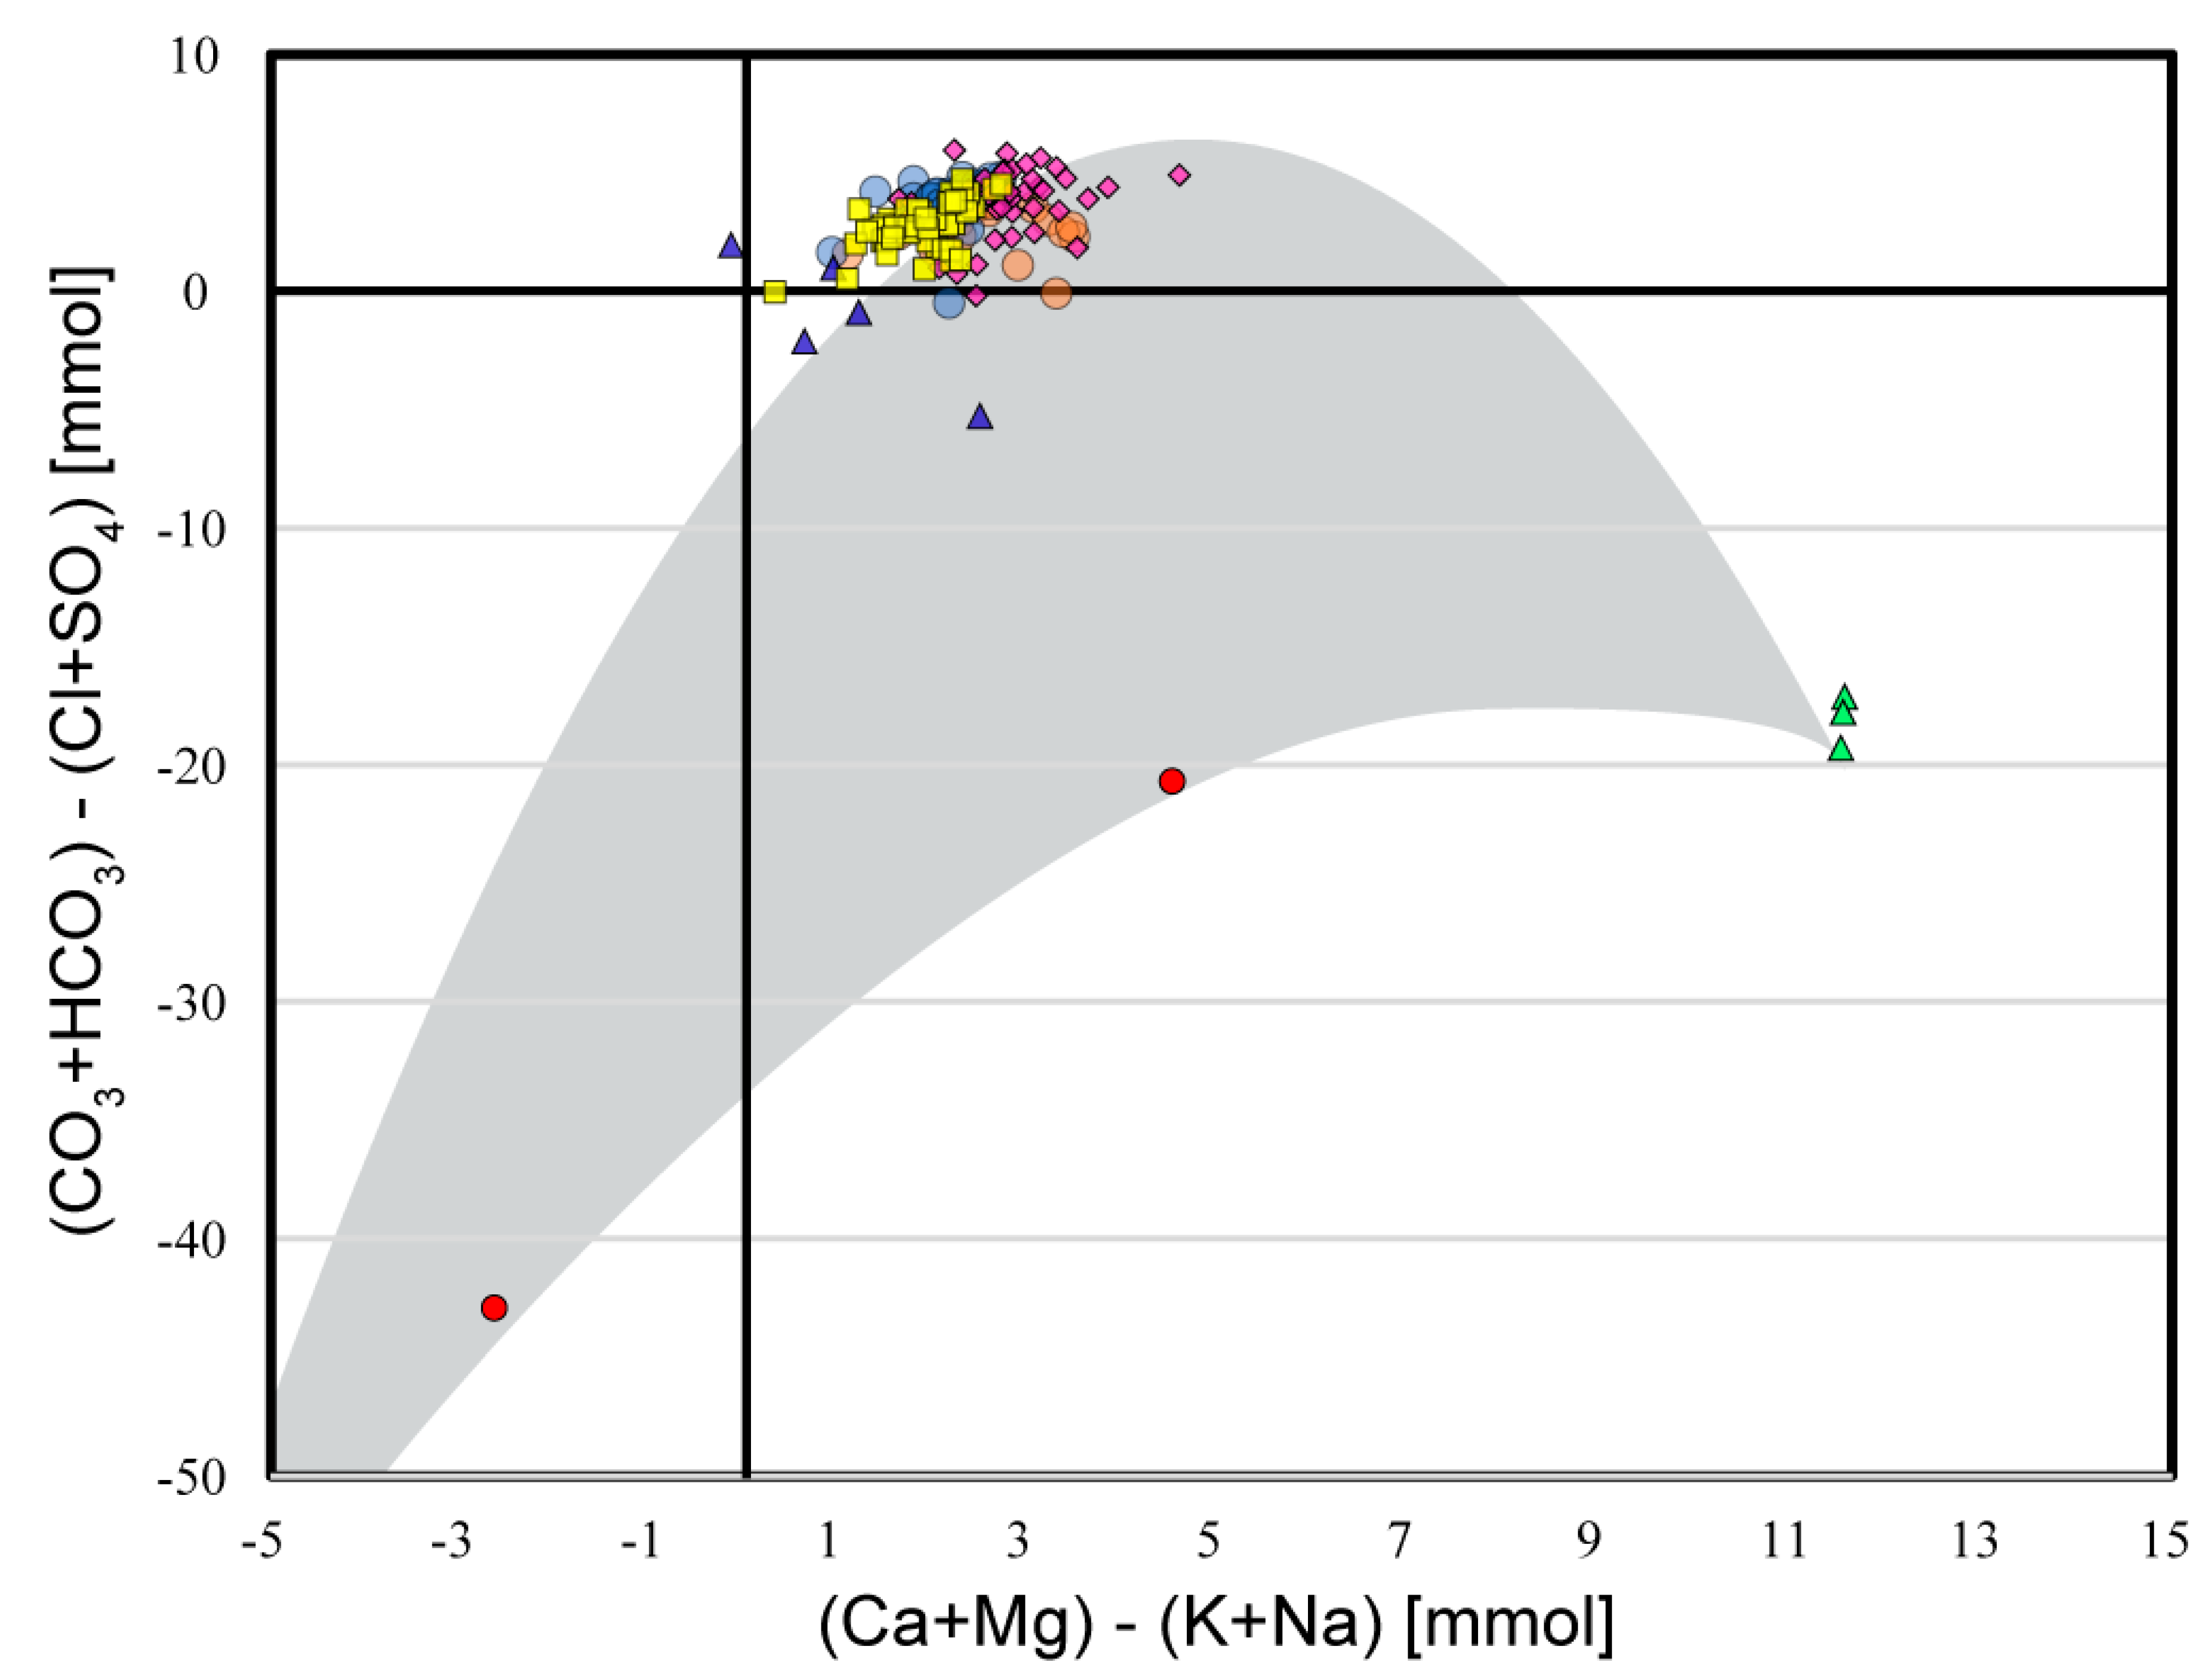
5. Results
6. Discussion
6.1. Observed Geochemical Processes
6.2. Contributing End Members
- Larger springsheds in the Mitchell Plateau where Middle-Mississippian carbonates are at the surface on a mature karst landscape of autogenic recharge with a well-developed epikarst, and where long-term meteoric flushing has removed most of the evaporites and basin brine;
- Smaller springsheds in the Mitchell Plateau and Crawford Uplands in a less mature karst landscape that lack a well-developed epikarst and include significant autogenic recharge;
- Springs in the Crawford Uplands of rising hypogenic waters where the carbonates are at or below grade and covered by noncarbonate caprock, and where meteoric flushing of evaporites and basin brines is incomplete.
6.3. Groundwater Chemistry in the Mitchell Aquifer System
6.4. Implications for Speleogenesis and Carbon Flux
7. Conclusions
Author Contributions
Funding
Data Availability Statement
Acknowledgments
Conflicts of Interest
References
- Parise, M.; Sammarco, M. The historical use of water resources in karst. Environ. Earth Sci. 2015, 74, 143–152. [Google Scholar] [CrossRef]
- Darcy, H. Les Fontaines Publiques de la Ville de Dijon: Exposition et Application des Principes à Suivre et des Formules à Employer dans les Questions de Distribution d’eau; Victor Dalmont: Nantes, France, 1856; Volume 1. [Google Scholar]
- White, W.B. Springwater geochemistry. In Groundwater Hydrology of Springs; Kresic, N., Stevanovic, Z., Eds.; Butterworth-Heinemann: Oxford, UK, 2010; pp. 231–268. [Google Scholar]
- Halihan, T.; Wicks, C.M.; Engeln, J.F. Physical response of a karst drainage basin to flood pulses: Example of the Devil’s Icebox cave system (Missouri, USA). J. Hydrol. 1998, 204, 24–36. [Google Scholar] [CrossRef]
- Eisenlohr, L.; Kiraly, L.; Bouzelboudjen, M.; Rossier, Y. Numerical simulation as a tool for checking the interpretation of karst spring hydrographs. J. Hydrol. 1997, 193, 306–315. [Google Scholar] [CrossRef]
- Labat, D.; Ababou, R.; Mangin, A. Rainfall–runoff relations for karstic springs. Part I: Convolution and spectral analyses. J. Hydrol. 2000, 38, 123–148. [Google Scholar] [CrossRef]
- Dreiss, S.J. Regional scale transport in a karst aquifer: 1. Component separation of spring flow hydrographs. Water Resour. Res. 1989, 25, 117–125. [Google Scholar] [CrossRef]
- Groves, C.G.; Howard, A.D. Early development of karst systems: 1. Preferential flow path enlargement under laminar flow. Water Resour. Res. 1994, 30, 2837–2846. [Google Scholar] [CrossRef]
- Ford, D.; Williams, P.D. Karst Hydrogeology and Geomorphology; John Wiley & Sons: Hoboken, NJ, USA, 2007. [Google Scholar]
- Burgess, S.A.; Florea, L.F.; Branam, T. Divergent geochemical pathways of carbonate aquifer evolution in a classic karst terrain: (1) polygenetic cave development identified using longitudinal groundwater geochemistry. Water 2023, in press. [Google Scholar]
- Peale, A.C. Lists and Analyses of the Mineral Springs of the United States (a Preliminary Study); U.S. Geological Survey Report 32; Government Printing Office: Washington, DC, USA, 1886; p. 235. [Google Scholar]
- Meinzer, O.E. Large Springs in the United States; Water Supply Paper 557; U.S. Geological Survey: Reston, VA, USA; Government Printing Office: Washington, DC, USA, 1927; p. 94. [Google Scholar]
- Blatchley, W.S. The Mineral Waters of Indiana: Their Location, Origin and Character; W.B. Burford, Contractor for State Printing and Binding: Indianapolis, IN, USA, 1903. [Google Scholar]
- Gray, H.H. Physiographic Divisions of Indiana; Indiana Geological and Water Survey, Special Report 61; Indiana Geological Survey: Bloomington, IN, USA, 2000; p. 15. [Google Scholar]
- Owen, D.D. Report of a Geological Reconnaissance and Survey of the State of Indiana, Made in the Years 1837 and 1838; Osborn & Willets, Printers to the State: Indianapolis, IN, USA, 1859. [Google Scholar]
- Malott, C.A. The swallow-holes of Lost River, Orange County, Indiana. Proc. Natl. Acad. Sci. USA 1952, 61, 187–231. [Google Scholar]
- Powell, R. Caves of Indiana; Indiana Geological Survey Circular 8; Indiana Geological Survey: Bloomington, IN, USA, 1961; p. 127. [Google Scholar]
- Palmer, A.N. A Hydrologic Study of the Indiana Karst: An Evaluation of the Effects of Geologic Setting upon Ground-Water Flow and Water Supply in a Karst Region, with Special Reference to Northwestern Lawrence County, Indiana. Doctoral Dissertation, Indiana University, Bloomington, IN, USA, 1969. [Google Scholar]
- Bassett, J.L. Hydrology and Geochemistry of Karst Terrain, Upper Lost River Drainage Basin, Indiana: Bloomington. Master’s Thesis, Indiana University, Bloomington, IN, USA, 1974; p. 102. [Google Scholar]
- Bassett, J.L. Hydrology and geochemistry of the upper Lost River drainage basin, Indiana. Bull. Natl. Speleol. Soc. 1976, 38, 80–87. [Google Scholar]
- Krothe, N.C.; Libra, R.D. Sulphur isotopes and hydrochemical variations in spring waters of southern Indiana, U.S.A. J. Hydrol. 1983, 61, 267–283. [Google Scholar] [CrossRef]
- Lee, E.S.; Krothe, N.C. Delineating the karstic flow system in the upper Lost River drainage basin, south central Indiana: Using sulphate and δ34SSO4 as tracers. Appl. Geochem. 2003, 18, 145–153. [Google Scholar] [CrossRef]
- Hasenmueller, N.R.; Buehler, M.A.; Krothe, N.C.; Comer, J.B.; Branam, T.D.; Ennis, M.V.; Smith, R.T.; Zamani, D.D.; Hahn, L.; Rybarczyk, J.P. Water-quality characteristics and contaminants in the rural karst-dominated Spring Mill Lake watershed, southern Indiana. In Perspectives on Karst Geomorphology, Hydrology, and Geochemistry—A Tribute Volume to Derek C. Ford and William B. White; Harmon, R.S., Wicks, C., Eds.; GSA Special Paper 404; Geological Society of America: Boulder, CO, USA, 2016. [Google Scholar]
- Beck, B.; Pearson, F.M. Application of fluorescent dye tracing techniques for delineating sinkhole drainage routes, Highway 37 improvement project Lawrence County, Indiana. In Karst Geohazards Engineering and Environmental Problems in Karst Terrane; Beck, B.F., Ed.; Routledge: London, UK, 1995. [Google Scholar]
- Bayless, E.R.; Cinotto, P.J.; Ulery, R.L.; Taylor, C.J.; McCombs, G.K.; Kim, M.H.; Nelson, H.L. Surface-Water and Karst Groundwater Interactions and Streamflow-Response Simulations of the Karst-Influenced Upper Lost River Watershed, Orange County, Indiana; Scientific Investigations Report 2014-5028; U.S. Geological Survey: Washington, DC, USA, 2014; p. 39. [Google Scholar]
- Burgess, S.A.; Florea, L.J. Economic Exclusion and Forgotten Floodplains on Karst Terrain. Environ. Eng. Geosci. 2023, in press. [Google Scholar]
- Florea, L.J.; Hasenmueller, N.R.; Branam, T.D.; Frushour, S.S.; Powell, R.L. Karst geology and hydrogeology of the Mitchell Plateau of south-central Indiana. In Ancient Oceans, Orogenic Uplifts, and Glacial Ice: Geologic Crossroads in America’s Heartland; Florea, L., Ed.; Geological Society of America Special Paper 51; Geolgical Society of America: Boulder, CO, USA, 2018; p. 95. [Google Scholar]
- Burgess, S.A. Sulfur Systematics and Carbonate Diagenesis in the Mitchell Plateau, Indiana. Master’s Thesis, Indiana University, Bloomington, IN, USA, 2021; p. 164. [Google Scholar]
- Thompson, T.A.; Sowder, K.; Johnson, M.R. Generalized Stratigraphic Column of Indiana Bedrock (Poster). Available online: https://igws.indiana.edu/ignis/GeneralizedStratigraphicColumn.pdf (accessed on 31 July 2023).
- Sun, R.J.; Johnston, R.H. Regional Aquifer-System Analysis Program of the US Geological Survey, 1978–1992; Circular 1099; U.S. Geological Survey: Washington, DC, USA, 1994. [Google Scholar]
- Conner, G.A. Karst Spring Cutoffs, Cave Tiers, and Sinking Stream Basins Correlated to Fluvial Base Level Decline in South-Central Indiana. In 14th Sinkhole Conference; NCKRI Symposium 5; National Cave and Karst Research Institute: Carlsbad, CA, USA, 2015; pp. 53–61. [Google Scholar]
- Widhalm, M.; Hamlet, A.; Byun, K.; Robeson, S.; Baldwin, M.; Staten, P.; Chiu, C.; Coleman, J.; Hall, E.; Hoogewind, K.; et al. Indiana’s Past & Future Climate: A Report from the Indiana Climate Change Impacts Assessment; Purdue Climate Change Research Center, Purdue University: West Lafayette, IN, USA, 2018. [Google Scholar] [CrossRef]
- First Street Foundation. The First National Flood Risk Assessment: Defining America’s Growing Risk. Available online: https://assets.firststreet.org/uploads/2020/06/first_street_foundation__first_national_flood_risk_assessment.pdf (accessed on 24 July 2023).
- Wagner, L.E. The Impact of Storm Characteristics and Land Use on Nutrient Export in Two Glaciated Watersheds in Central Indiana, USA. Doctoral Dissertation, Indiana University, Bloomington, IN, USA, 2007. [Google Scholar]
- Arihood, L.D.; Basch, M.E. Geohydrology and Simulated Ground-Water Flow in an Irrigated Area of Northwestern Indiana; Water-Resources Investigations Report 92-4046; U.S. Geological Survey: Washington, DC, USA, 1994. [Google Scholar] [CrossRef]
- Kumar, P.; Le, P.V.; Papanicolaou, A.T.; Rhoads, B.L.; Anders, A.M.; Stumpf, A.; Belmont, P. Critical transition in critical zone of intensively managed landscapes. Anthropocene 2018, 22, 10–19. [Google Scholar] [CrossRef]
- Wittman, J. Water and Economic Development in Indiana–Modernizing the State’s Approach to a Critical Resource; Interra Geoscience and Engineering Solutions for the Indiana Chamber of Commerce: Indianapolis, IN, USA, 2014; p. 81. Available online: http://share.indianachamber.com/media/WaterStudyReport2014LoRes.pdf (accessed on 13 November 2017).
- Earth Tech. Delineation of Sinkhole Drainage Routes Utilizing Fuorescent Dye Tracing Techniques along State Route 60 between Mitchell and U.S. Highway 50, Lawrence County, Indiana; Report to the Indiana Department of Transportation, Environmental Assessment Section; Indiana Department of Transportation: Indianapolis, IN, USA, 1995; p. 16. [Google Scholar]
- Hopkins, H.T. Fresh-Saline Water Interface Map of Kentucky; Kentucky Geological Survey. Series X, 1(500,000); Kentucky Geological Survey: Lexington, MA, USA, 1966. [Google Scholar]
- Mitchell, W.M. Assessment of the 3,000 ppm and 10,000 ppm Total Dissolved Solids Boundaries in the Mississippian and Pennsylvanian Aquifers of Southwestern Indiana. Indiana Geological and Water Survey, Open File Study 94-02; Indiana Geological Survey: Bloomington, IN, USA, 1993. [Google Scholar]
- Panno, S.V.; Askari, Z.; Kelly, W.R.; Parris, T.M.; Hackley, K.C. Recharge and groundwater flow within an Intracratonic basin, Midwestern United States. Groundwater 2018, 56, 32–45. [Google Scholar] [CrossRef]
- Indiana Geological and Water Survey (IGWS). Springs. 2023. Available online: https://igws.indiana.edu/springs (accessed on 19 July 2023).
- Furtak, H.; Langguth, H.R. Zur hydrochemischen Kennzeichnung von Grundwässern und Grund-wassertypen mittels Kennzahlen. In Memoires IAH-Congress; IAH-Congress: Hannover, Germany, 1967; pp. 86–96. [Google Scholar]
- Winston, R.B. GW_Chart version 1.30: U.S. Geological Survey Software Release, 26 June 2020. USGS Digit. Object Identifier Cat. 2020. [Google Scholar] [CrossRef]
- Plummer, L.N.; Busby, J.F.; Lee, R.W.; Hanshaw, B.B. Geochemical modeling of the Madison aquifer in parts of Montana, Wyoming, and South Dakota. Wat. Resour. Res. 1990, 26, 1981–2014. [Google Scholar] [CrossRef]
- Oetting, G.C.; Banner, J.L.; Sharp, J.M., Jr. Regional controls on the geochemical evolution of saline groundwaters in the Edwards aquifer, central Texas. J. Hydrol. 1996, 181, 251–283. [Google Scholar] [CrossRef]
- Williams, L.J.; Kuniansky, E.L. Revised Hydrogeologic Framework of the Floridan Aquifer System in Florida and Parts of Georgia, Alabama, and South Carolina; Regional Aquifer Analysis Professional Paper 1807; U.S. Geological Survey: Washington, DC, USA, 2016; p. 140. [Google Scholar]
- Downey, J.S.; Busby, J.F.; Dinwiddie, G.A. Regional aquifers and petroleum in the Williston Basin region of the United States. Am. Assoc. Petrol. Geol. Bull. 1987, 69, 299. [Google Scholar]
- Pavlicek, D.; Small, T.A.; Rettman, P.L. Hydrogeologic Data from a Study of the Freshwater Zone/Salinewater Zone Interface in the Edwards Aquifer, San Antonio Region, Texas; Open File Report 87-389; U.S. Geological Survey: Washington, DC, USA, 1987; p. 108. [Google Scholar]
- Gulley, J.D.; Florea, L.J. Caves as paleo-water table indicators in the unconfined Upper Floridan aquifer. Fla. Sci. 2016, 79, 239–256. [Google Scholar]
- Palmer, A.N.; Palmer, M.V.; Paces, J.B.; Feinberg, J.; Gao, Y.; Alexander, E.C. Geologic history of the Black Hills caves, South Dakota. In Caves and Karst Across Time; Feinberg, J., Gao, Y., Alexander, E.C., Eds.; Geological Society of America Special Paper 516; Geological Society of America: Boulder, CO, USA, 2016; pp. 87–101. [Google Scholar]
- Halihan, T.; Sharp, J.M., Jr.; Mace, R.E. Interpreting flow using permeability at multiple scales. In Karst Modeling; Palmer, A.N., Palmer, M.V., Eds.; Karst Waters Institute Special Publication 5; Karst Waters Institute: Charles Town, WV, USA, 1999; pp. 82–96. [Google Scholar]
- Engel, A.S.; Randall, K.W. Experimental evidence for microbially mediated carbonate dissolution from the saline water zone of the Edwards Aquifer, Central Texas. Geomicrol. J. 2011, 28, 313–327. [Google Scholar] [CrossRef]
- Florea, L.J.; Vacher, H.L.; Donahue, B.; Naar, D. Quaternary cave levels in peninsular Florida. Quat. Sci. Rev. 2007, 26, 1344–1361. [Google Scholar] [CrossRef]
- Stewart, J.W.; Mills, L.R. Hydrogeology of the Sulphur Springs Area, Tampa, Florida; U.S. Geological Survey Water-Resources Investigations Report 83-4085; U.S. Geological Survey: Washington, DC, USA, 1984. [Google Scholar]
- Palmer, A.N. Sulfuric acid vs. epigenic carbonic acid in cave origin and morphology. In Proceedings of the Deep Karst: Origins, Resources, and Management of Hypogene Karst, Carlsbad, NM, USA, 11–14 April 2016; pp. 11–14. [Google Scholar]
- McGregor, D.J. Gypsum and Anhydrite Deposits in Southwestern Indiana; Indiana Geological and Water Survey Report of Progress 08; Indiana Geological Survey: Bloomington, IN, USA, 1954; p. 24. [Google Scholar]
- Klimchouk, A.B. Hypogene Speleogenesis. In Treatise on Geomorphology; Shroder, J.F., Ed.; Academic Press: Cambridge, MA, USA, 2013; pp. 220–240. [Google Scholar] [CrossRef]
- Stueber, A.M.; Walter, L.M. Origin and chemical evolution of formation waters from Silurian-Devonian strata in the Illinois basin, USA. Geochim. Cosmochim. Acta 1991, 55, 309–325. [Google Scholar] [CrossRef]
- Hill, C.A. Sulfuric acid speleogenesis of Carlsbad Cavern and its relationship to hydrocarbons, Delaware Basin, New Mexico and Texas. Am. Assoc. Petrol. Geol. Bull. 1990, 74, 1685–1694. [Google Scholar]
- Florea, L.J. Carbon flux and landscape evolution in epigenic karst aquifers modeled from geochemical mass balance. Earth Surf. Proc. Land. 2015, 40, 1072–1087. [Google Scholar] [CrossRef]
- Chadha, D.K. A proposed new diagram for geochemical classification of natural waters and interpretation of chemical data. Hydrog. J. 1990, 7, 431–439. [Google Scholar] [CrossRef]
- Florea, L.J. Sulfur-Based Speleogenesis in the Cumberland Plateau, USA. In Hypogene Karst Regions and Caves of the World; Klimchouk, A., Palmer, A., Waele, J., Auler, A., Audra, P., Eds.; Springer: Cham, Switzerland, 2017; pp. 683–690. [Google Scholar]
- Covington, M.D.; Martin, J.B.; Toran, L.E.; Macalady, J.L.; Sekhon, N.; Sullivan, P.L.; Garcia, A.A.; Heffernan, J.B.; Graham, W.D. Carbonates in the critical zone. Earth’s Future 2023, 11, e2022EF002765. [Google Scholar] [CrossRef]
- Gao, M.; Li, X.; Qian, J.; Wang, Z.; Hou, X.; Fu, C.; Ma, J.; Li, J. Hydrogeochemical Characteristics and Evolution of Karst Groundwater in Heilongdong Spring Basin, Northern China. Water 2023, 15, 726. [Google Scholar] [CrossRef]
- Li, C.; Smith, P.; Bai, X.; Tan, Q.; Luo, G.; Li, Q.; Wang, J.; Wu, L.; Chen, F.; Deng, Y.; et al. Effects of carbonate minerals and exogenous acids on carbon flux from the chemical weathering of granite and basalt. Glob. Plan. Chang. 2023, 221, 104053. [Google Scholar] [CrossRef]


| Analyte | Method | Detection Limit | ||
|---|---|---|---|---|
| Nutrients | ||||
| Ammonia | NH4+ | Nessler method (salicylate) | Hach Method 8038 | 0.02–2.50 mg/L |
| Nitrite | NO2− | NitriVer3 (diazotization) | Hach Method 8507 | 0.002–0.300 mg/L |
| Nitrate | NO3− | NitraVer5 (cadmium reduction) | Hach Method 8171 | 0.1–10.0 mg/L |
| Orthophosphate | PO43− | PhosPher3 (ascorbic acid) | Hach Method 8048 | 0.02–2.50 mg/L |
| Sulfate | SO42− | SulfaVer4 (BaSO4 turbidity) | Hach Method 8051 | 2–70 mg/L |
| Alkalinity | ||||
| (Bi)Carbonate | CO3, HCO3 | Inflection point titration | USGS ANC method | Approx. 4% error |
| Anions | ||||
| Chloride | Cl− | Ion chromatography | EPA Method 300.1 | 1.5 mg/L |
| Bromide | Br | Ion chromatography | EPA Method 300.1 | 0.030 mg/L |
| Fluoride | F− | Ion chromatography | EPA Method 300.1 | 0.0080 mg/L |
| Cations | ||||
| Silica | Si4+ | ICP-OES | EPA Method 200.7 | 0.02 mg/L |
| Calcium | Ca2+ | ICP-OES | EPA Method 200.7 | 0.2 mg/L |
| Magnesium | Mg2+ | ICP-OES | EPA Method 200.7 | 0.2 mg/L |
| Barium | Ba2+ | ICP-MS | EPA Method 200.8 | 1.2 mg/L |
| Zinc | Zn2+ | ICP-OES | EPA Method 200.7 | 0.003 mg/L |
| Strontium | Sr2+ | ICP-OES | EPA Method 200.7 | 0.003 mg/L |
| Sodium | Na+ | ICP-OES | EPA Method 200.7 | 1.0 mg/L |
| Potassium | K+ | ICP-OES | EPA Method 200.7 | 1.0 mg/L |
| Lithium | Li+ | ICP-OES | EPA Method 200.7 | 0.01 mg/L |
| Trace Metals | ||||
| Aluminum | Al | ICP-OES | EPA Method 200.7 | 0.0300 mg/L |
| Boron | B | ICP-OES | EPA Method 200.7 | 0.0200 mg/L |
| Iron | Fe | ICP-OES | EPA Method 200.7 | 0.008 mg/L |
| Manganese | Mn | ICP-MS | EPA Method 200.8 | 0.0010 mg/L |
| Lead | Pb | ICP-MS | EPA Method 200.8 | 0.0010 mg/L |
| Chromium | Cr | ICP-MS | EPA Method 200.8 | 0.0012 mg/L |
| Cadmium | Cd | ICP-MS | EPA Method 200.8 | 0.0010 mg/L |
| Arsenic | As | ICP-MS | EPA Method 200.8 | 0.0012 mg/L |
| Factor 1 | Factor 2 | Factor 3 | |
|---|---|---|---|
| Temperature (°C) | 0.159 | 0.584 | −0.198 |
| SpC (µS/cm) @25 °C | 0.972 | 0.042 | 0.110 |
| DO (mg/L) | −0.726 | 0.035 | 0.431 |
| pH @25 °C | −0.285 | −0.024 | 0.836 |
| Eh (mV) | −0.750 | 0.209 | −0.170 |
| Alk CaCO3 (mg/L) | −0.089 | 0.928 | 0.035 |
| HCO3− (mg/L) | −0.086 | 0.927 | 0.023 |
| CO3 (mg/L) | −0.250 | 0.194 | 0.813 |
| F− (mg/L) | 0.714 | 0.091 | 0.144 |
| Cl− (mg/L) | 0.857 | 0.098 | 0.126 |
| NO3− (mg/L) | 0.114 | 0.350 | 0.143 |
| PO43− (mg/L) | −0.007 | 0.200 | −0.125 |
| SO42− (mg/L) | 0.928 | −0.178 | 0.098 |
| Ca2+ (mg/L) | 0.929 | 0.085 | 0.117 |
| Mg2+ (mg/L) | 0.939 | −0.080 | 0.069 |
| K+ (mg/L) | 0.611 | 0.158 | −0.140 |
| Na+ (mg/L) | 0.875 | 0.073 | 0.133 |
| Fe (mg/L) | 0.032 | −0.128 | −0.063 |
| Mn (mg/L) | 0.025 | 0.028 | −0.298 |
| Zn2+ (mg/L) | 0.036 | −0.029 | −0.336 |
| Ba2+ (mg/L) | −0.209 | −0.021 | 0.097 |
| Sr2+ (mg/L) | 0.690 | 0.004 | 0.114 |
| Si4+ (mg/L) | −0.277 | −0.297 | 0.121 |
| DOC (mg/L) | −0.100 | 0.197 | −0.292 |
Disclaimer/Publisher’s Note: The statements, opinions and data contained in all publications are solely those of the individual author(s) and contributor(s) and not of MDPI and/or the editor(s). MDPI and/or the editor(s) disclaim responsibility for any injury to people or property resulting from any ideas, methods, instructions or products referred to in the content. |
© 2023 by the authors. Licensee MDPI, Basel, Switzerland. This article is an open access article distributed under the terms and conditions of the Creative Commons Attribution (CC BY) license (https://creativecommons.org/licenses/by/4.0/).
Share and Cite
Burgess, S.A.; Branam, T.D.; Florea, L.J. Divergent Geochemical Pathways of Carbonate Aquifer Evolution in a Classic Karst Terrain: (2) Groundwater Source Delineation Using Regional Water Chemistry Data. Water 2023, 15, 3436. https://doi.org/10.3390/w15193436
Burgess SA, Branam TD, Florea LJ. Divergent Geochemical Pathways of Carbonate Aquifer Evolution in a Classic Karst Terrain: (2) Groundwater Source Delineation Using Regional Water Chemistry Data. Water. 2023; 15(19):3436. https://doi.org/10.3390/w15193436
Chicago/Turabian StyleBurgess, Sarah Asha, Tracy D. Branam, and Lee J. Florea. 2023. "Divergent Geochemical Pathways of Carbonate Aquifer Evolution in a Classic Karst Terrain: (2) Groundwater Source Delineation Using Regional Water Chemistry Data" Water 15, no. 19: 3436. https://doi.org/10.3390/w15193436
APA StyleBurgess, S. A., Branam, T. D., & Florea, L. J. (2023). Divergent Geochemical Pathways of Carbonate Aquifer Evolution in a Classic Karst Terrain: (2) Groundwater Source Delineation Using Regional Water Chemistry Data. Water, 15(19), 3436. https://doi.org/10.3390/w15193436