Article

Changes in Snow Surface Albedo and Radiative Forcing in the Chilean Central Andes Measured by In Situ and Remote Sensing Data

by
Luis Figueroa-Villanueva
1,*,
Lina Castro
1,*,
Tomás R. Bolaño-Ortiz
2,
Raúl P. Flores
1,
Diego Pacheco-Ferrada
1 and
Francisco Cereceda-Balic
3,4
1
Departamento de Obras Civiles, Universidad Técnica Federico Santa María, Valparaíso 2340000, Chile
2
School of Natural Resources Engineering, Department of Agricultural Science, Universidad Católica del Maule, Curicó 3466706, Chile
3
Centre for Environmental Technologies (CETAM), Universidad Técnica Federico Santa María, Valparaiso 2340000, Chile
4
Departamento de Química, Universidad Técnica Federico Santa María, Valparaiso 2340000, Chile
*
Authors to whom correspondence should be addressed.
Water 2023, 15(18), 3198; https://doi.org/10.3390/w15183198
Submission received: 30 June 2023 / Revised: 9 August 2023 / Accepted: 17 August 2023 / Published: 8 September 2023
(This article belongs to the Special Issue The Role of Snow in High-Mountain Hydrologic Cycle)

Abstract

:
Snow-covered regions are the main source of reflection of incident shortwave radiation on the Earth’s surface. The deposition of light-absorbing particles on these regions increases the capacity of snow to absorb radiation and decreases surface snow albedo, which intensifies the radiative forcing, leading to accelerated snowmelt and modifications of the hydrologic cycle. In this work, the changes in surface snow albedo and radiative forcing were investigated, induced by light-absorbing particles in the Upper Aconcagua River Basin (Chilean Central Andes) using remote sensing satellite data (MODIS), in situ spectral snow albedo measurements, and the incident shortwave radiation during the austral winter months (May to August) for the 2004–2016 period. To estimate the changes in snow albedo and radiative forcing, two spectral ranges were defined: (i) an enclosed range between 841 and 876 nm, which isolates the effects of black carbon, an important light-absorbing particle derived from anthropogenic activities, and (ii) a broadband range between 300 and 2500 nm. The results indicate that percent variations in snow albedo in the enclosed range are higher than in the broadband range, regardless of the total amount of radiation received, which may be attributed to the presence of light-absorbing particles, as these particles have a greater impact on surface snow albedo at wavelengths in the enclosed band than in the broadband band.

1. Introduction

Uncontaminated snow surfaces are among the whitest surfaces on Earth and have one of highest broadband albedos in the solar spectrum range [1]. Surface snow albedo (SSA) is a fundamental factor for the reflection of incident shortwave radiation (ISR) in the global snow–atmosphere budget system [2,3,4,5]. In the visible (VIS) and near-infrared (NIR) spectral ranges (<1 µm), SSA is strongly influenced by the presence of light-absorbing particles (LAPs), whereas for wavelengths above 1 µm, the variability of SSA is mainly controlled by the grain size of snow crystals [6,7]. The deposition of LAPs in snow darkens the surface of the snowpack, decreasing the reflection of ISR and the albedo [8,9,10]. Moreover, grain metamorphism is accelerated in the presence of LAPs, through a process that is typically referred to as the snow grain size feedback [11,12], which results in a higher ISR-absorbing capacity [13,14]. The deposition of LAPs increases radiative forcing (RF) with the potential to accelerate snowmelt and disturb the hydrologic cycle [15], also contributing to regional warming [16]. Consequently, and with the concern of climate change effects, understanding the impact on SSA becomes critical to formulating mitigation strategies for snow-dominated basins.
Several studies have documented the reduction in SSA due to LAPs such as black carbon, brown carbon, and mineral dust and the effects on local hydrological processes [12,13,17,18,19]. Black carbon (BC), also known as soot [20], is an aerosol generated from the incomplete combustion of fossil fuels, biofuels, and biomass [11,21]. In Asia, BC emissions were found to be a significant precursor of glacier melting in the Himalayas [19], the Tibetan Plateau [22], and regions in Northern China [23]. Brown carbon (BrC) is an organic carbon (OC) fraction, primarily emitted by the incomplete combustion of biomass or by the oxidation of anthropogenic and biogenic gaseous precursors [24]. The effect of BrC is comparable to the snow darkening effect of black carbon, ranging from around half to the same darkening of snow surfaces as soot [25]. Mineral dust is transported to snow-covered areas from arid regions or from anthropogenic sources like opencast mining and the construction industry [26,27]. Events in past years have highlighted the urgency of studying these phenomena in the context of climate change adaptation. Heavy dust loads deposited onto snow surface in the Upper Colorado River Basin [28] or in the European Alps [29] have accelerated snow melt-out, shifting the timing of peak snow-melt-driven runoff and increasing evapotranspiration as vegetation is early exposed. These have consequently altered the basins’ hydrological responses. Further, given the relation between climate shifts and natural disasters in high mountain basins [30], these areas are particularly sensitive to disruptions in snowpack dynamics and, therefore, should be closely monitored.
Research along the Chilean central Andes has primarily focused on the reduction of snow albedo by BC [27,31,32]. Since obtaining field measurements in high mountain environments is a difficult task, studies have mainly included point measurements of SSA that do not account for the spatial variability of the complex climatic and topographic conditions of the Chilean Andes [33,34]. The lack of knowledge of the spatial variability of SSA and the distribution of LAPs over the Andes renders albedo estimations for hydrological modelling to empirical parameters, which increases uncertainties in runoff predictions and does not consider the environmental impacts driven by the deposition of these particles. In this context, remote sensing tools emerge as a valuable tool as they provide data at high spatio-temporal resolution for monitoring snow-covered regions at high elevations [35], offering promising opportunities to improve the assessment, observation, and modeling of snow processes [1,36,37].
This study aims to evaluate changes in RF associated with the presence of BC, which is emitted by anthropogenic activities that occur in the Andes, such as vehicular traffic and the mining industry [38]. The solar spectrum was separated into broadband (Bbr) and enclosed (Ecr) ranges to isolate the impact of BC [39]. The broadband range considers wavelengths of 300–2500 nm, while the enclosed range considers a narrower band with wavelengths between 841 and 876 nm. Observations from the Moderate Resolution Imaging Spectroradiometer (MODIS) and modeled ISR from the Chilean Solar Explorer (SE) were used to evaluate temporal and spatial changes in RF, which were validated against in situ SSA and ISR measurements collected in the Upper Aconcagua River Basin (UARB) in the Chilean Central Andes. The MODIS Dust Radiative Forcing in Snow (MODDRFS) [40,41] product was used to estimate the continuous and integrated daily RF for each spectral range, which were analyzed for temporal trends and variability throughout the 2004–2016 period. The paper is organized as follows: Section 2 describes the Materials and Methods and Section 3 presents the Results and Discussion. Finally, the Conclusions are presented in Section 4.

2. Materials and Methods
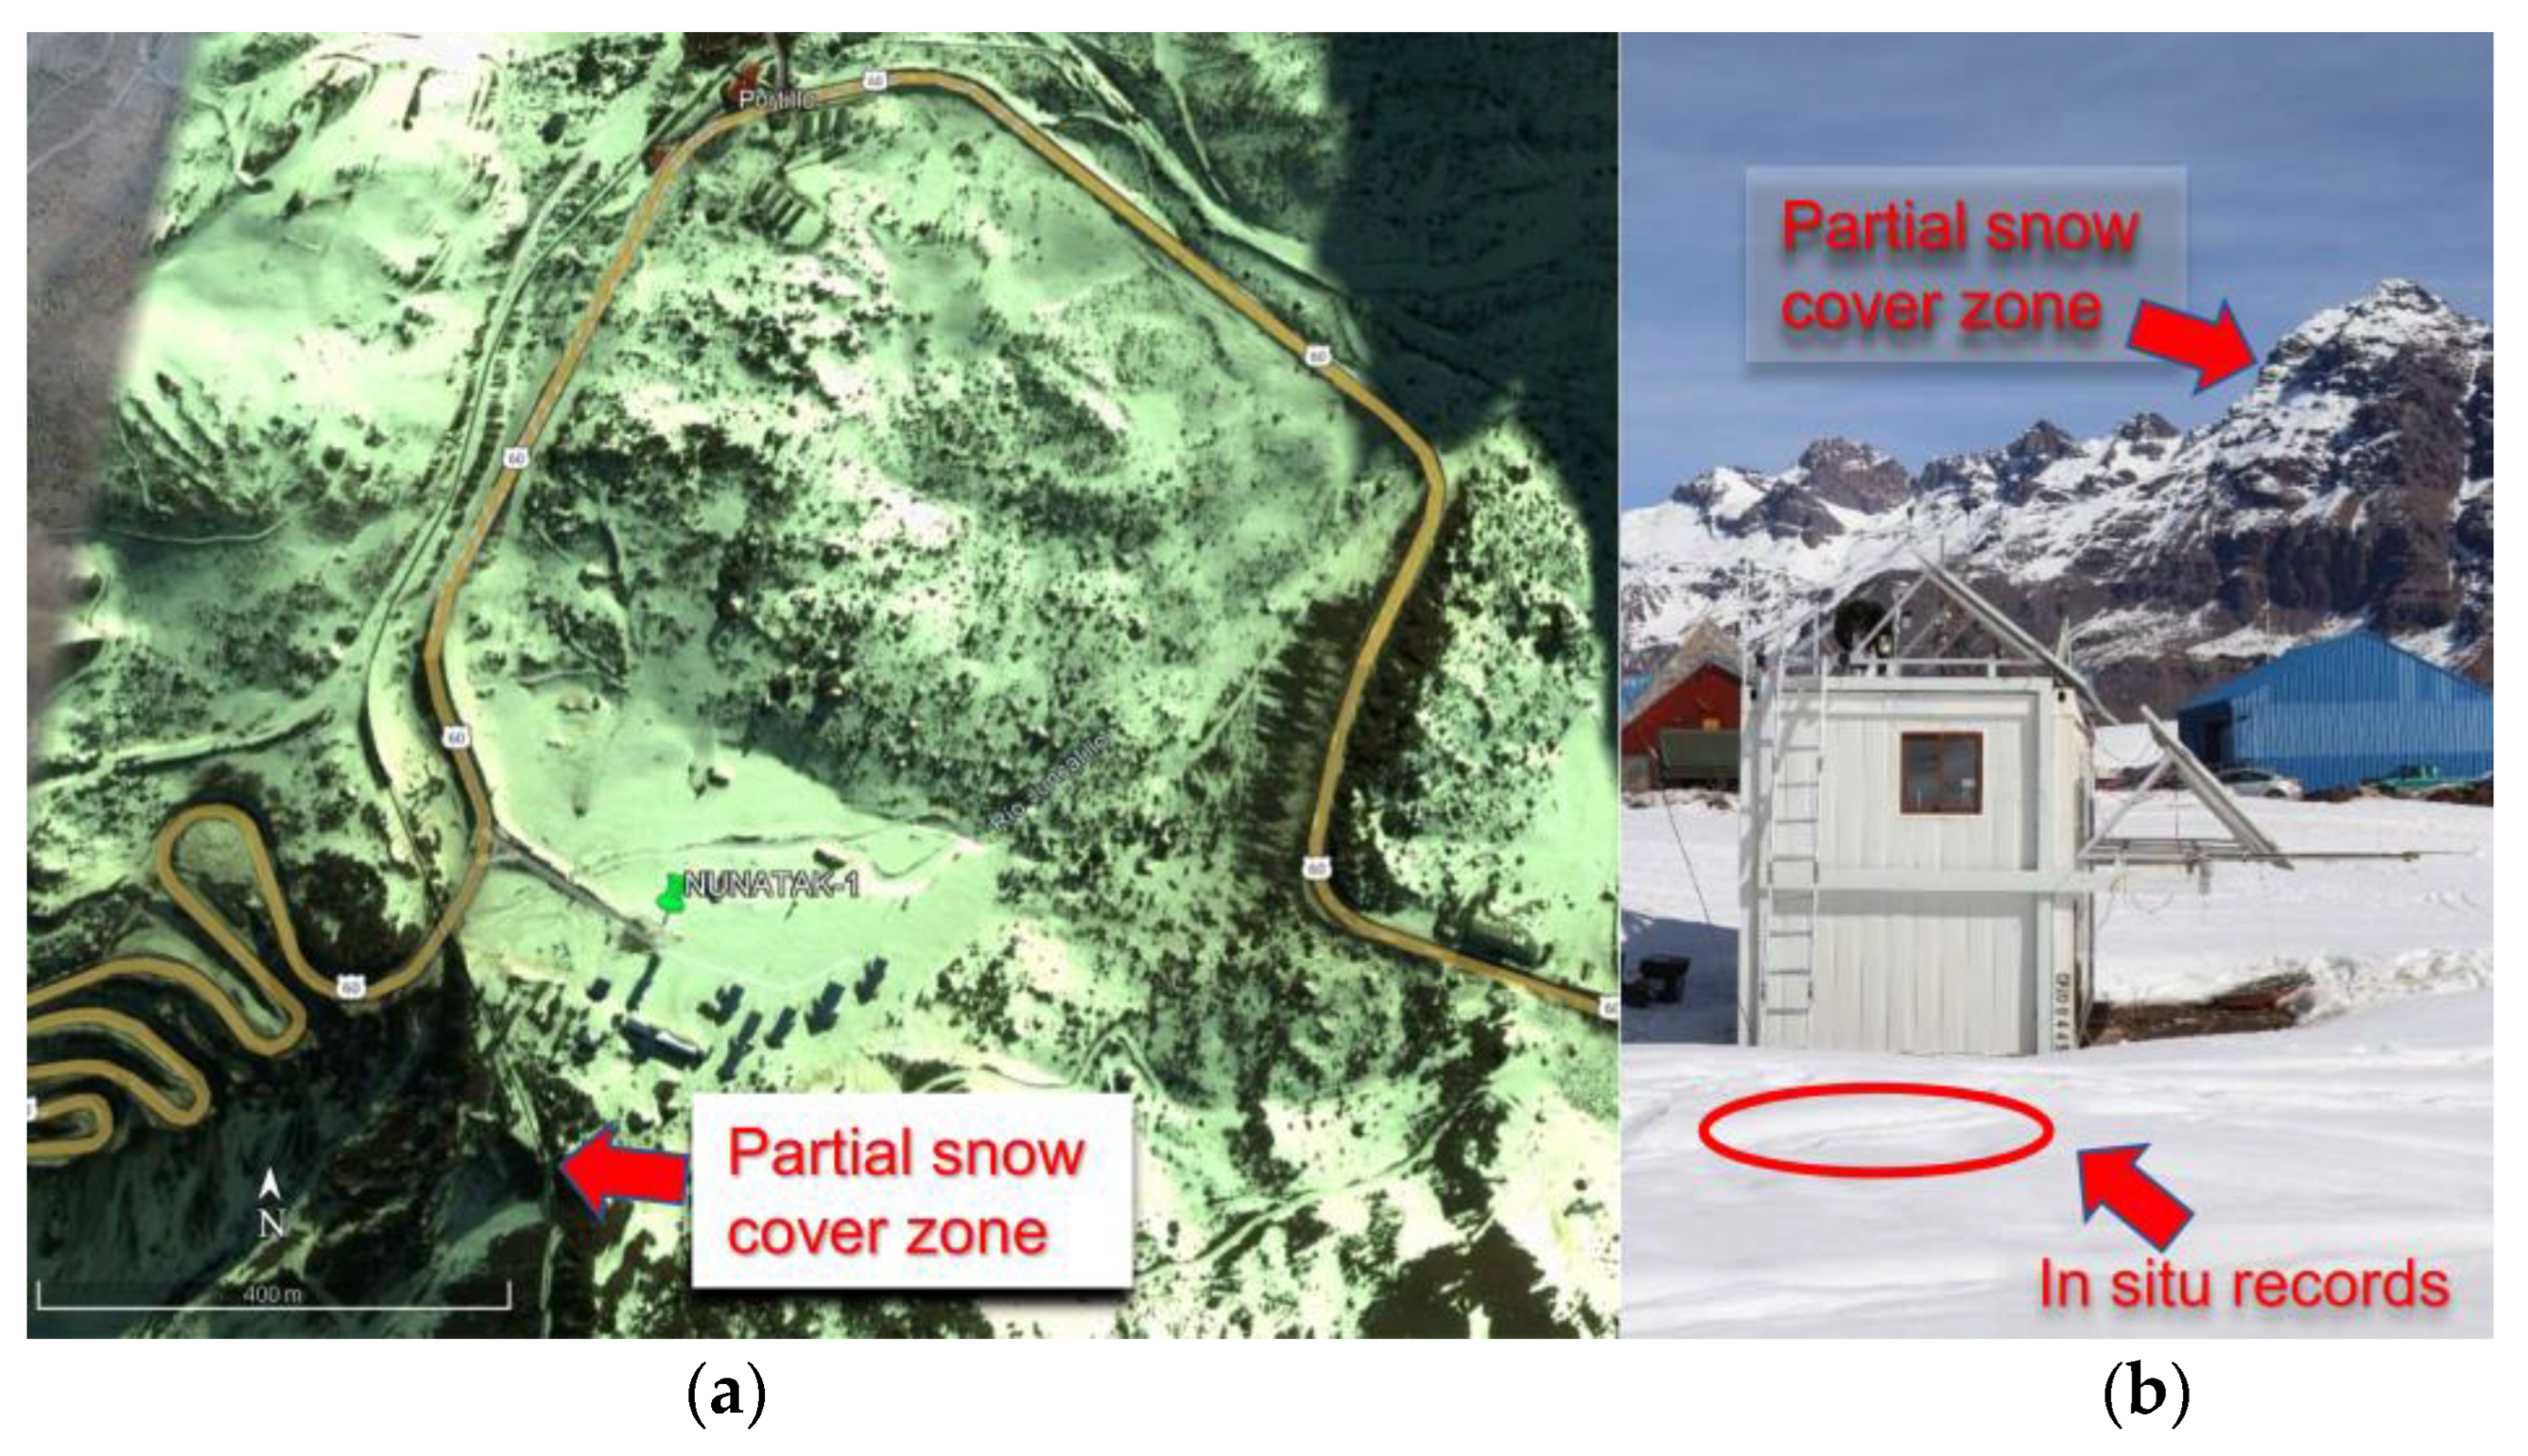
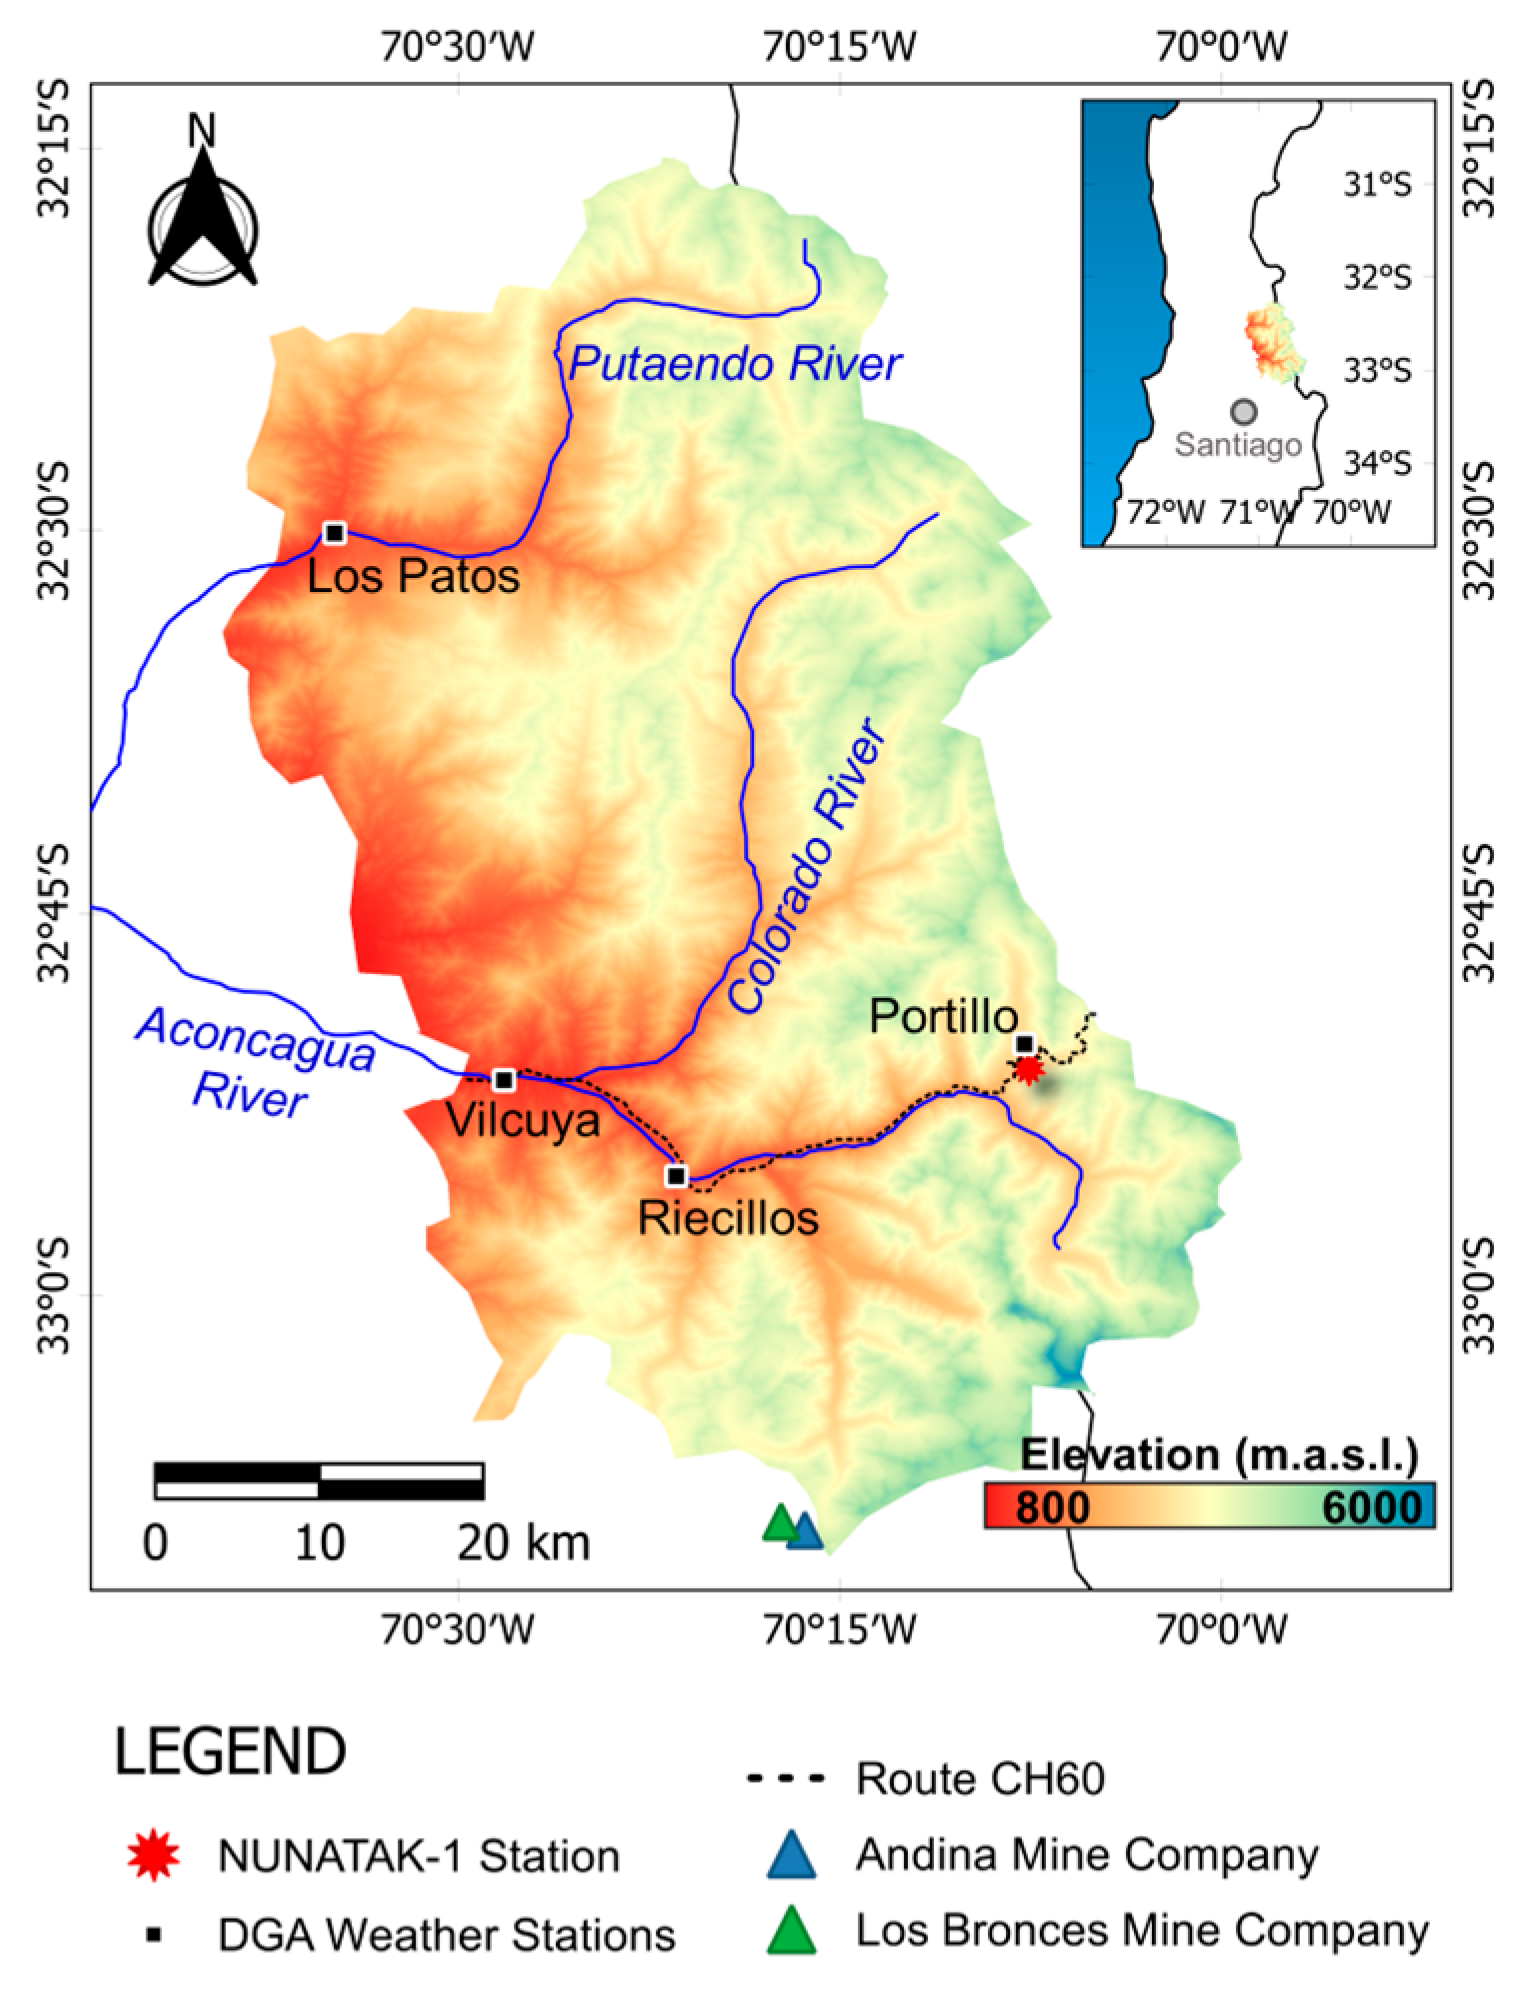
2.1. Study Area

Central Chile is characterized by a Mediterranean climate, with mild wet winters and dry summers [42]. Precipitation occurs during the austral winter due to sporadic cold fronts, and orographic effects may produce very localized rainfall patterns [43]. Since 2010, the Central Chile region has experienced a so-called mega-drought, characterized by a series of dry years that typically show a 25% to 45% deficit in annual precipitation [44]. Several studies have reported a significant decrease in snow cover duration and extent [35,45] and significant losses in glacier mass [46] over the last decade.
The study area corresponds to the Upper Aconcagua River Basin (UARB) in the Chilean Central Andes (Figure 1). The watershed is located in the Valparaíso district, approximately 80 km northeast of Santiago, Chile’s largest city and capital. The UARB extends between 32°15′–33°15′ S and 70°0′–70°45′ W, with an area of approximately 3660 km2 and elevations ranging from 800 to 6000 m above sea level (m.a.s.l.). The mean watershed altitude is approximately 3000 m.a.s.l. The UARB includes four meteorological stations, which are managed by the Dirección General de Aguas de Chile (DGA) and provide daily precipitation and temperature data (Resguardo Los Patos, Riecillos, and Vilcuya) and snow depth data (Portillo, see Figure 1). A laboratory refuge, managed by the Centre for Environmental Technologies (CETAM) of Universidad Técnica Federico Santa María, named NUNATAK-1 (NNTK-1) (32°50′43″ S, 70°07′47″ W and 3000 m.a.s.l.), measures atmospheric variables such as incident and reflected radiation (shortwave and longwave), air quality (aerosols and gases), and meteorology, including snow depth since 2016. According to data from the meteorological stations, the monthly mean temperature in the UARB typically oscillates between 9.7 °C to 10.9 °C and 19.6 °C to 21.1 °C during the austral winter and summer, respectively, with an annual mean of 15.2 °C. However, in the Portillo station, which is close to the location of NNTK-1, the mean annual temperature is 5 °C with temperatures below zero during the winter. The mean annual precipitation is 360 mm, with approximately 280 mm occurring in the fall and winter seasons (May to August). Maximum snow depth occurs in July or August, with values typically exceeding 1700 mm (snow water equivalent of 813 mm) and a historical maximum of 2590 mm in August 1997 (snow water equivalent of 1201 mm) at the Portillo station.

2.2. Database

2.2.1. NUNATAK-1 Laboratory Refuge

NUNATAK-1 (NNTK-1) is a laboratory refuge located at an altitude of 3000 m.a.s.l. (Figure 1) located within the winter quarters of the Mountain School of the Chilean Army in Portillo, a few miles away from the Chile-Argentina border. Its main purpose is to study environmental pollution and atmosphere–cryosphere interactions, specifically how air pollution affects the melting of glaciers and climate change [33,47]. NNTK-1 measures variables such as concentration and size distribution of atmospheric aerosols, atmospheric concentrations of BC and BrC, and net solar irradiance. A portable Kipp & Zonen 4-Component Net Radiometer (CNR4) is used to measure incoming and reflected solar irradiances and estimate surface snow albedo. The radiometer includes a pyranometer, with a sensitivity of 10–20 µVW−1 m−2 and a maximum uncertainty of 5% (95% confidence level), which covers the solar spectrum in the 300 to 2800 nm range. The instrument registers the incident and reflected radiation at a 1 min frequency. For this study, only information from the radiometer for the period 2016–2019 was available at the time of data processing. The in situ surface snow albedo (SSAin situ) was calculated for the 300–2800 nm range as follows:
  S S A i n   s i t u = R r R i
where Rr and Ri correspond to the reflected and incident radiation, respectively. The ISR and SSA data collected at a frequency of 1 min were aggregated at a daily timescale (only considering daylight hours) with the purpose of comparing them to those obtained from the SE and MODIS. The in situ SSA data were filtered to (i) eliminate data recorded before sunrise and after sunset, (ii) discard spurious measurements caused by sensor obstruction, and (iii) discard data from days with incomplete records.

2.2.2. MODIS Data Processing

The Moderate Resolution Imaging Spectroradiometer (MODIS) is one of the main instruments of the NASA Earth Observing System (EOS) and operates onboard the Terra and Aqua satellites, with records starting in 2000 and extending until the present [48]. The MODIS-Aqua (MYD) and MODIS-Terra (MOD) provide daily and complementary observations of the Earth, passing over the study area approximately at 10 a.m. and 2 p.m. (local time, GMT-3), respectively.
The reflectance data from band 2 (841–876 nm) from the Surface Reflectance Daily L2G Global 500 m SIN Grid, V6 product (M*D09GA), were used to assess the absorption level of incident shortwave radiation (ISR) in the range where the effects of BC are maximized (~880 nm) [39,49]. The SSA in a broadband spectral range for snow (300 to 2500 nm) was obtained from the Snow Cover Daily L3 Global 500 m SIN Grid, V6 product (M*D10A1) [48]. Each data pixel has an indicator for the quality of the measurement (QA), which is used to filter the data. Data were used only if the QA indicated the best quality (QA = 0) or good quality (QA = 1) as a criterion to increase the accuracy of radiative forcing estimations from satellite imagery and reduce the uncertainties in the process [40,41]. For validation purposes, data were extracted from the pixel containing NNTK-1 and compared to the in situ measurements (see Section 2.2.1).

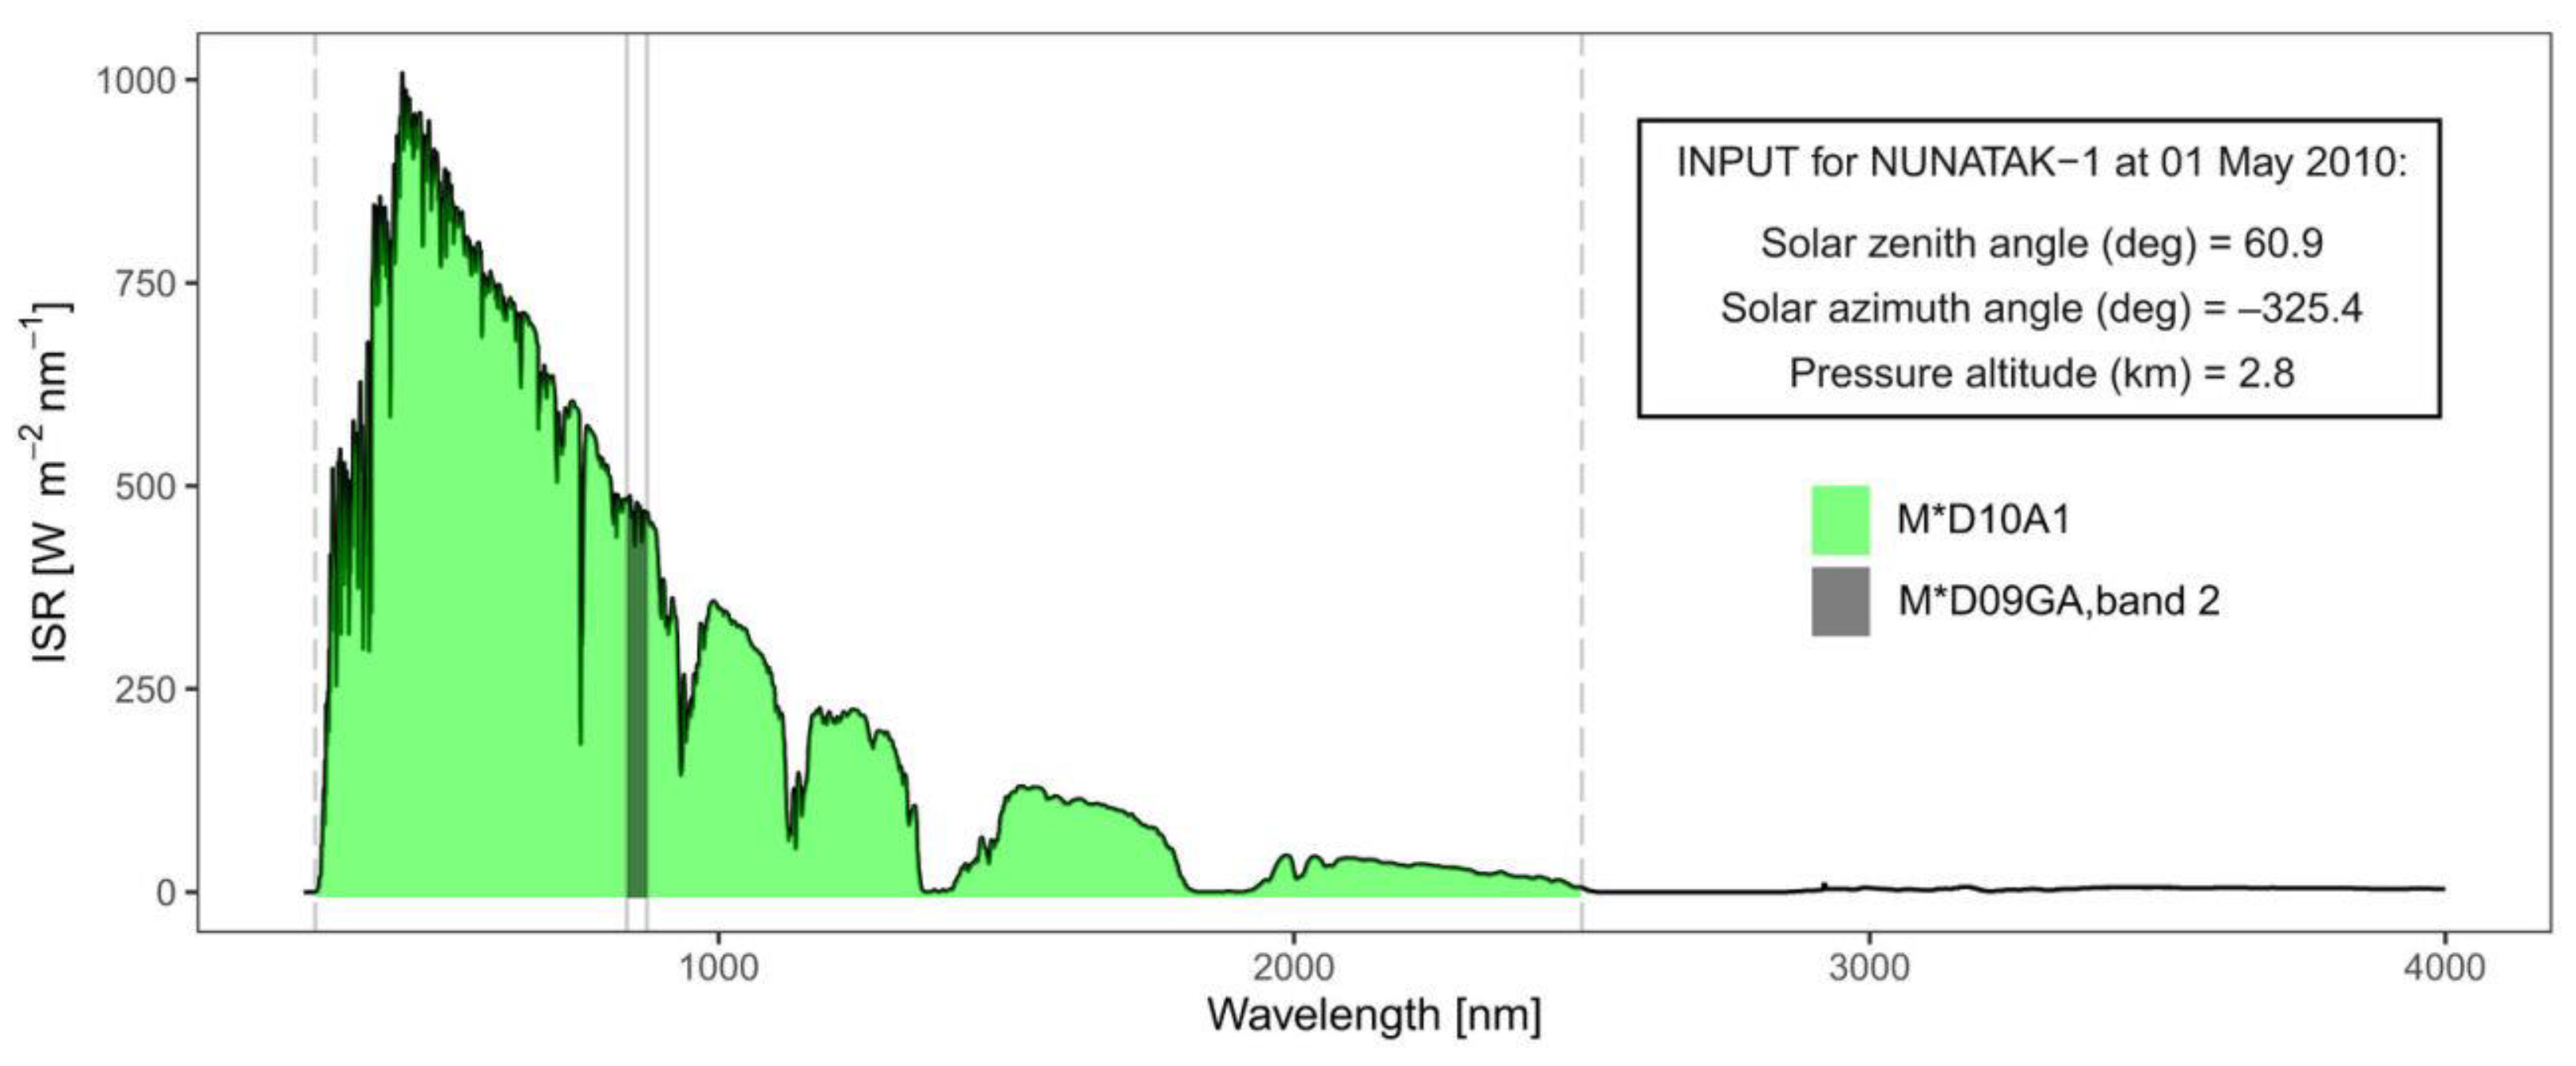
2.2.3. Solar Explorer

The Solar Explorer (SE) (http://solar.minenergia.cl/exploracion (accessed on 20 April 2021)) is a tool developed by the Chilean Energy Ministry to calculate the photovoltaic potential in the Chilean territory [50]. The model calculates the shortwave radiation at the top of the atmosphere (RTOA) and at surface level, including ISR and longwave radiation for the 2004 to 2016 period. For these calculations, the model uses the parametrization of solar radiation developed by the Goddard Climate and Radiation Branch (CLIRAD-SW) [51] in combination with information on atmosphere radiation from the TIM/SORCE satellite (Total Irradiance Monitor/Solar Radiation and Climate Experiment) [52], topographic data from the Shuttle Radar Topography Missions (SRTM) site [53,54], and the Geostationary Operational Environmental Satellite (GOES EAST) [55] for cloud detection. The ISR data have been validated against in situ radiation data from 82 weather stations distributed throughout Chile and provide hourly RTOA and ISR with a spatial resolution of 1 km per pixel (Molina [50]). The ISR data were used in the RF calculations after validation against field data from NNTK-1 (see Section 2.2.1).

2.2.4. Validation of SSA and ISR

Snow surface albedo in the broadband range (SSABbr) data obtained from M*D10A1 and modeled ISR from the Solar Explorer were validated against in situ SSA and ISR measurements from the NNTK-1 station before estimating the radiative forcing. However, it is worth noting that validation was limited in the temporal range because data were available for different periods at each platform (regarding NNTK-1 measurements). Therefore, validation of MODIS SSA and ISR data could only be conducted for 2016–2019 and 2016, respectively. SSABbr from the MODIS-Terra and MODIS-Aqua satellites were compared separately against SSAin situ, and a correlation analysis was performed on a daily basis for the entire period.

2.3. Radiative Forcing

2.3.1. MODIS Dust Radiative Forcing in Snow (MODDRFS)

The MODDRFS, originally developed by Painter et al. [40] and improved by Miller et al. [41], was used to estimate the radiative forcing (RF) over snow. This algorithm was developed to study the RF on snowpack resulting from the deposition of mineral dust in the 350–850 nm wavelength range. The instantaneous RF is obtained as follows (Miller et al. [41]):
  R F = λ o λ F o λ , t D λ d λ d t
F o λ , t = F d i r , l o c a l λ , t + F d i f λ , t
F d i r , l o c a l = F d i r s i n θ s s i n s c o s ϕ s α + c o s θ s   c o s s c o s θ s
D λ = S S A f r e s h S S A e f f e c t i v e
where F o λ , t represents the total ISR at a wavelength λ and at time t. The total ISR F o λ , t has a local and diffuse direct component (Equation (3)), where F d i r , l o c a l λ , t is given by direct radiation F d i r λ , t and diffuse radiation F d i f λ , t . Direct radiation is dependent on the conditions at a particular location, such as the angle of solar zenith θs, the angle of solar azimuth ϕs, slope s, and orientation α of the site (Equation (4)). D λ corresponds to the difference between the surface snow albedo in ideal conditions, e.g., fresh or pure snow (SSAfresh), and the effective surface snow albedo (SSAeffective) at a wavelength λ (Equation (5)). The SSAeffective was provided by the in situ and satellite measurements, and SSAfresh was estimated using the radiative transfer model SNICAR [56]. The integration limits were defined based on the wavelength range defined for Bbr and Ecr: 300–2500 nm for the M*D10A1 product (Bbr) and 841–876 nm for M*D09GA (Ecr). Finally, the daily integrated RF (DIRF) from sunrise to sunset is given by:
D I R F = s u n r i s e s u n s e t λ o λ F 0 λ , t D λ d λ d t
where the terms of this equation have been previuosly defined in Equations (3) and (5).

2.3.2. Santa Barbara DISORT Atmospheric Radiative Transfer (SBDART)

The Santa Barbara DISORT (Discrete Ordinate Radiative Transfer) Atmospheric Radiative Transfer (SBDART) [57,58,59] model was used to obtain indirect estimates of the fraction of radiation extracted from the SE that corresponds to the spectral bands provided by the MODIS reflectance products (M*D10A1 and M*D09GA band 2). SBDART models the radiative transfer processes in the atmosphere and Esarth’s surface (ISR) and requires input such as time, geographic location, atmospheric profile (tropical, mid-latitude, or sub-artic) in terms of water vapor density and pressure, solar zenith (sza) and azimuth (saza), type of surface albedo, and spectral boundaries. After estimating the total radiation in the 280–4000 nm range using SBDART, the radiation F o λ , t that corresponds to the spectral ranges of MODIS products can be obtained. The Ecr and Bbr correspond to approximately 3% and 99% of the total F o λ , t extracted from the SE, respectively (see Figure A1). These percentages show small variability throughout the day, which results primarily from changes in solar zenith and azimuth (±0.3%, and ± 0.1%, respectively). Values obtained at 10 a.m. (MODIS Terra) were determined to be close to the daily mean for both spectral ranges, with differences below 1%.

2.3.3. Snow, Ice, and Aerosol Radiative Model (SNICAR)

The SNICAR [56] is a radiative transfer model developed to simulate spectral snow albedo as a function of snow microstructure, stratigraphy, the concentration of LAPs in snow, and the surface irradiance flux [60]. For this study, SNICAR was used to estimate the fresh and clean snow albedo (SSAfresh), which is required for the calculation of the radiative forcing (Equations (2) and (5)). For the estimation of SSAfresh, clear-sky conditions were assumed, and a snow grain size of 100 µm, which corresponds to a null concentration of pollutants [1,61], and a snow density of 400 kgm−3, which is representative of seasonal snow [62], were used. Optical ice properties were estimated based on the ice refraction index proposed by Picard et al. [63]. An optically semi-infinite and uniform snowpack was considered for the study area [61]. For this purpose, a 0.3 m snowpack depth was assumed, which is enough to reproduce an optically semi-infinite layer for a snowpack with the properties previously described [64,65,66]. SNICAR albedo simulations showed that SSAfresh is mainly determined by solar position (zenith and azimuth), which varies throughout the austral winter (see Figure A3).

2.3.4. Estimation of SSA, D, and RF at NNTK-1

As described on Equation (6), D(λ) is required to estimate the daily integrated radiative forcing (Equation (6)). In turn, the estimation of D(λ) requires the SSA and ISR associated with both spectral ranges (Bbr and Ecr). The period of study is defined as between 2004 and 2016, which corresponds to the period where the remote sensing data overlap (MODIS and SE) and, consequently, the daily integrated radiative forcing (DIRF) can be estimated. SSA, D, and DIRF were estimated for all days with clear-sky conditions using the remote sensing data extracted at the location of NNTK-1.

3. Results and Discussion

3.1. Data Validation

MODIS products revealed excessive cloudiness in 2016, such that a comparison against in situ SSA (NNTK-1) measurements was not possible for this year. For the 2017–2019 period, we observed that the percentage of days with clear-sky condition (valid data) in June–July did not exceed 25% of the whole MODIS data set, while for August, this percentage increased to 61%. Comparing the two satellites between June and August, the MOD10A1 product (Terra) presented a larger number of days with clear-sky conditions, as well as a higher monthly correlation value (in the range 0.51–0.91), except for July 2017 and 2018, where the correlation values were lower than 0.13. During June–August, the MYD10A1 product (Aqua) showed correlation values in the range 0.27–0.81; however, lower values were observed for the months of June, July, and October in 2017 (0.02, 0.20, and 0.21, respectively). The reason for the low correlation values in these months for both satellites may be attributed to two main factors: (i) few days with useful remote sensing data due to excessive cloudiness and (ii) days where the elevation of the snow line (zero isotherm) was relatively close to the elevation of NNTK-1, with the implication of low or partial snow coverage at NNTK-1′s pixel (<70%), resulting in an underestimation of more than 10% with respect to the field measurements (see Figure A2). The Solar Explorer data had been previously validated in the study area [50]. Despite this, we computed the correlation between ISR from SE and from NNTK-1, confirming a very high correlation (>0.9) during 2016 (not shown).

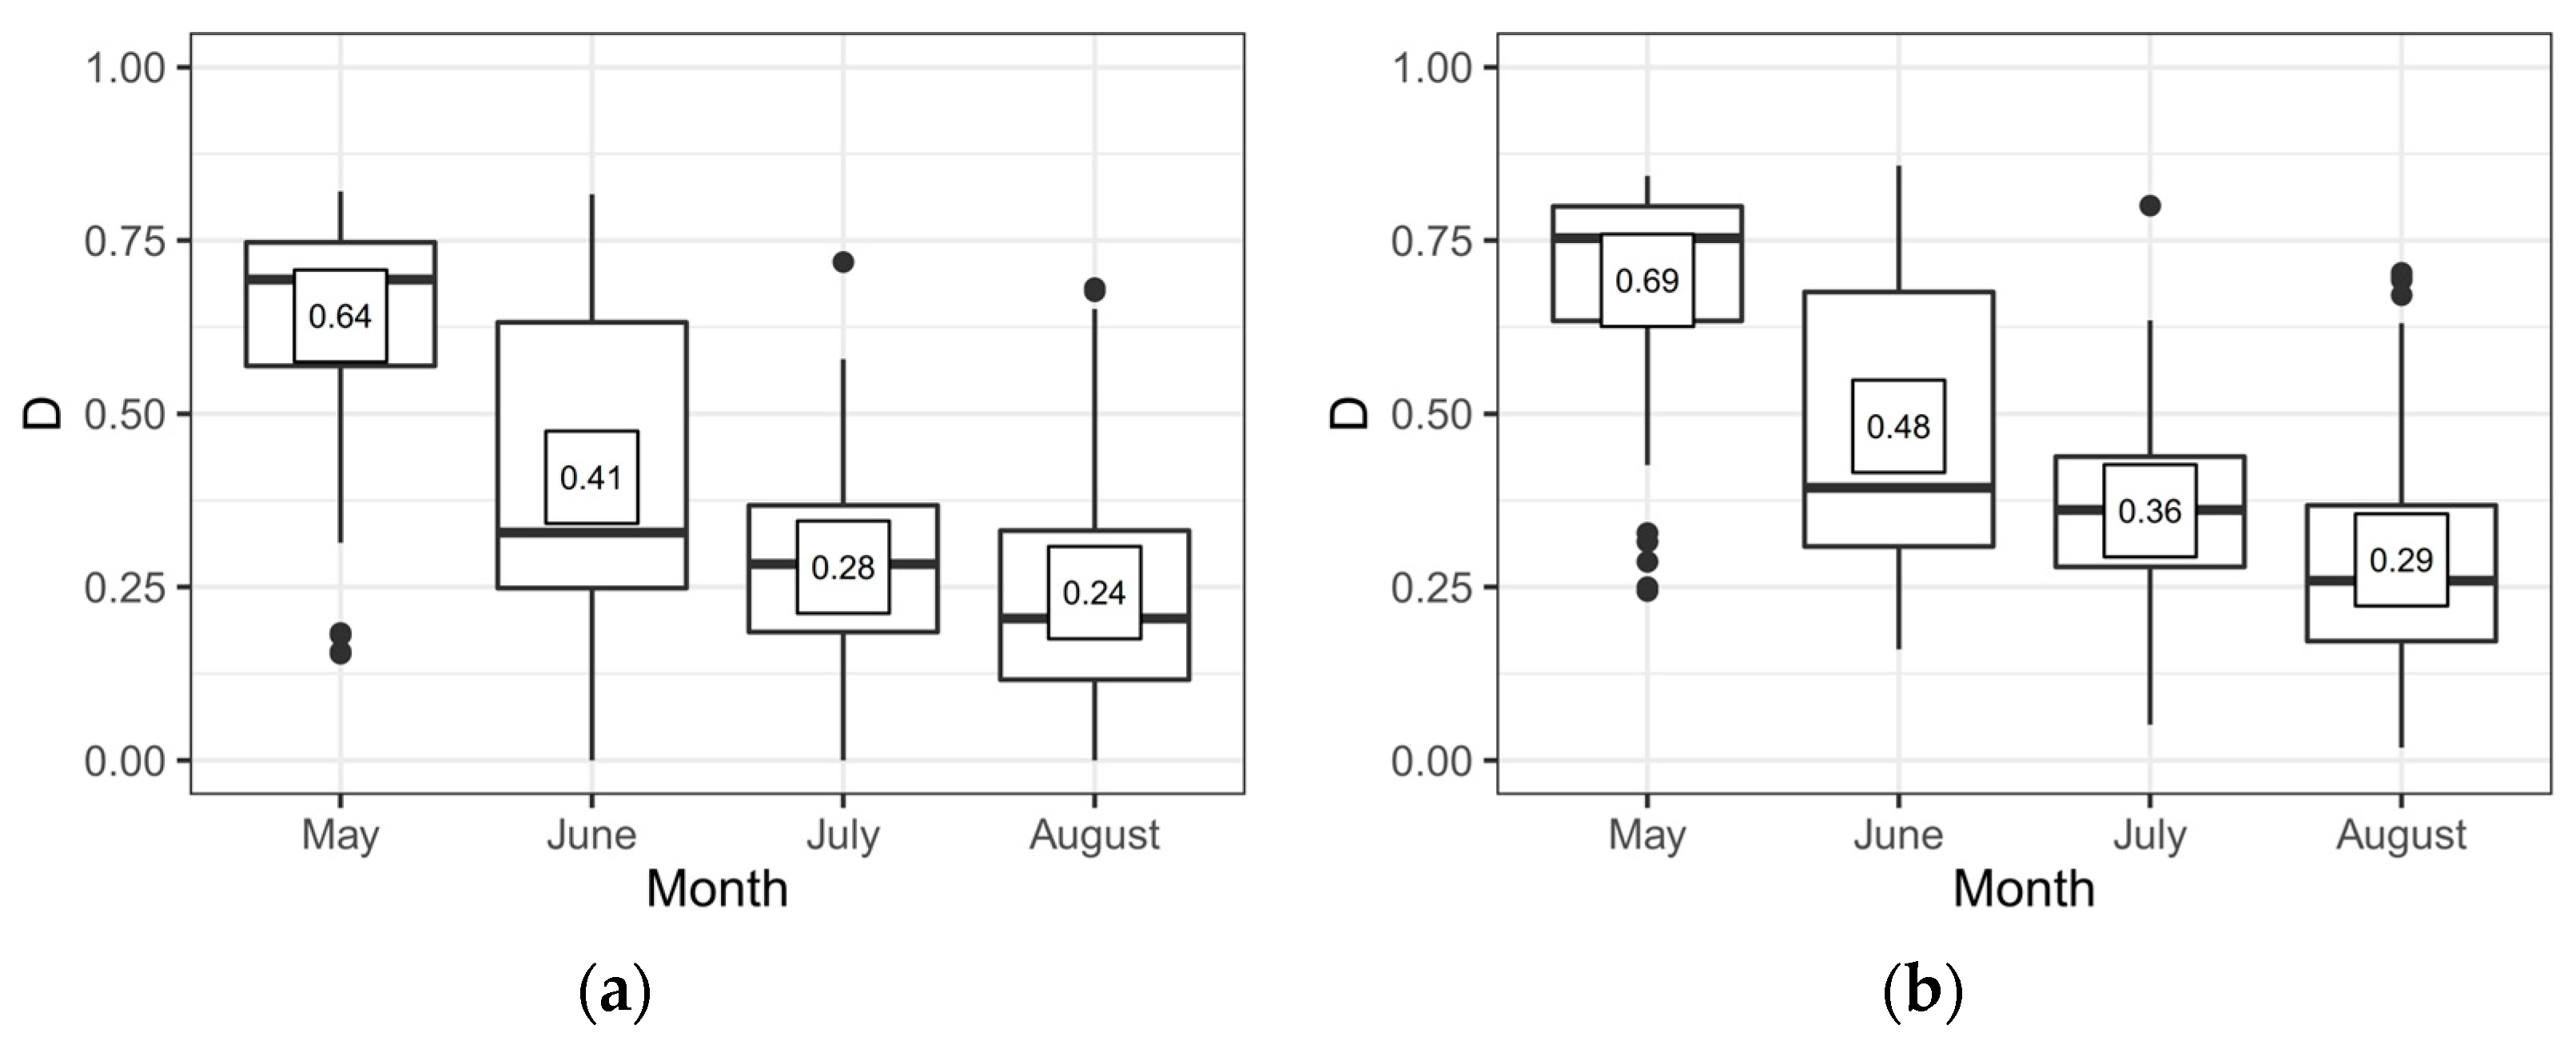
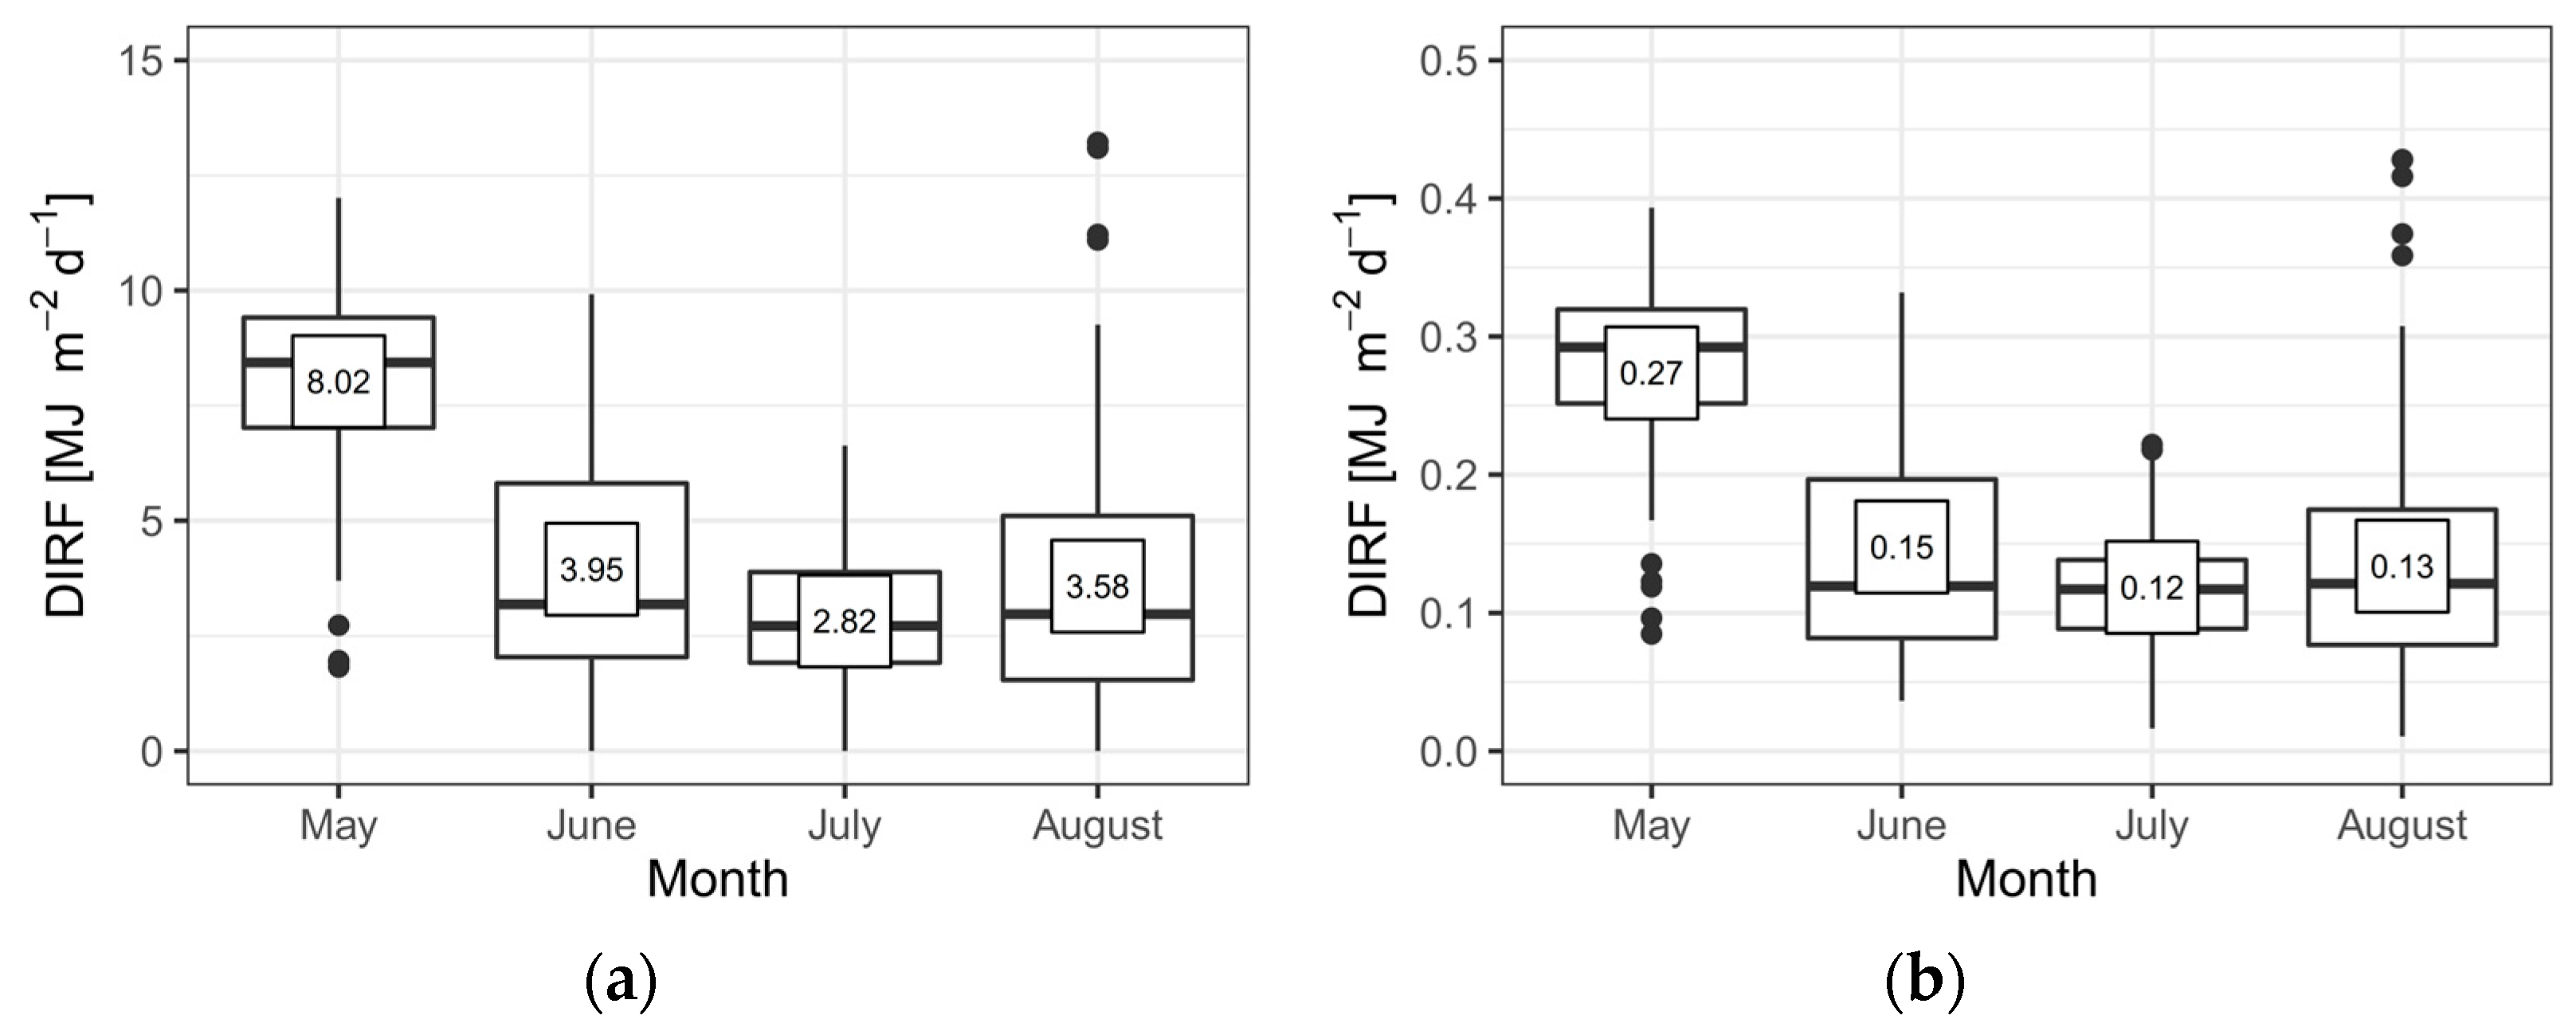
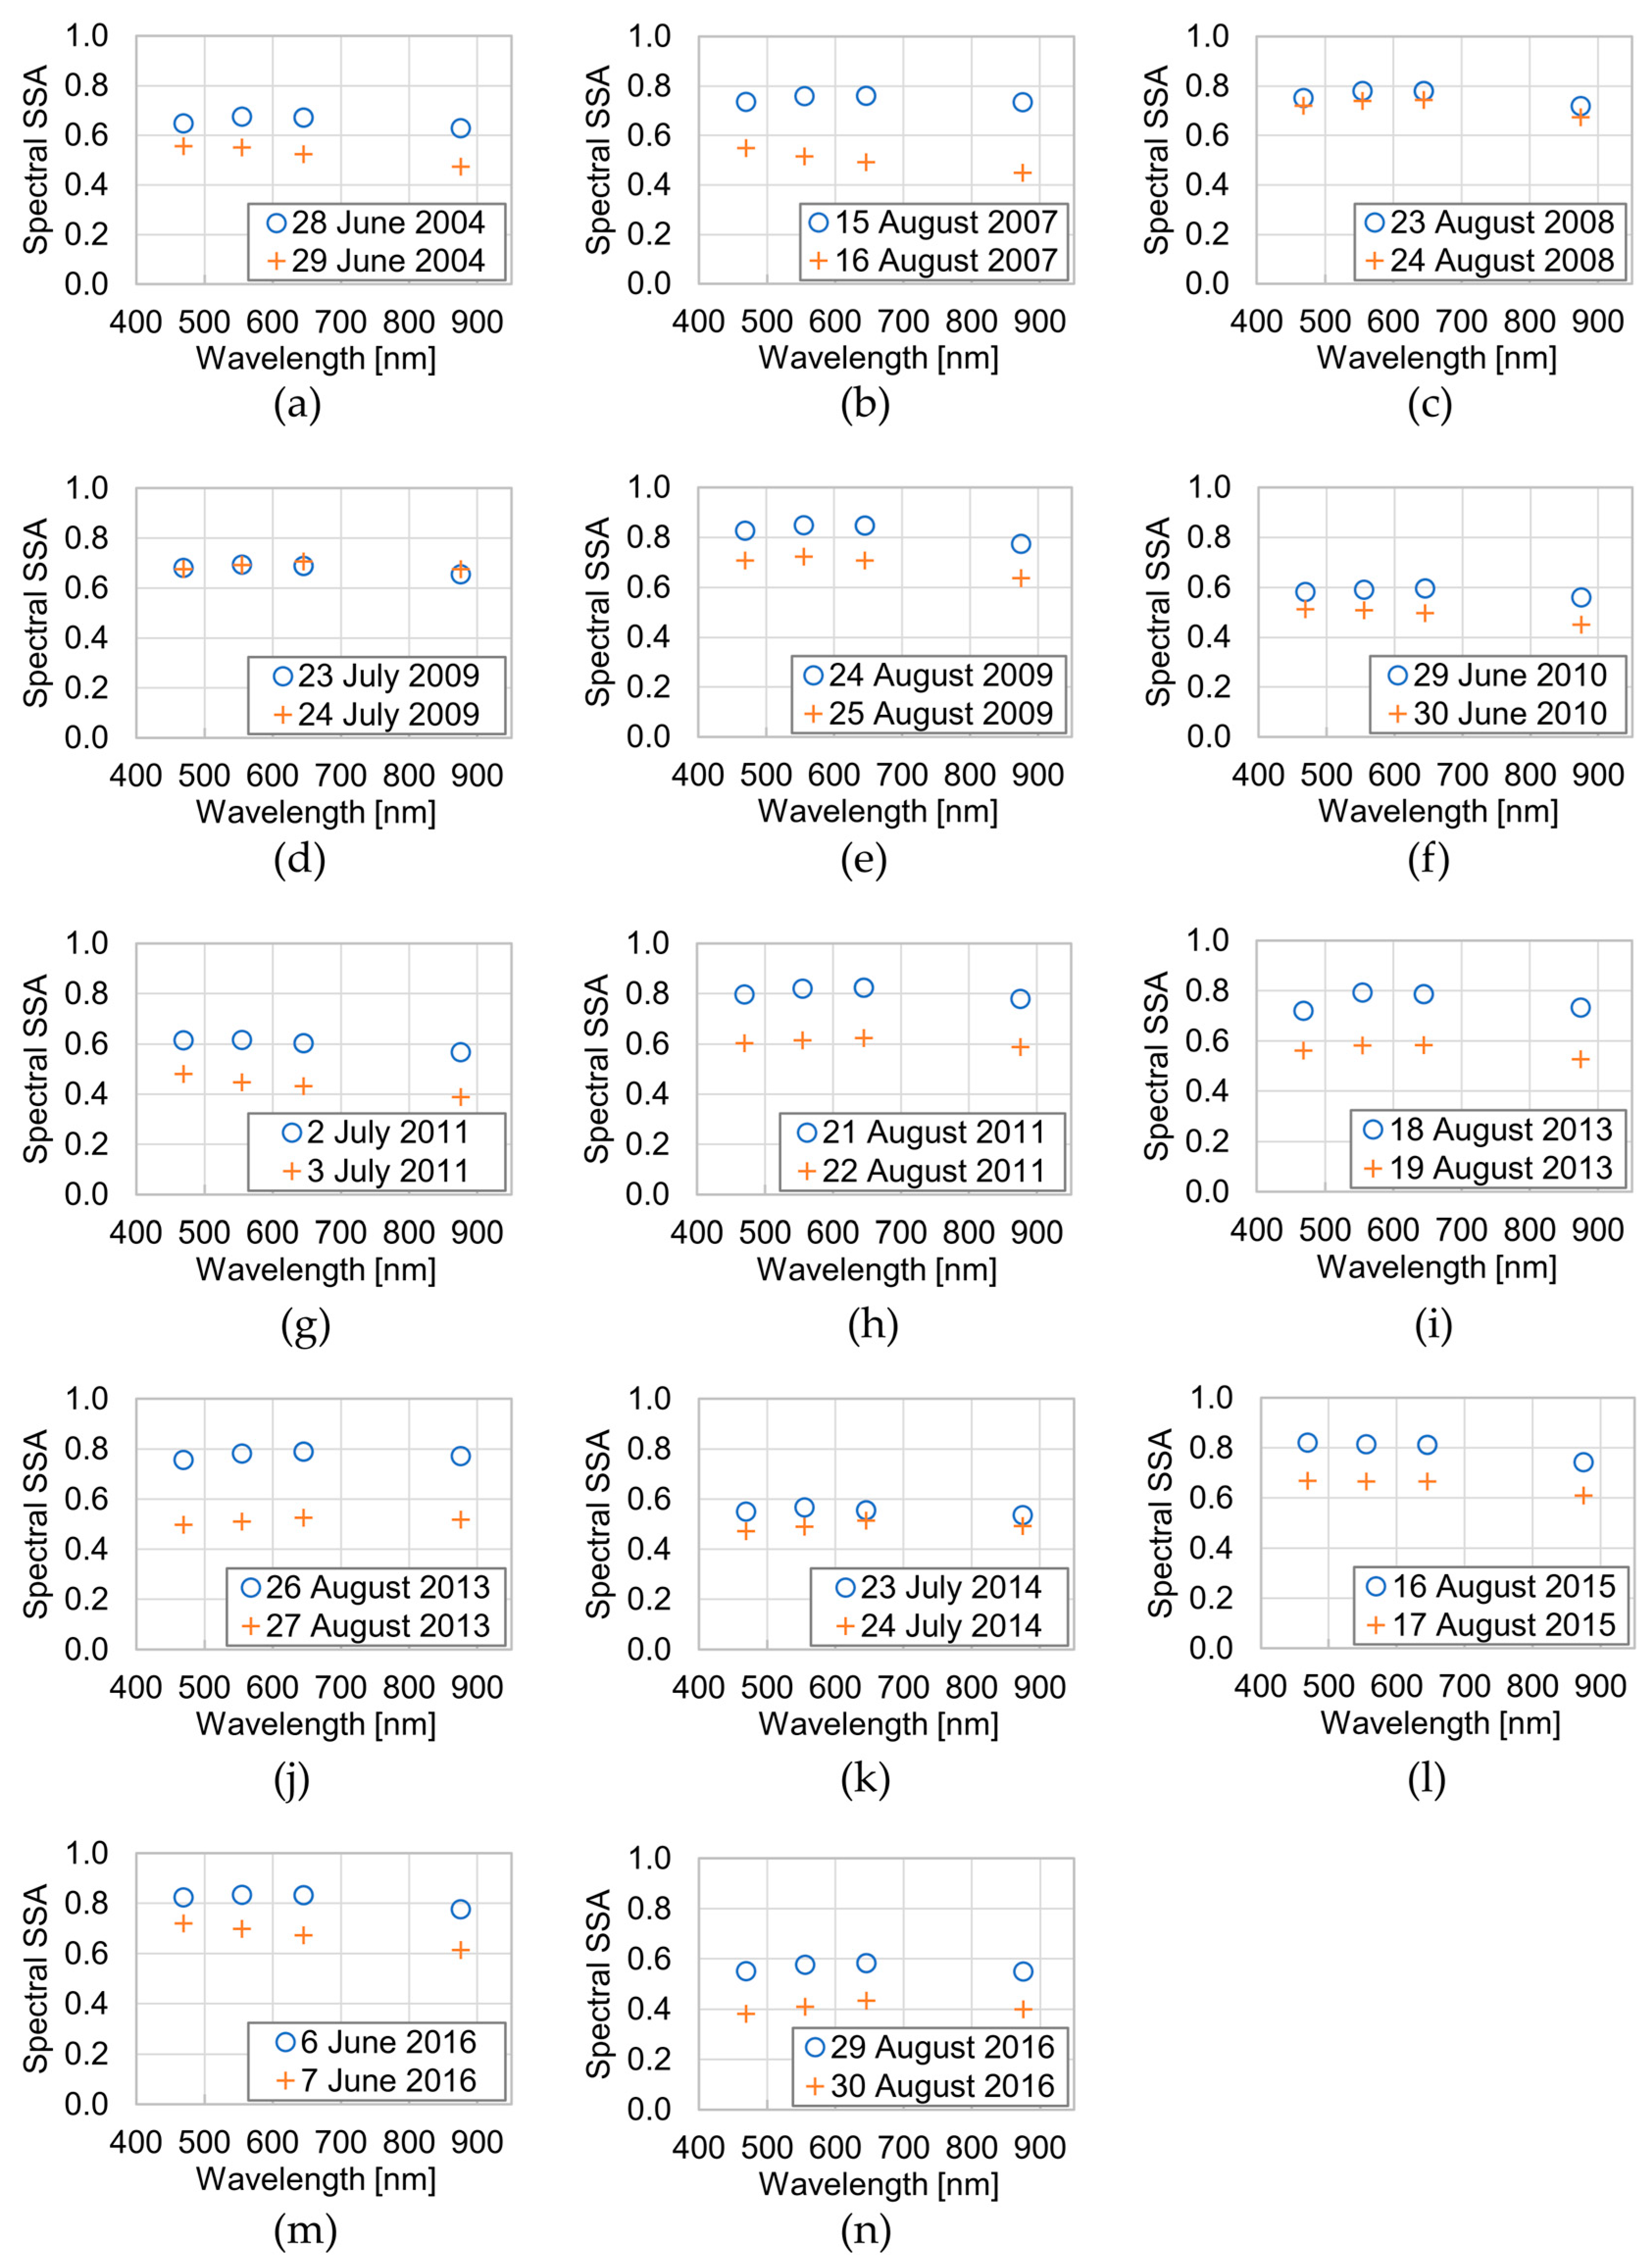
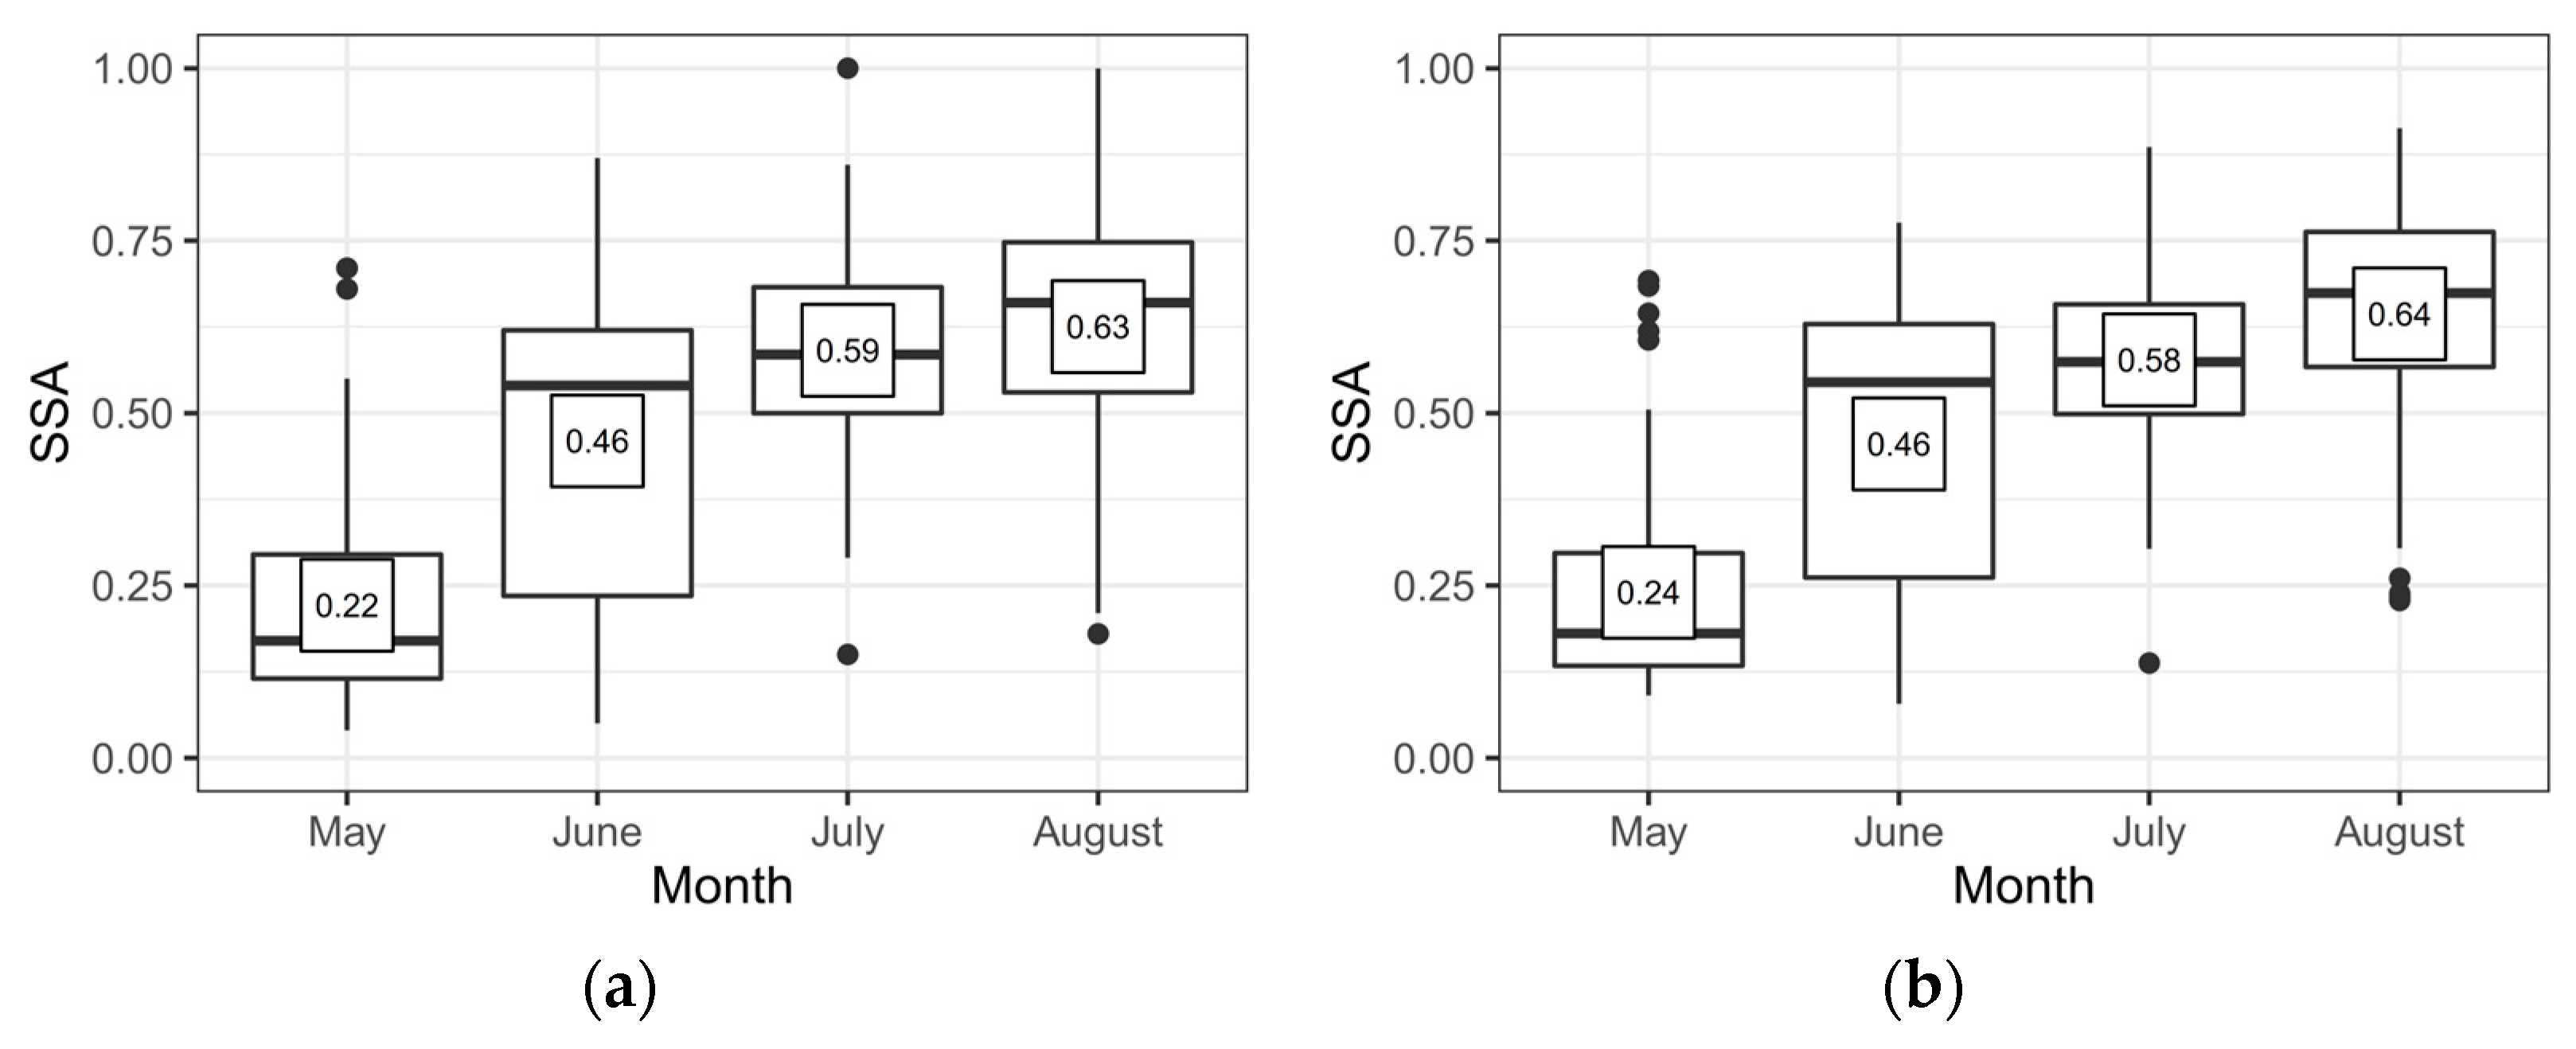
3.2. Temporal Analysis of SSA, D(λ), and RF during the 2004–2016 Period at NNTK-1

Figure 2 shows SSA values for both spectral ranges (Bbr and Ecr) for the pixel corresponding to NNTK-1. After filtering, 312 days (20% of the study period) with snow and clear-sky conditions were found. SSA exhibits a similar behavior for Bbr (Figure 2a) and the Ecr (Figure 2b), with minimum values during May that increase as the austral winter progresses. The distribution of values until the third quartile is similar for both spectral ranges, ranging between 0.12 and 0.35 in May, 0.25 and 0.67 in June, 0.50 and 0.70 in July, and 0.55 and 0.75 in August. The monthly mean values (shown as white boxes in Figure 2) are similar, with a maximum variation of 0.02 for the month of May.
To quantify the influence of LAPs on the radiative forcing, the estimation of D (Equation (5)) for both spectral ranges is necessary. D values are obtained using SSAfresh simulated by SNICAR during the austral winter between 2004 and 2016, considering clear-sky and the other conditions outlined in Section 2.3. Daily mean values of 0.863 ± 0.007 for the Bbr and 0.933 ± 0.007 for the Ecr were obtained (see Figure A3). Figure 3 shows estimates of D for the entire study period. For each month, all DEcr values (Figure 3b) are higher than DBbr (Figure 3a), including those below quartile 3 and the monthly mean values. DEcr values within quartile 1 and 3 (above q1 and below q3) are approximately 0.07 units higher for the month of July, whereas for the other months (May, June, and August), values in the Ecr are 0.04 units higher than in the Bbr. The monthly mean values of D (white boxes) in the Ecr are larger by 0.05 units for May and August (during the 2004 to 2016 period) compared to those for Bbr. The monthly mean DEcr values were also higher than DBbr for June and July, with differences of 0.07 and 0.08 units, respectively. We note that the differences between DEcr and DBbr increase if the analysis is conducted considering the daily mean values. The values of D in the Ecr were generally higher (as much as 0.25 units) than in the Bbr, with the exception of only 60 days within the 2004–2016 period (Figure 4).
Figure 5 shows the DIRF results for the Bbr and Ecr, which are consistent with the previous results for SSA and D. The DIRF reaches higher monthly mean values (white boxes) in May, with 8.02 and 0.27 MJ m−2 d−1 for the Bbr and Ecr, respectively, decreasing to 2.82 (Bbr) and 0.12 MJ m−2 d−1 (Ecr) in July. This scenario follows the trend observed for D between May and July (Figure 3); however, the monthly mean values of the DIRF in August increased to 3.58 (Bbr) and 0.13 (Ecr) MJ m−2 d−1, whereas D continued to decrease. This difference is explained by the fact that the ISR values reach minimum values during June and July and then start to increase (Figure A4).
In Figure 5, the DIRF values reach 13.21 MJ m−2 d−1 in the Bbr and 0.42 MJ m−2 d−1 in the Ecr. These DIRFEcr values are close to the lower limit of the DIRF values reported by Rowe et al. 2019 at the same location. Although these authors had used a different spectral range to analyze BC effects in snow (650–700 nm), the DIRF values are of the same order of magnitude (0.1–2.3 MJ m−2 d−1). A maximum instantaneous RF in the Bbr of 571.54 W m−2 was observed (29 August 2004), which is attributed to the melting of most of the snow at the corresponding pixel (snow cover value of 0.23). The instantaneous radiative forcing found in other regions around the world, such as the Himalaya or across the United States, using the 350–850 nm wavelength range, are comparable with the values obtained here for the Bbr (e.g., [28]).
To compare the DIRF values between the Ecr and Bbr spectral ranges, which have different magnitudes of received radiation (3% and 99%, as shown in Section 2.3.2), the DIRF values were normalized with respect to Bbr. This normalization allows for the determination of the percentage impact on Ecr in terms of the DIRF (DIRFEcr/Bbr), which can then be compared to the normalized radiation received in the Ecr (ISREcr/Bbr). From the monthly mean values in Figure 4, the normalized DIRFEcr/Bbr values are 3.42%, 3.74%, 4.22%, and 3.74% for the months of May June, July and August, respectively. Similarly, the normalized ISREcr/Bbr values are 3.17%, 3.22%, 3.23%, and 3.17% for the same months, respectively. As observed, there is a difference between the ISREcr/Bbr and DIRFEcr/Bbr ratios for each of the months evaluated, with higher ratios observed for DIRFEcr/Bbr. This suggests that the variations in SSA in the Ecr are higher and that this increase may be attributed to the presence of LAPs as these particles have a greater impact on the albedo at wavelengths between 841 and 876 nm (Ecr) than in the range of 300–2500 nm (Bbr), regardless of the total amount of received radiation [15,67,68].
With the purpose of following daily changes in SSA, consecutive days without liquid precipitations and with equal or less snow cover after the initial day were selected to make sure that local snowfall at Portillo did not occur (see Table 1). Figure 6 shows the variations in spectral SSA (for MODIS bands 1–4) for the periods that satisfy the former conditions throughout the study period. As expected, the calculations show that SSA decreases with time (from one day to the next) for most cases, which is consistent with the aging of snow and, size increase in snow grains and LAPs deposition, that occur as time progresses after the storm [9,69]. For some of the selected periods, such as 28–29 June 2004 (Figure 6a), 15–16 August 2007 (Figure 6b), 2 July 2016 (Figure 6g), and 6–7 June 2016 (Figure 6m), the spectral SSA values showed an evident decrease in the Ecr (841–876 nm) and the closest MODIS band (620–670 nm), larger than in the 459–479 nm and 545–565 nm bands. However, for the majority of days shown in Figure 6, the decrease in spectral SSA did not show much variation between bands (e.g., Figure 6c–e,h,l,m). Although there was one period where a slight increase in SSA was observed (Figure 6d), these data show a systematic decrease in spectral SSA for the visible wavelengths (MODIS bands 1–4) and particularly for the Ecr, which is usually associated with the presence of BC [19,70]. The fact that the other bands in the visible wavelengths may be associated with the presence of mineral dust [40] is noted.
Table 1 shows daily SSA variations for MODIS bands 1, 3, and 4 and for the Bbr and Ecr spectral ranges, as well as daily D and DIRF values for the Bbr and Ecr. Differences in SSA for bands 1, 3, 4, and Ecr until −0.3 are observed, with a larger difference observed for the second day (see Figure 6). The maximum daily rates of albedo decrease for the Bbr and Ecr were observed in August 2013 and August 2007, respectively. These reductions in albedo seem to be much higher than the values reported by previous studies in the Central Andes area [33,34,35]. Cereceda-Balic et al. 2018 reported a reduction of 0.08 units per day in the broadband albedo (SSABbr), resulting from the deposition of BC from vehicle emissions in the Portillo location. These differences are attributed to (i) differences in the magnitude of the contamination sources associated with the periods and locations considered in the studies and (ii) the fact that the remote sensing measurements consist of only one measurement, either at 10 a.m. or 2 p.m., whereas the in situ study used continuous data from a radiometer [33].
The results presented in Table 1 also show the differences in daily integrated radiative forcing (DIRF) for the two spectral ranges of interest (Ecr and Bbr) for two consecutive days. On the second day, the DIRFBbr shows a 60% increase compared with the average radiative forcing of the evaluated days, whereas the DIRFEcr exhibited an increase of approximately 50%. When examining the DIRFEcr/Bbr, the radiative forcing in the Ecr band represents on average 4.46% of the radiative forcing in the Bbr, with a maximum value of 12.21% (18 August 2013). On the other hand, the incident solar radiation ratio ISREcr/Bbr is on average 3.18% for the days considered in Table 1, with maximum values that reach 3.21% for 6–7 June 2016 and 3.14% for 18 August 2013. The above confirms previous results indicating that radiative forcing has a greater percentage impact on the narrow Ecr band than on the much broader Bbr.

4. Conclusions

The main objective of this study was to assess the changes in the radiative forcing associated with the presence of BC in a snow-covered region within the Chilean Central Andes. The central contributions of this paper arise from the data and model employed to estimate the changes in radiative forcing. First, high-quality in situ data from the NUNATAK-1 platform were used to validate the remote sensing MODIS SSA estimates and to calculate the radiative forcing. The NUNATAK-1 laboratory stands as one of the two facilities in the Chilean Central Andes equipped for the continuous monitoring of SSA and other environmental parameters that enable the study of snowmelt dynamics. The analyses show that the MOD10A1 product serves as a dependable source for obtaining SSA in the remote and frequently inaccessible area of the Central Andes from which radiative forcing estimates can be derived. Second, the MODDRFS model, originally developed by Painter et al. [40], evaluates the changes in radiative forcing using only the 350–876 nm spectral range. In this paper, the spectral range used to estimate the radiative forcing is extended to the 300–2500 nm range (Bbr) to include SSA data from remote sensing, in situ, and model (SNICAR) sources, with spectral ranges that do not match the original range developed by Painter et al. (2012). The 841–876 spectral range is evaluated to isolate the effects of BC on SSA, which is known to be a key factor influencing SSA variability in the study area.
The higher sensitivity of SSA in the Ecr (than in the Bbr) suggests that BC particles (and probably other LAPs) are present in the Andean snowpack, impacting snowpack radiation reflection. Overall, we found that the reductions in albedo are generally higher than those reported by previous studies in the area using in situ characterizations, which we attribute to differences in the magnitude of the atmospheric contamination that may exist in the different time periods used in the studies and the temporal resolution of the remote sensing data. Nonetheless, the remote sensing MODIS data proved to be a valuable tool for estimating the radiative forcing in regions that are typically inaccessible and improving our understanding of the variability in SSA, which is essential to accurately predict snowmelt and glacier retreat, which in turn control river discharge and freshwater availability in mountain regions.

Author Contributions

Conceptualization, L.F.-V., L.C., R.P.F., T.R.B.-O. and F.C.-B.; methodology, L.F.-V., L.C., R.P.F., T.R.B.-O. and D.P.-F.; software, L.F.-V., T.R.B.-O. and D.P.-F.; validation, L.F.-V., T.R.B.-O. and D.P.-F.; formal analysis, L.F.-V., L.C., R.P.F., T.R.B.-O. and D.P.-F.; investigation, L.F.-V., L.C., R.P.F., T.R.B.-O., D.P.-F. and F.C.-B.; resources, L.C., R.P.F., T.R.B.-O. and F.C.-B.; data curation, L.F.-V., T.R.B.-O. and D.P.-F.; writing—original draft preparation, L.F.-V., L.C., R.P.F., T.R.B.-O. and D.P.-F.; visualization, L.F.-V., T.R.B.-O. and D.P.-F.; supervision, L.C., R.P.F., T.R.B.-O. and F.C.-B.; funding acquisition, L.C., R.P.F., T.R.B.-O. and F.C.-B. All authors have read and agreed to the published version of the manuscript.

Funding

This research was funded by the National Research and Development Agency of Chile (ANID), namely, the ANID-ANILLO ACT210021, ANID-FONDECYT REGULAR 1221526, ANID-FONDECYT 11220482, ANID-FONDECYT 1231494, and ANID-FONDECYT 3230555 projects and the Centre for Environmental Technologies-Universidad Técnica Federico Santa María (CETAM-UTFSM).

Data Availability Statement

Data provided on request.

Acknowledgments

We would like to thank the MODIS-NASA, Solar Explorer (Explorador Solar), and NUNATAK-1 laboratory refuge (CETAM-USM) scientific teams and their associated personnel for the production of the data used in this research effort.

Conflicts of Interest

The authors declare no conflict of interest.

Abbreviations

BCBlack carbon
BbrBroadband range
CETAMCentre for Environmental Technologies
DDifference between SSAfresh and SSAeffective
DBbrD in the broadband range
DEcrD in the enclosed range
DIRFDaily integrated radiative forcing
DIRFBbrDIRF in the broadband range
DIRFEcrDIRF in the enclosed range
EcrEnclosed range
ISRIncident shortwave radiation
LAPsLight-absorbing particles
MODISModerate Resolution Imaging Spectroradiometer
M*D10A1Refers to both MOD10A1 and MYD10A1, remote sensing products used to estimate SSABbr
M*D09GARefers to both MOD09GA and MYD09GA, remote sensing products used to estimate SSAEcr
NUNATAK-1Refuge laboratory operated by CETAM
RFRadiative Forcing due to SSA decreasing
SESolar Explorer
SSASurface snow albedo
SSABbrSSA in the broadband range
SSAfreshSSA in fresh condition (pure and clean)
SSAeffectiveSSA effective estimated with M*D10A1 and M*D09GA
SSAin situSSA measured in situ by NUNATAK-1
UARBUpper Aconcagua River Basin

Appendix A

Figure A1. Example of spectral incident shortwave radiation (ISR) on the surface in the shortwave range model through SBDART for NNTK-1 at 10:00 a.m. of 5 May 2010. Black line represents the Solar Explorer ISR spectral range (up to the 4000 nm wavelength). In green, the spectral range for M*D10A1 (Bbr), and in gray, the spectral range for M*D09GA band 2 (Ecr). The radiation for Bbr and Ecr are equivalent to 99% and 3%, respectively, with regard to Solar Explorer radiation.
Water 15 03198 g0a1
Figure A2. Layout of (a) MODIS pixel where NNTK-1 is located. Also, shows image of (b) specific place where records were taken and around NNTK-1.
Water 15 03198 g0a2
Figure A3. Daily SSAfresh values simulated with SNICAR at 10 a.m. in the Bbr (black line) and Ecr (gray line), in function of the sza (green line) in NNTK-1, for the months of May to August 2007. Other years have a variation of 1.5 sza degrees, which indicates a variation of ±0.001 (included in the uncertainties mentioned in Section 3.2) in the SSA for Bbr and Ecr.
Water 15 03198 g0a3
Figure A4. Incident shortwave radiation (ISR) in the Bbr (a) and Ecr (b), grouped by month, for the 2004–2016 period. The bars represent 50% of the data, with the lower limit being quartile 1, the central limit being quartile 2 or the median, and the upper limit being quartile 3. Black points indicate outliers. Monthly mean values are shown for each month.
Water 15 03198 g0a4

References

  1. Beres, N.D.; Lapuerta, M.; Cereceda-Balic, F.; Moosmüller, H. Snow Surface Albedo Sensitivity to Black Carbon: Radiative Transfer Modelling. Atmosphere 2020, 11, 1077. [Google Scholar] [CrossRef]
  2. Barry, R.G.; Armstrong, R.; Callaghan, T.; Cherry, J.; Gearheard, S.; Nolin, A.; Russell, D.; Zöcler, C. Global Outlook for Ice & Snow; UNEP: Nairobi, Kenya, 2007. [Google Scholar]
  3. IPCC. Climate Change 2007: Impacts, Adaptation and Vulnerability: Contribution of Working Group II to the Fourth Assessment Report of the Intergovernmental Panel; IPCC: Geneva, Switzerland, 2007. [Google Scholar]
  4. IPCC. Climate Change 2013: The Physical Science Basis. Contribution of Working Group I to the Fifth Assessment Report of the Intergovernmental Panel on Climate Change; Cambridge University Press: Cambridge, UK; New York, NY, USA, 2013; p. 1535. [Google Scholar]
  5. Xu, L.; Dirmeyer, P. Snow—Atmosphere Coupling Strength. Part II: Albedo Effect Versus Hydrological Effect. J. Hydrometeorol. 2013, 14, 404–418. [Google Scholar] [CrossRef]
  6. Gardner, A.S.; Sharp, M.J. A Review of Snow and Ice Albedo and the Development of a New Physically Based Broadband Albedo Parameterization. J. Geophys. Res. Earth Surf. 2010, 115, F01009. [Google Scholar] [CrossRef]
  7. Beres, N.D.; Sengupta, D.; Samburova, V.; Khlystov, A.Y.; Moosmüller, H. Deposition of Brown Carbon onto Snow: Changes in Snow Optical and Radiative Properties. Atmos. Chem. Phys. 2020, 20, 6095–6114. [Google Scholar] [CrossRef]
  8. Warren, S.G.; Wiscombe, W.J. A Model for the Spectral Albedo of Snow. II: Snow Containing Atmospheric Aerosols. J. Atmos. Sci. 1980, 37, 2734–2745. [Google Scholar] [CrossRef]
  9. Hadley, O.L.; Kirchstetter, T.W. Black-Carbon Reduction of Snow Albedo. Nat. Clim. Chang. 2012, 2, 437–440. [Google Scholar] [CrossRef]
  10. He, C.; Takano, Y.; Liou, K.N.; Yang, P.; Li, Q.; Chen, F. Impact of Snow Grain Shape and Black Carbon-Snow Internal Mixing on Snow Optical Properties: Parameterizations for Climate Models. J. Clim. 2017, 30, 10019–10036. [Google Scholar] [CrossRef]
  11. Bond, T.C.; Doherty, S.J.; Fahey, D.W.; Forster, P.M.; Berntsen, T.; DeAngelo, B.J.; Flanner, M.G.; Ghan, S.; Kärcher, B.; Koch, D.; et al. Bounding the Role of Black Carbon in the Climate System: A Scientific Assessment. J. Geophys. Res. Atmos. 2013, 118, 5380–5552. [Google Scholar] [CrossRef]
  12. Skiles, S.M.K.; Painter, T. Daily Evolution in Dust and Black Carbon Content, Snow Grain Size, and Snow Albedo during Snowmelt, Rocky Mountains, Colorado. J. Glaciol. 2017, 63, 118–132. [Google Scholar] [CrossRef]
  13. Painter, T.H.; Skiles, S.M.; Deems, J.S.; Bryant, A.C.; Landry, C.C. Dust Radiative Forcing in Snow of the Upper Colorado River Basin: 1. A 6 Year Record of Energy Balance, Radiation, and Dust Concentrations. Water Resour. Res. 2012, 48, W07521. [Google Scholar] [CrossRef]
  14. Dang, C.; Warren, S.G.; Fu, Q.; Doherty, S.J.; Sturm, M.; Su, J. Measurements of Light-Absorbing Particles in Snow across the Arctic, North America, and China: Effects on Surface Albedo. J. Geophys. Res. Atmos. 2017, 122, 10149–10168. [Google Scholar] [CrossRef]
  15. Skiles, S.M.K.; Flanner, M.; Cook, J.M.; Dumont, M.; Painter, T.H. Radiative Forcing by Light-Absorbing Particles in Snow. Nat. Clim. Chang. 2018, 8, 964–971. [Google Scholar] [CrossRef]
  16. Hansen, J.; Nazarenko, L. Soot Climate Forcing via Snow and Ice Albedos. Proc. Natl. Acad. Sci. USA 2004, 101, 423–428. [Google Scholar] [CrossRef] [PubMed]
  17. Bryant, A.; Painter, T.H.; Deems, J.; Bender, S.M. Hydrologic Response to Dust Radiative Forcing in Snow in the Upper Colorado River Basin. Geophys. Res. Lett. 2013, 40, 3945–3949. [Google Scholar] [CrossRef]
  18. Jacobi, H.W.; Lim, S.; Ménégoz, M.; Ginot, P.; Laj, P.; Bonasoni, P.; Stocchi, P.; Marinoni, A.; Arnaud, Y. Black Carbon in Snow in the Upper Himalayan Khumbu Valley, Nepal: Observations and Modeling of the Impact on Snow Albedo, Melting, and Radiative Forcing. Cryosphere 2015, 9, 1685–1699. [Google Scholar] [CrossRef]
  19. Santra, S.; Verma, S.; Fujita, K.; Chakraborty, I.; Boucher, O.; Takemura, T.; Burkhart, J.F.; Matt, F.; Sharma, M. Simulations of Black Carbon (BC) Aerosol Impact over Hindu Kush Himalayan Sites: Validation, Sources, and Implications on Glacier Runoff. Atmos. Chem. Phys. 2019, 19, 2441–2460. [Google Scholar] [CrossRef]
  20. Petzold, A.; Ogren, J.A.; Fiebig, M.; Laj, P.; Li, S.M.; Baltensperger, U.; Holzer-Popp, T.; Kinne, S.; Pappalardo, G.; Sugimoto, N.; et al. Recommendations for Reporting Black Carbon Measurements. Atmos. Chem. Phys. 2013, 13, 8365–8379. [Google Scholar] [CrossRef]
  21. Lapuerta, M.; González-Correa, S.; Ballesteros, R.; Cereceda-Balic, F.; Moosmüller, H. Albedo Reduction for Snow Surfaces Contaminated with Soot Aerosols: Comparison of Experimental Results and Models. Aerosol Sci. Technol. 2022, 56, 847–858. [Google Scholar] [CrossRef]
  22. Lee, W.L.; Liou, K.N.; He, C.; Liang, H.C.; Wang, T.C.; Li, Q.; Liu, Z.; Yue, Q. Impact of Absorbing Aerosol Deposition on Snow Albedo Reduction over the Southern Tibetan Plateau Based on Satellite Observations. Theor. Appl. Climatol. 2017, 129, 1373–1382. [Google Scholar] [CrossRef]
  23. Zhong, X.; Kang, S.; Zhang, W.; Yang, J.; Li, X.; Zhang, Y.; Liu, Y.; Chen, P. Light-Absorbing Impurities in Snow Cover across Northern Xinjiang, China. J. Glaciol. 2019, 65, 940–956. [Google Scholar] [CrossRef]
  24. Saleh, R.; Robinson, E.S.; Tkacik, D.S.; Ahern, A.T.; Liu, S.; Aiken, A.C.; Sullivan, R.C.; Presto, A.A.; Dubey, M.K.; Yokelson, R.J.; et al. Brownness of Organics in Aerosols from Biomass Burning Linked to Their Black Carbon Content. Nat. Geosci. 2014, 7, 647–650. [Google Scholar] [CrossRef]
  25. Brown, H.; Wang, H.; Flanner, M.; Liu, X.; Singh, B.; Zhang, R.; Yang, Y.; Wu, M. Brown Carbon Fuel and Emission Source Attributions to Global Snow Darkening Effect. J. Adv. Model. Earth Syst. 2022, 14, e2021MS002768. [Google Scholar] [CrossRef]
  26. Moosmüller, H.; Chakrabarty, R.K.; Arnott, W.P. Aerosol Light Absorption and Its Measurement: A Review. J. Quant. Spectrosc. Radiat. Transf. 2009, 110, 844–878. [Google Scholar] [CrossRef]
  27. Cereceda-Balic, F.; Ruggeri, M.F.; Vidal, V.; Ruiz, L.; Fu, J.S. Understanding the Role of Anthropogenic Emissions in Glaciers Retreat in the Central Andes of Chile. Environ. Res. 2022, 214, 113756. [Google Scholar] [CrossRef] [PubMed]
  28. Painter, T.H.; Deems, J.S.; Belnap, J.; Hamlet, A.F.; Landry, C.C.; Udall, B. Response of Colorado River Runoff to Dust Radiative Forcing in Snow. Proc. Natl. Acad. Sci. USA 2010, 107, 17125–17130. [Google Scholar] [CrossRef] [PubMed]
  29. Di Mauro, B.; Garzonio, R.; Rossini, M.; Filippa, G.; Pogliotti, P.; Galvagno, M.; Morra Di Cella, U.; Migliavacca, M.; Baccolo, G.; Clemenza, M.; et al. Saharan Dust Events in the European Alps: Role in Snowmelt and Geochemical Characterization. Cryosphere 2019, 13, 1147–1165. [Google Scholar] [CrossRef]
  30. Shugar, D.H.; Jacquemart, M.; Shean, D.; Bhrushan, S.; Upadhyay, K.; Sattar, A.; Schwanghart, W.; McBride, S.; de Vires, M.V.W.; Mergili, M.; et al. A Massive Rock and Ice Avalanche Caused the 2021 Disaster at Chamoli, Indian Himalaya. Science 2021, 373, 300–373. [Google Scholar] [CrossRef]
  31. Bolaño-Ortiz, T.R.; Pascual-Flores, R.M.; López-Noreña, A.I.; Ruggeri, M.F.; Lakkis, S.G.; Fernández, R.P.; Puliafito, S.E. Assessment of Absorbing Aerosols on Austral Spring Snow Albedo Reduction by Several Basins in the Central Andes of Chile from Daily Satellite Observations (2000–2016) and a Case Study with the WRF-Chem Model. SN Appl. Sci. 2019, 1, 1352. [Google Scholar] [CrossRef]
  32. Cordero, R.R.; Sepúlveda, E.; Feron, S.; Wang, C.; Damiani, A.; Fernandoy, F.; Neshyba, S.; Rowe, P.M.; Asencio, V.; Carrasco, J.; et al. Black Carbon in the Southern Andean Snowpack. Environ. Res. Lett. 2022, 17, 044042. [Google Scholar] [CrossRef]
  33. Cereceda-Balic, F.; Vidal, V.; Moosmüller, H.; Lapuerta, M. Reduction of Snow Albedo from Vehicle Emissions at Portillo, Chile. Cold Reg. Sci. Technol. 2018, 146, 43–52. [Google Scholar] [CrossRef]
  34. Rowe, P.M.; Cordero, R.R.; Warren, S.G.; Stewart, E.; Doherty, S.J.; Pankow, A.; Schrempf, M.; Casassa, G.; Carrasco, J.; Pizarro, J.; et al. Black Carbon and Other Light-Absorbing Impurities in Snow in the Chilean Andes. Sci. Rep. 2019, 9, 4008. [Google Scholar] [CrossRef] [PubMed]
  35. Malmros, J.K.; Mernild, S.H.; Wilson, R.; Tagesson, T.; Fensholt, R. Snow Cover and Snow Albedo Changes in the Central Andes of Chile and Argentina from Daily MODIS Observations (2000–2016). Remote Sens. Environ. 2018, 209, 240–252. [Google Scholar] [CrossRef]
  36. Pu, W.; Cui, J.; Shi, T.; Zhang, X.; He, C.; Wang, X. The Remote Sensing of Radiative Forcing by Light-Absorbing Particles (LAPs) in Seasonal Snow over Northeastern China. Atmos. Chem. Phys. 2019, 19, 9949–9968. [Google Scholar] [CrossRef]
  37. Dowson, A.J.; Sirguey, P.; Cullen, N.J. Variability in Glacier Albedo and Links to Annual Mass Balance for the Gardens of Eden and Allah, Southern Alps, New Zealand. Cryosphere 2020, 14, 3425–3448. [Google Scholar] [CrossRef]
  38. Molina, L.T.; Andrade, M.; Baumgardner, D.; Casassa, G.; Dawidowski, L.; Garreaud, R.; Huneeus, N.; Lambert, F. Pollution and Its Impacts on the South American Cryosphere. Earth’s Futur. 2015, 3, 345–369. [Google Scholar] [CrossRef]
  39. Sharma, S.; Richard Leaitch, W.; Huang, L.; Veber, D.; Kolonjari, F.; Zhang, W.; Hanna, S.J.; Bertram, A.K.; Ogren, J.A. An Evaluation of Three Methods for Measuring Black Carbon in Alert, Canada. Atmos. Chem. Phys. 2017, 17, 15225–15243. [Google Scholar] [CrossRef]
  40. Painter, T.H.; Bryant, A.C.; Skiles, S.M. Radiative Forcing by Light Absorbing Impurities in Snow from MODIS Surface Reflectance Data. Geophys. Res. Lett. 2012, 39. [Google Scholar] [CrossRef]
  41. Miller, S.D.; Wang, F.; Burgess, A.B.; McKenzie Skiles, S.; Rogers, M.; Painter, T.H. Satellite-Based Estimation of Temporally Resolved Dust Radiative Forcing in Snow Cover. J. Hydrometeorol. 2016, 17, 1999–2011. [Google Scholar] [CrossRef]
  42. Bown, F.; Rivera, A.; Acuña, C. Recent Glacier Variations at the Aconcagua Basin, Central Chilean Andes. Ann. Glaciol. 2008, 48, 43–48. [Google Scholar] [CrossRef]
  43. Falvey, M.; Garreaud, R.D. Wintertime Precipitation Episodes in Central Chile: Associated Meteorological Conditions and Orographic Influences. J. Hydrometeorol. 2007, 8, 171–193. [Google Scholar] [CrossRef]
  44. Garreaud, R.D.; Boisier, J.P.; Rondanelli, R.; Montecinos, A.; Veloso-aguila, H.H.S.D. The Central Chile Mega Drought (2010–2018): A Climate Dynamics Perspective. Int. J. Clim. 2020, 40, 421–439. [Google Scholar] [CrossRef]
  45. Saavedra, F.A.; Kampf, S.K.; Fassnacht, S.R.; Sibold, J.S. Changes in Andes Snow Cover from MODIS Data, 2000–2016. Cryosphere 2018, 12, 1027–1046. [Google Scholar] [CrossRef]
  46. Dussaillant, I.; Berthier, E.; Brun, F.; Masiokas, M.; Hugonnet, R.; Favier, V.; Rabatel, A.; Pitte, P.; Ruiz, L. Two Decades of Glacier Mass Loss along the Andes. Nat. Geosci. 2019, 12, 802–808. [Google Scholar] [CrossRef]
  47. Cereceda-Balic, F.; Vidal, V.; Moosmüller, H. Long-Time Atmospheric Monitoring Data, Snow Albedo and BC in Snow Measured in Portillo, Los Andes Mountains, Chile. In Proceedings of the Air & Waste Management Association’s 112th Conference & Exhibition (ACE 2019), Quebec City, QC, Canada, 25–28 June 2019. [Google Scholar]
  48. Hall, D.K.; Riggs, G.A.; Salomonson, V.V.; DiGirolamo, N.E.; Bayr, K.J. MODIS Snow-Cover Products. Remote Sens. Environ. 2002, 83, 181–194. [Google Scholar] [CrossRef]
  49. Jing, J.; Wu, Y.; Tao, J.; Che, H.; Xia, X.; Zhang, X.; Yan, P.; Zhao, D.; Zhang, L. Observation and Analysis of Near-Surface Atmospheric Aerosol Optical Properties in Urban Beijing. Particuology 2015, 18, 144–154. [Google Scholar] [CrossRef]
  50. Molina, A.; Falvey, M.; Rondanelli, R. A Solar Radiation Database for Chile. Sci. Rep. 2017, 7, 14823. [Google Scholar] [CrossRef]
  51. Chou, M.-D.; Suarez, M. A Solar Radiation Parameterization (CLIRAD-SW) for Atmospheric Studies. NASA Tech. Memo 1999, 40, 10460. [Google Scholar]
  52. Kopp, G.; Lawrence, G.; Rottman, G. The Total Irradiance Monitor (TIM): Science Results. Sol. Phys. 2005, 230, 129–139. [Google Scholar] [CrossRef]
  53. Van Zyl, J.J. The Shuttle Radar Topography Mission (SRTM): A Breakthrough in Remote Sensing of Topography. Acta Astronaut. 2001, 48, 559–565. [Google Scholar] [CrossRef]
  54. Mukul, M.; Srivastava, V.; Jade, S.; Mukul, M. Uncertainties in the Shuttle Radar Topography Mission (SRTM) Heights: Insights from the Indian Himalaya and Peninsula. Sci. Rep. 2017, 7, 41672. [Google Scholar] [CrossRef]
  55. Hillger, D.W.; Schmit, T.J. Observing Systems: The GOES-13 Science Test: A Synopsis. Bull. Am. Meteorol. Soc. 2009, 90, 592–597. [Google Scholar] [CrossRef]
  56. Flanner, M.G.; Arnheim, J.B.; Cook, J.M.; Dang, C.; He, C.; Huang, X.; Singh, D.; Skiles, S.M.; Whicker, C.A.; Zender, C.S. SNICAR-ADv3: A Community Tool for Modeling Spectral Snow Albedo. Geosci. Model Dev. 2021, 14, 7673–7704. [Google Scholar] [CrossRef]
  57. Ricchiazzi, P.; Yang, S.; Gautier, C.; Sowle, D. SBDART: A Research and Teaching Software Tool for Plane-Parallel Radiative Transfer in the Earth’s Atmosphere. Bull. Am. Meteorol. Soc. 1998, 79, 2101–2114. [Google Scholar] [CrossRef]
  58. Obregón, M.A.; Serrano, A.; Costa, M.J.; Silva, A.M. Validation of LibRadtran and SBDART Models under Different Aerosol Conditions. IOP Conf. Ser. Earth Environ. Sci. 2015, 28, 012010. [Google Scholar] [CrossRef]
  59. Fu, Y.; Zhu, J.; Yang, Y.; Yuan, R.; Liu, G.; Xian, T.; Liu, P. Grid-Cell Aerosol Direct Shortwave Radiative Forcing Calculated Using the SBDART Model with MODIS and AERONET Observations: An Application in Winter and Summer in Eastern China. Adv. Atmos. Sci. 2017, 34, 952–964. [Google Scholar] [CrossRef]
  60. Flanner, M.G.; Zender, C.S.; Randerson, J.T.; Rasch, P.J. Present-Day Climate Forcing and Response from Black Carbon in Snow. J. Geophys. Res. 2007, 112, D11202. [Google Scholar] [CrossRef]
  61. Dang, C.; Fu, Q.; Warren, S.G. Effect of Snow Grain Shape on Snow Albedo. J. Atmos. Sci. 2016, 73, 3573–3583. [Google Scholar] [CrossRef]
  62. Cornwell, E.; Molotch, N.P.; McPhee, J. Spatio-Temporal Variability of Snow Water Equivalent in the Extra-Tropical Andes Cordillera from Distributed Energy Balance Modeling and Remotely Sensed Snow Cover. Hydrol. Earth Syst. Sci. 2016, 20, 411–430. [Google Scholar] [CrossRef]
  63. Picard, G.; Libois, Q.; Arnaud, L. Refinement of the Ice Absorption Spectrum in the Visible Using Radiance Profile Measurements in Antarctic Snow. Cryosphere 2016, 10, 2655–2672. [Google Scholar] [CrossRef]
  64. Chen, A.; Li, W.; Li, W.; Liu, X. An observational study of snow aging and the seasonal variation of snow albedo by using data from Col de Porte, France. Chin. Sci. Bull. 2014, 59, 4881–4889. [Google Scholar] [CrossRef]
  65. Zhou, X.; Li, S.; Stamnes, K. Effects of vertical inhomogeneity on snow spectral albedo and its implication for optical remote sensing of snow. J. Geophys. Res. 2003, 108, 4738. [Google Scholar] [CrossRef]
  66. Wiscombe, W.J.; Warren, S.G. A Model for the Spectral Albedo of Snow. I: Pure Snow. J. Atmos. Sci. 1980, 37, 2712–2733. [Google Scholar] [CrossRef]
  67. Cereceda-Balic, F.; Vidal, V.; Ruggeri, M.F.; González, H.E. Black Carbon Pollution in Snow and Its Impact on Albedo near the Chilean Stations on the Antarctic Peninsula: First Results. Sci. Total Environ. 2020, 743, 140801. [Google Scholar] [CrossRef] [PubMed]
  68. Cui, J.; Shi, T.; Zhou, Y.; Wu, D.; Wang, X.; Pu, W. Satellite-Based Radiative Forcing by Light-Absorbing Particles in Snow across the Northern Hemisphere. Atmos. Chem. Phys. 2021, 21, 269–288. [Google Scholar] [CrossRef]
  69. Warren, S.G. Optical Properties of Snow. Rev. Geophys. 1982, 20, 67–89. [Google Scholar] [CrossRef]
  70. Panicker, A.S.; Sandeep, K.; Gautam, A.S.; Trimbake, H.K.; Nainwal, H.C.; Beig, G.; Bisht, D.S.; Das, S. Black Carbon over a Central Himalayan Glacier (Satopanth): Pathways and Direct Radiative Impacts. Sci. Total Environ. 2021, 766, 144242. [Google Scholar] [CrossRef]
Figure 1. Location of the study area (UARB), indicating the location of meteorological stations, mining activities, and the main traffic route (CH60). Color scale denotes terrain elevation (meters above sea level).
Water 15 03198 g001
Figure 2. SSA values in the Bbr (a) and Ecr (b), grouped by month in NNTK-1′s location, for the 2004–2016 period. The bars represent 50% of the data, with the lower limit being quartile 1, the central limit being quartile 2 or the median, and the upper limit being quartile 3. Black points indicate outliers. The chart also displays the monthly mean value for each month.
Water 15 03198 g002
Figure 3. D values in the Bbr (a) and Ecr (b), grouped by month in NNTK-1′s location, for the 2004–2016 period. The bars represent 50% of the data, with the lower limit being quartile 1, the central limit being quartile 2 or the median, and the upper limit being quartile 3. Black points indicate outliers. Monthly mean values for each month are included.
Water 15 03198 g003
Figure 4. Difference between D in the broadband range (Bbr) and enclosed range (Ecr) for the 2004–2016 period (black circles).
Water 15 03198 g004
Figure 5. DIRF values in the Bbr (a) and Ecr (b), grouped by month in NNTK-1′s location, for the 2004–2016 period. The bars represent 50% of the data, with the lower limit being quartile 1, the central limit being quartile 2 or the median, and the upper limit being quartile 3. Black points indicate outliers. Monthly mean values are indicated for each month.
Water 15 03198 g005
Figure 6. SSA spectral variations for MODIS bands (1–4) for 14 days of the study period are displayed in sub-figures (an). Blue circles and orange crosses represent consecutive days.
Water 15 03198 g006
Table 1. Snow cover (SC), surface snow albedo (SSA), difference between clean and measured SSA (D), and daily integrated radiative forcing (DIRF) values for Bbr and Ecr at the NNTK-1. SSA and D values are dimensionless. MODIS bands are organized by smaller to higher wavelength range values: 459–479 nm (band 3), 545–565 nm (band 4), 620–670 nm (band 1), and 841–876 nm (Ecr).
DateSC [%]SSA [-]D [-]DIRF [MJ m−2 d−1]
Bbr Band 3Band 4Band 1EcrBbrEcrBbrEcr
28 June 2004820.620.650.680.670.630.250.312.460.10
29 June 2004800.590.560.550.520.470.280.462.530.14
15 August 2007700.650.740.760.760.740.210.203.320.10
16 August 2007680.530.550.520.490.450.330.485.360.25
23 August 2008850.720.750.780.780.720.140.212.610.12
24 August 2008840.580.720.740.740.670.280.265.170.15
23 July 2009760.700.680.690.690.660.170.282.080.11
24 July 2009690.560.680.690.710.680.310.264.090.11
24 August 2009840.750.830.850.850.770.110.160.990.04
25 August 2009810.540.710.720.710.640.320.305.790.17
29 June 2010800.550.580.590.590.560.320.383.190.12
30 June 2010740.550.510.510.500.450.320.493.190.16
2 July 2011790.570.620.620.600.570.300.372.700.11
3 July 2011760.490.480.450.430.390.380.553.640.17
21 August 2011760.740.800.820.820.780.120.152.210.09
22 August 2011720.480.600.610.620.590.380.347.070.20
18 August 2013850.810.720.790.790.730.050.200.900.11
19 August 2013820.510.560.580.580.530.350.406.010.22
26 August 2013750.700.760.780.790.770.160.163.030.09
27 August 2013690.420.500.510.530.520.440.418.310.24
23 July 2014770.580.550.570.560.540.290.403.210.14
24 July 2014740.420.470.490.510.490.450.455.270.17
16 August 2015830.730.820.810.810.740.130.192.190.10
17 August 2015780.530.670.670.660.610.330.325.730.17
6 June 2016750.800.830.830.830.780.070.160.690.05
7 June 2016760.760.720.700.670.610.110.321.110.11
29 August 2016750.540.550.580.580.550.320.386.240.23
30 August 2016750.320.380.410.430.400.540.537.420.23
Disclaimer/Publisher’s Note: The statements, opinions and data contained in all publications are solely those of the individual author(s) and contributor(s) and not of MDPI and/or the editor(s). MDPI and/or the editor(s) disclaim responsibility for any injury to people or property resulting from any ideas, methods, instructions or products referred to in the content.

