


Bentonite-Clay/CNT-Based Nano Adsorbent for Textile Wastewater Treatment: Optimization of Process Parameters

 , ,
, , 
Abstract
:1. Introduction
2. Materials and Methods
2.1. Materials
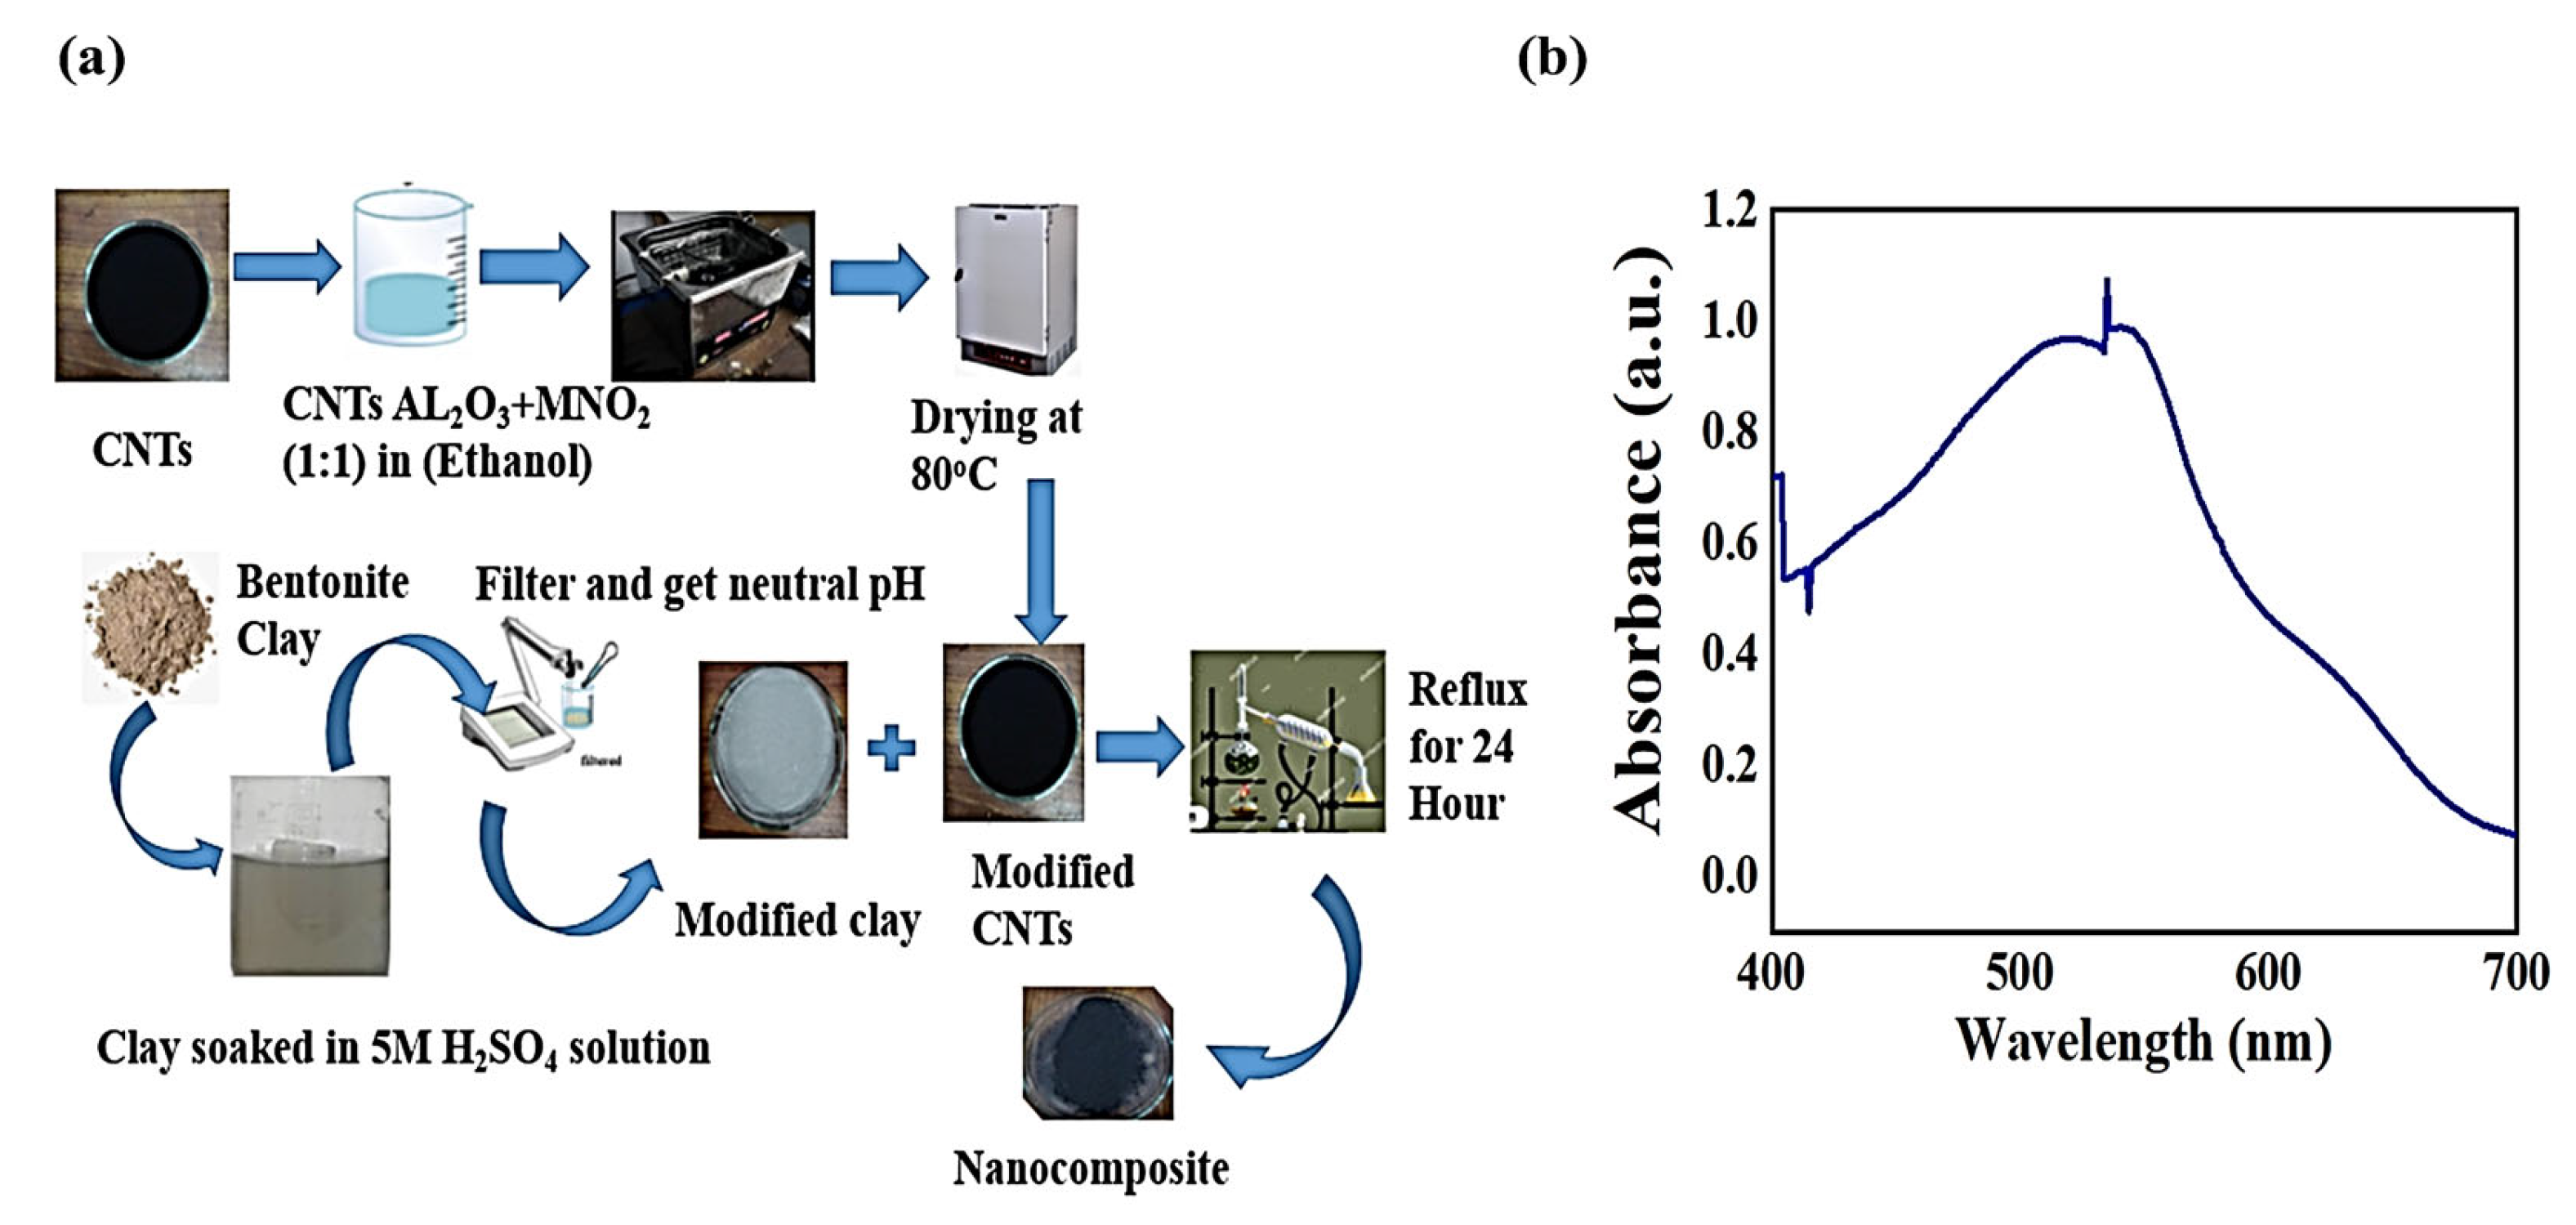
2.2. Adsorbent Preparation
2.2.1. Fabrication of MWCNTs with Bi-Metallic Oxide
2.2.2. Acid Activation of Bentonite Clay
2.2.3. Synthesis of Bentonite/CNT-Al2O3-MnO2
2.3. Design of Experiments
2.4. Response Surface Methodolofy for the Dye Removal from Textile Wastewater
Central Composite Design (CCD)
2.5. Characterization of Adsorbent
3. Results
3.1. Fourier-Transform Infrared Spectroscopy
3.2. ANOVA for Experimental Results Using CCD
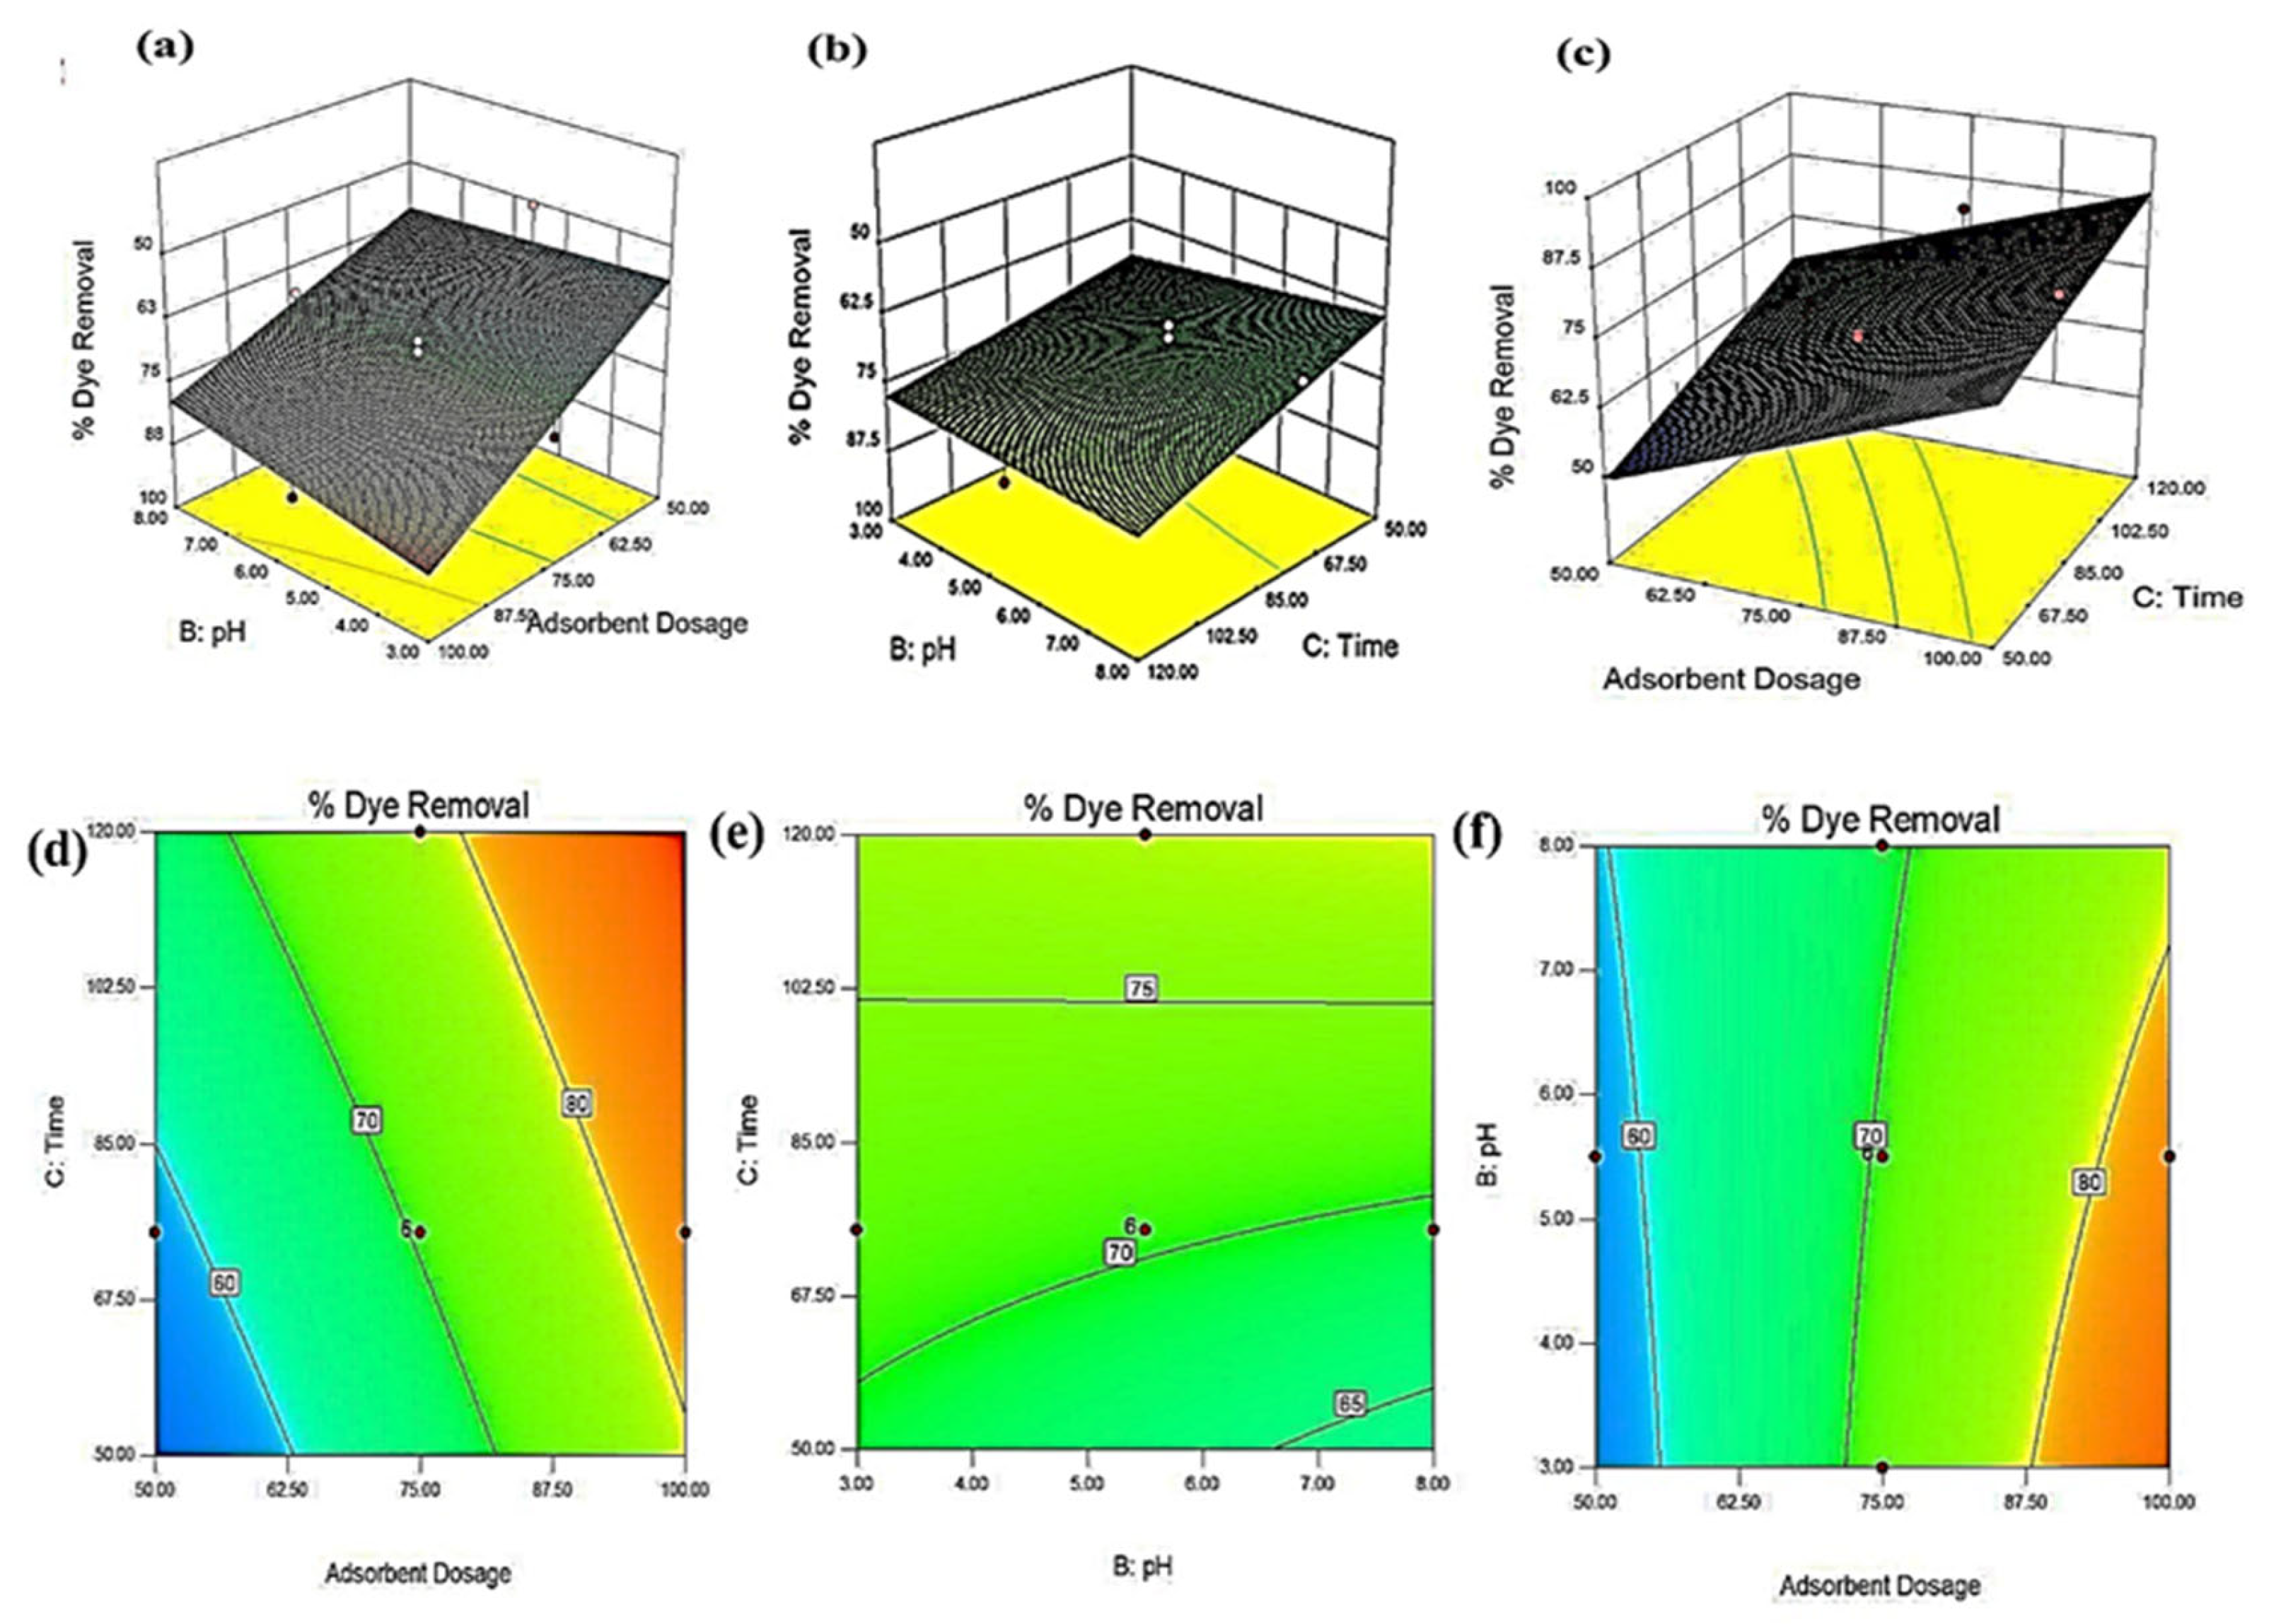
3.3. Optimization of Process Parameters
3.4. Model Validation
3.5. Process Modelling
Adsorption Isotherms
3.6. Adsorption Kinetics
3.7. Thermodynamics Study
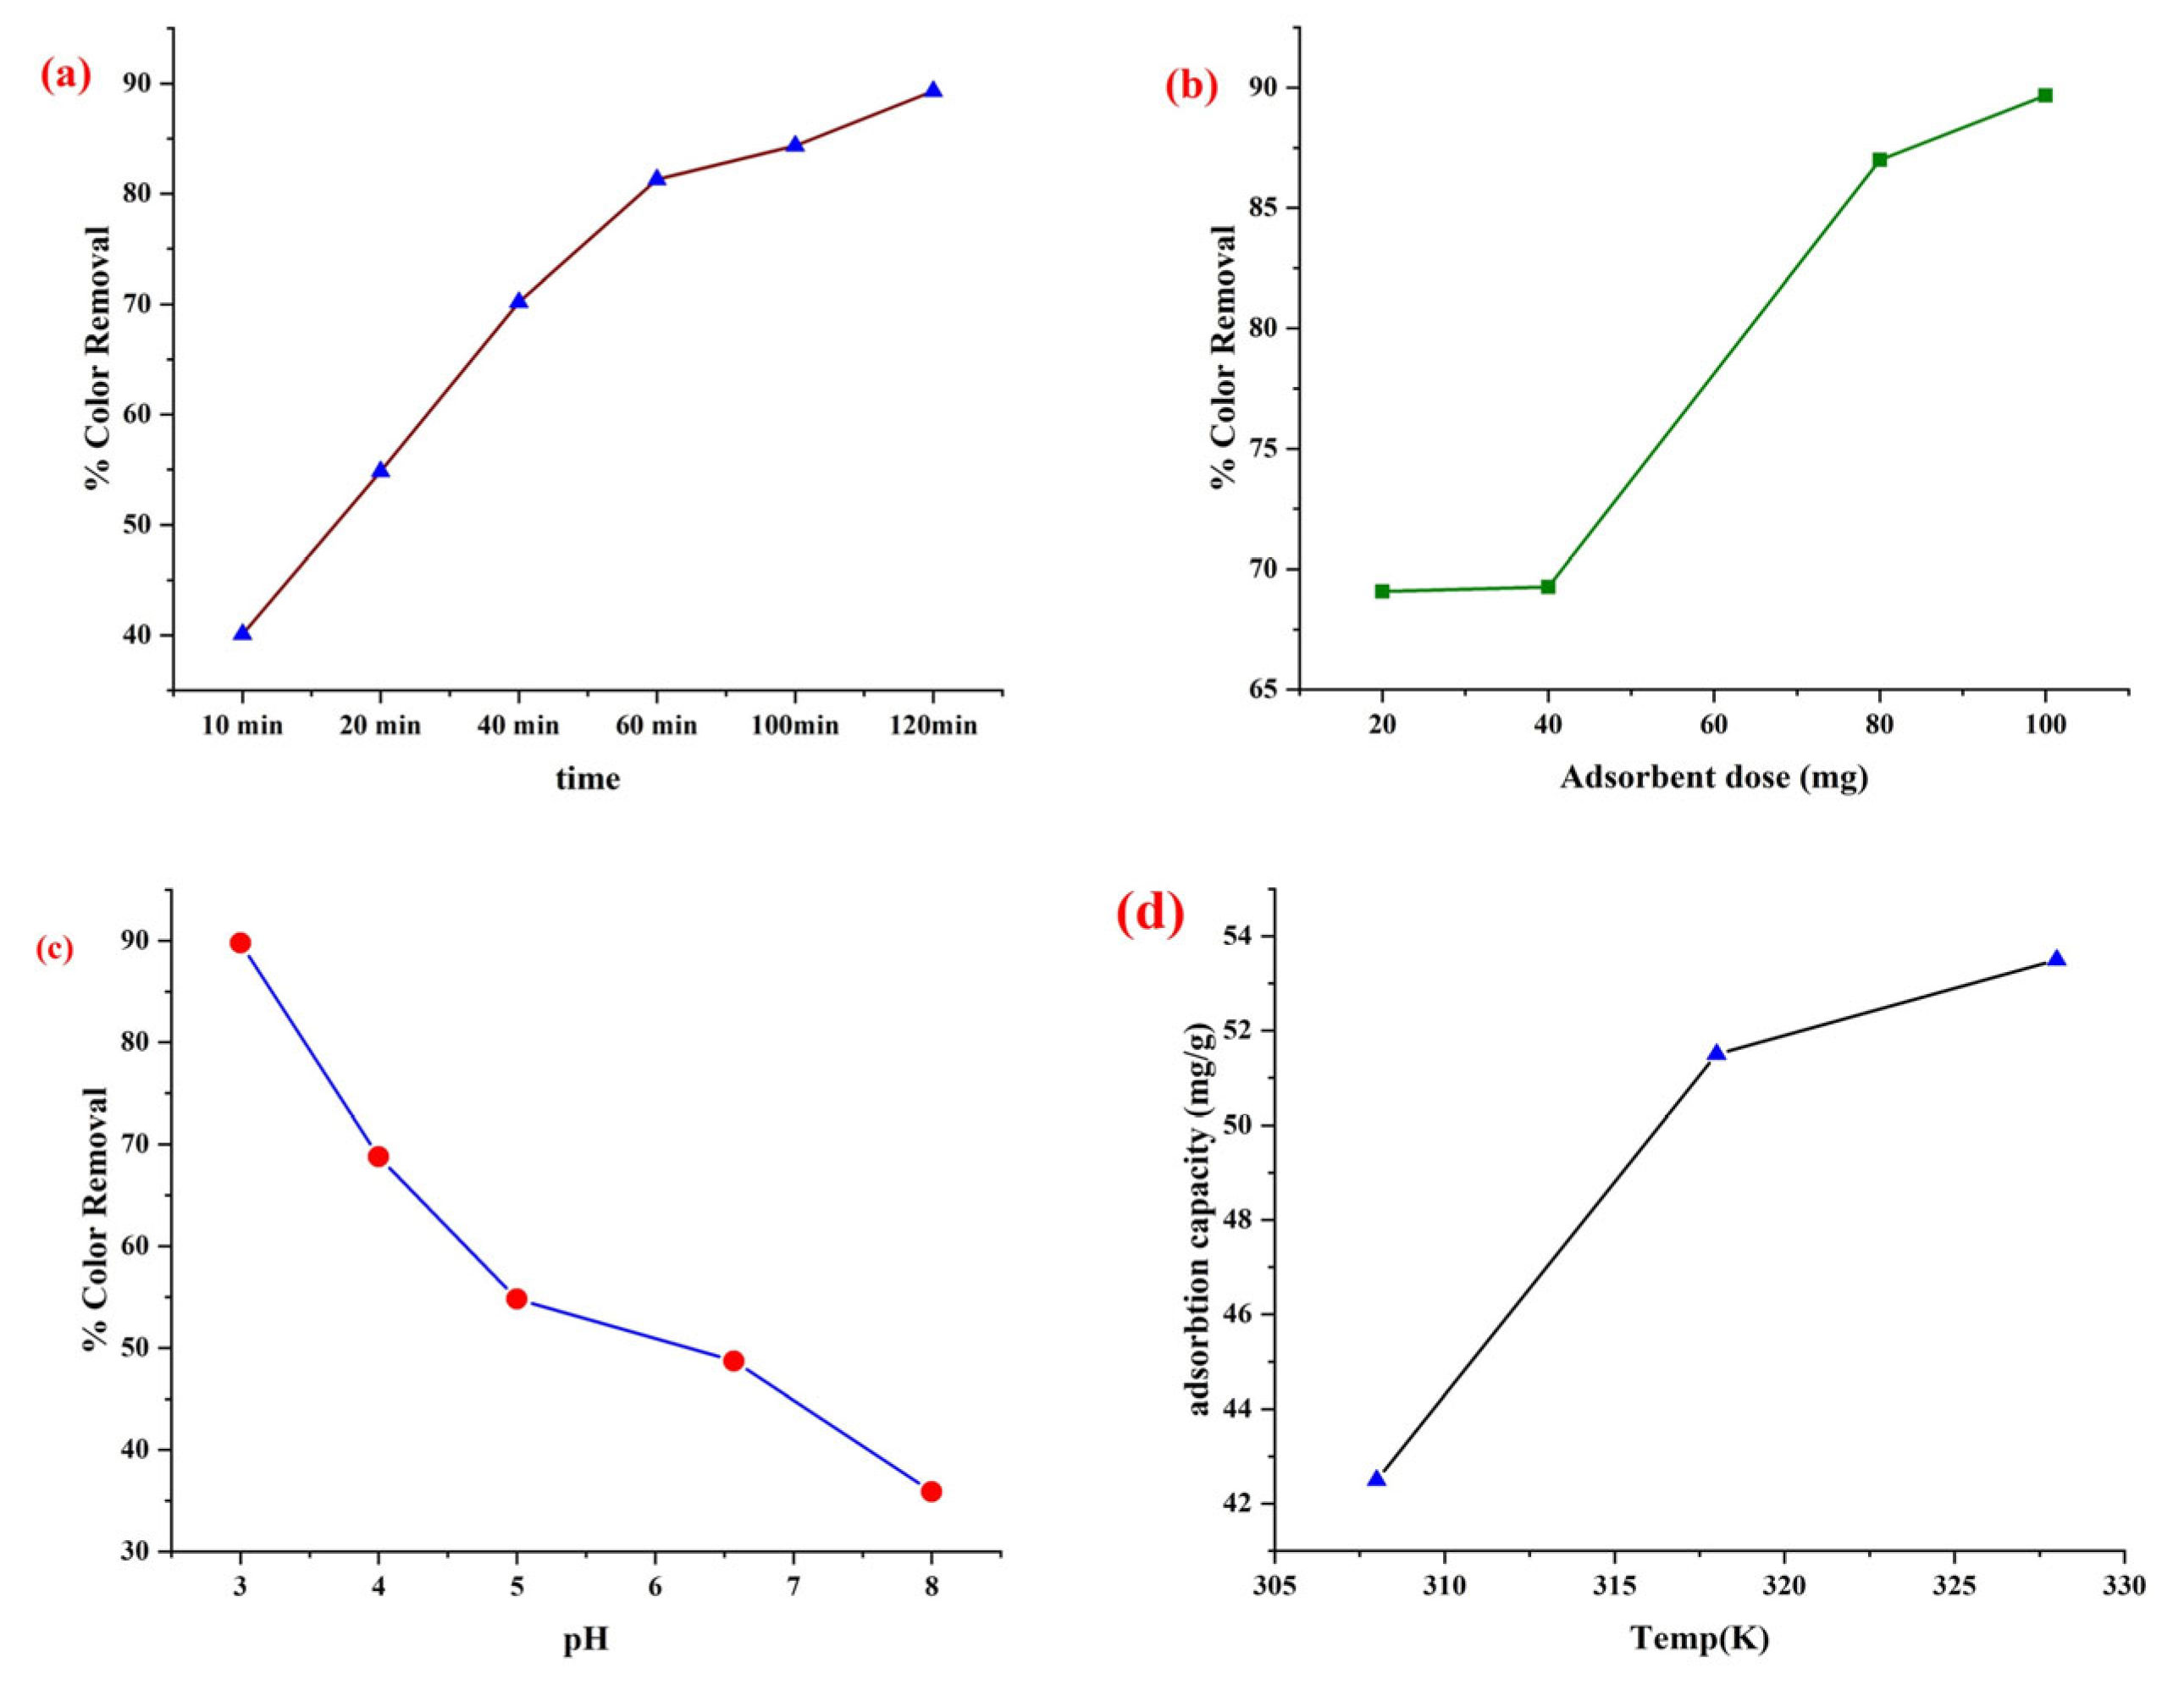
3.8. Effect of Process Variables on Percentage Color Removal
3.8.1. Effect of Time
3.8.2. Effect of Adsorbent Dose
3.8.3. Effect of pH
3.8.4. Effect of Temperature
3.9. Cost Estimation
3.10. Comparison with Other Adsorbents
4. Conclusions
Supplementary Materials
Author Contributions
Funding
Data Availability Statement
Acknowledgments
Conflicts of Interest
References
- Samsami, S.; Mohamadi, M.; Sarrafzadeh, M.H.; Rene, E.R.; Firoozbahr, M. Recent advances in the treatment of dye-containing wastewater from textile industries: Overview and perspectives. Process. Saf. Environ. Prot. 2020, 143, 138–163. [Google Scholar] [CrossRef]
- Javed, F.; Ahmad, S.W.; Ikhlaq, A.; Rehman, A.; Saleem, F. Elimination of basic blue 9 by electrocoagulation coupled with pelletized natural dead leaves (Sapindus mukorossi) biosorption. Int. J. Phytoremediat. 2020, 23, 462–473. [Google Scholar] [CrossRef] [PubMed]
- Yu, J.; Zou, A.; He, W.; Liu, B. Adsorption of Mixed Dye System with Cetyltrimethylammonium Bromide Modified. Water 2020, 12, 981–995. [Google Scholar] [CrossRef]
- Composite, U.C.I.; Obulapuram, P.K.; Arfin, T.; Mohammad, F.; Khiste, S.K.; Chavali, M. Studies towards the Removal of Reactive Orange 16 Dye. Polymers 2021, 13, 3490. [Google Scholar]
- Campos, C.J.A.; Avant, J.; Lowther, J.; Till, D.; Lees, D.N. Human norovirus in untreated sewage and effluents from primary, secondary and tertiary treatment processes. Water Res. 2016, 103, 224–232. [Google Scholar] [CrossRef]
- Chen, M.; Bao, C.; Hu, D.; Jin, X.; Huang, Q. Facile and low-cost fabrication of ZnO/biochar nanocomposites from jute fibers for efficient and stable photodegradation of methylene blue dye. J. Anal. Appl. Pyrolysis 2019, 139, 319–332. [Google Scholar] [CrossRef]
- Kotia, A.; Yadav, A.; Raj, T.R.; Keischgens, M.G.; Rathore, H.; Sarris, I.E. Carbon Nanoparticles as Sources for a Cost-Effective Water Purification Method: A Comprehensive Review. Fluids 2020, 5, 230. [Google Scholar] [CrossRef]
- Han, D.; Yan, G.; Wang, C. Influence of multi-walled carbon nanotubes (MWCNTs) content on metal friction and wear in thermally cracked carbon black (CBp) formulation system during mixing. Polym. Test. 2022, 113, 107674. [Google Scholar] [CrossRef]
- Yadav, V.B.; Gadi, R.; Kalra, S. Adsorption of lead on clay-CNT nanocomposite in aqueous media by UV-Vis-spectrophotometer: Kinetics and thermodynamic studies. Emergent Mater. 2019, 2, 441–451. [Google Scholar] [CrossRef]
- Ihsanullah; Patel, F.; Khraisheh, M.; Atieh, M.A.; Laoui, T. Novel aluminum oxide-impregnated carbon nanotube membrane for the removal of cadmium from aqueous solution. Materials 2017, 10, 1144. [Google Scholar] [CrossRef]
- Abualnaja, K.M.; Alprol, A.E.; Ashour, M.; Mansour, A.T. Influencing multi-walled carbon nanotubes for the removal of ismate violet 2r dye from wastewater: Isotherm, kinetics, and thermodynamic studies. Appl. Sci. 2021, 11, 4786. [Google Scholar] [CrossRef]
- Shabaan, O.A.; Jahin, H.S.; Mohamed, G.G. Removal of anionic and cationic dyes from wastewater by adsorption using multiwall carbon nanotubes. Arab. J. Chem. 2020, 13, 4797–4810. [Google Scholar] [CrossRef]
- Zhao, B.; Zhao, Y.; Liu, P.; Men, Y.L.; Pan, Y.X. Boosting the adsorption and removal of dye from water by COOH-functionalized carbon nanotubes. Green Chem. Eng. 2023, 4, 88–98. [Google Scholar] [CrossRef]
- Saxena, M.; Lochab, A.; Saxena, R. Asparagine functionalized MWCNTs for adsorptive removal of hazardous cationic dyes: Exploring kinetics, isotherm and mechanism. Surf. Interfaces 2021, 25, 101187. [Google Scholar] [CrossRef]
- Gul, A.; Khaligh, N.G.; Julkapli, N.M. Surface modification of Carbon-Based Nanoadsorbents for the Advanced Wastewater Treatment. J. Mol. Struct. 2021, 1235, 130148. [Google Scholar] [CrossRef]
- Ewis, D.; Ba-Abbad, M.M.; Benamor, A.; El-Naas, M.H. Adsorption of organic water pollutants by clays and clay minerals composites: A comprehensive review. Appl. Clay Sci. 2022, 229, 106686. [Google Scholar] [CrossRef]
- Manna, S.; Das, P.; Basak, P.; Sharma, A.K.; Singh, V.K.; Patel, R.K.; Pandey, J.K.; Ashokkumar, V.; Pugazhendhi, A. Separation of pollutants from aqueous solution using nanoclay and its nanocomposites: A review. Chemosphere 2021, 280, 130961. [Google Scholar] [CrossRef]
- Jawad, A.H.; Saber, S.E.M.; Abdulhameed, A.S.; Farhan, A.M.; ALOthman, Z.A.; Wilson, L.D. Characterization and applicability of the natural Iraqi bentonite clay for toxic cationic dye removal: Adsorption kinetic and isotherm study. J. King Saud Univ. Sci. 2023, 35, 102630. [Google Scholar] [CrossRef]
- Zhang, H.; Zhou, J.; Muhammad, Y.; Tang, R.; Liu, K.; Zhu, Y.; Tong, Z. Citric acid modified bentonite for congo red adsorption. Front. Mater. 2019, 6, 5. [Google Scholar] [CrossRef]
- Gharsalli, A.; Bagane, M.; Porte, C.; Havet, J.L.; Ammar, S. Response Surface Optimization and Modeling of Ammonium Chloride Activation Process of Bentonite. Courrier Savoir 2017, 22, 61–68. [Google Scholar]
- Abdulsalam, K.A.; Giwa, A.R.A.; Adelowo, J.M. Optimization studies for decolourization of textile wastewater using a sawdust-based adsorbent. Chem. Data Collect. 2020, 27, 100400. [Google Scholar] [CrossRef]
- Qureshi, M.I.; Patel, F.; Al-Baghli, N.; Abussaud, B.; Tawabini, B.S.; Laoui, T. A comparative study of raw and metal oxide impregnated carbon nanotubes for the adsorption of hexavalent chromium from aqueous solution. Bioinorg. Chem. Appl. 2017, 2017, 1–10. [Google Scholar] [CrossRef] [PubMed]
- Yang, H.; Zhang, Y.; Ouyang, J. Physicochemical Properties of Halloysite, 1st ed.; Elsevier Ltd.: Amsterdam, The Netherlands, 2016; Volume 7. [Google Scholar]
- Sedaghat, S. Synthesis of clay-CNTs nanocomposite. J. Nanostruct. Chem. 2013, 3, 1–5. [Google Scholar] [CrossRef]
- López-Luna, J.; Ramírez-Montes, L.E.; Martinez-Vargas, S.; Martínez, A.I.; Mijangos-Ricardez, O.F.; González-Chávez, M.D.C.A.; Carrillo-González, R.; Solís-Domínguez, F.A.; Cuevas-Díaz, M.D.C.; Vázquez-Hipólito, V. Linear and nonlinear kinetic and isotherm adsorption models for arsenic removal by manganese ferrite nanoparticles. SN Appl. Sci. 2019, 1, 1–19. [Google Scholar] [CrossRef]
- Ngteni, R.; Hossain, M.S.; Kadir, M.O.A.; Asis, A.J.; Tajudin, Z. Kinetics and isotherm modeling for the treatment of rubber processing euent using iron (II) sulphate waste as a coagulant. Water 2020, 12, 1747. [Google Scholar] [CrossRef]
- Sajid, M.J.; Yu, Z.; Rehman, S.A. The Coal, Petroleum, and Gas Embedded in the Sectoral Demand-and-Supply Chain: Evidence from China. Sustainability 2022, 14, 1888. [Google Scholar] [CrossRef]
- Taylor, P.; Gulicovski, J.J.; Ljiljana, S.Č.; Milonji, S.K. Point of Zero Charge and Isoelectric Point of Alumina Point of Zero Charge and Isoelectric Point of Alumina. Mater. Manuf. Process. 2008, 23, 37–41. [Google Scholar]
- Moustafa, M.T. Preparation and Characterization of Low-Cost Adsorbents for the Efficient Removal of Malachite Green Using Response Surface Modeling and Reusability Studies; Nature Publishing Group: London, UK, 2023; Volume 13. [Google Scholar]
- Athari, M.; Fattahi, M.; Nikou, M.K.; Hajhariri, A. Adsorption of different anionic and cationic dyes by hybrid nanocomposites of carbon nanotube and graphene materials over UiO-66. Sci. Rep. 2022, 12, 20415. [Google Scholar] [CrossRef]
- Aslam, Z.; Qaiser, M.; Ali, R.; Abbas, A.; Ihsanullah; Zarin, S. Al2O3/MnO2/CNTs nanocomposite: Synthesis, characterization and phenol adsorption. Fullerenes Nanotub. Carbon Nanostruct. 2019, 27, 591–600. [Google Scholar] [CrossRef]
- Kéri, A.; Sápi, A.; Ungor, D.; Sebők, D.; Csapó, E.; Kónya, Z.; Galbács, G. Porosity determination of nano- and sub-micron particles by single particle inductively coupled plasma mass spectrometry. J. Anal. At. Spectrom. 2020, 35, 1139–1147. [Google Scholar] [CrossRef]
- Ravikumar, K.; Krishnan, S.; Ramalingam, S.; Balu, K. Optimization of process variables by the application of response surface methodology for dye removal using a novel adsorbent. Dye. Pigment. 2007, 72, 66–74. [Google Scholar] [CrossRef]
- Gholami, S.; Llacuna, J.L.; Vatanpour, V.; Dehqan, A.; Paziresh, S.; Cortina, J.L. Impact of a new functionalization of multiwalled carbon nanotubes on antifouling and permeability of PVDF nanocomposite membranes for dye wastewater treatment. Chemosphere 2021, 294, 133699. [Google Scholar] [CrossRef] [PubMed]
- Guo, J.; Zhang, Q.; Cai, Z.; Zhao, K. Preparation and dye filtration property of electrospun polyhydroxybutyrate–calcium alginate/carbon nanotubes composite nanofibrous filtration membrane. Sep. Purif. Technol. 2016, 161, 69–79. [Google Scholar] [CrossRef]
- Bello, O.S.; Adegoke, K.A.; Akinyunni, O.O. Preparation and characterization of a novel adsorbent from Moringa oleifera leaf. Appl. Water Sci. 2017, 7, 1295–1305. [Google Scholar] [CrossRef]
- Yuan, N.; Tan, K.; Zhang, X.; Zhao, A.; Guo, R. Synthesis and adsorption performance of ultra-low silica-to-alumina ratio and hierarchical porous ZSM-5 zeolites prepared from coal gasification fine slag. Chemosphere 2022, 303, 134839. [Google Scholar] [CrossRef] [PubMed]
- Titchou, F.E.; Akbour, R.A.; Assabbane, A.; Hamdani, M. Removal of cationic dye from aqueous solution using Moroccan pozzolana as adsorbent: Isotherms, kinetic studies, and application on real textile wastewater treatment. Groundw. Sustain. Dev. 2020, 11, 100405. [Google Scholar] [CrossRef]
- Javed, F.; Feroze, N.; Ikhlaq, A.; Kazmi, M.; Ahmad, S.W.; Munir, H.M.S. Biosorption potential of Sapindus mukorossi dead leaves as a novel biosorbent for the treatment of reactive red 241 in aqueous solution. Desalin. Water Treat. 2019, 137, 345–357. [Google Scholar]
- Eletta, O.A.A.; Mustapha, S.I.; Ajayi, O.A.; Ahmed, A.T. Optimization of dye removal from textile wastewater using activated carbon from sawdust. Niger. J. Technol. Dev. 2018, 15, 26. [Google Scholar] [CrossRef]
- Chauhdary, Y.; Hanif, M.A.; Rashid, U.; Bhatti, I.A.; Anwar, H.; Jamil, Y.; Alharthi, F.A.; Kazerooni, E.A. Effective Removal of Reactive and Direct Dyes from Colored. Water 2022, 14, 3604. [Google Scholar] [CrossRef]
- Althomali, R.H.; Alamry, K.A.; Hussein, M.A.; Guedes, R.M. An investigation on the adsorption and removal performance of a carboxymethylcellulose-based 4-aminophenazone@MWCNT nanocomposite against crystal violet and brilliant green dyes. RSC Adv. 2023, 13, 4303–4313. [Google Scholar] [CrossRef]
- Amalia, Z.; Efriza, S. Removal of Dye Waste by Green Adsorbent. Am. Inst. Phys. Conf. Ser. 2023, 2431, 060017. [Google Scholar]
- Elamin, M.R.; Abdulkhair, B.Y.; Algethami, F.K.; Khezami, L. Linear and nonlinear investigations for the adsorption of paracetamol and metformin from water on acid-treated clay. Sci. Rep. 2021, 11, 1–13. [Google Scholar]
- Tahir, S.S.; Rauf, N. Removal of a cationic dye from aqueous solutions by adsorption onto bentonite clay. Chemosphere 2006, 63, 1842–1848. [Google Scholar] [CrossRef] [PubMed]
- Hussain, M.S.; Rehman, R.; Imran, M. Isothermal and Kinetic Investigation of Exploring the Potential of Citric Acid-Treated Trapa natans and Citrullus lanatus Peels for Biosorptive Removal of Brilliant Green Dye from Water. J. Chem. 2021, 2021, 1–23. [Google Scholar] [CrossRef]
- SJaved, H.; Zahir, A.; Khan, A.; Afzal, S.; Mansha, M. Adsorption of Mordant Red 73 dye on acid activated bentonite: Kinetics and thermodynamic study. J. Mol. Liq. 2018, 254, 398–405. [Google Scholar]
- Assila, O.; Tanji, K.; Zouheir, M.; Arrahli, A.; Nahali, L.; Zerrouq, F.; Kherbeche, A. Adsorption studies on the removal of textile effluent over two natural eco-friendly adsorbents. J. Chem. 2020, 2020, 1–13. [Google Scholar] [CrossRef]
- Aslam, Z.; Yousaf, I.; Akhtar, A.; Zahi, A. Adsorptive performance of MWCNTs for simultaneous cationic and anionic dyes removal; kinetics, thermodynamics, and isotherm study. Turk. J. Chem. 2021, 45, 1189–1200. [Google Scholar] [CrossRef]
- Patel, M.; Chaubey, A.K.; Pittman, C.; Mohan, D. Aqueous ibuprofen sorption by using activated walnut shell biochar: Process optimization and cost estimation. Environ. Sci. Adv. 2022, 1, 530–545. [Google Scholar] [CrossRef]
- Chakraborty, P.; Show, S.; Banerjee, S.; Halder, G. Mechanistic insight into sorptive elimination of ibuprofen employing bi-directional activated biochar from sugarcane bagasse: Performance evaluation and cost estimation. J. Environ. Chem. Eng. 2018, 6, 5287–5300. [Google Scholar] [CrossRef]
- Chakraborty, P.; Banerjee, S.; Kumar, S.; Sadhukhan, S.; Halder, G. Elucidation of Ibuprofen Uptake Capability of Raw and Steam Activated Biochar of Aegle Marmelos Shell: Isotherm, Kinetics, Thermodynamics and Cost Estimation; Institution of Chemical Engineers: Colwall, UK, 2018; Volume 118. [Google Scholar]
- Ahmadi, M.; Ramezani, H.; Jaafarzadeh, N. Enhanced photocatalytic degradation of tetracycline and real pharmaceutical wastewater using MWCNT/TiO2 nano-composite. J. Environ. Manag. 2017, 186, 55–63. [Google Scholar] [CrossRef]
- Amin, M.T.; Alazba, A.A.; Shafiq, M. Adsorptive Removal of Reactive Black 5 from Wastewater Using Bentonite Clay: Isotherms, Kinetics and Thermodynamics. Sustainability 2015, 7, 15302–15318. [Google Scholar] [CrossRef]
- Momina; Rafatullah, M.; Ismail, S.; Ahmad, A. Optimization study for the desorption of methylene blue dye from clay based adsorbent coating. Water 2019, 11, 1304. [Google Scholar] [CrossRef]
- Kausar, A.; Sher, F.; Hazafa, A.; Javed, A.; Sillanpää, M.; Iqbal, M. Biocomposite of sodium-alginate with acidified clay for wastewater treatment: Kinetic, equilibrium and thermodynamic studies. Int. J. Biol. Macromol. 2020, 161, 1272–1285. [Google Scholar] [CrossRef] [PubMed]
- Fernandes, J.V.; Rodrigues, A.M.; Menezes, R.R.; de Araújo Neves, G. Adsorption of anionic dye on the acid-functionalized bentonite. Materials 2020, 13, 3600. [Google Scholar] [CrossRef] [PubMed]


| Parameters | Before Treatment |
|---|---|
| pH | 10.1 |
| TDS (mg/L) | 2750 |
| Electrical conductivity (µS) | 5550 |
| Chemical oxygen demand (mg/L) | 1140 |
| Turbidity (NTU) | 0.79 |
| Color | Dark red |
| Dilution factor (DF) | 10 |
| Isotherm | Kinetics |
|---|---|
| Langmuir | Pseudo-First Order |
| Freundlich | Pseudo-Second order Kinetics |
| (Linear)
(Non-Linear) | |
| Temkin | Intraparticle Diffusion model |
| (Linear)
(No linear) |
| Factor | Variable | −1 | 0 | 1 | −a | a |
|---|---|---|---|---|---|---|
| A | Adsorbent dose (mg) | 50 | 75 | 100 | −1 | 1 |
| B | pH | 3 | 5.5 | 8 | −1 | 1 |
| C | Time (minutes) | 30 | 75 | 120 | −1 | 1 |
| Run | Factor 1 A: Adsorbent Dose (mg) | Factor 2 B: pH | Factor C: Time (Minute) | Response % Decolorization |
|---|---|---|---|---|
| 1 | 75 | 5.50 | 75 | 72.37 |
| 2 | 50 | 5.50 | 75 | 50.754 |
| 3 | 50 | 8 | 30 | 50.3256 |
| 4 | 75 | 5.50 | 75 | 67.455 |
| 5 | 100 | 5.50 | 75 | 85.78 |
| 6 | 75 | 5.50 | 120 | 81.71 |
| 7 | 75 | 5.50 | 75 | 69.611 |
| 8 | 75 | 5.50 | 75 | 67.511 |
| 9 | 50 | 8 | 120 | 72.425 |
| 10 | 100 | 8 | 30 | 69.215 |
| 11 | 75 | 5.50 | 75 | 73.11 |
| 12 | 100 | 3.0 | 30 | 81.796 |
| 13 | 75 | 5.50 | 30 | 63.057 |
| 14 | 75 | 3.0 | 75 | 75.21 |
| 15 | 50 | 3.0 | 30 | 51.475 |
| 16 | 100 | 8 | 120 | 86.57 |
| 17 | 100 | 3.0 | 120 | 89.41 |
| 18 | 75 | 8 | 75 | 67.71 |
| 19 | 50 | 3.0 | 120 | 62.86 |
| 20 | 75 | 5.50 | 75 | 72.41 |
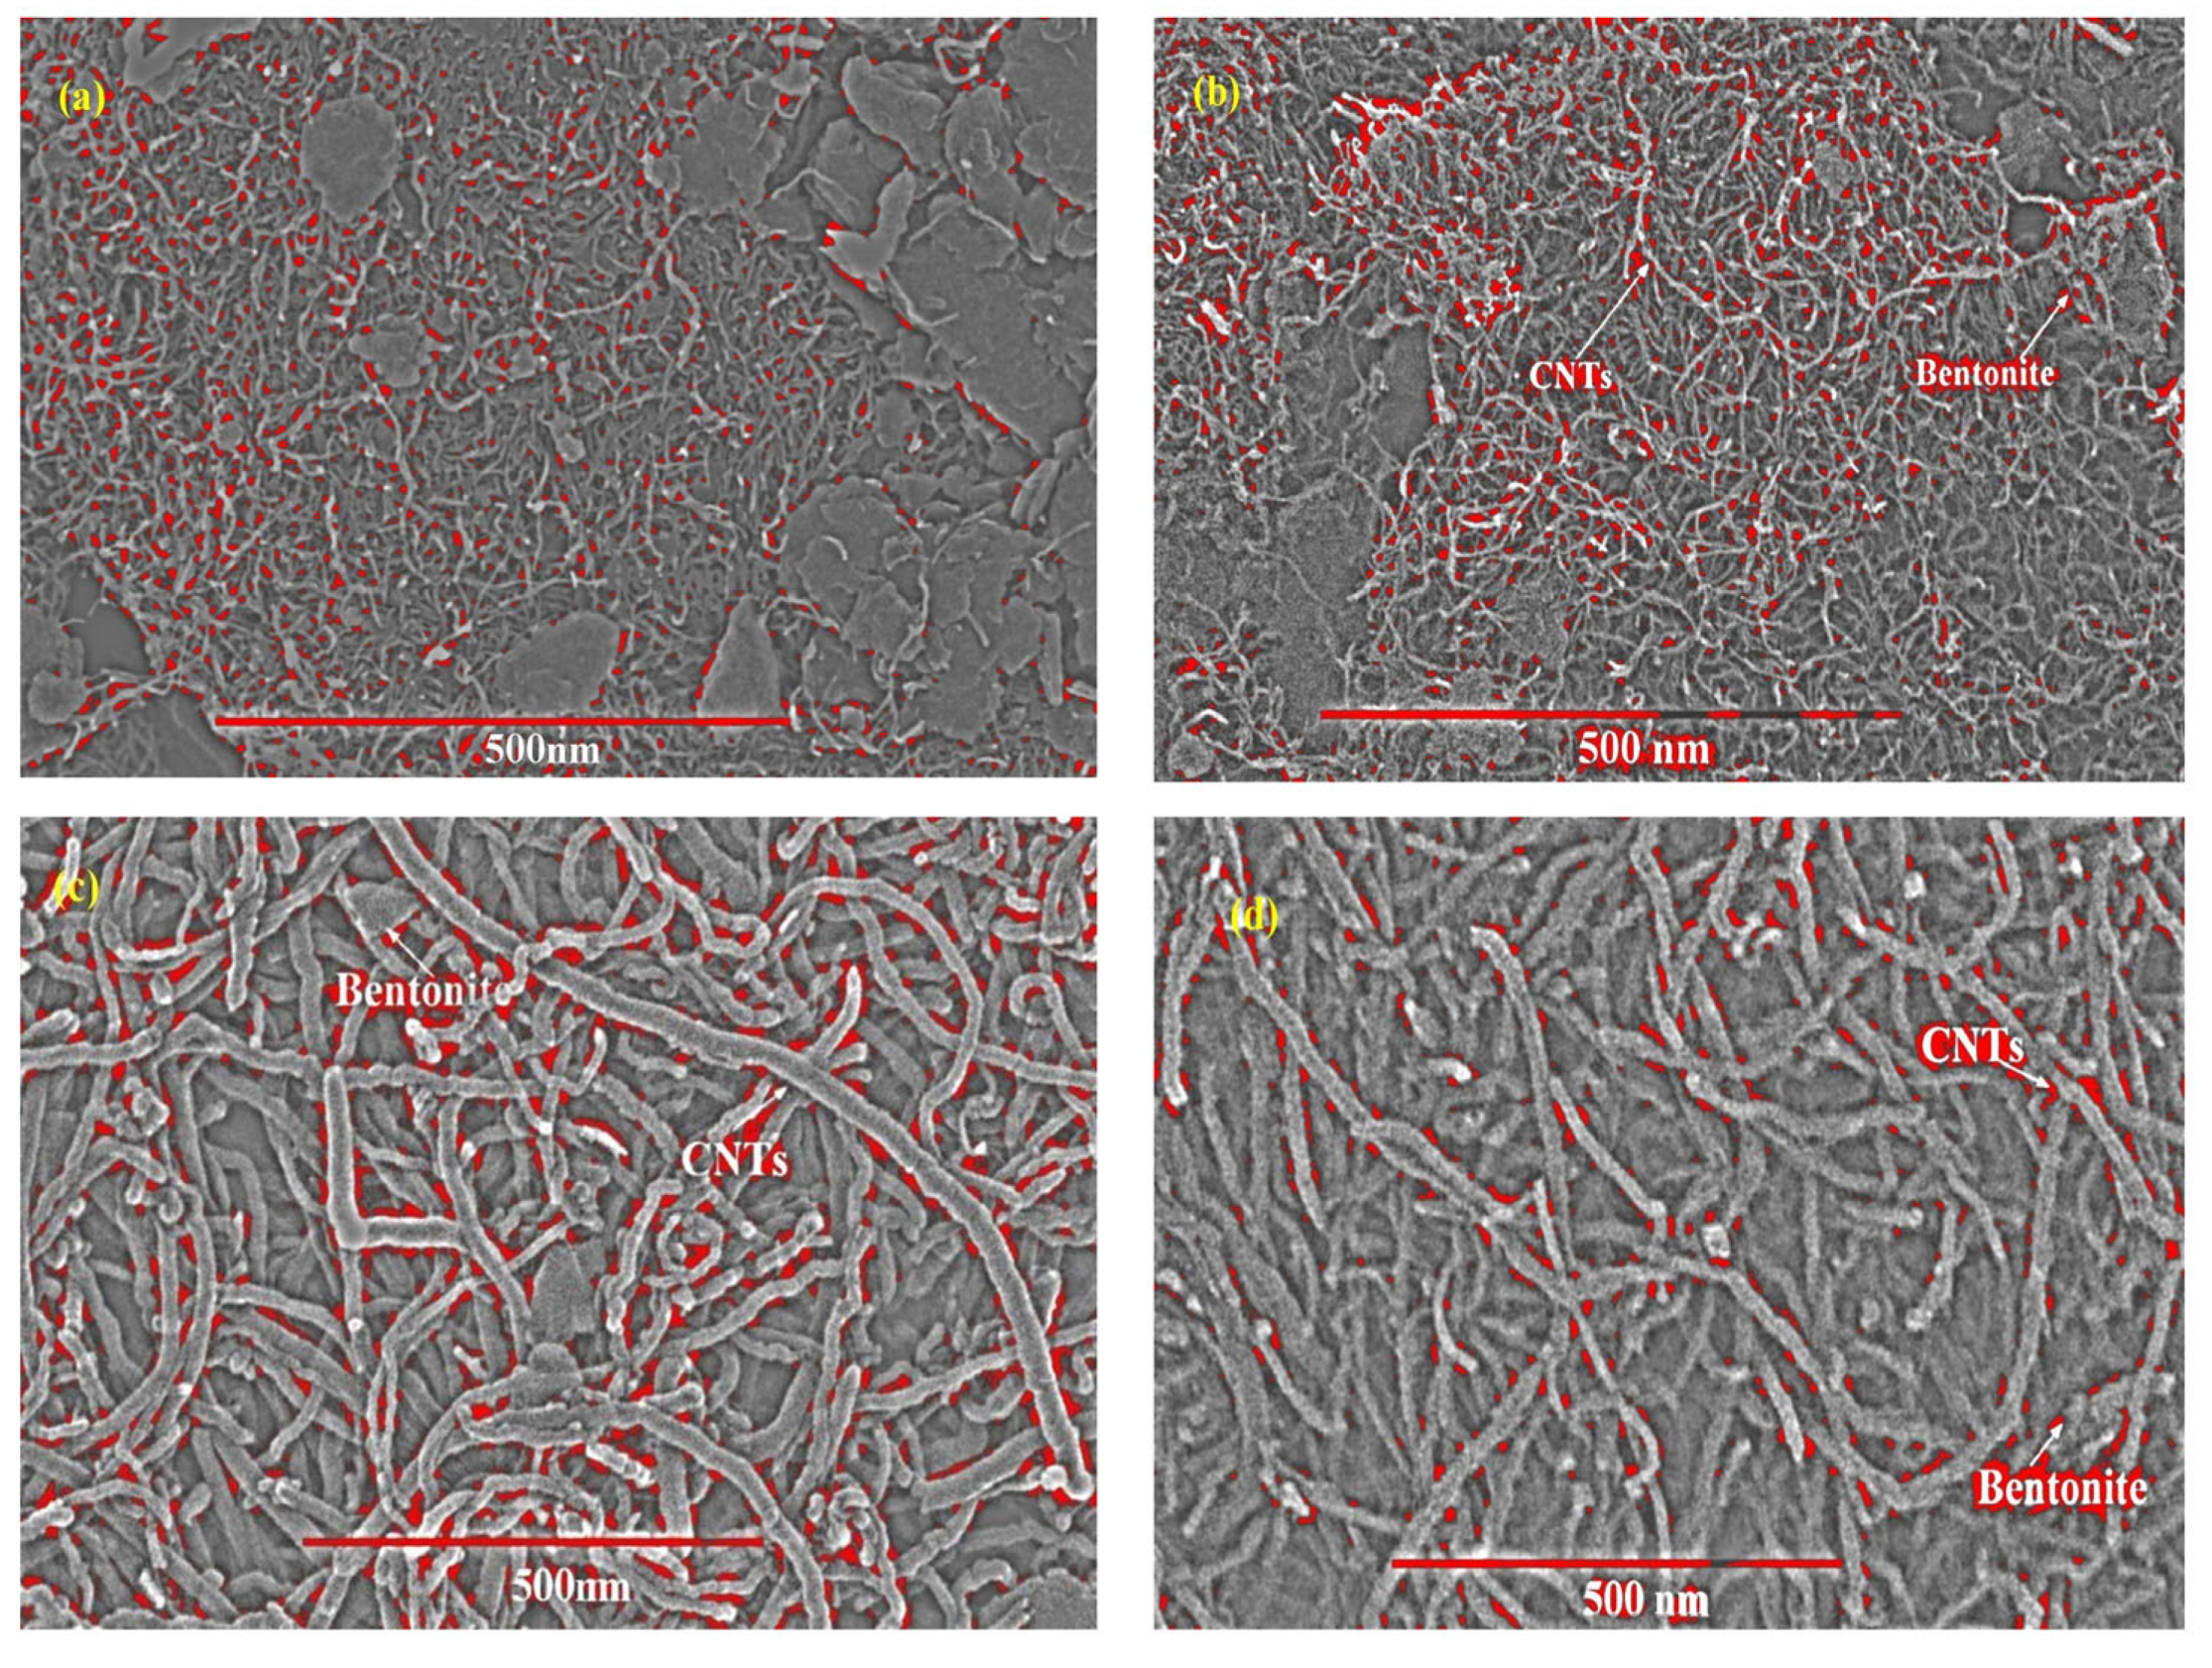
| % porosity of SEM images of Figure 3. | |
| Before Adsorption | After Adsorption |
| a. 6.597% | c. 5.14% |
| b. 5.36% | d. 3.578% |
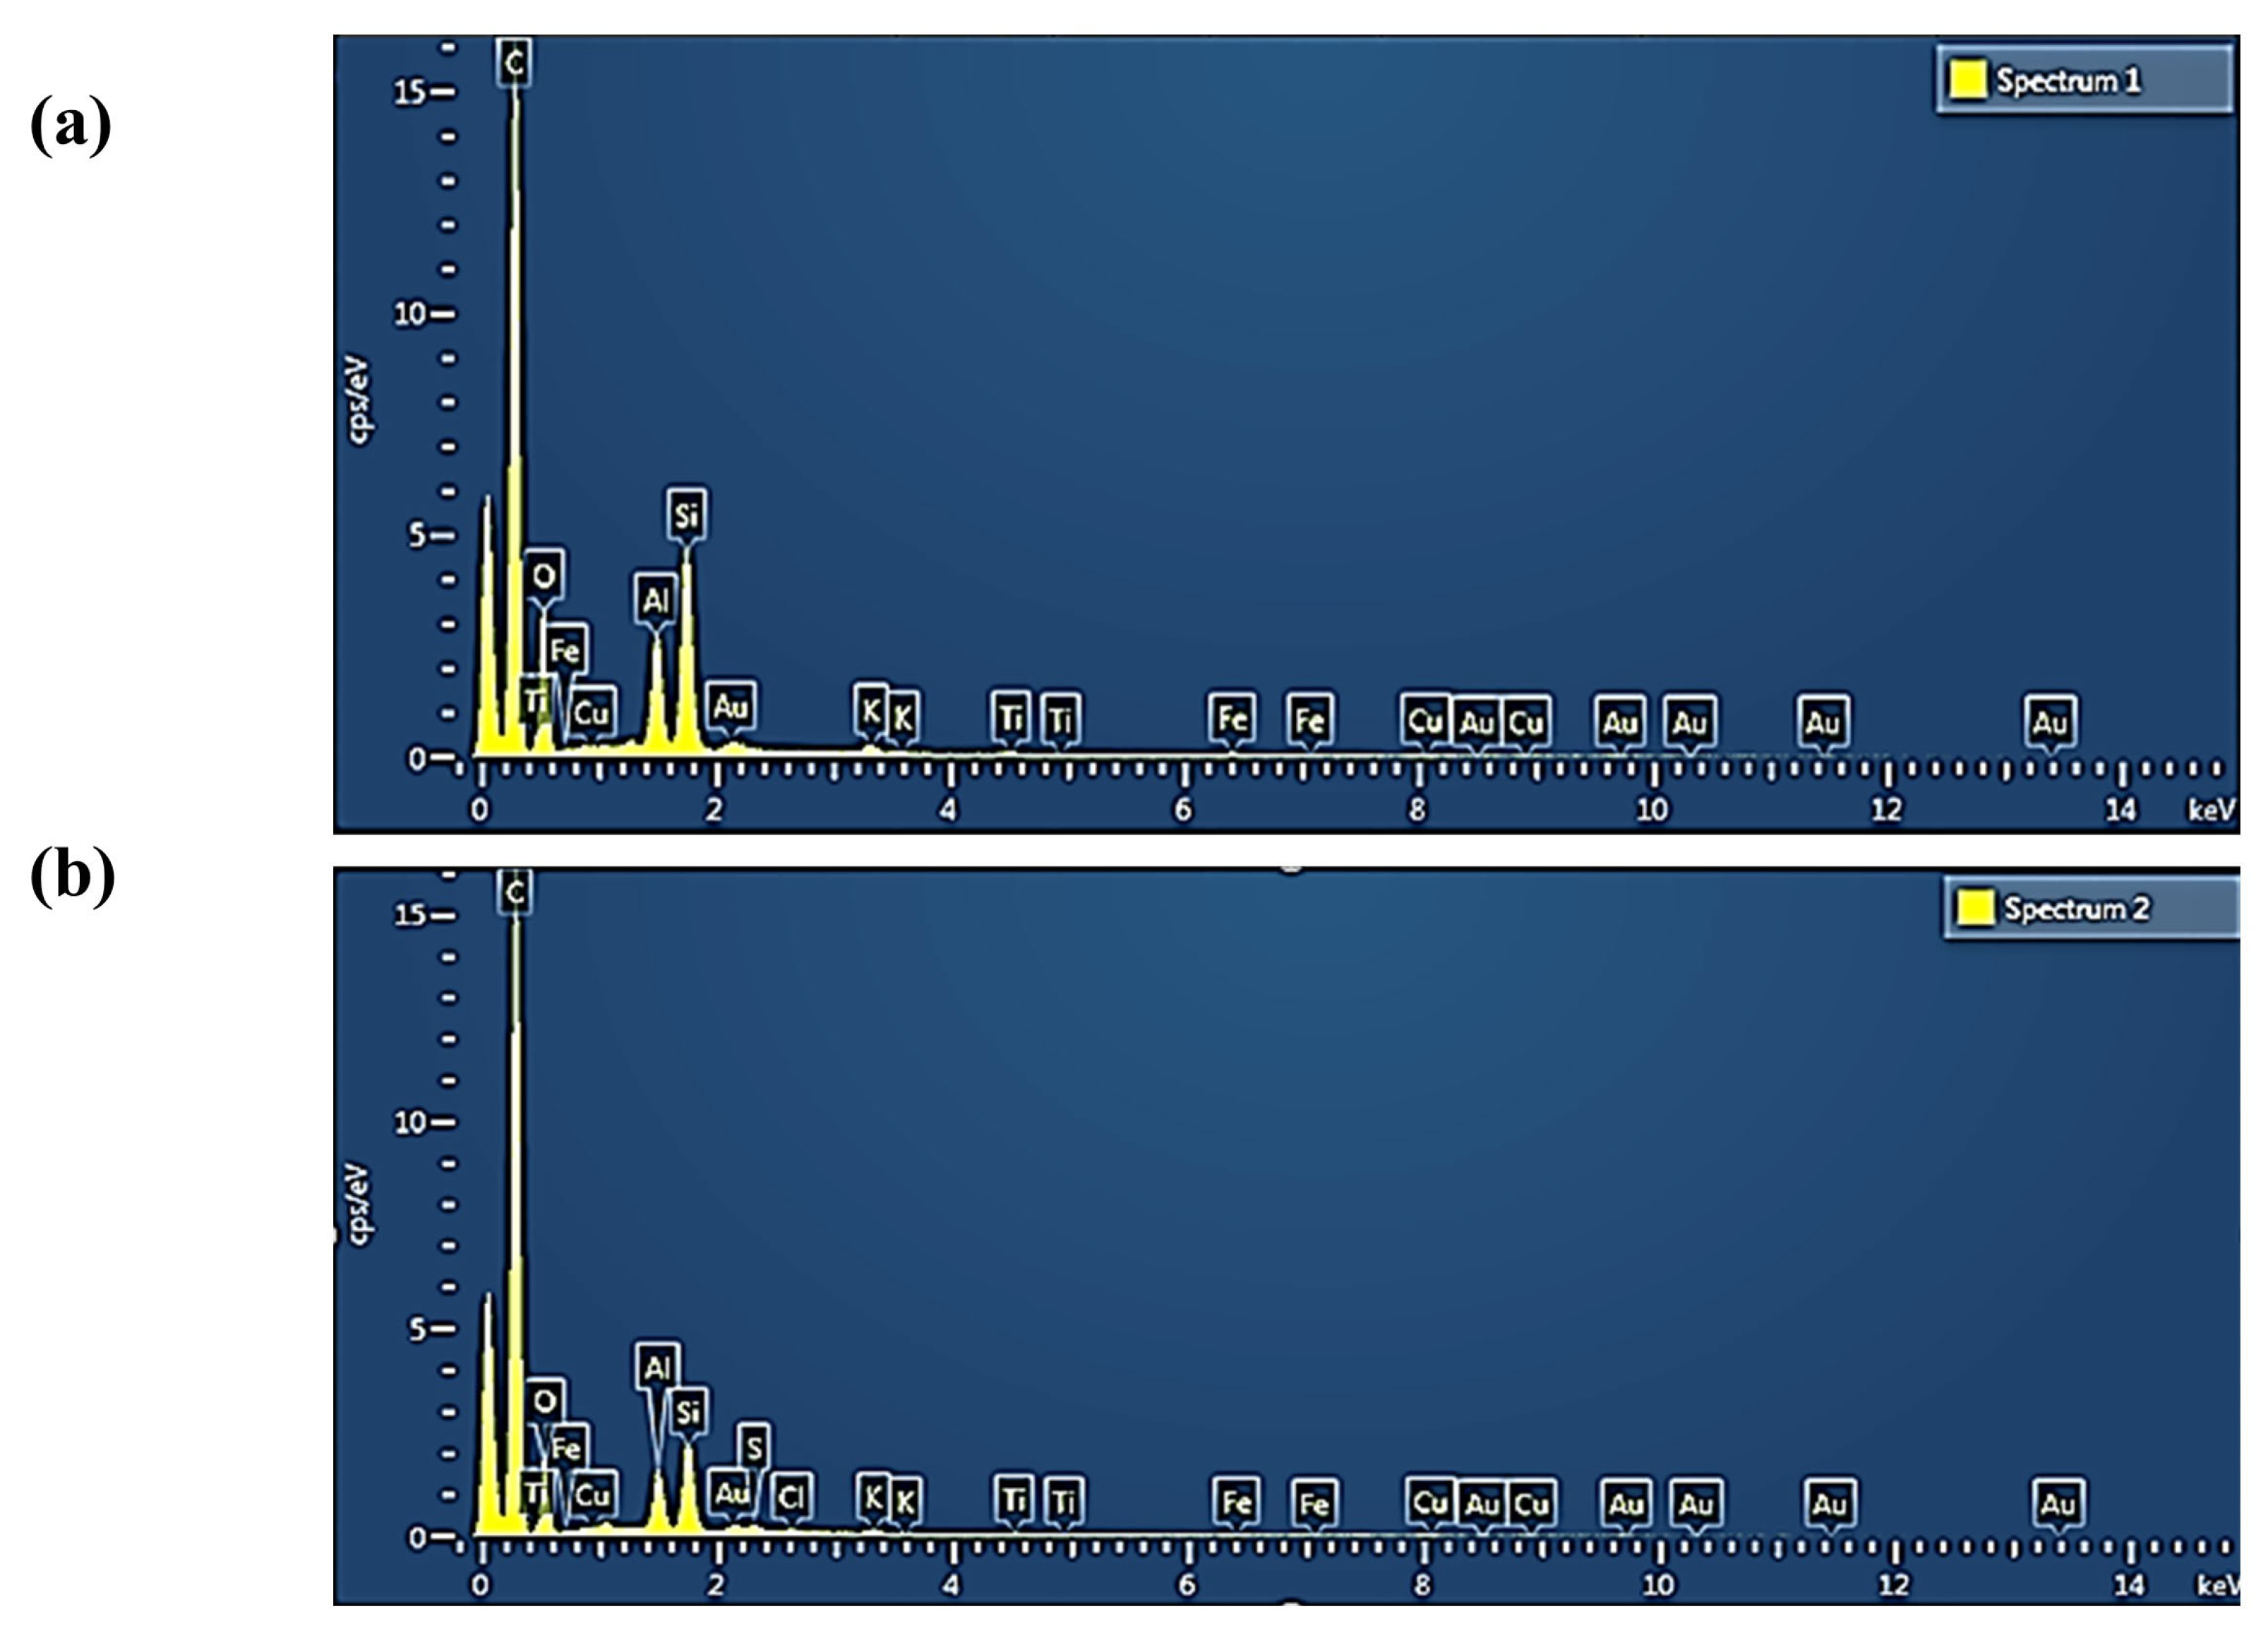
| Element | Weight % before Adsorption | Weight% after Adsorption |
|---|---|---|
| C | 75.24 | 82.01 |
| O | 17.02 | 12.52 |
| Al | 2.27 | 1.53 |
| Si | 4.07 | 2.32 |
| K | 0.29 | 0.22 |
| Fe | 0.43 | 0.22 |
| Adsorbent Dose mg | pH | Time Minute | Model Desirability | Removal% | ||
|---|---|---|---|---|---|---|
| Predicted | Experimental | Error% | ||||
| 100 | 3 | 120 | 0.946 | 91.55 | 89.41 | 2.14 |
| Linear Isotherm | Nonlinear Isotherm | ||
|---|---|---|---|
| Model and Equations | Parameter | Value | Value |
| Langmuir | qm (mg/g) | 518.13 | 518.23 |
| R2 | 0.99726 | 0.9999 | |
| RL | 0.427 | 0.4287 | |
| qecal | 550.30 | 550.1 | |
| X2 | 0.00009 | 0.0001 | |
| Freundlich | KF | 601 | 657 |
| R2 | 0.993 | 0.9999 | |
| 1/n (g/L) | 0.04837 | 0.04837 | |
| qecal | 557 | 550.25 | |
| X2 | 0.087 | 0.0001 | |
| Temkin | AT (L/mg) | 4.16 × 10⁻⁷ | 8.89 × 1042 |
| BT | 49.158(j.mol) | 5.29 | |
| qecal | 542 | 542 | |
| R2 | 0.9655 | 0.9987 | |
| X2 | 0.11 | 0.11 | |
| Temperature (K) | 1/T(K−1) | ΔG° (kJ/mol) | KL(KL (L/g) | LnKL (L/g) | ΔH° (kJ/mol) | ΔS° (kJ/mol/K) | qe (mg/g) | R2 |
|---|---|---|---|---|---|---|---|---|
| 308 | 0.003247 | −0.97873 | 1.465517 | 0.382208 | - | 425 | 0.95 | |
| 318 | 0.003145 | −4.08128 | 4.681818 | 1.543687 | - | - | 515 | - |
| 328 | 0.003049 | −5.54608 | 7.642857 | 2.033772 | 69.6927 | 0.2300 | 535 | - |
| Adsorbents | Textile Dye | Removal Efficiency (%) | Adsorption Capacity mg/g | References |
|---|---|---|---|---|
| MWCNT/TiO2 | Indigo carmine dye | 83 | 292 | [53] |
| Bentonite clay | Reactive Black 5 | 58 | 29 | [54] |
| Bentinite clay | Methylene Blue | 70 | 23 | [55] |
| Biocomposite sodium alganite-acidified clay | dyes | >90 | 8.39 | [56] |
| Acid-functionalized bentonite | Methyl Orange | 90 | 237 | [57] |
| Mgo-impregnated clay | Malachite green | 98 | 17.3 | [29] |
| Acid-modified CNTs | Ismate Violet 2R | 88.2 | 76.92 | [11] |
| COOH-MWCNT | Methyl Red | 95 | 80.33 | [13] |
| Modified clay/CNT | Textile dyes | 89.9 | 550 | Present study |
Disclaimer/Publisher’s Note: The statements, opinions and data contained in all publications are solely those of the individual author(s) and contributor(s) and not of MDPI and/or the editor(s). MDPI and/or the editor(s) disclaim responsibility for any injury to people or property resulting from any ideas, methods, instructions or products referred to in the content. |
© 2023 by the authors. Licensee MDPI, Basel, Switzerland. This article is an open access article distributed under the terms and conditions of the Creative Commons Attribution (CC BY) license (https://creativecommons.org/licenses/by/4.0/).
Share and Cite
Jamil, T.; Yasin, S.; Ramzan, N.; Aslam, H.M.Z.; Ikhlaq, A.; Zafar, A.M.; Aly Hassan, A. Bentonite-Clay/CNT-Based Nano Adsorbent for Textile Wastewater Treatment: Optimization of Process Parameters. Water 2023, 15, 3197. https://doi.org/10.3390/w15183197
Jamil T, Yasin S, Ramzan N, Aslam HMZ, Ikhlaq A, Zafar AM, Aly Hassan A. Bentonite-Clay/CNT-Based Nano Adsorbent for Textile Wastewater Treatment: Optimization of Process Parameters. Water. 2023; 15(18):3197. https://doi.org/10.3390/w15183197
Chicago/Turabian StyleJamil, Tayyaba, Saima Yasin, Naveed Ramzan, Hafiz Muhammad Zaheer Aslam, Amir Ikhlaq, Abdul Mannan Zafar, and Ashraf Aly Hassan. 2023. "Bentonite-Clay/CNT-Based Nano Adsorbent for Textile Wastewater Treatment: Optimization of Process Parameters" Water 15, no. 18: 3197. https://doi.org/10.3390/w15183197
APA StyleJamil, T., Yasin, S., Ramzan, N., Aslam, H. M. Z., Ikhlaq, A., Zafar, A. M., & Aly Hassan, A. (2023). Bentonite-Clay/CNT-Based Nano Adsorbent for Textile Wastewater Treatment: Optimization of Process Parameters. Water, 15(18), 3197. https://doi.org/10.3390/w15183197