Abstract
Domestic RO systems are commonly installed in households for water purification and treatment, typically for drinking water purposes. While RO systems effectively remove impurities, such as dissolved salts, minerals, and contaminants from tap water, they produce a concentrated waste stream known as RO reject. This reject water contains the contaminants that were removed during the RO filtration process. This RO reject can be effectively utilized in other domestic, agricultural, and industrial applications. In this study, the performance of a photovoltaic/thermal (PV/T) system was experimentally examined by employing RO reject and MgO/water-based nano-fluid. Two 165 W polycrystalline solar PV modules were used to compare the performance of a PV/T and a PV module. The performance of the solar PV module was assessed in terms of cell temperature and electrical efficiency using a water- and MgO/water-based PV/T system. Furthermore, the thermal and overall efficiency of the PV/T module was also compared using different base fluids. The effect of the working fluid flow rate (3 LPM, 6 LPM, 9 LPM, and 12 LPM) and variations in the concentrations (0.10 wt.%, 0.15 wt.%, and 0.20 wt.%) of MgO nanoparticles were examined to evaluate the improvement in the performance of the PV/T system. The results indicate that the PV/T system’s cell temperature was significantly reduced, and its electrical, thermal, and overall efficiency increased with an increased flow rate. The optimum concentration of nanoparticles and flow rate were determined to be 0.15 wt.% and 12 LPM, respectively. The findings suggest that MgO/water-based nano-fluids have the potential to enhance the performance of PV/T systems, and this study provides valuable insights for their practical implementation.
1. Introduction
The importance of renewable energy for global sustainability cannot be overstated. As the demand for electricity production continues to rise worldwide, it is imperative to seek sustainable solutions. Solar technology presents an ideal solution as it is a clean, abundant, and freely available energy source. The photovoltaic properties of semiconductors enable the easy harvesting of solar energy, which can then be transformed into several forms of energy, such as thermal, electrical, and chemical energy. Solar cells in the form of semiconductors absorb photons from the sun and convert them into electricity, thus providing a reliable and sustainable power source. Investing in solar technology mitigates negative environmental impacts and offers significant economic benefits by reducing dependency on non-renewable energy sources. Therefore, it is crucial to prioritize the development and adoption of solar technology in the global energy mix to promote a sustainable future for generations to come. Secondary-treated urban reject and reject from reverse osmosis (RO) systems may be used for irrigation purposes [1]. It has been shown that using RO reject for irrigation can produce higher yields than those obtained using freshwater irrigation [2]. Many studies have already concluded that RO reject could be safely and effectively used for irrigation purposes, thus providing a sustainable solution for reject management and water conservation in arid regions [3]. In the current study, the authors have used RO reject to cool solar panels and improve their performance. There are certain limitations to the use of domestic RO reject due to its composition, and these must be considered. Potential applications of domestic RO reject include non-potable uses such as irrigating plants, flushing toilets, or washing cars [4]. It is important to note that the suitability of domestic RO reject for reuse may vary based on the specific characteristics of the reject, local regulations, and the intended application.
A PV module’s electrical efficiency drops by 0.5% with each increase of 1 °C in the module’s temperature above 25 °C [5]. Different substances are employed to cool down PV modules, such as water, air, phase change material (PCM), and nanoparticles, which transfer heat from the PV panel. However, thermal energy can also be collected for other purposes, such as space and water heating. Dubey and Tiwari [6] analyzed the thermal energy, electrical energy, and exergy of a PV/T/Water system by changing the shape and size of the collectors (sheets and tubes). They concluded that partially sheltered PV cells are advantageous for those customers who want hot water production as their first choice and electrical generation first choice using fully covered PV cells. Huang et al. [7] examined the effect of phase change materials on the cooling of a PV/T system and concluded that convection and crystalline isolation impacted heat transfer efficiency. Yousefi et al. [8] studied the effect of Al2O3/water-based nano-fluid on flat-plate solar collectors and found that at a concentration of 0.2 wt.%, the efficiency increased by 28.3%, which was greater than the efficiency obtained at a 0.4 wt.% concentration.
Hussain et al. [9] investigated the thermal efficiency of a PV/T model using a nano-fluid made of Al2O3–water with a concentration of 0.3 wt.% at a flow rate of 0.2 L/s. The experiment reduced the cell temperature to 42.2 °C, which led to a 12.1% improvement in the efficiency of the solar panel. Another investigation was conducted by Hasar et al. [10], who compared the behavior of PV modules using different materials in various climate conditions. They used CaCl2 6H2O (salt hydrate) and capric acid–palmitic acid and found that the salt hydrate maintained a lower PV cell temperature than the capric–palmitic acid in both tested sites (Dublin and Velari).
Ghadiri et al. [11] evaluated the effect of ferrofluids as coolants and found that at a 3 wt.% concentration, the system’s overall performance improved by 45% and that it increased by up to 50% compared with distilled water when a 50 Hz alternating magnetic field was applied. AL-Shamani et al. [12] attempted to cool a PVT system using a rectangular nanotube as an absorber and evaluated the performance of the system with different nano-fluids, such as SiO2, TiO2, and SiC. They found that the PVT–SiC system showed the best result with 13.52% electrical efficiency and 81.73% overall efficiency at 1000 W/m2 and a flow rate of 0.17 kg/s.
Yazdanifard et al. [13] conducted a simple numerical simulation for a water-based PVT model. He proposed and found an optimum value for the number of pipes and the mass flow rate that would maximize energy efficiency. M. Sardarabadi et al. [14] examined the effect of using nano-oxide/water-based nano-fluid as a coolant with TiO2, ZnO, and Al2O3 at 0.2 wt.%. They found that ZnO/water- and TiO2/water-based nano-fluids improve electrical efficiency compared to Al2O3/water-based nano-fluid and deionized water, both numerically and experimentally. Ghaderian [15] attempted to increase the efficiency of the evacuated tube solar collector and obtained a maximum efficiency of 57.63% with 0.06 vol% Al2O3 nano-fluid at a 60 LPH mass flow rate. Hierrild et al. [16] evaluated the effect of using a nano-fluid composed of suspended core-shell Ag-SiO2 nanodiscs and CNTs in water as an optical filter on the performance of a hybrid PV/T system and found that it increased the combined efficiency by 30% compared with the base fluid.
Al-Waeli et al. [17] evaluated the performance of the PVT system by cooling it using SiC nanoparticles and found that the electrical efficiency improved by up to 24.1% when using 3 wt.% SiC nano-fluid compared to traditional solar PV systems. At the same time, the thermal and overall efficiency of the PVT system increased to 100.19% and 88.9%, respectively, compared to water as a base fluid. Soltoni et al. [18] investigated five different cooling methods and found that using SiO2/water produced the highest power and efficiency compared to natural cooling, water cooling, forced cooling, and Fe3O4/water. Hasan et al. [19] experimented and gained the highest electrical, thermal, and total efficiencies of 13%, 85%, and 98%, respectively, using a SiC/water nano-fluid at a flow rate of 0.167 kg/s, compared to using TiO2 and SiO2 nanoparticles. Sardarbadi et al. [20] conducted an experiment on a PVT system using a ZnO/water nano-fluid and phase change material (PCM), and they concluded that this system showed an average increase in electrical and thermal efficiency of about 5% and 9% respectively as compared to a conventional PV module. Al-Waeli et al. [21] investigated using nano-fluid and nano-PCM to improve the efficiency of PVT, resulting in an enhancement in efficiency by 6% and a thermal efficiency of 72%.
Nasrin et al. [22] experimented and did numerical research on an MWCNT/water-based cooling system of PVT and found a 9.2% enhancement in PV performance compared to water as a base fluid. The enhancement in thermal performance was recorded as 3.67% and 4% in experimental and numerical studies, respectively, using nano-fluid. The overall numerical and experimental efficiency are 89 and 87%, respectively. Rostami et al. [23] presented an experiment on atomized CuO nano-fluid for enhancing the cooling performance of the PV system, and the result shows that the average cell temperature decreased up to 57% and maximum power increased up to 51% from a conventional PV system. Fayaz et al. [24] investigated the effect of nano-fluid flow rate by analyzing the energy and exergy on the PV/T system, which resulted in the cell temperature reduction to 0.72 °C through an experiment and 0.77 °C numerically with 10 L/h flow rate increment.
Mousavi et al. [25] proposed a numerical approach to examine the effect of copper foam filled with PCM in the PVT water system, which caused 83% increments in thermal efficiency at 0.02 kg/s flow rate and showed good agreement when validated with an experimental study. AL-Waeli et al. [26] used ANN for modeling and analysis of a PVT and found that the proposed ANN shows an increase in electrical efficiency by 5% and thermal efficiency by 72% with MSE of 0.023 in the training phase and 0.028 in the cross-authentication phase. Fatima and Tiwari [27] validated the thermal and electrical performance of the PVT model theoretically with a copper base and observed good agreement between both methodologies with a correlation of 0.99 and a mean square error of 7.5%. They also noticed that the maximum exergy efficiencies and overall thermal were 14.71% and 33.75%, respectively. Das et al. [28] investigated the effect of the liquid-gas phase change material with a reduction of 8.8 °C temperature of the PV panel standalone PV system. Hassan et al. [29] presented the performance of PVT-PCM nano-fluid, which showed that the maximum reduction in cell temperature was observed as 23.9 °C with maximum improvement in electrical, thermal, and overall efficiency by 23.9%, 17.5%, and 12%, respectively. Alsalame et al. [30] assessed the performance of nano-fluid Al2O3/water and CuO/water as the heat transfer medium, in which the CuO/water mixture showed better results with 51.22% and 72.58% of total efficiency and energy accumulation efficiency, respectively.
Magnesium oxide (MgO) is one of the lightest oxides with a high surface area. The lightest metal oxides are those formed by alkali and alkaline earth metals, which are the elements in the first two groups of the periodic table. MgO is the lightest metal oxide among structural metals, and its surface area is increased by converting it into nanopowder. The nano-fluid composed of MgO/water will enhance the performance of the PVT system. MgO nanoparticles dispersed in water form a nano-fluid that exhibits enhanced thermal conductivity compared to pure water. When this nano-fluid is used as a coolant in the PVT system, it enhances heat transfer efficiency. The higher thermal conductivity of the nano-fluid allows for more effective heat dissipation from the PV cells and thermal absorber, leading to lower operating temperatures and improved electrical performance of the PV cells and increasing the overall system efficacy. The efficacy enhancements provided by MgO/water nano-fluid in a PV/T system can vary depending on factors such as the concentration and size of MgO nanoparticles, stability of the nano-fluid, flow rate, and operating conditions. Researchers and scientists have investigated the performance of PVT systems, utilizing various experimental, numerical, and simulation techniques. In this paper, authors present an experimental investigation wherein they have developed an experimental set-up to cool down the PV module temperature using MgO/water nano-fluid to improve its performance in terms of cell temperature, thermal, electrical, and overall efficiency.
2. Methodology and Experimentations
The PV cell’s efficiency decreases with increasing solar intensity and ambient temperature. The maximum electrical efficiency of a PV cell typically ranges from 11% to 21% under standard test conditions (STC). The standard test conditions include 1000 Watts per square meter irradiance, the cell temperature at 25 °C, and 1.5 air mass. Various PVT systems have been developed to generate additional electricity to mitigate this effect. This paper presents an experimental analysis of a PVT system that extracts thermal heat using a MgO and water-based nano-fluid. The extracted energy may be used for various applications, including industrial and domestic. The experiment measures thermal and electrical energy by varying the base fluid and nano-fluid flow rate. The PVT system is constructed using a Cu tube and hard foam on the back of the PV module. The selection of copper tube is made based on its thermal conductivity despite corrosion issues. The steel tube may have lower corrosion resistance, but it is not appropriate for extracting sufficient heat from PV/T. The effect of water and a mixture of water and MgO flowing through the Cu tube at various mass flow rates and MgO concentrations has been observed. Some assumptions are made during the experiment, including that the working fluid’s specific heat is constant, the Cu tube’s conductivity is constant, and no vapor formation occurs in the copper pipe. Water used in the study is rejected RO water. Some key characteristics of RO reject are high total dissolved solids (TDS), elevated salinity, reduced pH, reduced organic content, low turbidity, and chemical composition. The value of the above characteristics varies depending on the water source.
Photovoltaic thermal (PVT) systems combine electricity and thermal energy generation in a single device. Here are some technical insights, limitations, environmental impacts, and economic feasibility considerations of PVT systems: PVT systems generate electricity and thermal energy simultaneously, making them more efficient in utilizing solar energy than standalone PV or solar thermal systems. Integrating PV and solar thermal components in PVT systems allows for better heat dissipation from PV panels, resulting in improved overall system efficiency. PVT systems can be designed with tilted PV panels to optimize solar energy capture, and hybrid designs can incorporate other heat transfer fluids or heat exchangers to enhance thermal performance. PVT systems are generally more expensive than standalone PV or solar thermal systems due to the additional complexity of combining both technologies into a single device. PVT systems require careful design and integration to optimize thermal and electrical performance, which can add complexity to the system. The heat extraction from PV panels in PVT systems is typically limited to the rear surface, which may result in lower thermal efficiency compared to dedicated thermal collectors. PVT systems require regular maintenance and cleaning to ensure the optimal performance of both the PV and thermal components. PVT systems contribute to reducing greenhouse gas emissions by generating renewable electricity and heat, displacing fossil fuel-based energy sources. PVT systems can save costs by generating electricity and thermal energy, reducing reliance on grid electricity and conventional heating systems. The economic feasibility of PVT systems depends on local energy prices, available incentives, and the demand for electricity and heat.
The volume fraction and density of nano-fluid, maximum power, solar irradiation, electrical and thermal efficiency at different flow rates of water, and different flow rate and concentration of nano-fluid have been obtained by utilizing the following equations.
The volumetric fraction of nano-fluid is obtained by Equation (1) [14]:
Equation (2) obtains the density of nano-fluid [14]:
The PV module’s electrical efficiency is obtained by Equation (3) [14]:
The maximum value of is obtained by Equation (4) [14]:
The incident solar radiation on the module is obtained by Equation (5) [14]:
Equation (6) obtains the thermal efficiency [14]:
A photovoltaic thermal (PVT) system was fabricated to separate electrical and thermal energy from the incident radiation on the PVT System. A conventional PV module with the same characteristics was also used to compare the performance of the designed PVT system. The investigational data of both PV and PVT were recorded for comparison. The devices and instruments used in this study include a circulating pump, pyranometers, multimeter, flowmeter, DC load, anemometer, radiator system, thermocouples, and fluid storage tank. The schematic representation of the working model with water as the base fluid is shown in Figure 1, and with MgO/water as the working fluid is shown in Figure 2.
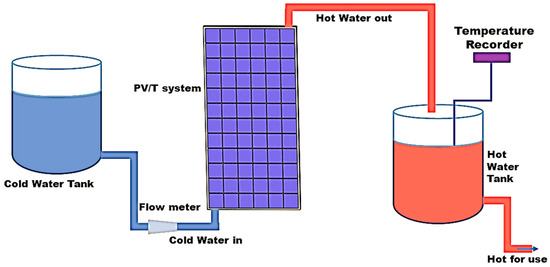
Figure 1.
Schematic model for water as base fluid.
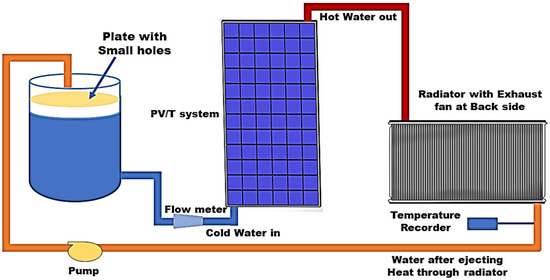
Figure 2.
Schematic model with MgO/water-based fluid.
The heat accumulated at the back of the PV panel is extracted and used for water heating, which can be used for space heating and other household applications. A copper pipe with a circular shape and an inner diameter of 10 mm is attached to the backside of the PV module and covered with a foam sheet measuring 53.5 inches × 26.5 inches × 0.8 inches, as shown in Figure 3a. The copper pipe has ten straight turns connected with the common iron pipe of 24.5 mm. The attached copper tube PV module and the unmodified PV module are shown in Figure 3b.
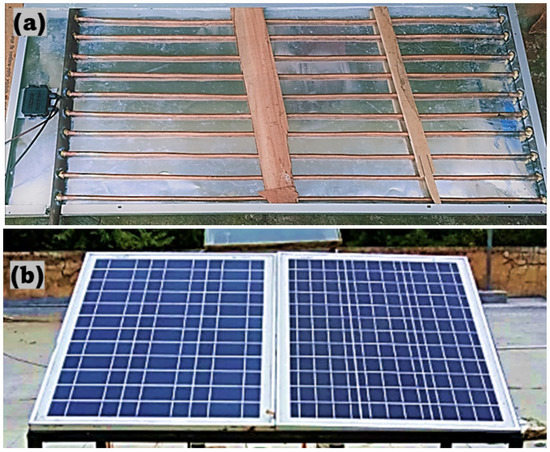
Figure 3.
Installed experimental set-up.
A sufficient quantity of RO rejects was collected from the kent grand star RO purifier installed in the household of the first author at Sultanpur. The TDS of the feed was 1245. The maximum flow rate of the unit was 20 LPH. The unit worked on multistage purification and consisted of ultraviolet, ultrafiltration, TDS controller, and reverse osmosis. The reject-to-permeate ratio was 4:1. The characteristics of RO reject are included in Table 1.

Table 1.
Characteristics of RO reject from the household.
3. Experiment Design and Measurement of Various Parameters
The PVT system has several parts, including a pump, radiator, copper tubes, and connecting pipes. Water as a working fluid may be collected in the storage reservoir after cooling the PV module of the PVT system, as expressed in Figure 1. In the case of nano-fluid, it is re-circulated by rejecting absorbed heat through the radiator, as shown in Figure 2. Different cases of designed PVT systems, along with conventional PV that was analyzed in the current research, are as follows:
- Case 1: Conventional Photo Voltaic System.
- Case 2: Photo Voltaic Thermal with working fluid as RO reject.
- Case 3: Photo Voltaic Thermal with nano-fluid (0.10 wt.% of MgO nanoparticle concentration in RO reject) as the working fluid.
- Case 4: Photo Voltaic Thermal with nano-fluid (0.15 wt.% of MgO nanoparticle concentration in RO reject) as the working fluid.
- Case 5: Photo Voltaic Thermal with nano-fluid (0.20 wt.% of MgO nanoparticle concentration in RO reject) as the working fluid.
There is no need for any method for working fluid preparation in the case of water. However, a suitable preparation method is employed to make a MgO/water nano-fluid as a working fluid. The nanoparticles were purchased from Nano Wings Pvt Ltd., Mamillaguda, Khammam—Telangana, India, Telangana 507001. The MgO nanoparticles’ SEM image is presented in Figure 4a. The procured MgO nanoparticle was further examined by X-ray diffraction (XRD) pattern. The crystalline nature of MgO with the representation of reflection peaks is shown in Figure 4b. The indexed peaks represent the pure cubic phase of MgO (JCPDS 75-0447). To prepare nano-fluid of different weight fractions, weighed MgO nanoparticles were mixed in water with the support of a magnetic stirrer. The nanoparticle’s average size is 50 nm.
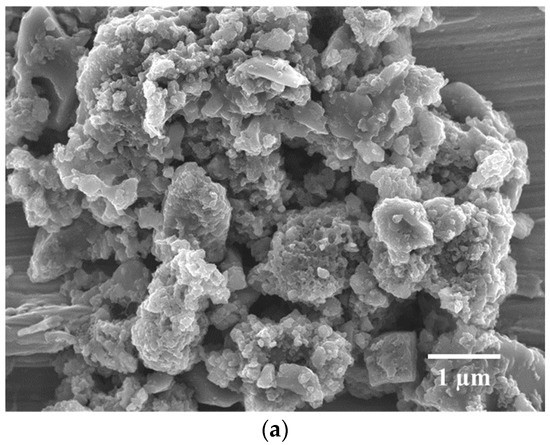
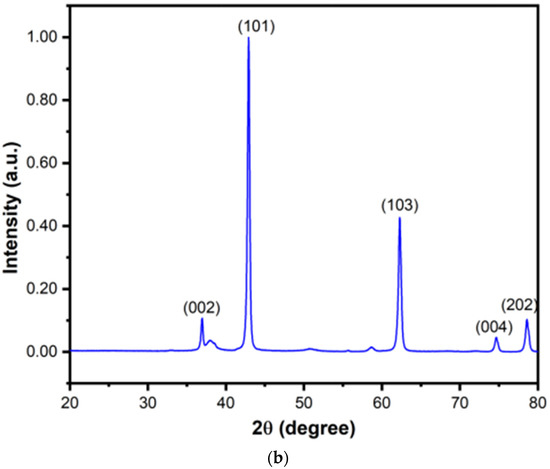
Figure 4.
(a) FE SEM image of MgO. (b) XRD analysis of MgO.
The Solari meter (model TM-207) measures incident solar radiation (W/m²) at 30-min intervals over the surfaces of both PV and PVT modules. The maximum power output of the PV and PVT modules was recorded at 30 min intervals using an energy meter. Five K-type thermocouples/sensors, with the least count of ±0.5%, are attached to the rear end of the panel along the central line, spaced equally from one end to the other. Also, four thermocouples are connected to the PV panel’s top side. Four temperature sensors are used to record the working fluid’s temperature. The panel’s front and backside temperatures were calculated by averaging all the attached thermocouples. Several parameters, such as ambient temperature, humidity, and wind velocity, were obtained from the Solar Radiation Resource Assessment (SRRA) station of KNIT Sultanpur. In the experiment, flow rates of 3, 6, 9, and 12 LPM were controlled using the flow meter. Table 2 presents the detailed specifications of the PV module, and Table 3 shows the nanoparticle properties.

Table 2.
Specifications of PV module.

Table 3.
Properties of the nanoparticle.
4. Results and Discussion
An experimental set-up was fabricated and installed on the roof of the academic building at KNIT, Sultanpur. Experimental data were recorded from 15 April 2022 to 15 May 2022, between 8:00 a.m. and 6:00 p.m. The 1–2, 1–3, 1–4, and 1–5 pairs of experimental cases were recorded on four different days with clear skies and the assumption of no significant difference in atmospheric conditions (ambient temperature and solar energy). The average values of different parameters for case 1 are compared with the similar parameters for cases 2, 3, 4, and 5 at a flow rate of 3 LPM for the working fluid. The investigation was repeated for three additional four-day for flow rates (6, 9, and 12 LPM). Ambient data was recorded for one month, and solar radiation and ambient temperatures were plotted for four arbitrary days with daytime shown in Figure 5a–d. The peak solar radiation and ambient temperature were recorded between 11:30 a.m. and 1:30 p.m. Solar radiation increased until between 12:00 and 1:30 p.m. and then began to decline. The maximum incident solar intensity on the PV and PVT was between 898 W/m² and 964 W/m². The highest ambient temperature recorded was 42.5 °C.
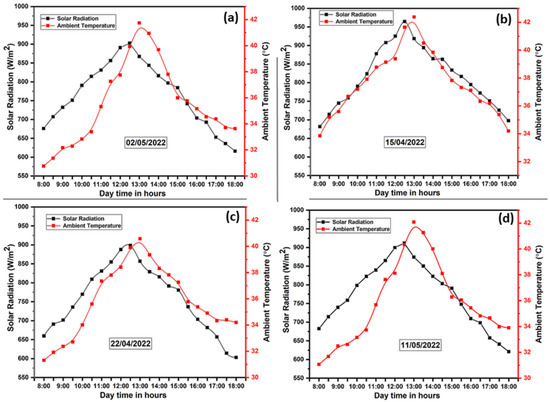
Figure 5.
Selected day’s solar radiation and ambient temperature with daytime.
The cell temperature values at a different time of daylight in all cases, such as case 1 and for cases 2, 3, 4, and 5, at different flow rates (i.e., 3 LPM, 6 LPM, 9 LPM, 12 LPM) are recorded and presented in Figure 6. Figure 6a shows the cell temperature (°C) for case 1 and cases 2, 3, 4, and 5 (at 3 LPM), and its maximum cell temperature was recorded as 69.2, 56.9, 51.5, 50.0, and 53.9 °C, respectively, at midday. Similarly, Figure 6b–d shows the PV temperature for case 1 and cases 2, 3, 4, and 5 at a flow rate of 6, 9, and 12 LPM. The maximum PV cell temperature (°C) was recorded for case 1 and cases 2, 3, 4, and 5 as 69.7, 57.5, 51.1, 49.5, and 54.5 °C (at a flow rate of 6 LPM), 70.4, 58.0, 50.5, 49.0, and 55.0 °C (at a flow rate of 9 LPM), and 68.9, 56.3, 49.6, 46.4, and 51.6 °C (at a flow rate of 12 LPM), respectively, at midday. An increase in the nanoparticle concentration by up to 0.15% has improved the decline in PV temperature. However, a further increase in the weight fraction of nanoparticles reduces the stability of nano-fluids due to the high chance of agglomeration of nanoparticles. The maximum PV surface temperature drop of 22.5 °C is recorded at a 12 LPM flow rate, while temperature drops of 21.3 °C, 20.3 °C, and 19.2 °C are obtained at 9, 6, and 3 LPM, respectively, for a 0.15% concentration of MgO nanoparticles. A reduced PV surface temperature with an increased flow rate is due to the movement of a large amount of working fluid across the Cu-tube in a shorter time, which extracts more thermal energy from the PVT system and causes a fall in PV cell temperature.
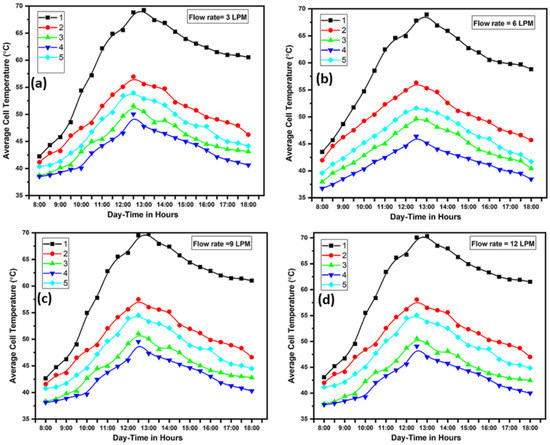
Figure 6.
Recorded cell temperature at different daytime and flow rates for cases 1, 2, 3, 4, and 5.
4.1. PV Power and Its Efficiency
Figure 7 illustrates the variations in recorded PV power output at different times of the day for the analyzed cases at different flow rates (i.e., 3 LPM, 6 LPM, 9 LPM, 12 LPM). Figure 7a shows the recorded maximum electrical power at midday for case 1 and cases 2, 3, 4, and 5 at a flow rate of 3 LPM as 133.42, 136.89, 141.59, 145.32, and 141.92 W, respectively. Similarly, Figure 7b–d shows the highest electrical power for case 1 and cases 2, 3, 4, and 5 at a flow rate of 6 LPM, 9 LPM, and 12 LPM. The maximum PV power output at midday is recorded for case 1 and cases 2, 3, 4, and 5 as 129.69, 134.49, 141.45, 147.78, and 140.32 W for 6 LPM; 126.53, 131.49, 141.45, 147.78, and 140.32 W for 9 LPM; 129.13, 130.95, 140.11, 150.04, and 137.17 W at 12 LPM, respectively.
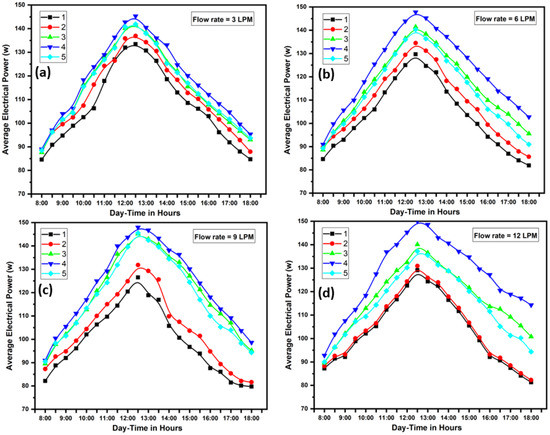
Figure 7.
Calculated electrical power for cases 1, 2, 3, 4, and 5 at different daytime and flowrate.
The electrical power of the PV at a flow rate of 12 LPM for cases 2, 3, 4, and 5 was increased by 1.82 W, 10.98 W, 20.91 W, and 8.04 W, respectively, compared to case 1. Case 4, with a 0.15% nano-fluid concentration, exhibited the highest electrical power output among all the PVT systems. Furthermore, it can be observed that a 0.15 wt.% concentration of nano-fluid at a flow rate of 12 LPM has the most significant impact on improving PV power output. Figure 8 shows the variation in electrical efficiency (%) at different flow rates (3 LPM, 6 LPM, 9 LPM, 12 LPM) for case 1 and cases 2, 3, 4, and 5 at different times of the day. The highest electrical efficiency at midday for case 1 and cases 2, 3, 4, and 5 at 3 LPM was recorded as 11.37%, 11.85%, 13.04%, 13.54%, and 12.87%, respectively, as represented in Figure 8a.
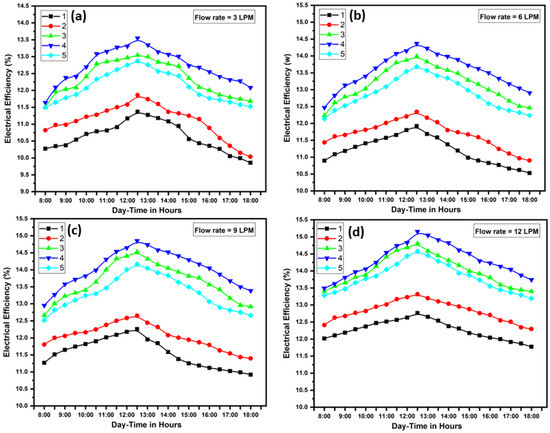
Figure 8.
Calculated electrical efficiency for cases 1, 2, 3, 4, and 5 at different daytime and flow rate.
Figure 8b–d shows the maximum electrical efficiency at midday for cases 1 and 2, 3, 4, and 5 at 6 LPM, 9 LPM, and 12 LPM. The maximum electrical efficiency (%) at midday for case 1 and cases 2, 3, 4, and 5 was recorded as 11.92%, 12.34%, 13.98%, 14.36%, and 14.16% at 6 LPM; 12.25%, 12.65%, 14.53%, 14.85%, and 14.15% at 9 LPM; and 12.76%, 13.31%, 14.80%, 15.15%, and 14.15% at 12 LPM, respectively.
The highest electrical efficiency was obtained for case 4 in all flow rates of the PVT system integrated with MgO nano-fluid because the optimum concentration of MgO in the nano-fluid effectively increases the electrical efficiency of PVT systems. In the PVT system, heat transfer is enhanced by extracting heat from PVT by using the working fluid at different flow velocities and discarding heat in the radiator. The MgO nanofluid-based PVT module produces higher electrical efficiency because of the decrease in cell temperature of the PVT systems. The improvement in electrical efficiency for cases 2, 3, 4, and 5 were 0.65%, 2.04%, 2.39%, and 1.39%, respectively, at 12 LPM compared to case 1, as shown in Figure 8.
Figure 9 represents the variation in electrical efficiency for case 4 (0.15 wt.% of MgO) at different flow rates (3, 6, 9, 12 LPM) and different times of the day. The maximum electrical efficiency in case 4 (0.15 wt.% of MgO) at 3 LPM, 6 LPM, 9 LPM, and 12 LPM was recorded as 13.54%, 14.36%, 14.85%, and 15.15%, respectively, at the highest solar radiation. It has been detected from Figure 9 that the electrical efficiency improves by enhancing the flow rate of the flowing fluid. The maximum PVT system electrical efficiency was obtained at 12 LPM MgO nano-fluid flow rate followed by 9 LPM, 6 LPM, and 3 LPM. The maximum PVT system electrical efficiency was obtained as 15.15% for case 4 of this study.
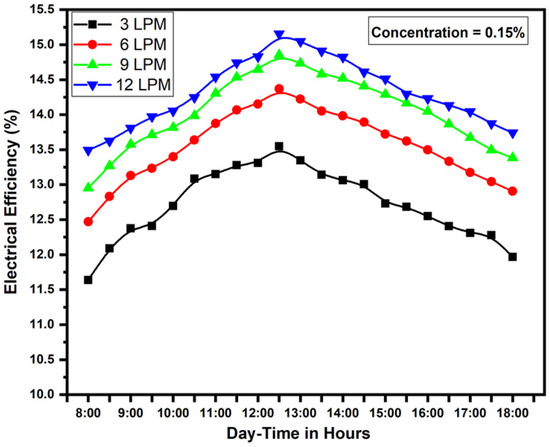
Figure 9.
Electrical efficiency for 0.15% concentration at different daytime and different flow rates.
4.2. Thermal and Overall Efficiency
Figure 10 represents the variation in thermal efficiency (%) for cases 2, 3, 4, and 5 of the PVT system at different flow rates (i.e., 3, 6, 9, 12 LPM) and daytime. Figure 10a illustrates the thermal efficiency PVT system for cases 2, 3, 4, and 5 at a flow rate of 3 LPM, and the maximum thermal efficiency was obtained as 33.40%, 42.46%, 43.59%, and 40.33%, respectively, during the period from 14:30 HRS to 16:30 HRS of daytime. Figure 10b–d illustrates the thermal efficiency PVT system for cases 2, 3, 4, and 5 at 6 LPM, 9 LPM, and 12 LPM flow rates. The maximum thermal efficiency PVT system was recorded as 37.35%, 44.86%, 46.57%, and 42.16% for 6 LPM; 37.82%, 46.04%, 47.75%, and 42.16% for 9 LPM; and 41.26%, 47.27%, 48.83%, and 44.51% for 12 LPM, respectively, for cases 2, 3, 4, and 5, during the period from 14:30 HRS to 16:30 HRS of daytime. The thermal efficiency of PVT systems is improved by enhancing the working fluid flow rate because the heat transport capacity increases at higher flow rates and optimum MgO concentration. The highest thermal efficiency was recorded in case 4 (at 0.15% MgO) for all the PVT systems. The optimum MgO concentration for maximum thermal efficiency was found to be 0.15%, and at this concentration, the thermal efficiency of case 4 was improved by 48.83% at a flow rate of 12 LPM compared to case 1.
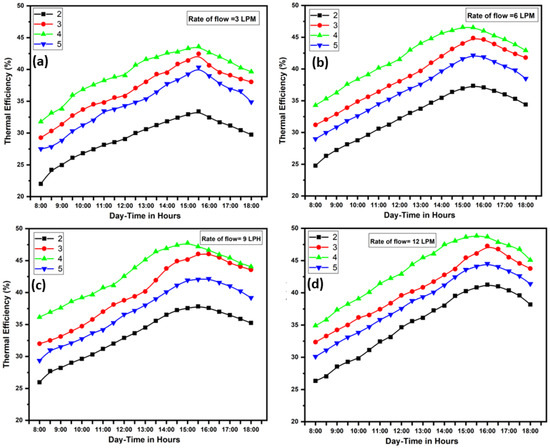
Figure 10.
Calculated thermal efficiency for cases 2, 3, 4, and 5 at different daytime and flow rates.
Figure 11 represents the variation of overall efficiency at different flow rates (i.e., 3 LPM, 6 LPM, 9 LPM, 12 LPM) for cases 2, 3, 4, and 5 at different daytimes. Figure 11a represents the overall efficiency for cases 2, 3, 4, and 5 at 3 LPM, and the maximum overall efficiency was obtained as 44.55%, 54.56%, 56.28%, and 52.21%, respectively, between 14:30 HRS and 16:30 HRS of daytime. Figure 11b–d represents the overall efficiency at flow rates of 6 LPM, 9 LPM, and 12 LPM for cases 2, 3, 4, and 5. The maximum overall efficiency (%) was obtained as 48.95%, 58.02%, 60.30%, and 54.96% for 6 LPM; 49.69%, 59.80%, 62.04%, and 55.43% for 9 LPM; 53.97%, 61.08%, 63.16%, and 58.07% for 12 LPM, respectively, between 14:30 HRS and 16:30 HRS of daytime for cases 2, 3, 4, and 5. The overall efficiency of PVT is maximum at a concentration of 0.15% (case 4) and for all flow rates (i.e., 3, 6, 9, and 12 LPM) at different daytime. Figure 12 represents the variation in overall efficiency at different flow rates (i.e., 3, 6, 9, and 12 LPM) at a concentration of 0.15% of MgO (case 4) at different daytime. The maximum overall efficiencies (%) at 3 LPM, 6 LPM, 9 LPM, and 12 LPM were recorded as 56.28%, 60.30%, 62.04%, and 63.16%, respectively, between 14:30 HRS and 16:30 HRS of daytime. The overall efficiency of MgO nano-fluid at concentrations of 0.15% and flow rates 3 LPM, 6 LPM, 9 LPM, and 12 LPM compared to water is enhanced by 11.73%, 11.35%, 12.35%, and 9.19%, respectively.
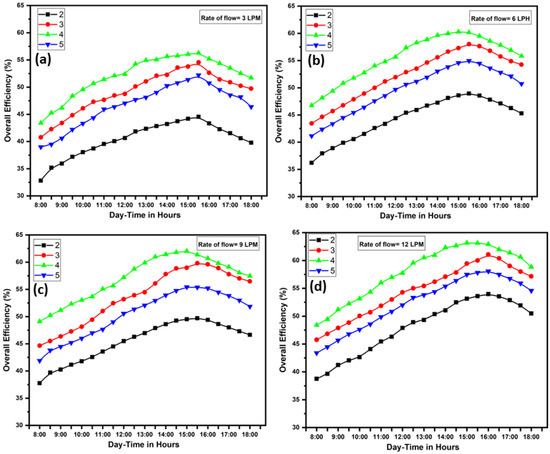
Figure 11.
Calculated overall efficiency for all cases 2, 3, 4, and 5 at different daytime and flow rates.
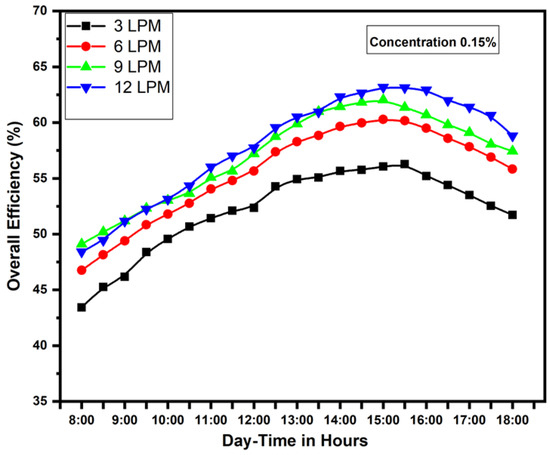
Figure 12.
Calculation of overall efficiency for 0.15% concertation at different day times and flow rates.
5. Conclusions
The study found that using PVT systems can effectively reduce the temperature of the solar PV module. The most significant reduction in cell temperature was observed in case 4, with a 12 LPM flow rate during peak time, with a recorded reduction of approximately 22.54 °C. Furthermore, the study noted that different cases of the PVT system had varying capabilities in reducing solar PV cell temperature. Increasing the flow rate generally led to a reduction in cell temperature across all cases.
- This finding suggests that using PVT technology with nanofluid-based cooling can significantly improve the electrical efficiency of solar PV modules compared to traditional PV technology. Specifically, in the case of the PVT module studied, electrical efficiency was increased from 12.76% to 15.15% at a 12 LPM flow rate. This improvement in electrical efficiency can be attributed to the ability of the nano-fluid to extract thermal energy from the solar PV cells more effectively, thereby reducing their operating temperature and increasing their electrical output;
- The thermal efficiency of the MgO nano-fluid-based PVT system is 10% higher than the water-based PVT system in case 4 at a 12 LPM flow rate;
- The MgO nano-fluid-based PVT system obtained the highest overall efficiency at 0.15% concentration and 12 LPM flow rate. The enhancement in overall efficiency at different flow rates 3, 6, 9, and 12 LPM for case 4 was recorded as 9.19%, 11.35%, 11.73%, and 12.35% compared to water.
It can be concluded that MgO nanofluid-based PVT provides better performance than water-based PVT systems. The optimal concentration of MgO concentration for better performance is 0.15%.
Author Contributions
Conceptualization, S.S., R.K.S. and G.N.T.; methodology, S.S., R.K.S. and G.N.T.; software, S.S., R.K.S. and G.N.T.; validation, S.S., R.K.S. and G.N.T.; formal analysis, S.S., R.K.S. and G.N.T.; investigation, S.S., R.K.S. and G.N.T.; resources, S.S., R.K.S. and G.N.T.; data curation, S.S., R.K.S. and G.N.T.; writing—original draft preparation, S.S.; writing—review and editing, S.S., R.K.S. and G.N.T.; visualization, S.S., R.K.S. and G.N.T.; supervision, R.K.S. and G.N.T.; project administration, A.K. and V.K.; funding acquisition, A.K. and V.K. All authors have read and agreed to the published version of the manuscript.
Funding
This research received no external funding.
Data Availability Statement
All data are available with the corresponding authors.
Conflicts of Interest
The authors declare no conflict of interest.
Nomenclature
| PV | photo Voltaic |
| PVT | photovoltaic Thermal |
| LPM | liter per minute |
| volume fraction of the nanoparticle in nano-fluid | |
| mass of the nanoparticles | |
| density of the nanoparticles | |
| mass and density of the base fluid | |
| mass and density of the base fluid | |
| density of nano-fluid | |
| electrical efficiency | |
| amount of solar energy converted into electrical energy to produce the maximum power | |
| solar intensity | |
| open-circuit voltage | |
| the short circuit current | |
| FF | the fill factor |
| the area of the PV module | |
| the solar intensity | |
| thermal efficiency | |
| mass flow rate of working fluid | |
| the heat capacity of the working fluid | |
| outlet fluid temperature | |
| fluid inlet temperature |
References
- Bunani, S.; Yörükoğlu, E.; Yüksel, Ü.; Kabay, N.; Yüksel, M.; Sert, G. Application of reverse osmosis for reuse of secondary treated urban wastewater in agricultural irrigation. Desalination 2015, 364, 68–74. [Google Scholar] [CrossRef]
- Hossain, M.K.; Strezov, V.; Yin Chan, K.; Nelson, P.F. Agronomic properties of wastewater sludge biochar and bioavailability of metals in production of cherry tomato (Lycopersicon esculentum). Chemosphere 2010, 78, 1167–1171. [Google Scholar] [CrossRef]
- Patel, R.V.; Gajera, R.; Vyas, B.G.; Labhasetwar, P.; Yadav, A. Compendium of technologies for the treatment of reverse osmosis concentrate from inland desalination plants. Chem. Pap. 2023. [Google Scholar] [CrossRef]
- Labhasetwar, P.K.; Yadav, A. Membrane Based Point-of-Use Drinking Water Treatment Systems; IWA Publishing: London, UK, 2023. [Google Scholar] [CrossRef]
- Gu, Q.; Li, S.; Gong, W.; Ning, B.; Hu, C.; Liao, Z. L-SHADE with parameter decomposition for photovoltaic modules parameter identification under different temperature and irradiance. Appl. Soft Comput. 2023, 143, 110386. [Google Scholar] [CrossRef]
- Dubey, S.; Tiwari, G.N. Analysis of PV/T flat plate water collectors connected in series. Sol. Energy 2009, 83, 1485–1498. [Google Scholar] [CrossRef]
- Huang, M.J.; Eames, P.C.; Norton, B.; Hewitt, N.J. Natural convection in an internally finned phase change material heat sink for the thermal management of photovoltaics. Sol. Energy Mater. Sol. Cells 2011, 95, 1598–1603. [Google Scholar] [CrossRef]
- Yousefi, T.; Veysi, F.; Shojaeizadeh, E.; Zinadini, S. An experimental investigation on the effect of Al2O3–H2O nanofluid on the efficiency of flat-plate solar collectors. Renew. Energy 2012, 39, 293–298. [Google Scholar] [CrossRef]
- Hasanuzzaman, M.; Abdulmunem, A.R.; Noman, A.H.; Hussien, H.A. Enhance photovoltaic/thermal system performance by using nanofluid. In Proceedings of the 3rd IET International Conference on Clean Energy and Technology (CEAT) 2014, Institution of Engineering and Technology, Kuching, Malaysia, 24–26 November 2014. [Google Scholar] [CrossRef]
- Hasan, A.; McCormack, S.J.; Huang, M.J.; Sarwar, J.; Norton, B. Increased photovoltaic performance through temperature regulation by phase change materials: Materials comparison in different climates. Sol. Energy 2015, 115, 264–276. [Google Scholar] [CrossRef]
- Ghadiri, M.; Sardarabadi, M.; Pasandideh-fard, M.; Moghadam, A.J. Experimental investigation of a PVT system performance using nano ferrofluids. Energy Convers. Manag. 2015, 103, 468–476. [Google Scholar] [CrossRef]
- Al-Shamani, A.N.; Sopian, K.; Mat, S.; Hasan, H.A.; Abed, A.M.; Ruslan, M.H. Experimental studies of rectangular tube absorber photovoltaic thermal collector with various types of nanofluids under the tropical climate conditions. Energy Convers. Manag. 2016, 124, 528–542. [Google Scholar] [CrossRef]
- Yazdanifard, F.; Ebrahimnia-Bajestan, E.; Ameri, M. Investigating the performance of a water-based photovoltaic/thermal (PV/T) collector in laminar and turbulent flow regime. Renew. Energy 2016, 99, 295–306. [Google Scholar] [CrossRef]
- Sardarabadi, M.; Passandideh-Fard, M. Experimental and numerical study of metal-oxides/water nanofluids as coolant in photovoltaic thermal systems (PVT). Sol. Energy Mater. Sol. Cells 2016, 157, 533–542. [Google Scholar] [CrossRef]
- Ghaderian, J.; Sidik, N.A.C. An experimental investigation on the effect of Al2O3/distilled water nanofluid on the energy efficiency of evacuated tube solar collector. Int. J. Heat Mass Transf. 2017, 108, 972–987. [Google Scholar] [CrossRef]
- Hjerrild, N.E.; Mesgari, S.; Crisostomo, F.; Scott, J.A.; Amal, R.; Taylor, R.A. Hybrid PV/T enhancement using selectively absorbing Ag-SiO2/carbon nanofluids. Sol. Energy Mater. Sol. Cells 2016, 147, 281–287. [Google Scholar] [CrossRef]
- Al-Waeli, A.H.A.; Sopian, K.; Chaichan, M.T.; Kazem, H.A.; Hasan, H.A.; Al-Shamani, A.N. An experimental investigation of SiC nanofluid as a base-fluid for a photovoltaic thermal PV/T system. Energy Convers. Manag. 2017, 142, 547–558. [Google Scholar] [CrossRef]
- Soltani, S.; Kasaeian, A.; Sarrafha, H.; Wen, D. An experimental investigation of a hybrid photovoltaic/thermoelectric system with nanofluid application. Sol. Energy 2017, 155, 1033–1043. [Google Scholar] [CrossRef]
- Hasan, H.A.; Sopian, K.; Jaaz, A.H.; Al-Shamani, A.N. Experimental investigation of jet array nanofluids impingement in photovoltaic/thermal collector. Sol. Energy 2017, 144, 321–334. [Google Scholar] [CrossRef]
- Sardarabadi, M.; Passandideh-Fard, M.; Maghrebi, M.J.; Ghazikhani, M. Experimental study of using both ZnO/water nanofluid and phase change material (PCM) in photovoltaic thermal systems. Sol. Energy Mater. Sol. Cells 2017, 161, 62–69. [Google Scholar] [CrossRef]
- Al-Waeli, A.H.; Sopian, K.; Chaichan, M.T.; Kazem, H.A.; Ibrahim, A.; Mat, S.; Ruslan, M.H. Evaluation of the nanofluid and nano-PCM based photovoltaic thermal (PVT) system: An experimental study. Energy Convers. Manag. 2017, 151, 693–708. [Google Scholar] [CrossRef]
- Nasrin, R.; Rahim, N.A.; Fayaz, H.; Hasanuzzaman, M. Water/MWCNT nanofluid based cooling system of PVT: Experimental and numerical research. Renew. Energy 2018, 121, 286–300. [Google Scholar] [CrossRef]
- Rostami, Z.; Rahimi, M.; Azimi, N. Using high-frequency ultrasound waves and nanofluid for increasing the efficiency and cooling performance of a PV module. Energy Convers. Manag. 2018, 160, 141–149. [Google Scholar] [CrossRef]
- Fayaz, H.; Nasrin, R.; Rahim, N.A.; Hasanuzzaman, M. Energy and exergy analysis of the PVT system: Effect of nanofluid flow rate. Sol. Energy 2018, 169, 217–230. [Google Scholar] [CrossRef]
- Mousavi, S.; Kasaeian, A.; Shafii, M.B.; Jahangir, M.H. Numerical investigation of the effects of a copper foam filled with phase change materials in a water-cooled photovoltaic/thermal system. Energy Convers. Manag. 2018, 163, 187–195. [Google Scholar] [CrossRef]
- Al-Waeli, A.H.A.; Sopian, K.; Yousif, J.H.; Kazem, H.A.; Boland, J.; Chaichan, M.T. Artificial neural network modeling and analysis of photovoltaic/thermal system based on the experimental study. Energy Convers. Manag. 2019, 186, 368–379. [Google Scholar] [CrossRef]
- Fatima, H.; Tiwari, G.N. Theoretical validation of photovoltaic thermal (PVT) module with a copper base for thermal and electrical performance. J. Renew. Sustain. Energy 2019, 11, 043704. [Google Scholar] [CrossRef]
- Das, S.S.; Kumar, P.; Sandhu, S.S. Hybrid photovoltaic-thermal systems utilizing liquid-gas phase change material. Energy Sources Part A Recovery Util. Environ. Eff. 2021, 43, 2896–2914. [Google Scholar] [CrossRef]
- Hassan, A.; Wahab, A.; Qasim, M.A.; Janjua, M.M.; Ali, M.A.; Ali, H.M.; Jadoon, T.R.; Ali, E.; Raza, A.; Javaid, N. Thermal management and uniform temperature regulation of photovoltaic modules using hybrid phase change materials-nanofluids system. Renew. Energy 2020, 145, 282–293. [Google Scholar] [CrossRef]
- Mahmood Alsalame, H.A.; Lee, J.H.; Lee, G.H. Performance Evaluation of a Photovoltaic Thermal (PVT) System Using Nanofluids. Energies 2021, 14, 301. [Google Scholar] [CrossRef]
Disclaimer/Publisher’s Note: The statements, opinions and data contained in all publications are solely those of the individual author(s) and contributor(s) and not of MDPI and/or the editor(s). MDPI and/or the editor(s) disclaim responsibility for any injury to people or property resulting from any ideas, methods, instructions or products referred to in the content. |
© 2023 by the authors. Licensee MDPI, Basel, Switzerland. This article is an open access article distributed under the terms and conditions of the Creative Commons Attribution (CC BY) license (https://creativecommons.org/licenses/by/4.0/).