Article

An Evaluation of Radon in Drinking Water Supplies in Major Cities of the Province of Chimborazo, Central Andes of Ecuador

by
Jheny Orbe
1,
José Luis Herrera-Robalino
1,
Gabriela Ureña-Callay
1,
Jonatan Telenchano-Ilbay
2,
Shirley Samaniego-León
3,
Augusto Fienco-Bacusoy
4,
Andrea Cando-Veintimilla
5 and
Theofilos Toulkeridis
6,*
1
Escuela Superior Politécnica de Chimborazo (ESPOCH), Riobamba 060101, Ecuador
2
Centro de Imagen Castro Sanchez Cindy Mireya, Riobamba 060110, Ecuador
3
Colegio de Bachillerato Bernardo Dávalos León, Riobamba 060104, Ecuador
4
Unidad Educativa República del Ecuador, Jipijapa 130301, Ecuador
5
Universidad de Alicante, 03690 Alicante, Spain
6
Universidad de las Fuerzas Armadas ESPE, Av. General Rumiñahui S/N, Sangolquí 171103, Ecuador
*
Author to whom correspondence should be addressed.
Water 2023, 15(12), 2255; https://doi.org/10.3390/w15122255
Submission received: 14 May 2023 / Revised: 12 June 2023 / Accepted: 13 June 2023 / Published: 16 June 2023
(This article belongs to the Section Water Quality and Contamination)

Abstract

:
The activity concentrations of 222Rn were measured in 53 public water supplies of underground (50) and surface (3) origin, and the relation of such with five geological units where these supplies are located, in the central Ecuadorian Andes, was also explored. These units supply drinking water to 10 cities, located between the 1500 and 3120 m.a.s.l. The experimental setup consisted of the RAD7 radon detector and the RAD H2O degassing system. The 222Rn levels measured in groundwater ranged from 0.53 to 14.78 Bq/L while surface waters did not indicate detectable radon levels. The radon concentrations were below the parametric value of 100 Bq/L for water intended for human consumption, recommended by the European Atomic Energy Community (EURATOM) in its Directive 2013/51, and the alternative maximum contamination level (AMCL) of 150 Bq/L, proposed by the Environmental Protection Agency (EPA). The Pisayambo Volcanic unit, mapped as intermediate volcaniclastic to felsic deposits, presented a mean radon concentration higher than the other geological units and lithologies (9.58 ± 3.04 Bq/L). The Cunupogyo well (11.36 ± 0.48 Bq/L) presented a radon concentration more than 70% higher than the neighboring springs, which may be explained by its proximity to the Pallatanga geological fault. The maximum annual effective doses, by cities, due to the ingestion and inhalation of radon, ranged from 0.010 to 0.108 mSv and from 0.008 to 0.091 mSv, respectively; therefore, these waters do not represent a risk to the health of the population. In addition, a correlation was observed between the activity concentration of 222Rn and the activity concentration of the parent 226Ra in samples collected from some springs.

1. Introduction

The greatest exposure of the population to ionizing radiation is due to 222Rn, a colorless, odorless, and tasteless natural radioactive gas that is formed during the disintegration of 238U, with a known half-life of 3825 days [1,2,3,4,5]. Radon is soluble in water, and its solubility decreases rapidly with increasing temperature [6,7,8]. Drinking water supplies, which originate from groundwater in contact with rocks containing 238U or 226Ra, may contain high levels of radon, which may be the case of supplies located in volcanic areas and near tectonic faults [9,10,11,12,13]. In surface waters, such as lakes and rivers, radon is easily released into the outdoor air, so low concentrations of radon are encountered in surface drinking water supplies [14,15,16].
Radon ingested in drinking water will deliver a radiation dose to the stomach lining and other internal organs [17,18]. In situations such as showering, washing clothes, and boiling water, some of the dissolved radon is released from the water and mixed with indoor air [19,20]. This, added to radon from other sources such as soil and building materials, will result in a radiation dose to the respiratory system when the gas is inhaled [21,22,23,24,25]. The health risk posed by exposure to radon through ingestion of drinking water, is much less than that caused by inhalation of radon released into indoor air from water [26]. Radon is a known cause of lung and stomach cancer [27,28,29,30,31,32,33,34].
The European Nuclear Energy Community in the EURATOM Directive 2013/51 establishes requirements for the protection of the health of the general public, with respect to radioactive substances in water intended for human consumption, and for radon recommends a parametric value of 100 Bq/L. Corrective action is considered justified for reasons of radiological protection when radon concentrations exceed 1000 Bq/L [35]. The United States Environmental Protection Agency (EPA) in 1991 proposed a maximum contamination level (MCL) for radon of 11 Bq/L (about 300 pCi/L) in drinking water [36]. The EPA also currently recommends an alternative maximum contamination level (AMCL), which represents the concentration of radon in water that would cause an increase in indoor air radon no greater than the level of radon naturally present in outdoor air. The average outdoor air concentration across the United States is approximately 15 Bq/m3 or 405 pCi/m3. The EPA has determined that the AMCL for radon in water is approximately 150 Bq/L (4050 pCi/L). For public supplies, if the dissolved radon in the water is greater than the AMCL or is between the MCL and the AMCL, the EPA recommends reducing the radon concentration to the MCL [18,37]. Ecuador has no national regulation for radon levels in drinking water.
This study, for the first time as reported so far, focuses on determining the concentrations of radon in the drinking water supplies of the main cities of the province of Chimborazo, with the purpose of evaluating the risk to the health of the population through the calculation of the annual effective dose by ingestion and inhalation of radon dissolved in water. At the same time, a second objective was defined to relate the mean concentrations of radon with the different geological units—lithologies, which are present in the study area. Finally, a third objective was developed in order to study the relationship between the activity concentration of 222Rn and the activity concentration of its parent, 226Ra, in samples that were collected from all water sources.

2. Materials and Methods

2.1. Geology of the Study Area

The Chimborazo province is located in the northern Andes of South America, along a mountain range which includes the Western Cordillera, the Inter-Andean Depression, and Eastern Cordillera [38,39,40]. The local geology is varied in age, lithology, types of deposits, and geological environments of formation, due to the geodynamic evolution of the active continental margin [41,42,43,44,45]. The rock formations range from a late Cretaceous accretion of an allochthonous oceanic terrane towards the more stable South American craton, between the long orogenic evolution that have shaped the local Andes. The Western Cordillera in the study area is built on the oceanic plateau accreted in the Late Cretaceous, presenting a series of Late Cretaceous and Paleogene marine detrital sequences that were deposited close to the continental margin, and a long-lived, dominantly intermediate and related with magmatism of subduction origin, expressed as a continental volcanic arc since the Neogene [46,47,48,49]. The inter-Andean Depression, on the other hand, rests on the Guamote Terrane (Guasuntos Unit), which consists of sequences of marine deposits of conglomerates, turbidites, quartzites, and slates, which have been deposited from the Lower Jurassic to the Lower Cretaceous, whose source has been the continental margin [50,51]. The intermediate continental volcanic arcs, related to subduction, developed from the Oligocene, while the longitudinally sectioned inter-Andean valley developed, received, and currently receives sediments from both mountain ranges and their volcanic arc [52,53,54]. The Eastern Cordillera is the oldest and presents mainly metamorphic rocks, which vary from west to east, from an ophiolitic mélange to a proposed forearc, arc, and rear-arc from the lower Jurassic to the Cretaceous, which encompasses various lithologies that vary from mafic to ultramafic, to intermediate igneous lithologies, with their corresponding sedimentary facies. However, this range is also composed of igneous and meta-sedimentary units of Triassic to Paleozoic age, to the east, in the Sub-Andean zone [55,56,57]. Nonetheless, these units to the east of the Eastern Cordillera do not influence the present study.
The main source of 222Rn in groundwater is the radioactivity of the rocks, while the emanation coefficient depends on the type of rock, its structure, and porosity; due to the presence of water in the pore space, radon atoms can dissolve in groundwater [58,59]. The underground drinking water supplies analyzed are located in five different geological or lithological units (L1–L5). Hereby, L1 is represented by the Tarqui Volcanics of the Cisaran Formation, which includes intermediate to felsic volcaniclastic deposits, and intermediate lavas [60,61]; L2 is composed of distal facies Cotopaxi Volcanics, being intermediate, primary, reworked volcanoclastic deposits, debris avalanches, and lavas [62,63,64,65]; L3 are the Pisayambo Volcanics, being intermediate to felsic volcaniclastic deposits [66]; L4 is the Yunguilla Unit, which is composed of shales, calcareous and siliceous siltstones, as well as sandstones, bioclastic limestones, and mafic volcanoclasts [67,68]; L5 is represented by the Peltetec unit, which is an ophiolitic mélange of serpentinites, basalts, and meta basalts [69,70,71]. 
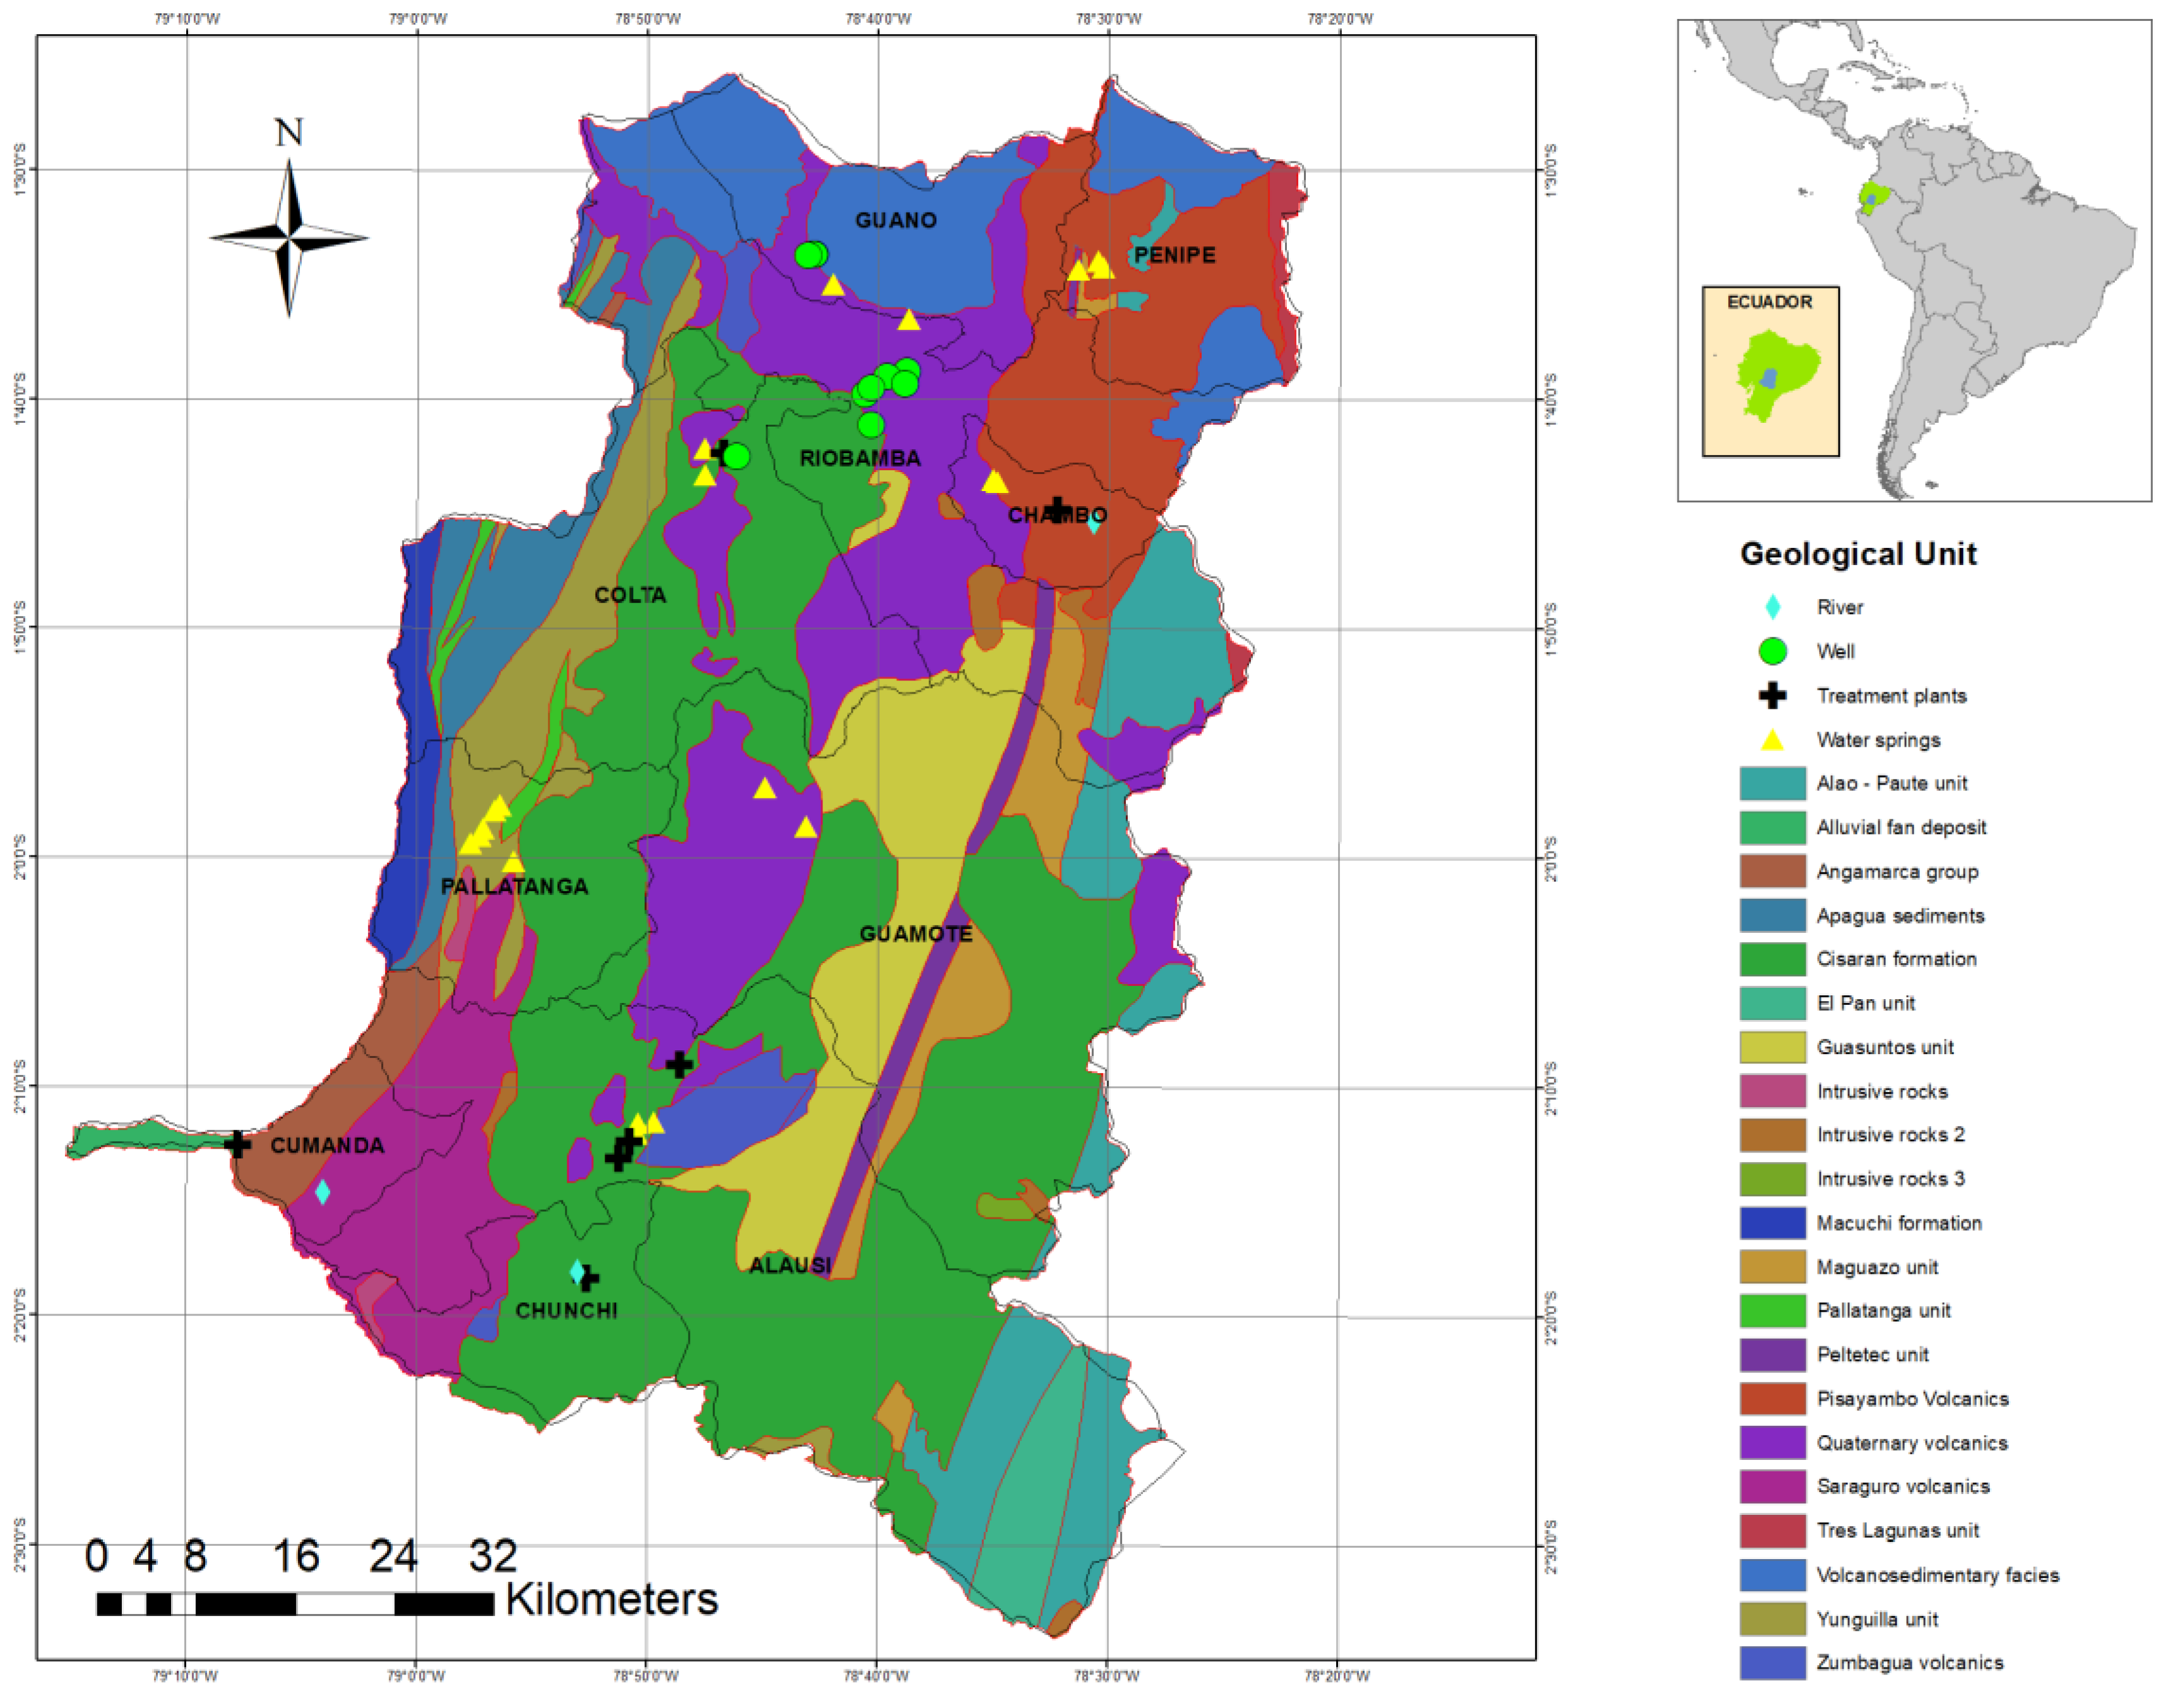
Figure 1 illustrates the geological map of the study region with the location of the sampling points.

2.2. Experimental Setup

The measurement of the 222Rn activity concentration (hereinafter, we will only use the term “radon concentration”) in the water samples was performed using the emanometric method, which consists of degassing the sample and transferring the radon from the water to the air through a system of tubes the air enriched with radon is conducted to an alpha particle detector [72,73,74]. The experimental setup consisted of the RAD7 radon detector and the RAD H2O degassing system, both manufactured by Durridge Company Inc., Billerica, MA, USA [75,76].
RAD7 is a continuous radon monitor, which uses a solid state, ion-implanted, planar, silicon, alpha detector [77,78,79]. When the daughters of radon and thoron—deposited on the detector surface—decay, they emit alpha particles, with a characteristic energy directly into the solid-state detector. The detector produces an electrical signal. Electronic circuitry amplifies the signal, and then converts it into a digital format. The RAD7′s microprocessor picks up the signal and stores it in a special place in its memory, according to the energy of the particle. The accumulation of several signals generates a spectrum. The energy range covered by the RAD 7 spectrum is 2 to 10 MeV. In the spectrum, a combination of different alpha emitters appears as a series of different peaks. The 218Po peak is centered at 6.00 MeV, while the 214Po peak is centered at 7.69 MeV. The 5.49 MeV alpha particle directly emitted by 222Rn does not appear in the RAD7 spectrum because it was created in air, not on the detector surface. The 222Rn atom is inert and electrically neutral, and cannot be attracted to the solid-state detector. Only after it decays into 218Po, the atom becomes positively charged and thus propelled towards the detector’s surface. The RAD7 spectrum indicates radon descendants, but not radon itself [80].
RAD H2O is an accessory to the RAD7 that allows to measure radon in water with a sensitivity that equals or exceeds that of liquid scintillation methods. The lower limit of detection (LLD) is less than 10 pCi/L (0.37 Bq/L) [81]. Hereby, different components of the RAD H2O kit are connected, forming a closed circuit with the RAD7 detector. The RAD-H2O method employs a closed loop aeration scheme whereby the volume of air and water are constant and independent of flow rate. The air recirculates through the water and continuously draws the radon back to an equilibrium state. The RAD-H2O system reaches this equilibrium state within about five minutes, after which no more radon can be extracted from the water. The extraction efficiency, or percentage of radon removed from the water to the air circuit, is very high, typically 99% for a 40 mL sample and 94% for a 250 mL sample [81]. The RAD-H2O requires desiccant to be used at all times to dry the airstream before it enters the RAD7. If the desiccant is not used correctly, the RAD7 can give incorrect concentrations of radon, or it can be damaged due to condensation on sensitive internal components [81].
After performing a measurement of radon in water, the RAD7′s internal cell will still contain the radon that was measured. This is of particular concern when the radon concentration from the last measurement was high relative to the next measurement. To remove radon from the RAD7 and its accessories—including the aerator head, tubing, and desiccant—as thoroughly as possible, the system must be purged. To purge the system, it is necessary to have a source of radon-free (or relatively radon-free) air or inert gas. For most occasions, ambient air is good enough. The RAD7 has the “Purge Test” command. In either case, it is also necessary to purge to remove any accumulated water vapor from the system.

2.3. Sampling Protocol

Overall, 53 water supplies that feed the drinking water systems of the 10 capital cities of the cantons, on the Chimborazo province, were monitored; of these, 50 were underground and 3 of surface origin (rivers). In Figure 1, the location of the groundwater sources are the sampling points, the yellow triangles represent the springs, the green circles the wells, and the black crosses the treatment plants, in the case of rivers. The sampling points are the places closest to the water intake that leads to the treatment plant and are represented by the light blue diamonds. Three independent samples were collected from each water source, in a short period of time and under the same experimental conditions, with the purpose of observing the variability of the results in the radon concentration and evaluating the effectiveness of the sampling protocol. Hereby, a total of 150 untreated groundwater samples were collected, of which 84 samples correspond to 28 springs, 45 samples to 15 wells, and 21 samples from 7 reservoir tanks located in the treatment plants of some cantons, where water from various sources are collected from underground springs. In addition, 9 surface water samples corresponding to 3 rivers were also collected.
The protocol for wells and springs equipped with a tap consisted of connecting a tube to the tap and letting the water run for 10 min to ensure a fresh sample, then placing the tube in a deep 4 L container until the water overflowed from the container; then, the vial was immersed in the bottom of the container and capped under water. The water sample without bubbles was then labeled with the name of the source, date, and time of sampling. In springs where the water sprouts from the ground and accumulates in catchment tanks, the water was collected in a 4 L container. The vial was submerged in the bottom of the container. It was closed under the water and once it was verified that the sample was free of bubbles, the corresponding label was applied. In rivers, the sample collection procedure was the same as in the catchment tanks. In all cases, 250 mL vials from Durridge Company were used; these have lids with an internal rubber disc that guarantee low permeability of radon and high hermeticity. The vials were previously washed and dried. The vials were transported upside down in an isothermal container. In the laboratory, the samples were kept in the refrigerator until the start of the measurement. The time elapsed between sampling and analysis is in the range from 4 to 36 h.

2.4. 222Rn Activity Concentration Measurements

The first step to determine the concentration of radon in the water sample is to purge the detection system; this procedure was performed with laboratory air for 10 to 15 min, until obtaining a relative humidity of 6%, as recommended by the manufacturer. After purging, the RAD7 was configured with the Wat-250 protocol and the vial was immediately integrated into the detection system. When starting the test, the internal pump of the RAD7 monitor runs for five minutes, aerating the sample and delivering the radon to the detector. The system waits five more minutes and then starts counting. After five minutes, it prints a short report. The same happens five minutes later, and for two more five-minute periods after that. At the end of the run (30 min after the start), the RAD7 prints a summary, yielding the radon mean and standard deviation of the four counted cycles, a bar graph of the four readings, and a cumulative spectrum. All data, except the spectrum, are also stored in the memory and can be downloaded to a computer or other device.
Considering that the samples were not immediately analyzed, the results of the concentration were corrected by decay of radon in the water. The decay correction factor (DCF) is given by the following formula:
DCF = exp (ln 2/T1/2) t
where T1/2 is the half-life of a radon atom (132.4 h) and t is the time elapsed from sampling to degassing of the sample in hours.
Finally, the weighted mean of the radon concentration in each water source was calculated, using the results of the three samples collected, with the following equation:
C w = j n w j c j ¯ j n w j   j = 1 ,   2 ,   3  
where c j ¯   is the mean concentration of radon in sample j, reported by RAD7, w j is the weight of the measurement, defined as follows:
w j   = 1 σ j 2
σ j 2 is the standard deviation of sample j, reported by RAD7.
The variance and standard deviation of the weighted mean were calculated with the following equations:
σ c 2 = 1 j n w j
σ c   = 1 j n w j    

2.5. Calculation of Effective Dose

The total annual effective dose to the population caused by the presence of radon in drinking water and its domestic use is the sum of the effective doses due to ingestion of radon dissolved in the water and inhalation of radon escaping from the water. The annual effective dose due to ingestion was calculated using Equation (6) [82]:
Eing = DCF × CRn × Va
where Eing is the annual effective dose from ingestion in Sv, DCF is the conversion factor of the ingested dose of 222Rn (10−8 Sv/Bq [83]), CRn is the radon concentration in drinking water in Bq/L, and Va is the annual volume of water consumed. To calculate the dose, a consumption of two liters per day was assumed, multiplied by the 365 days of the year; it is found that the water consumption for a standard adult drinking the same water directly from the tap is 730 L [84,85,86,87].
The inhalation dose of waterborne radon was calculated from Equation (7) [82],
Einh = DCF × CRn × T × F × t
where Einh is the annual effective inhalation dose in Sv, DCF is the conversion factor of the inhaled dose of 222Rn (22 × 10−9 Sv m3/Bq h [88]), CRn is the radon concentration in drinking water in Bq/L, T is the radon transfer coefficient from water to air, 0.1 L/m3, t is the mean annual indoor occupancy in hours, which in this study was considered 7000 h, and F is the balance factor of indoor radon daughters with a value of 0.4 [89].

2.6. Calculation of the Activity Concentration of 226Ra

The activity concentration of 226Ra (hereinafter we will only use the term “radium concentration”) was evaluated with the RAD H2O method. After we proceeded with the radon measurements in water samples (day 1), the vials were hermetically sealed in order to allow the radon concentration from radium to increase in the samples. A new measurement of radon levels was performed after 10 days, considering that after this time the radon concentration reached secular equilibrium. The calculation of the radium concentration was carried out using Equation (8) [90]:
C Ra = 1 1 e ( λ Rn ) t   C Rn
where C Rn   is the radon concentration after 10 days (Bq/L), λ Rn is the decay constant of 222Rn (1/d), and CRa is the radium concentration in the water sample.

3. Results

3.1. Activity Concentration of 222Rn

The name of the springs and wells, canton or city, geographic location, and weighted mean of the radon concentration and the geological units are presented in Table 1 and Table 2, respectively. Uncertainty of radon concentration is the standard deviation, calculated with Equation (5), using the results of the three samples collected at the same time from the water source. The spring with the highest level of radon is Catequilla on Chambo canton (14.78 Bq/L), where local geology is mapped as “Pisayambo volcanics”, consisting of volcaniclastic deposits of intermediate to felsic affinity and the Miocene-Pliocene age [91]. The well with the highest concentration of radon is Cunupogyo in the Colta canton (11.36 Bq/L); it is 150 m deep, so it is most likely within the Tarqui Unit (Cisaran Formation) of the Miocene-Pliocene age, which consists of volcaniclastic deposits of intermediate to felsic affinity and intermediate lavas, a unit that would overlie the locally unknown basement. The Cunupogyo well presents a concentration 70% greater than the Guacona and La Compañía-El Mexicano springs, located in the same canton and geological unit. It should be noted that this well is located approximately 1 km east of the Pallatanga fault, which locally is expressed on the surface as a set of dextral, inverse, normal faults, with pull apart basin-type structures and linear ridges among others, so it cannot be ruled out that there may be an influence of internal structures related to the fault with the aquifer and the considered well. In contrast, the Aypud and Gampala springs—in Alausí to the south of the province, also located in the Tarqui geological unit (Cisarán Formation)—present concentrations below the lower detection limit of the technique. This difference can be explained because this geological unit presents local variations along the country, province, and cantons, in terms of age fluctuating from the late Miocene to the early Pliocene, while its affinity varies from intermediate to felsic, presenting primary and reworked, intrusive and extrusive facies.
The results of the radon measurements in the samples from the reservoir tanks, where water from several underground springs converge, for the cities of Chunchi, Alausí, Chambo, and Cumandá, are listed in Table 3. The highest concentration was observed in the Colta (PT) reservoir of the Colta city (2.01 Bq/L), while the reservoir of the Cumandá city presented a radon level below the lower detection limit of the technique (0.37 Bq/L).
For the Chunchi, Chambo, and Cumandá cities, in addition to groundwater supplies, the water intended for human consumption is collected from the Zaguán, La Y, and Chilcay rivers, respectively. Samples from these surface waters did not present detectable levels of radon.
A descriptive statistical analysis based on the various lithologies on which the springs and wells are located is presented in Table 4. For each geological unit—lithology, the detectable minimum, the maximum radon concentration, central tendency values (mean and median)—the standard deviation and the coefficient of variation are presented. For L1 lithology, the outlier concentration from the Cunupogyo well and the values below the RAD7 detection level were not considered in the calculations. A particular case is the L5 lithology with a single spring.
Yunguilla geological unit L4 (composed of shales, calcareous and siliceous siltstones, as well as sandstones, bioclastic limestones, and mafic volcanoclasts), presented the highest variation coefficient (0.75), which implies that the variability of radon concentrations is high in relation with the mean. This geological unit corresponds to a submarine fan of late Cretaceous age, primarily consisting of mafic and possibly metamorphic components, which presents a wide variability of sediments sourced from different environments, conditions of formation, and ages.
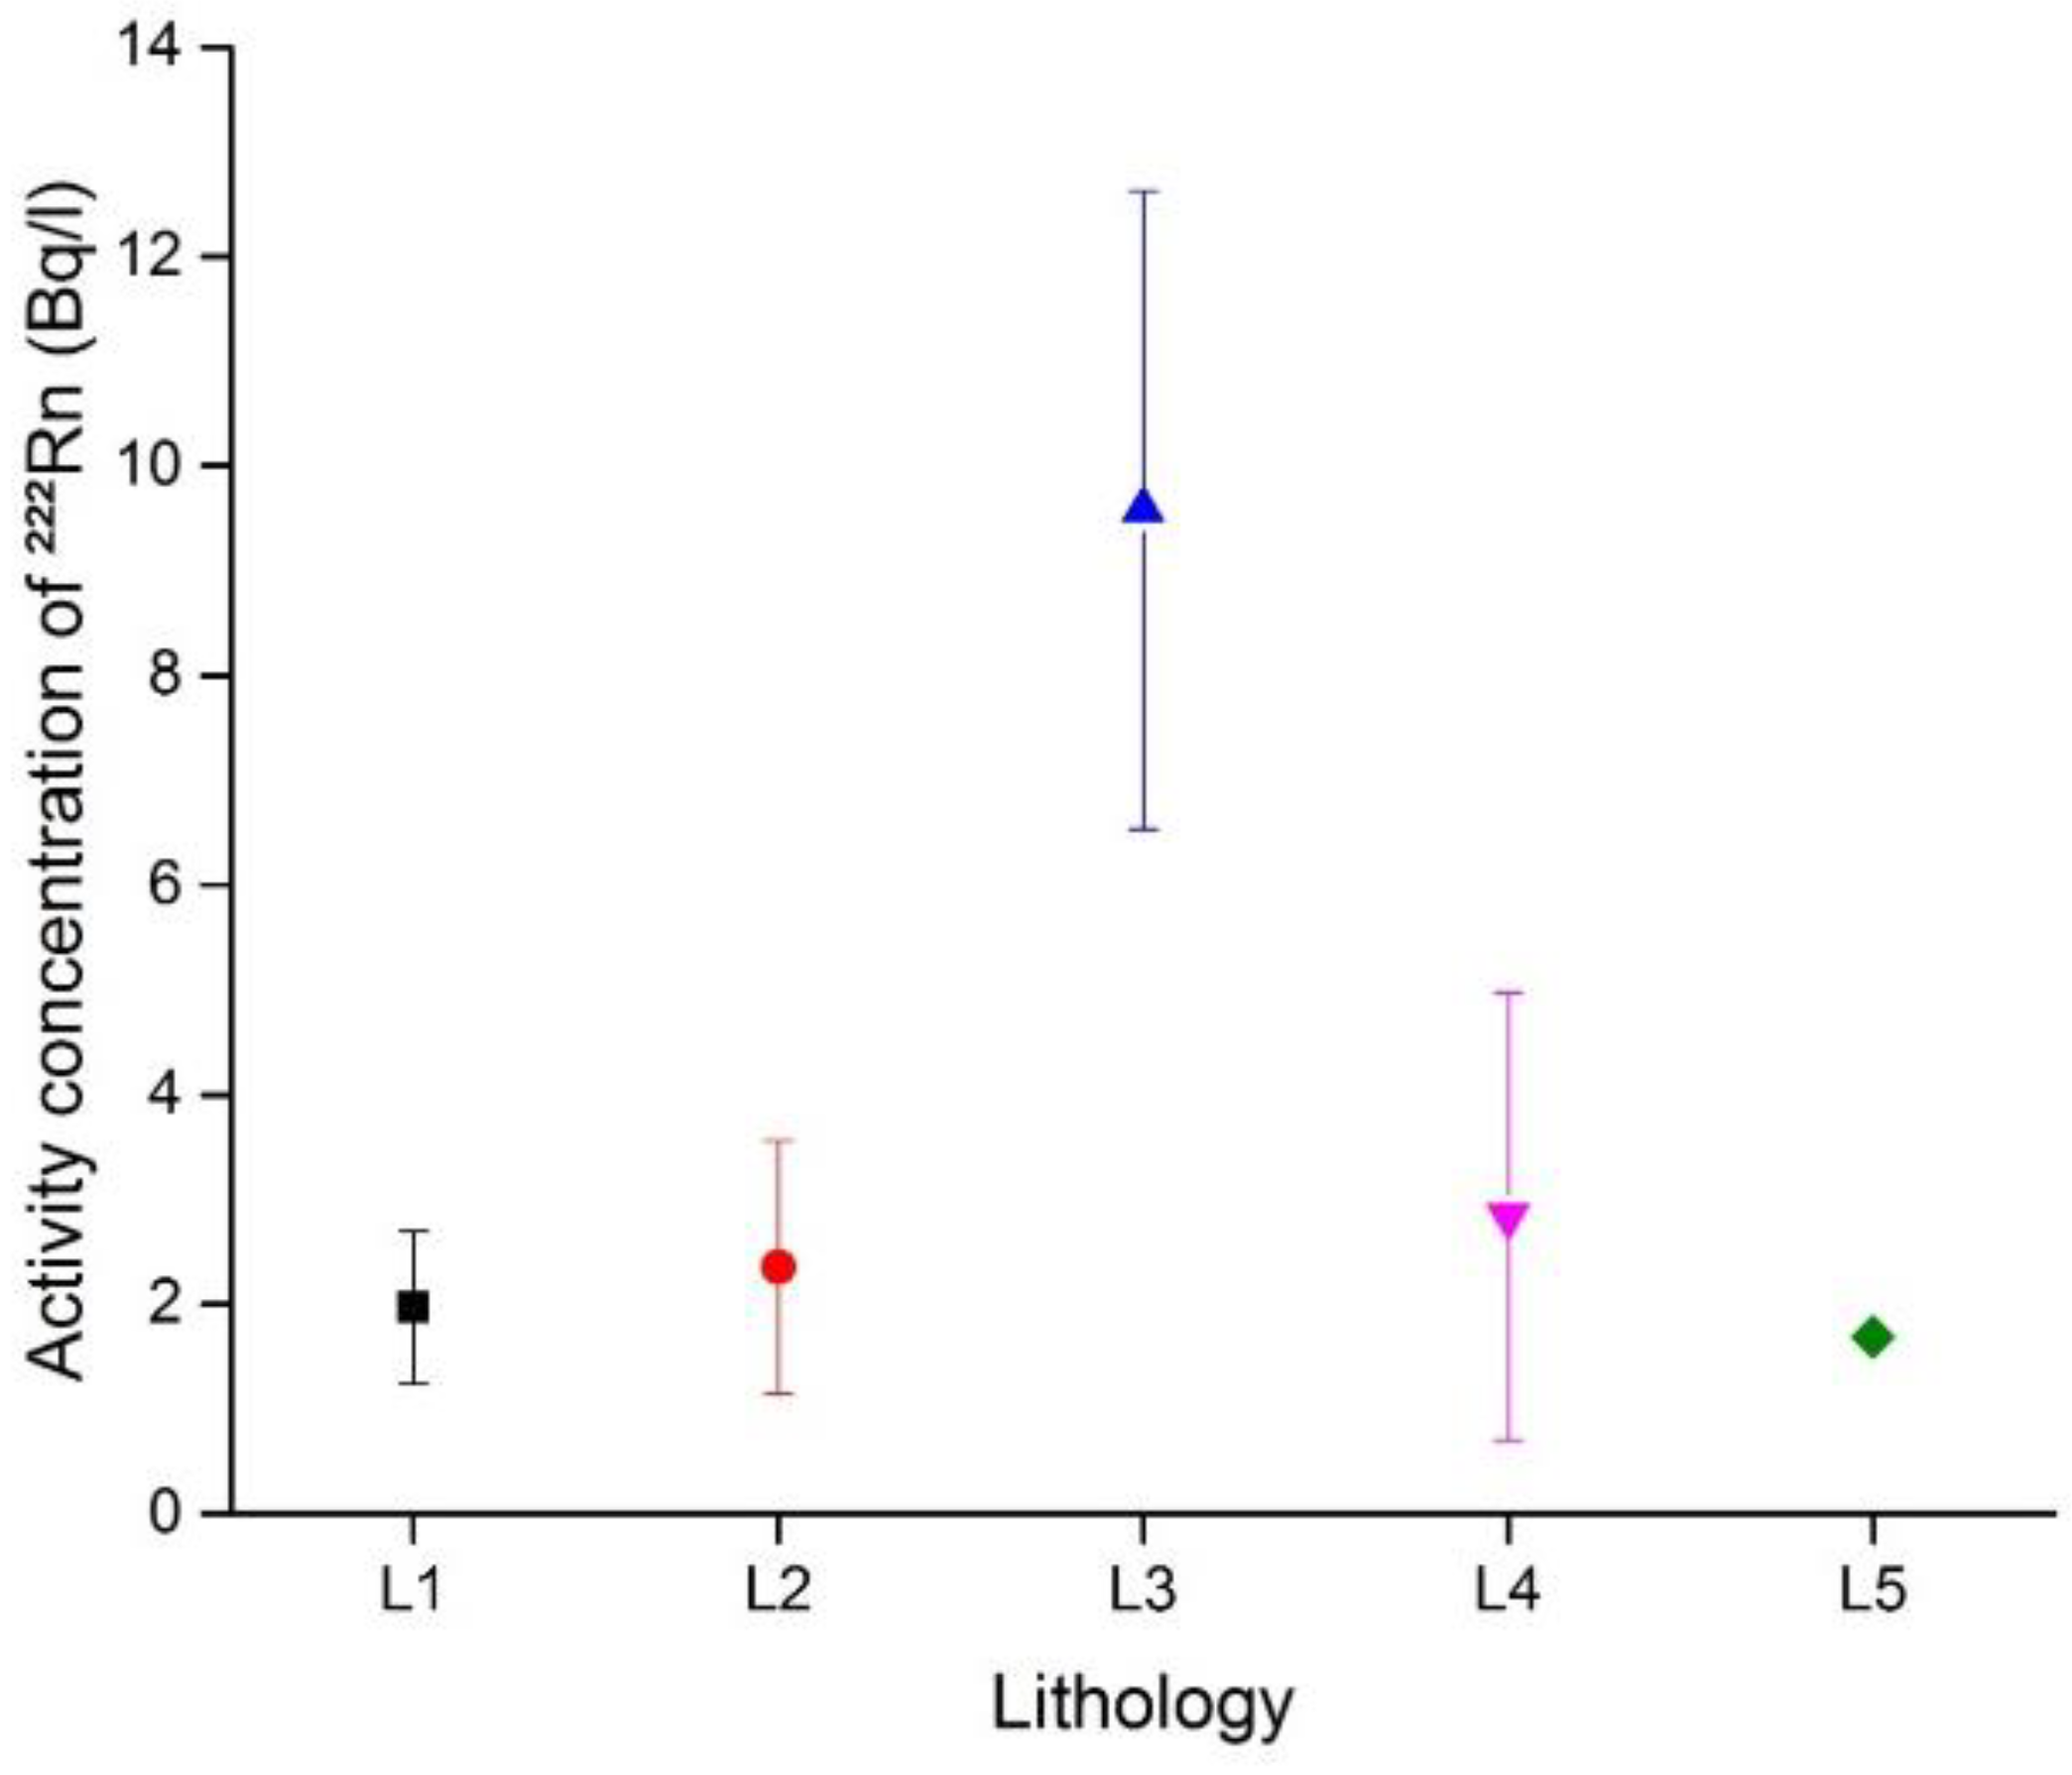
The comparison of the mean concentrations of 222Rn by each geological unit—lithology is presented in Figure 2. All lithologies present equal mean values, within uncertainties (1σ), except for lithology L3 (intermediate volcaniclastic to felsic deposits), which presents the highest mean concentration.

3.2. Evaluation of the Sampling Protocol

The sampling technique is generally the main source of error in the measurement of radon content in water. During collection, transport, and storage, a significant fraction of radon can be lost with a significant impact on the measurement results [92,93,94]. The collection of three samples in each water source allowed to evaluate the effect of the sampling on the precision of a measurement of radon in water. In all cases, the results of the three measurements were comparable and therefore the protocol used guarantees the repeatability of the measurements. Table 5 presents the radon concentrations for the Catequilla spring and the Plaza de Rastro reservoir, chosen for this analysis because they represent the high and low levels of the values observed in this research.
In the case of the Catequilla spring, the three concentrations presented a better precision, expressed in terms of percentage error, than the Plaza de Rastro reservoir. This is due to the fact that a higher concentration of radon gives a greater number of counts per minute above the RAD7 background, yielding more favorable count statistics [81].
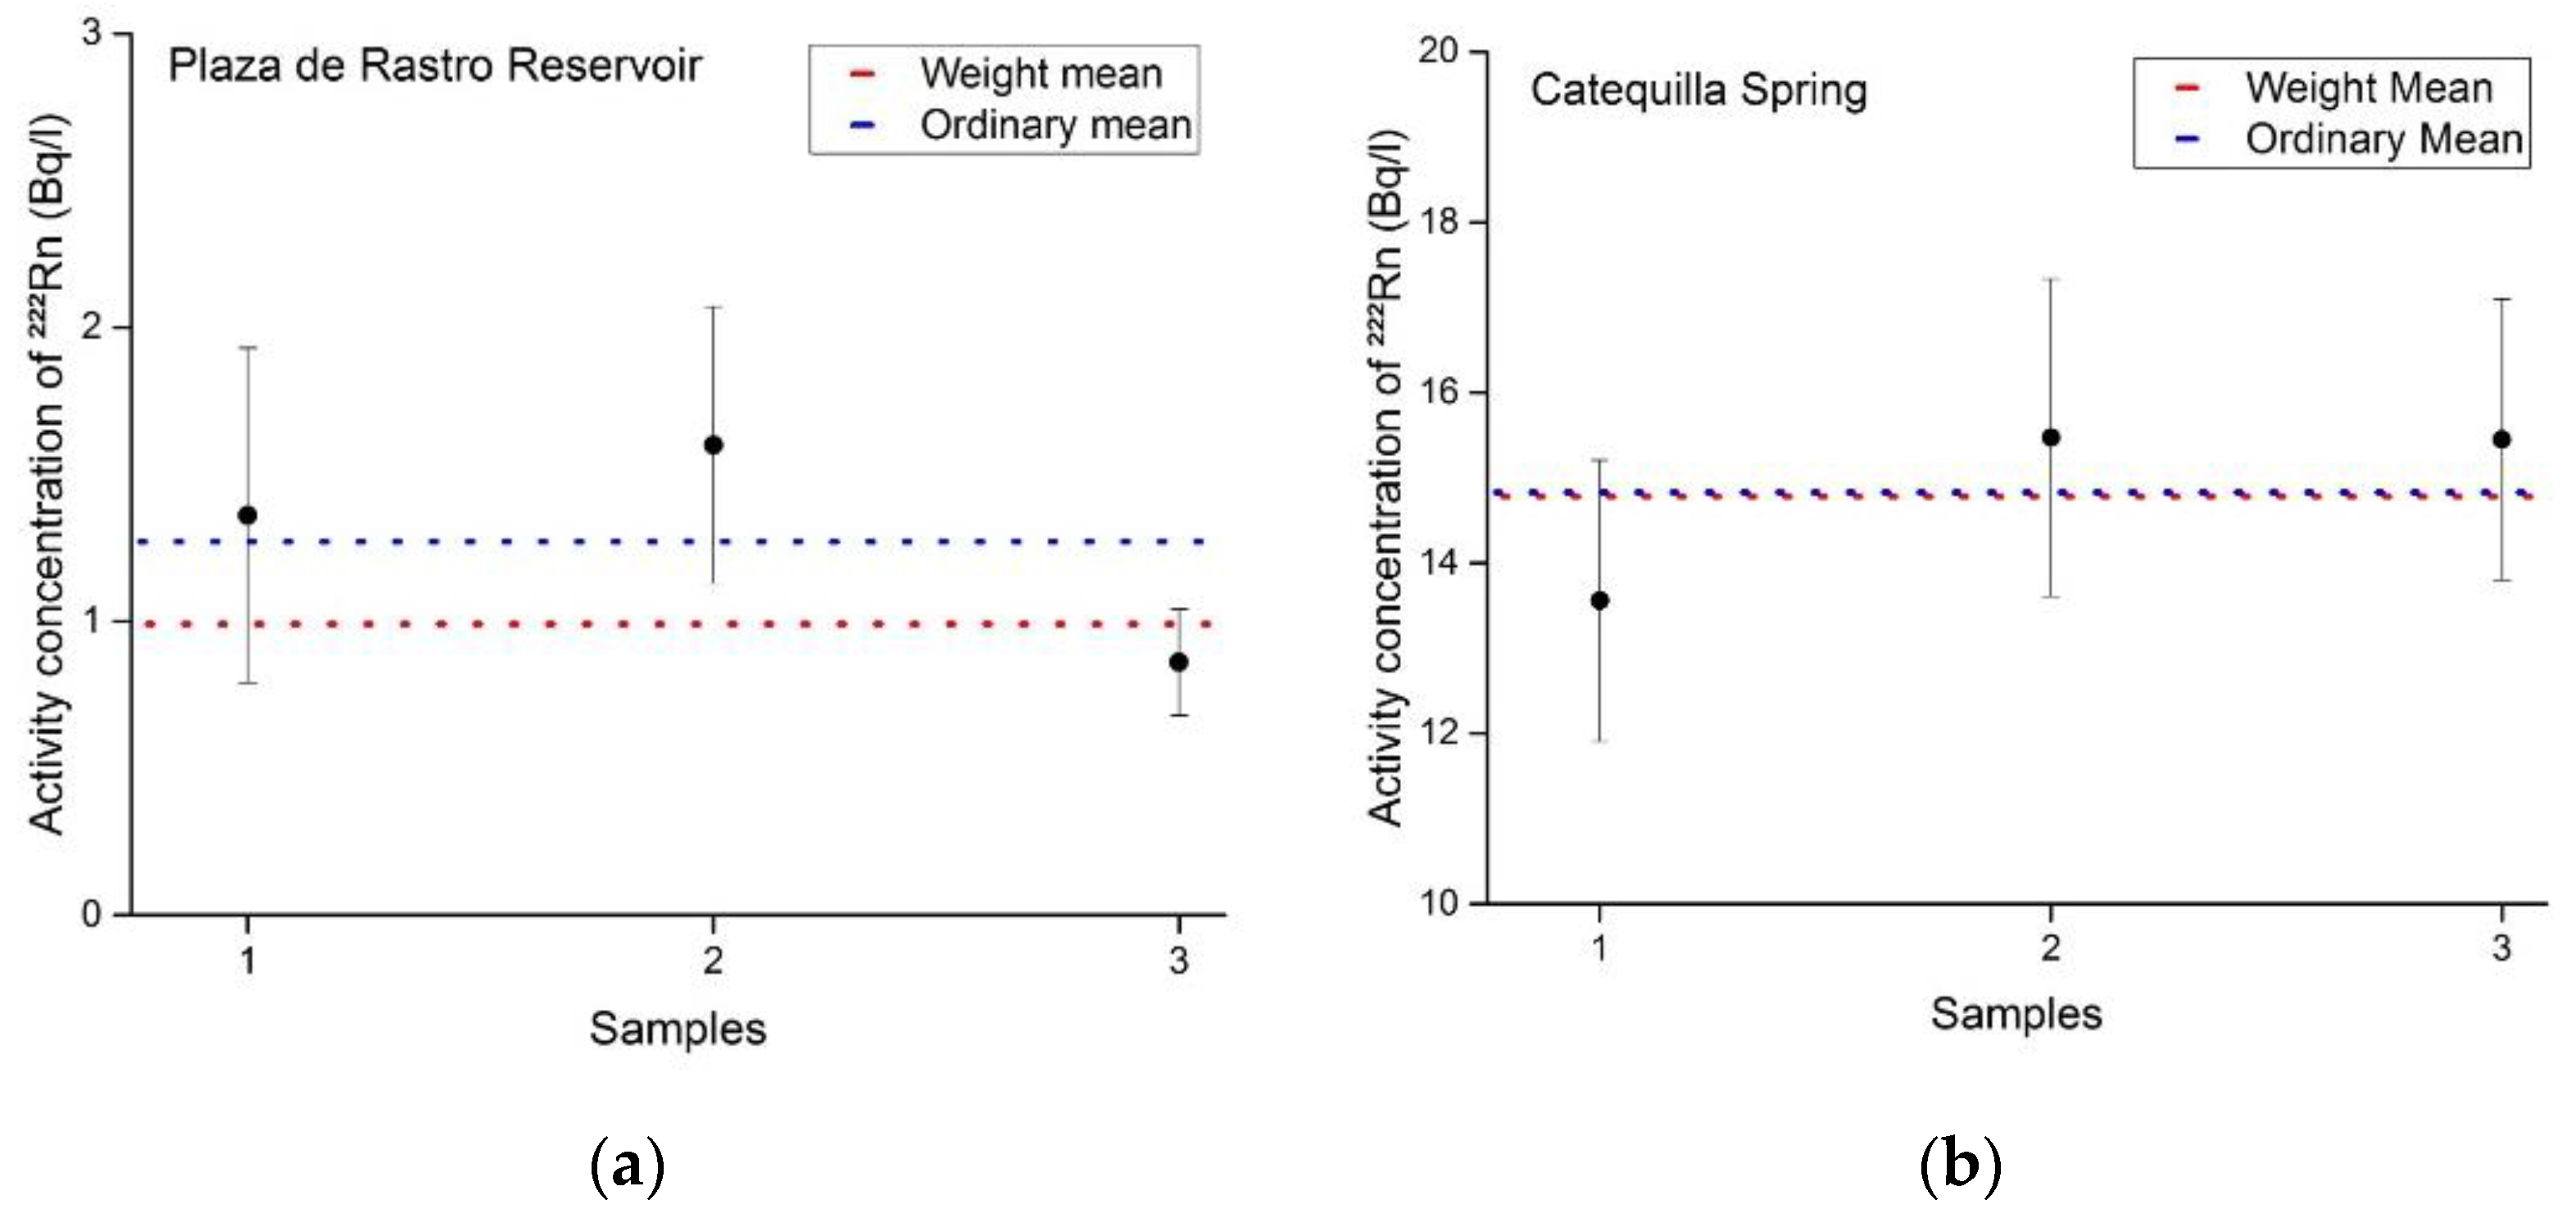
Figure 3 presents the comparison between the ordinary mean with the weighted mean for the water sources in Table 5. For the Plaza de Rastro reservoir, the weighted mean is close to the most precise value (0.86 ± 21%) and is lower than the ordinary mean. In the case of the Catequilla spring, the weighted and ordinary mean are compatible because the three measurements have almost the same precision. In both cases, the standard deviation of the weighted mean is less than the standard deviation of the ordinary mean.

3.3. Doses

The annual effective doses due to ingestion and inhalation of radon dissolved in water, were calculated using the maximum value of the concentration observed by each city (Table 6).
The maximum annual effective dose that people can receive as a result of drinking water that contains radon depends on the city where they live and varies from 0.010 to 0.108 mSv. The maximum annual effective dose due to inhaled radon ranges from 0.008 to 0.091 mSv. Chambo is the city with the highest annual effective doses while Cumandá city presents negligible values.

3.4. Activity Concentration Measurements of 226Ra

To confirm whether radon concentrations are related to the content of its parent, 226Ra in water, this radionuclide was determined in samples from all wells, springs, and reservoir tanks. After ten days, only six water supplies presented radon levels above the lower detection limit of RAD H2O (0.37 Bq/L). The results are presented in Table 7.
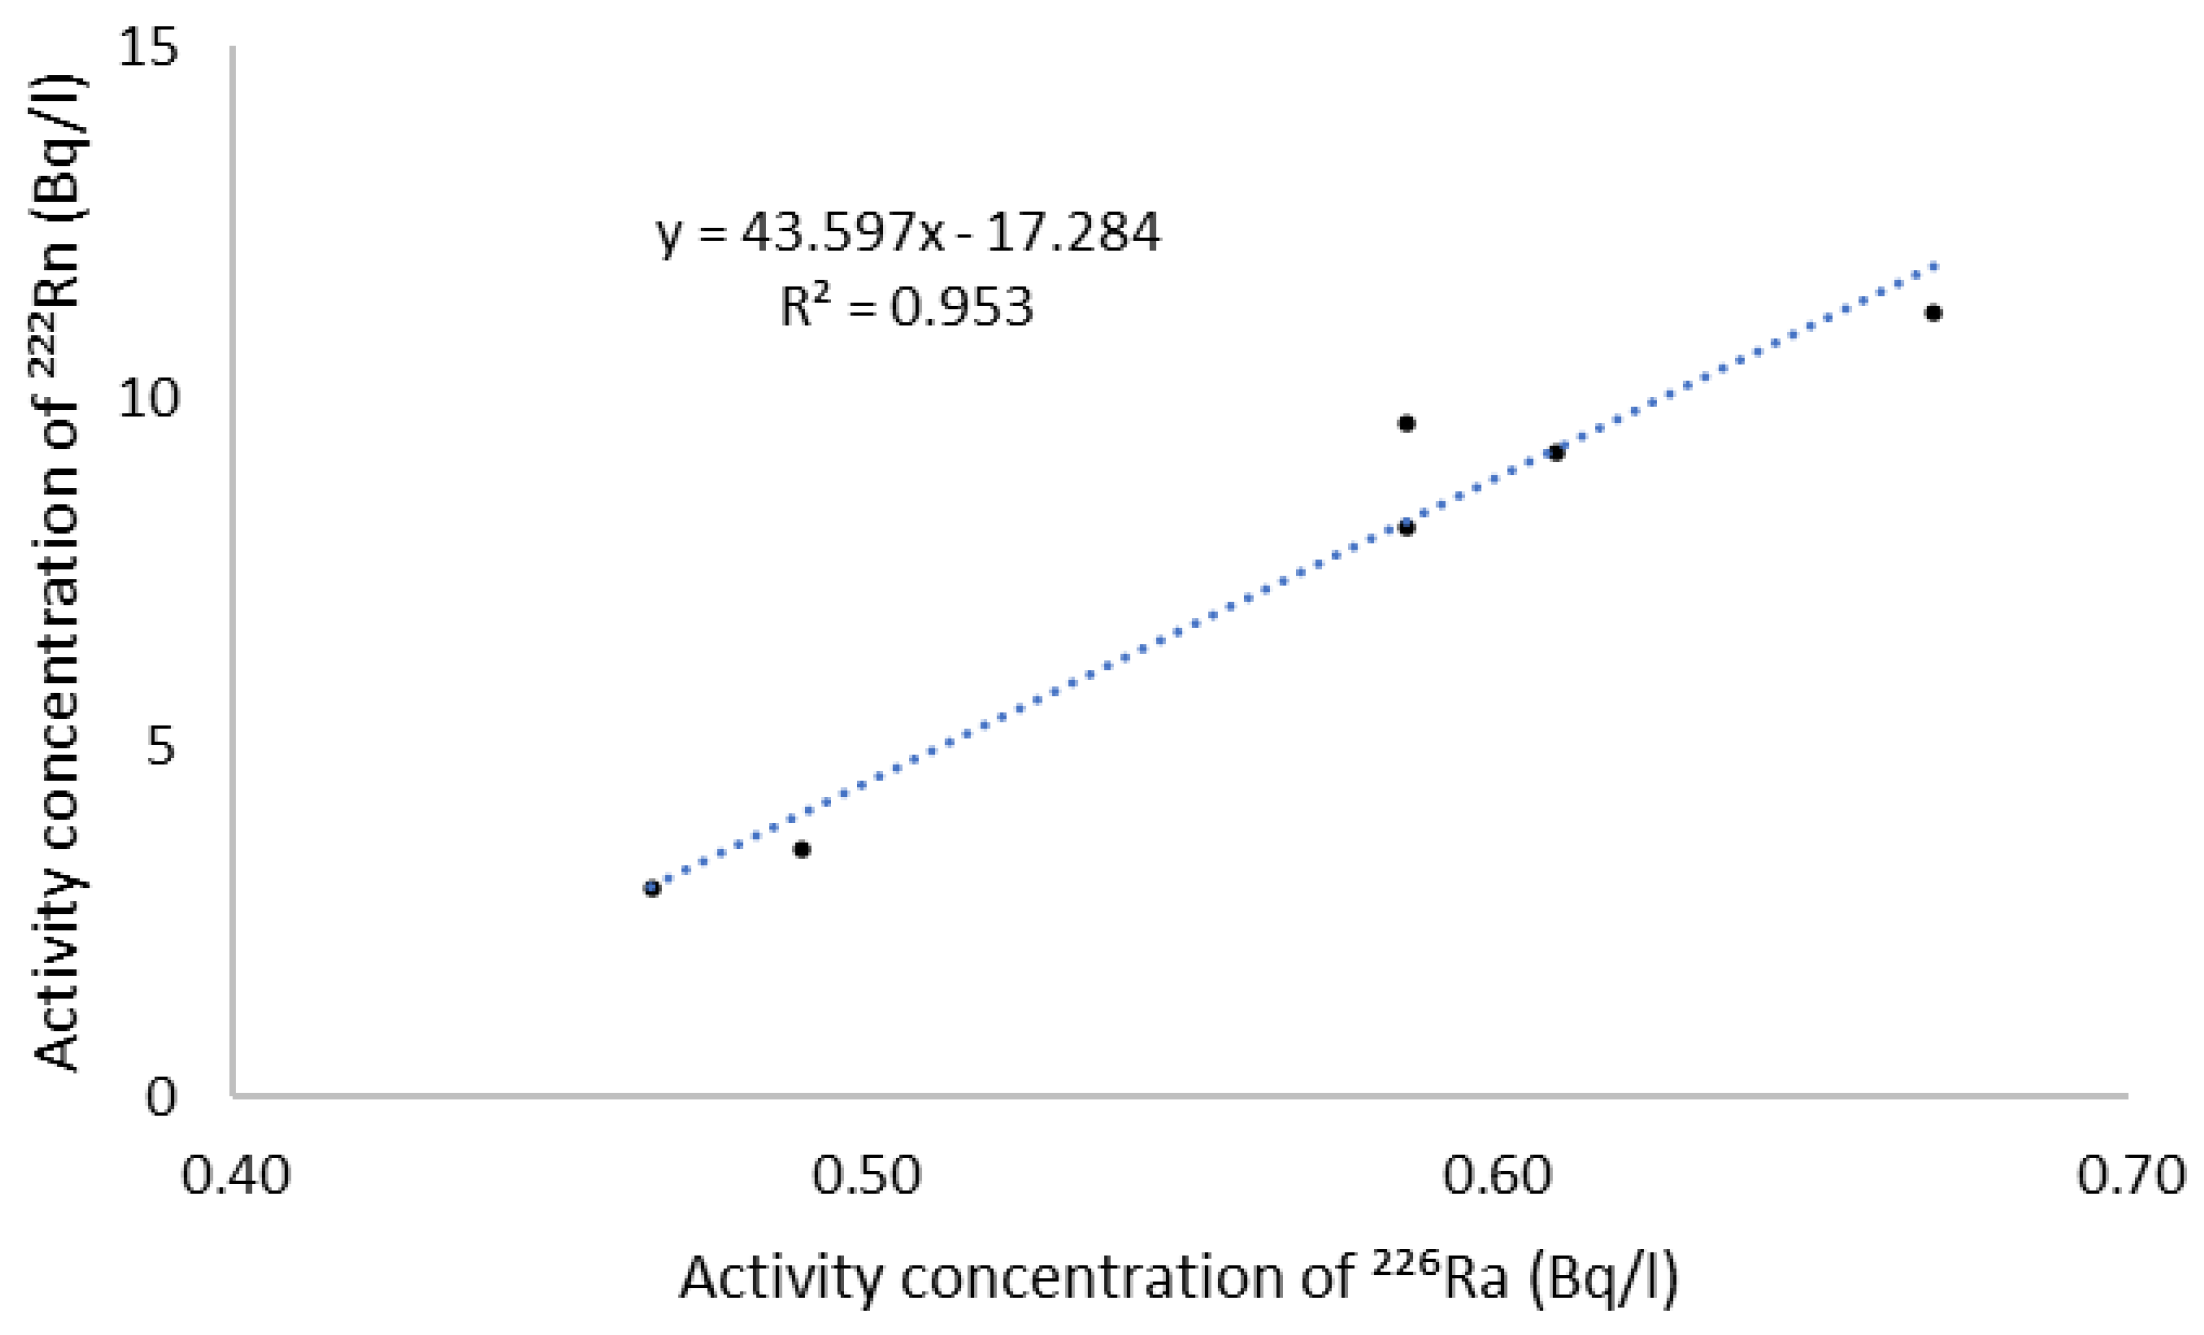
Detectable radium concentrations were observed in springs located in Guano and Chambo cantons, northern Chimborazo province. The water samples indicated radon concentrations (day 10) between 0.39 and 0.56 Bq/L, while radium concentrations ranged between 0.47 and 0.67 Bq/L. The correlation between concentrations of 222Rn and 226Ra is illustrated in Figure 4.
A significant strong correlation (R2 = 0.953) was found between 226Ra and 222Rn concentrations in water samples collected from springs located on the distal facies of Cotopaxi Volcanics (L2) and Pisayambo (intermediate reworked volcanoclastic deposits, debris avalanches, lavas, and intermediate to felsic volcaniclastic deposits, respectively).

4. Discussion

This study covers all the cantons of the Chimborazo province located in the south-central part of Ecuador, where there has been a lack of any previous studies of radon for drinking water. Fifty-three water supplies that feed the systems of all the ten capital cities of the cantons were monitored, fifty underground and three of surface origin (rivers). The results exhibited presence of radon in the groundwater samples, while surface waters did not present detectable values.
According to the sampling protocol, three independent samples were collected from each water source, at the same time and under the same experimental conditions. In all cases, the results of the three measurements were compatible with each other. In Table 1, Table 2 and Table 3, the weighted mean of the three measurements was reported because it gives greater importance to the more precise measurement, while the contributions of the measurements that have large errors become insignificant.
Radon concentrations in groundwater samples ranged from 0.53 to 14.78 Bq/L. The maximum values for springs, wells, and reservoir tanks were 14.78 Bq/L, 11.36 Bq/L, and 2.01 Bq/L, respectively. The observed radon concentrations were well below the parametric value of 100 Bq/L for water intended for human consumption recommended by the EURATOM Directive 2013/51, and the alternative maximum contamination level (AMCL) for radon in drinking water (150 Bq/L) proposed by the EPA [35].
Radon contamination of drinking water has been studied worldwide; publications in surface water indicate radon concentrations less than 5 Bq/L [18,95]. Several studies in groundwater, intended for human consumption, yielded values higher than the parametric value of 100 Bq/L ([35,96,97], while other publications presented radon concentrations lower than 11 Bq/L [85,98,99]. In general, radon levels had great variability from one country to another, due to their dependency mainly of the geological background of the study area.
Volcanic activity in the province of Chimborazo has left a significant mark on the landscape and geology of the region. The studied water supplies are associated with five geological units, Tarqui Volcanics (Cisaran Fm.), Cotopaxi Volcanics (distal facies), Pisayambo Volcanics, Yunguilla Unit, and Peltetec Unit, and therefore exhibiting varied lithologies Four lithologies presented similar mean concentrations of radon within the uncertainties (1σ), except for the lithology characterized by intermediate volcaniclastic to felsic deposits (L3), which demonstrated the highest mean concentration (9.58 ± 3.04 Bq/L). This lithology is present in the water sources studied in Guamote, Chambo, and Penipe, neighboring cantons where it is possible to hypothesize that radioactivity of the rocks (238U and its progeny), is greater than in the other cantons and geological units—lithologies. It should be noted that there are no previous studies at all on the radioactivity of the rocks in the study area.
The annual effective doses due to ingestion and inhalation of radon were calculated based on the maximum radon concentrations of each city. The maximum annual effective doses due to the ingestion of radon dissolved in water ranged between 0.010 and 0.108 mSv, values lower than the global average annual effective dose caused by the ingestion of radionuclides with food and drinking water (0.3 mSv). The maximum annual effective doses due to inhalation of radon are in the range of 0.008–0.091 mSv, values lower than to the world average annual effective dose caused by the inhalation of radionuclides (1.2 mSv) [83]. A low dose due to ingestion and inhalation means that exposure to this radioactive gas and its decay products is limited. This reduces the risk of developing health problems related to radon, especially lung and stomach cancer.
In all water supplies, the activity concentration of 226Ra was determined, performing a second radon measurement in the same water sample, using the RAD H2O method, ten days after the first measurement. Detectable values of 226Ra were only observed in six springs in the cantons of Guano and Chambo, within the range 0.47–0.67 Bq/L. Some scientific publications report weak correlations between the 226Ra and 222Rn concentrations [87,100], while other papers, in contrast, a significant correlation between these radionuclides [11,101,102]. In the current study, a significant correlation (R2 = 0.953) between the concentrations of 226Ra and 222Rn was observed, which can be explained by the fact that the lithologies present in the aquifer are strongly tectonized, brittle, or weathered, facilitating their dissolution and therefore the incorporation of 226Ra in water. Another probable cause of the presence of 226Ra in the water is the low adsorption of this element on the surfaces of the mineral granules within the aquifers. In summary, the radium concentration characterizes the geochemistry of the groundwater-rock interaction, while the radon concentration, in most cases, is an indicator of immobile radium embedded in the rocks [94].
The present research provides an overview of radon levels in drinking water in 10 cities of the Chimborazo province, as well as the risk to the health of residents exposed to ionizing radiation, associated with ingestion and inhalation dissolved radon in water. However, this study has a limited scope since it did not consider the water sources that supply rural sectors of the different cantons, small communities where groundwater is drunk directly from wells and springs without a prior purification process or with such limited practices. In addition, the monitoring did not cover the changes in water flow due to seasonality of the contrasting rainy and dry seasons during the year. The future perspective may be to conduct a regional and national monitoring campaign that provides scientific information so that the Ecuadorian regulatory entity establishes a reference level for radon in drinking water.

5. Conclusions

The radon concentrations in samples of 50 drinking water sources of subterranean origin, that supply to the main cities of the province of Chimborazo, oscillated between 0.53 and 14.78 Bq/L, levels below the parametric value of 100 Bq/L, recommended by the EURATOM Directive 2013/51 and the alternative maximum contamination level (AMCL) of 150 Bq/L, proposed by the EPA, which implies that the consumption of these waters, with respect to radon, can be considered safe.
The maximum annual effective doses due to the ingestion ranged between 0.010 and 0.108 mSv, values lower than the global average annual effective dose caused by the ingestion of radionuclides with food and drinking water (0.3 mSv). The maximum annual effective doses due to inhalation of radon were in the range of 0.008–0.091 mSv, values also being lower than the world average annual effective dose caused by the inhalation of radionuclides (1.2 mSv). In conclusion, radon exposure levels are relatively low, and the risk associated with this exposure is minimal.
The water supplies studied are associated with five geological units: Tarqui Volcanics (Cisaran Fm.), Cotopaxi Volcanics (distal facies), Pisayambo Volcanics, Yunguilla Unit, and Peltetec Unit. The Pisayambo Volcanic unit, which includes intermediate volcaniclastic to felsic deposits, presented a mean radon concentration higher than the other geological units (9.58 ± 3.04 Bq/L); this finding leads to the assumption that the radioactivity of these rocks (238U and its progeny) is greater than in the other cantons and lithologies.
Radon concentrations in samples from six water springs, located in the cantons of Guano and Chambo, are significantly correlated with radium concentrations (R2 = 0.953); this result can be explained by the fact that the lithologies present in the aquifer are strongly tectonized, brittle, or weathered, facilitating their dissolution and therefore the incorporation of 226Ra in water. Another probable cause of the presence of 226Ra in the water is the low adsorption of this element on the surfaces of the mineral granules within the aquifers.

Author Contributions

Conceptualization, J.O. and G.U.-C.; Methodology, J.O., J.L.H.-R., J.T.-I., S.S.-L. and A.C.-V.; Software, J.L.H.-R. and A.F.-B.; Validation, J.L.H.-R., S.S.-L. and T.T.; Investigation, J.O., J.L.H.-R., G.U.-C., J.T.-I., S.S.-L., A.F.-B. and A.C.-V.; Data curation, J.O., G.U.-C., J.T.-I., A.F.-B., A.C.-V. and T.T.; Writing—original draft, J.O. and T.T.; Writing—review & editing, T.T.; Visualization, T.T.; Supervision, J.O.; Project administration, J.O.; Funding acquisition, J.O. All authors have read and agreed to the published version of the manuscript.

Funding

This research received no external funding.

Data Availability Statement

Not applicable.

Conflicts of Interest

The authors declare no conflict of interest.

References

  1. Ruano-Ravina, A.; Wakeford, R. The increasing exposure of the global population to ionizing radiation. Epidemiology 2020, 31, 155–159. [Google Scholar] [CrossRef] [PubMed]
  2. Bulko, M.; Holý, K.; Pohronská, Ž.; Műllerová, M.; Böhm, R.; Holá, O. Radiation exposure of the population from 222Rn and other natural radionuclides around Mochovce nuclear power plant, Slovakia. Radiat. Prot. Dosim. 2017, 177, 207–212. [Google Scholar] [CrossRef] [PubMed]
  3. Grasty, R.L.; LaMarre, J.R. The annual effective dose from natural sources of ionising radiation in Canada. Radiat. Prot. Dosim. 2004, 108, 215–226. [Google Scholar] [CrossRef] [PubMed]
  4. Hendry, J.H.; Simon, S.L.; Wojcik, A.; Sohrabi, M.; Burkart, W.; Cardis, E.; Laurier, D.; Tirmarche, M.; Hayata, I. Human exposure to high natural background radiation: What can it teach us about radiation risks? J. Radiol. Prot. 2009, 29, A29–A42. [Google Scholar] [CrossRef] [PubMed]
  5. Hu, J.; Wu, Y.; Saputra, M.A.; Song, Y.; Yang, G.; Tokonami, S. Radiation exposure due to 222Rn, 220Rn and their progenies in three metropolises in China and Japan with different air quality levels. J. Environ. Radioact. 2022, 244, 106830. [Google Scholar] [CrossRef]
  6. Ye, Y.-J.; Xia, X.-Q.; Dai, X.-T.; Huang, C.-H.; Guo, Q. Effects of temperature, salinity, and pH on 222Rn solubility in water. J. Radioanal. Nucl. Chem. 2019, 320, 369–375. [Google Scholar] [CrossRef]
  7. Ghernaout, D. Aeration process for removing radon from drinking water—A review. Appl. Eng. 2019, 3, 32–45. [Google Scholar]
  8. Jobbágy, V.; Altzitzoglou, T.; Malo, P.; Tanner, V.; Hult, M. A brief overview on radon measurements in drinking water. J. Environ. Radioact. 2017, 173, 18–24. [Google Scholar] [CrossRef]
  9. Choubey, V.M.; Ramola, R.C. Correlation between geology and radon levels in groundwater, soil and indoor air in Bhilangana Valley, Garhwal Himalaya, India. Environ. Geol. 1997, 32, 258–262. [Google Scholar] [CrossRef]
  10. D’alessandro, W.; Vita, F. Groundwater radon measurements in the Mt. Etna area. J. Environ. Radioact. 2003, 65, 187–201. [Google Scholar] [CrossRef]
  11. Fonollosa, E.; Peñalver, A.; Borrull, F.; Aguilar, C. Radon in spring waters in the south of Catalonia. J. Environ. Radioact. 2016, 151, 275–281. [Google Scholar] [CrossRef] [PubMed]
  12. Voronov, A.N. Radon-rich waters in Russia. Environ. Geol. 2004, 46, 630–634. [Google Scholar] [CrossRef]
  13. Khan, F.; Ali, N.; Khan, E.U.; Khattak, N.U.; Khan, K. Radon monitoring in water sources of Balakot and Mansehra cities lying on a geological fault line. Radiat. Prot. Dosim. 2010, 138, 174–179. [Google Scholar] [CrossRef] [PubMed]
  14. Cech, I.; Lemma, M.; Kreitler, C.W.; Prichard, H.M. Radium and radon in water supplies from the Texas Gulf Coastal aquifer. Water Res. 1988, 22, 109–121. [Google Scholar] [CrossRef]
  15. Hoehn, E.; Von Gunten, H.R. Radon in groundwater: A tool to assess infiltration from surface waters to aquifers. Water Resour. Res. 1989, 25, 1795–1803. [Google Scholar] [CrossRef] [Green Version]
  16. Barbosa-Lorenzo, R.; Barros-Dios, J.M.; Ruano-Ravina, A. Radon and stomach cancer. Int. J. Epidemiol. 2017, 46, 767–768. [Google Scholar] [CrossRef]
  17. Hopke, P.K.; Borak, T.B.; Doull, J.; Cleaver, J.E.; Eckerman, K.F.; Gundersen, L.C.S.; Harley, N.H.; Hess, C.T.; Kinner, N.E.; Kopecky, K.J.; et al. Health Risks Due to Radon in Drinking Water. Environ. Sci. Technol. 2000, 34, 921–926. [Google Scholar] [CrossRef] [Green Version]
  18. National Research Council. Risk Assessment of Radon in Drinking Water; The National Academies Press: Washington, DC, USA, 1999. [Google Scholar] [CrossRef]
  19. Jalili-Majareshin, A.; Behtash, A.; Rezaei-Ochbelagh, D. Radon concentration in hot springs of the touristic city of Sarein and methods to reduce radon in water. Radiat. Phys. Chem. 2012, 81, 749–757. [Google Scholar] [CrossRef]
  20. Martins, L.; Pereira, A.; Oliveira, A.S.; Fernandes, L.S.; Pacheco, F. A new radon prediction approach for an assessment of radiological potential in drinking water. Sci. Total Environ. 2020, 712, 136427. [Google Scholar] [CrossRef]
  21. Chen, J.; Ford, K.L. A study on the correlation between soil radon potential and average indoor radon potential in Canadian cities. J. Environ. Radioact. 2017, 166, 152–156. [Google Scholar] [CrossRef]
  22. Kumar, A.; Chauhan, R.; Joshi, M.; Sahoo, B. Modeling of indoor radon concentration from radon exhalation rates of building materials and validation through measurements. J. Environ. Radioact. 2014, 127, 50–55. [Google Scholar] [CrossRef] [PubMed]
  23. Nazaroff, W.W. Radon transport from soil to air. Rev. Geophys. 1992, 30, 137–160. [Google Scholar] [CrossRef]
  24. Petropoulos, N.; Anagnostakis, M.; Simopoulos, S. Building materials radon exhalation rate: ERRICCA intercomparison exercise results. Sci. Total Environ. 2001, 272, 109–118. [Google Scholar] [CrossRef] [PubMed]
  25. Righi, S.; Bruzzi, L. Natural radioactivity and radon exhalation in building materials used in Italian dwellings. J. Environ. Radioact. 2006, 88, 158–170. [Google Scholar] [CrossRef]
  26. UNSCEAR. Sources and Effects of Ionizing Radiation. UNSCEAR 2000 Report to the General Assembly, with Scientific Annex; UNSCEAR: Vienna, Austria, 2000. [Google Scholar]
  27. Clement, C.; Tirmarche, M.; Harrison, J.; Laurier, D.; Paquet, F.; Blanchardon, E.; Marsh, J. Lung Cancer Risk from Radon and Progeny and Statement on Radon. Ann. ICRP 2010, 40, 1–64. [Google Scholar] [CrossRef]
  28. WHO. WHO Handbook on Indoor Radon: A Public Health Perspective; World Health Organization: Geneva, Switzerland, 2009. [Google Scholar]
  29. Vogeltanz-Holm, N.; Schwartz, G.G. Radon and lung cancer: What does the public really know? J. Environ. Radioact. 2018, 192, 26–31. [Google Scholar] [CrossRef]
  30. Sethi, T.K.; El-Ghamry, M.N.; Kloecker, G.H. Radon and lung cancer. Clin. Adv. Hematol. Oncol. 2012, 10, 157–164. [Google Scholar]
  31. Lorenzo-González, M.; Torres-Durán, M.; Barbosa-Lorenzo, R.; Provencio-Pulla, M.; Barros-Dios, J.M.; Ruano-Ravina, A. Radon exposure: A major cause of lung cancer. Expert Rev. Respir. Med. 2019, 13, 839–850. [Google Scholar] [CrossRef]
  32. Oakland, C.; Meliker, J.R. County-level radon and incidence of female thyroid cancer in Iowa, New Jersey, and Wisconsin, USA. Toxics 2018, 6, 17. [Google Scholar] [CrossRef] [Green Version]
  33. Goyal, N.; Camacho, F.; Mangano, J.; Goldenberg, D. Evaluating for a geospatial relationship between radon levels and thyroid Cancer in Pennsylvania. Laryngoscope 2014, 125, E45–E49. [Google Scholar] [CrossRef]
  34. Salazar-Vega, J.; Ortiz-Prado, E.; Solis-Pazmino, P.; Gómez-Barreno, L.; Simbaña-Rivera, K.; Henriquez-Trujillo, A.R.; Brito, J.P.; Toulkeridis, T.; Coral-Almeida, M. Thyroid Cancer in Ecuador, a 16 years population-based analysis (2001–2016). BMC Cancer 2019, 19, 294. [Google Scholar] [CrossRef] [PubMed]
  35. Council Directive 2013/51/Euratom of 22 October 2013 laying down requirements for the protection of the health of the general public with regard to radioactive substances in water intended for human consumption. Off. J. Eur. Union 2013, 7, 56.
  36. DeSimone, L.A. Quality of Water from Domestic Wells in Principal Aquifers of the United States, 1991–2004; US Geological Survey: Reston, VA, USA, 2009; p. 139.
  37. River, C. United States Environmental Protection Agency; United States Environmental Protection Agency: Washington, DC, USA, 2012.
  38. Litherland, M.; Aspden, J. Terrane-boundary reactivation: A control on the evolution of the Northern Andes. J. S. Am. Earth Sci. 1992, 5, 71–76. [Google Scholar] [CrossRef]
  39. Massonne, H.-J.; Toulkeridis, T. Widespread relics of high-pressure metamorphism confirm major terrane accretion in Ecuador: A new example from the Northern Andes. Int. Geol. Rev. 2012, 54, 67–80. [Google Scholar] [CrossRef]
  40. Pratt, W.T.; Duque, P.; Ponce, M. An autochthonous geological model for the eastern Andes of Ecuador. Tectonophysics 2005, 399, 251–278. [Google Scholar] [CrossRef]
  41. Toulkeridis, T.; Zach, I. Wind directions of volcanic ash-charged clouds in Ecuador—Implications for the public and flight safety. Geomat. Nat. Hazards Risk 2016, 8, 242–256. [Google Scholar] [CrossRef] [Green Version]
  42. Suhr, N.; Rojas-Agramonte, Y.; Chew, D.M.; Pinto, A.J.; Villagómez-Díaz, D.; Toulkeridis, T.; Mertz-Kraus, R. Detrital-zircon geochronology and provenance of the El Oro Metamorphic Complex, Ecuador: Geodynamic implications for the evolution of the western Gondwana margin. J. S. Am. Earth Sci. 2019, 90, 520–539. [Google Scholar] [CrossRef]
  43. Tamay, J.; Galindo-Zaldivar, J.; Soto, J.; Gil, A.J. GNSS Constraints to Active Tectonic Deformations of the South American Continental Margin in Ecuador. Sensors 2021, 21, 4003. [Google Scholar] [CrossRef]
  44. Moberly, R.; Shepherd, G.L.; Coulbourn, W.T. Forearc and other basins, continental margin of northern and southern Peru and adjacent Ecuador and Chile. Geol. Soc. Lond. Spéc. Publ. 1982, 10, 171–189. [Google Scholar] [CrossRef]
  45. Mora, M.J.M.; González, C.A.L.; Hidalgo, D.A.E.; Toulkeridis, T. Determination of altitudes of the three main Ecuadorian summits through GNSS positioning. Geod. Geodyn. 2022, 13, 343–351. [Google Scholar] [CrossRef]
  46. Jaillard, E.; Ordoñez, M.; Suárez, J.; Toro, J.; Iza, D.; Lugo, W. Stratigraphy of the late Cretaceous–Paleogene deposits of the cordillera occidental of central ecuador: Geodynamic implications. J. S. Am. Earth Sci. 2004, 17, 49–58. [Google Scholar] [CrossRef] [Green Version]
  47. Spikings, R.; Winkler, W.; Hughes, R.; Handler, R. Thermochronology of allochthonous terranes in Ecuador: Unravelling the accretionary and post-accretionary history of the Northern Andes. Tectonophysics 2005, 399, 195–220. [Google Scholar] [CrossRef]
  48. Vallejo, C.; Spikings, R.A.; Horton, B.K.; Luzieux, L.; Romero, C.; Winkler, W.; Thomsen, T.B. Late cretaceous to miocene stratigraphy and provenance of the coastal forearc and Western Cordillera of Ecuador: Evidence for accretion of a single oceanic plateau fragment. In Andean Tectonics; Elsevier: Amsterdam, The Netherlands, 2019; pp. 209–236. [Google Scholar] [CrossRef]
  49. Podwojewski, P.; Poulenard, J.; Toulkeridis, T.; Gräfe, M. Polygenic soils in the southern central Ecuadorian highlands as the result of long-lasting pedogenesis, geodynamic processes and climate change. J. S. Am. Earth Sci. 2022, 120, 104096. [Google Scholar] [CrossRef]
  50. Winkler, W.; Villagómez, D.; Spikings, R.; Abegglen, P.; Egüez, A. The Chota basin and its significance for the in-ception and tectonic setting of the inter-Andean depression in Ecuador. J. S. Am. Earth Sci. 2005, 19, 5–19. [Google Scholar] [CrossRef]
  51. Hungerbühler, D.; Steinmann, M.; Winkler, W.; Seward, D.; Egüez, A.; Peterson, D.E.; Helg, U.; Hammer, C. Neogene stratigraphy and Andean geodynamics of southern Ecuador. Earth-Sci. Rev. 2002, 57, 75–124. [Google Scholar] [CrossRef]
  52. Toulkeridis, T.; Arroyo, C.R.; Cruz D’Howitt, M.; Debut, A.; Vaca, A.V.; Cumbal, L.; Mato, F.; Aguilera, E. Evaluation of the initial stage of the reactivated Cotopaxi volcano–analysis of the first ejected fine-grained material. Nat. Hazards Earth Syst. Sci. Discuss. 2015, 3, 6947–6976. [Google Scholar]
  53. Melián, G.V.; Toulkeridis, T.; Pérez, N.M.; Hernández, P.A.; Somoza, L.; Padrón, E.; Amonte, C.; Alonso, M.; Asensio-Ramos, M.; Cordero, M. Geochemistry of Water and Gas Emissions From Cuicocha and Quilotoa Volcanic Lakes, Ecuador. Front. Earth Sci. 2021, 9, 741528. [Google Scholar] [CrossRef]
  54. Toulkeridis, T.; Buchwaldt, R.; Addison, A. WHEN VOLCANOES THREATEN, SCIENTISTS WARN-Scientists use volcanoes’ pre-eruptive behaviors, such as increasing seismic activity, to warn that an eruption may be imminent. But what happens when a. Geotimes 2007, 52, 36–40. [Google Scholar]
  55. Litherland, M.; Aspden, J.A.; Jemielita, R.A. The metamorphic belts of Ecuador. British Geological Survey, Overseas Memoir 11. Br. Geol. Surv. Keyworth 1994, 11, 147. [Google Scholar]
  56. Feininger, T. Allochthonous terranes in the Andes of Ecuador and northwestern Peru. Can. J. Earth Sci. 1987, 24, 266–278. [Google Scholar] [CrossRef]
  57. Spikings, R.; Paul, A.; Vallejo, C.; Reyes, P. Constraints on the ages of the crystalline basement and Palaeozoic cover exposed in the Cordillera real, Ecuador: 40Ar/39Ar analyses and detrital zircon U/Pb geochronology. Gondwana Res. 2021, 90, 77–101. [Google Scholar] [CrossRef]
  58. Abdurabu, W.A.; Ramli, A.T.; Saleh, M.A.; Heryansyah, A. The activity concentrations of 222Rn and corresponding health risk in groundwater samples from basement and sandstone aquifer; the correlation to physicochemical parameters. Radiat. Phys. Chem. 2016, 127, 34–41. [Google Scholar] [CrossRef]
  59. Althoyaib, S.S.; El-Taher, A. Natural radioactivity measurements in groundwater from Al-Jawa, Saudi Arabia. J. Radioanal. Nucl. Chem. 2015, 304, 547–552. [Google Scholar] [CrossRef]
  60. Williams, T.; Dunkley, P.N.; Cruz, E.; Acitimbay, V.; Gaibor, A.; Lopez, E.; Baez, N.; Aspden, J.A. Regional geochemical reconnaissance of the Cordillera Occidental of Ecuador: Economic and environmental applications. Appl. Geochem. 2000, 15, 531–550. [Google Scholar] [CrossRef]
  61. Barberi, F.; Coltelli, M.; Ferrara, G.; Innocenti, F.; Navarro, J.M.; Santacroce, R. Plio-quaternary volcanism in Ecuador. Geol. Mag. 1988, 125, 1–14. [Google Scholar] [CrossRef]
  62. Barberi, F.; Coltelli, M.; Frullani, A.; Rosi, M.; Almeida, E. Chronology and dispersal characteristics of recently (last 5000 years) erupted tephra of Cotopaxi (Ecuador): Implications for long-term eruptive forecasting. J. Volcanol. Geotherm. Res. 1995, 69, 217–239. [Google Scholar] [CrossRef]
  63. Pistolesi, M.; Aravena, A.; Costantini, L.; Vigiani, C.; Cioni, R.; Bonadonna, C. Explosive behavior of intermediate magmas: The example of Cotopaxi volcano (Ecuador). Geochem. Geophys. Geosyst. 2021, 22, e2021GC009991. [Google Scholar] [CrossRef]
  64. Pistolesi, M.; Cioni, R.; Rosi, M.; Aguilera, E. Lahar hazard assessment in the southern drainage system of Cotopaxi volcano, Ecuador: Results from multiscale lahar simulations. Geomorphology 2014, 207, 51–63. [Google Scholar] [CrossRef]
  65. Vaca, A.V.; Arroyo, C.R.; Debut, A.; Toulkeridis, T.; Cumbal, L.; Mato, F.; D’Howitt, M.C.; Aguilera, E. Characterization of fi-ne-grained material ejected by the Cotopaxi volcano employing X-ray diffraction and electron diffraction scattering techniques. Biol. Med. 2016, 8, 1. [Google Scholar] [CrossRef] [Green Version]
  66. Lavenu, A.; Noblet, C.; Bonhomme, M.G.; Egüez, A.; Dugas, F.; Vivier, G. New K Ar age dates of Neogene and Quaternary volcanic rocks from the Ecuadorian Andes: Implications for the relationship between sedimentation, volcanism, and tectonics. J. S. Am. Earth Sci. 1992, 5, 309–320. [Google Scholar] [CrossRef]
  67. Hughes, R.A.; Pilatasig, L.F. Cretaceous and Tertiary terrane accretion in the Cordillera Occidental of the Andes of Ecuador. Tectonophysics 2002, 345, 29–48. [Google Scholar] [CrossRef]
  68. Jaillard, E.; Bengtson, P.; Ordoñez, M.; Vaca, W.; Dhondt, A.; Suárez, J.; Toro, J. Sedimentary record of terminal Cretaceous accretions in Ecuador: The Yunguilla Group in the Cuenca area. J. S. Am. Earth Sci. 2008, 25, 133–144. [Google Scholar] [CrossRef] [Green Version]
  69. Villares, F.; Garcia-Casco, A.; Blanco-Quintero, I.F.; Montes, C.; Reyes, P.S.; Cardona, A. The Peltetec ophiolitic belt (Ecuador): A window to the tectonic evolution of the Triassic margin of western Gondwana. Int. Geol. Rev. 2021, 63, 2232–2256. [Google Scholar] [CrossRef]
  70. Cochrane, R.; Spikings, R.; Gerdes, A.; Winkler, W.; Ulianov, A.; Mora, A.; Chiaradia, M. Distinguishing between in-situ and accretionary growth of continents along active margins. Lithos 2014, 202, 382–394. [Google Scholar] [CrossRef]
  71. Spikings, R.A.; Cochrane, R.; Vallejo, C.; Villagomez, D.; Van der Lelij, R.; Paul, A.; Winkler, W. Latest Triassic to Early Cretaceous tectonics of the Northern Andes: Geochronology, geochemistry, isotopic tracing, and thermochronology. In Andean Tectonics; Elsevier: Amsterdam, The Netherlands, 2019; pp. 173–208. [Google Scholar]
  72. Maharana, M.; Eappen, K.P.; Sengupta, D. Radon emanometric technique for 226 Ra estimation. J. Radioanal. Nucl. Chem. 2010, 285, 469–474. [Google Scholar] [CrossRef]
  73. Reddy, D.V.; Sukhija, B.S.; Nagabhushanam, P.; Reddy, G.K.; Kumar, D.; Lachassagne, P. Soil gas radon ema-nometry: A tool for delineation of fractures for groundwater in granitic terrains. J. Hydrol. 2006, 329, 186–195. [Google Scholar] [CrossRef]
  74. Prasad, Y.; Prasad, G.; Choubey, V.; Ramola, R. Geohydrological control on radon availability in groundwater. Radiat. Meas. 2009, 44, 122–126. [Google Scholar] [CrossRef]
  75. Tuccimei, P.; Mollo, S.; Soligo, M.; Scarlato, P.; Castelluccio, M. Real-time setup to record radon emission during rock deformation: Implications for geochemical surveillance. Geosci. Instrum. Methods Data Syst. Discuss. 2015, 5, 39–62. [Google Scholar]
  76. Schmidt, A.; Schlueter, M.; Melles, M.; Schubert, M. Continuous and discrete on-site detection of radon-222 in ground- and surface waters by means of an extraction module. Appl. Radiat. Isot. 2008, 66, 1939–1944. [Google Scholar] [CrossRef]
  77. Liu, Z.; Ma, G.; Zeng, L.; Song, F.; Liu, Q.; Wang, Y.; Li, P. The Factors influencing the accuracy of radon concentration using RAD7 radon monitor measurement and analysis of indoor radon in Beijing. Chin. J. Radiol. Health 2017, 26, 348–350. [Google Scholar]
  78. Hasan, A.K.; Subber, A.R.; Shaltakh, A.R. Measurement of radon concentration in soil gas using RAD7 in the environs of Al-Najaf Al-Ashraf City-Iraq. Adv. Appl. Sci. Res. 2011, 2, 273–278. [Google Scholar]
  79. Bourai, A.A.; Aswal, S.; Dangwal, A.; Rawat, M.; Prasad, M.; Naithani, N.P.; Joshi, V.; Ramola, R.C. Measurements of radon flux and soil-gas radon concentration along the Main Central Thrust, Garhwal Himalaya, using SRM and RAD7 detectors. Acta Geophys. 2013, 61, 950–957. [Google Scholar] [CrossRef]
  80. DURRIDGE. RAD7 Radon Detector User Manual; DURRIDGE: Billerica, MA, USA, 2018. [Google Scholar]
  81. DURRIDGE. RAD H2O User Manual; DURRIDGE: Billerica, MA, USA, 2020. [Google Scholar]
  82. Bem, H.; Plota, U.; Staniszewska, M.; Bem, E.M.; Mazurek, D. Radon (222Rn) in underground drinking water supplies of the Southern Greater Poland Region. J. Radioanal. Nucl. Chem. 2014, 299, 1307–1312. [Google Scholar] [CrossRef] [PubMed] [Green Version]
  83. UNSCEAR. Sources and Effects of Ionizing Radiation, United Nations Scientific Committee on the Effects of Atomic Radiation (UNSCEAR) 1993 Report: Report to the General Assembly, with Scientific Annexes; UNSCEAR: Vienna, Austria, 1993. [Google Scholar]
  84. Lopez, M.G.; Sánchez, A.M.; Escobar, V.G. Estimates of the dose due to 222Rn concentrations in water. Radiat. Prot. Dosim. 2004, 111, 3–7. [Google Scholar] [CrossRef] [PubMed]
  85. Todorovic, N.; Nikolov, J.; Forkapic, S.; Bikit, I.; Mrdja, D.; Krmar, M.; Veskovic, M. Public exposure to radon in drinking water in SERBIA. Appl. Radiat. Isot. 2012, 70, 543–549. [Google Scholar] [CrossRef] [PubMed]
  86. WHO. Guidelines for Drinking-Water Quality, 3rd ed.; WHO: Geneva, Switzerland, 2004; Volume 1. [Google Scholar]
  87. Bem, H.; Długosz-Lisiecka, M.; Mazurek-Rudnicka, D.; Szajerski, P. Occurrence of 222Rn and 226,228 Ra in under-ground water and 222Rn in soil and their mutual correlations for underground water supplies in southern Greater Poland. Environ. Geochem. Health 2021, 43, 3099–3114. [Google Scholar] [CrossRef]
  88. Nandakumaran, P.; Vinayachandran, N. A Preliminary Appraisal of Radon Concentration in Groundwater from the High Background Radiation Area (HBRA) of Coastal Kerala. J. Geol. Soc. India 2020, 95, 491–496. [Google Scholar] [CrossRef]
  89. ICRP. International Commission on Radiological Protection Statement on Radon. Ann. ICRP 2009, 37, 2–4. [Google Scholar]
  90. Le, C.H.; Huynh, N.P.T.; Nguyen, V.T.; Le, Q.B. Radon and radium concentrations in drinkable water supplies of the Thu Duc region in Ho Chi Minh City, Vietnam. Appl. Radiat. Isot. 2015, 105, 219–224. [Google Scholar] [CrossRef]
  91. Echeverría-Puertas, J.; Echeverría, M.; Cargua, F.; Toulkeridis, T. Spatial Dynamics of the Shore Coverage within the Zone of Influence of the Chambo River, Central Ecuador. Land 2023, 12, 180. [Google Scholar] [CrossRef]
  92. Gruber, V.; Maringer, F.J.; Landstetter, C. Radon and other natural radionuclides in drinking water in Austria: Measurement and assessment. Appl. Radiat. Isot. 2009, 67, 913–917. [Google Scholar] [CrossRef] [PubMed]
  93. Nikolopoulos, D.; Louizi, A. Study of indoor radon and radon in drinking water in Greece and Cyprus: Implications to exposure and dose. Radiat. Meas. 2008, 43, 1305–1314. [Google Scholar]
  94. Girault, F.; Perrier, F.; Przylibski, T.A. Radon-222 and radium-226 occurrence in water: A review. Geol. Soc. Lond. Speéc. Publ. 2018, 451, 131–154. [Google Scholar] [CrossRef]
  95. Kobal, I.; Vaupotič, J.; Mittć, D.; Kristan, J.; Ančik, M.; Jerančič, S.; Škofljanec, M. Natural radioactivity of fresh waters in Slovenia, Yugoslavia. Environ. Int. 1990, 16, 141–154. [Google Scholar] [CrossRef]
  96. Beyermann, M.; Bunger, T.; Schmidt, K.; Obrikat, D. Occurrence of natural radioactivity in public water supplies in Germany: 238U, 234U, 235U, 228RA, 226RA, 222RN, 210PB, 210PO and gross activity concentrations. Radiat. Prot. Dosim. 2010, 141, 72–81. [Google Scholar] [CrossRef] [Green Version]
  97. Wallner, G.; Steininger, G. Radium isotopes and 222Rn in Austrian drinking waters. J. Radioanal. Nucl. Chem. 2007, 274, 511–516. [Google Scholar] [CrossRef]
  98. Krishan, G.; Rao, M.S.; Kumar, C.P.; Semwal, P. Radon concentration in groundwater of east coast of West Bengal, India. J. Radioanal. Nucl. Chem. 2015, 303, 2221–2225. [Google Scholar] [CrossRef]
  99. Krishan, G.; Rao, M.S.; Kumar, C.P. Estimation of radon concentration in groundwater of coastal area in Baleshwar district of Odisha, India. Indoor Built Environ. 2014, 24, 1147–1152. [Google Scholar] [CrossRef]
  100. Ahmad, N.; Rehman, J.; ur Rehman, J.; Nasar, G. Assessments of 226Ra and 222Rn concentration in well and tap water from Sik, Malaysia, and consequent dose estimates. Hum. Ecol. Risk Assess. Int. J. 2019, 25, 1697–1706. [Google Scholar] [CrossRef]
  101. Roba, C.A.; Niţă, D.; Cosma, C.; Codrea, V.; Olah, Ş. Correlations between radium and radon occurrence and hy-drogeochemical features for various geothermal aquifers in Northwestern Romania. Geothermics 2012, 42, 32–46. [Google Scholar] [CrossRef]
  102. World Health Organization. Guidelines for Drinking-Water Quality: First Addendum to the Fourth Edition; World Health Organization: Geneva, Switzerland, 2017. [Google Scholar]
Figure 1. Geological map of the province of Chimborazo with the sampling points monitored in this study. Inlet indicates the position of Ecuador and the Province of Chimborazo.
Water 15 02255 g001
Figure 2. Mean values of radon concentrations of springs and wells, according to each geological unit—lithology on the Chimborazo province (L1–L5). Error bars represent the standard deviation.
Water 15 02255 g002
Figure 3. Comparison between the ordinary mean and weight mean of radon concentrations of three samples collected in the same drinking water supplies: (a) Plaza de Rastro reservoir; (b) Catequilla spring.
Water 15 02255 g003
Figure 4. Correlation of 226Ra and 222Rn concentrations, radionuclides measured in water samples from springs detailed in Table 7, located in geological units—lithologies consisting of volcaniclastic deposits.
Water 15 02255 g004
Table 1. Monitored water springs in the Chimborazo province, classified according to geological units or lithologies and weighted mean concentration of 222Rn.
No.Water SourcesCanton/CityCoordinates222Rn Activity Concentration (Bq/L)Geological Unit/Lithology
LatitudeLongitude
1AypudAlausí2°11′36.40″ S78°49′43.76″ W0.24 ± 0.05(L1)
2CasualAlausí2°11′39.88″ S78°50′25.23″ W0.92 ± 0.14
3GampalaAlausí2°12′7.78″ S78°50′28.78″ W0.07 ± 0.05
4GuaroPallatanga2°0′13.01″ S78°55′49.02″ W2.33 ± 0.27
5GuaconaColta1°43′22.01″ S78°47′31.00″ W2.56 ± 0.40
6La Compañía—El MexicanoColta1°42′12.01″ S78°47′32.02″ W2.05 ± 0.22
7Chacaza MatipangaGuamote1°56′58.24″ S78°44′54.03″ W0.95 ± 0.07(L2)
8Guayco 1Guano1°35′2.69″ S78°41′57.78″ W3.54 ± 0.27
9Guayco 3Guano1°35′2.69″ S78°41′57.78″ W2.98 ± 0.42
10VillagránGuano1°36′32.70″ S78°38′40.16″ W2.87 ± 0.22
11Ambato PogioGuamote1°58′40.35″ S78°43′7.02″ W4.21 ± 0.44(L3)
12Chipo ChicoGuamote1°58′13.25″ S78°43′12.59″ W8.05 ± 0.38
13CatequillaChambo1°43′39.89″ S78°34′50.01″ W14.78 ± 0.99
14Galtén 1Chambo1°43′33.07″ S78°35′2.41″ W11.22 ± 0.94
15Galtén 2Chambo1°43′33.07″ S78°35′2.41″ W9.23 ± 0.68
16Galtén 3Chambo1°43′33.07″ S78°35′2.41″ W8.16 ± 0.66
17Galtén 4Chambo1°43′33.07″ S78°35′2.41″ W9.65 ± 0.50
18Matus Alto (Hacienda)Penipe1°34′16.80″ S78°30′15.56″ W12.65 ± 0.56
19Matus Alto (El Bosque)Penipe1°34′0.74″ S78°30′28.12″ W8.24 ± 0.30
20El Sagrario 1Pallatanga1°57′47.01″ S78°56′25.02″ W1.05 ± 0.06(L4)
21El Sagrario 2Pallatanga1°57′47.01″ S78°56′25.02″ W4.02 ± 0.46
22El Sagrario 3Pallatanga1°57′47.01″ S78°56′25.02″ W2.20 ± 0.09
23Las PalmasPallatanga1°58′49.01″ S78°57′10.00″ W7.52 ± 0.29
24LugmapataPallatanga1°59′8.03″ S78°57′16.03″ W1.19 ± 0.21
25Milliguayco 1Pallatanga1°58′0.02″ S78°56′40.01″ W1.69 ± 0.12
26Milliguayco 2Pallatanga1°58′0.02″ S78°56′40.01″ W1.82 ± 0.10
27MoreraPallatanga1°59′27.00″ S78°57′41.01″ W3.20 ± 0.27
28La Moya (Penicucho)Penipe1°34′23.52″ S78°31′20.61″ W1.69 ± 0.21(L5)
Table 2. Wells studied in the Chimborazo province, classification according to geological units—lithologies and weighted mean concentration of 222Rn.
No.Water SourcesCanton/CityCoordinates222Rn Activity Concentration (Bq/L)Geological Unit/Lithology
LatitudeLongitude
1CunupogyoColta1°42′32.61″ S78°46′10.17″ W11.36 ± 0.48(L1)
2AbrasRiobamba1°38′46.46″ S78°38′46.54″ W1.75 ± 0.36(L2)
3EstadioRiobamba1°41′8.91″ S78°40′19.31″ W4.00 ± 0.42
4HierbasRiobamba1°39′1.79″ S78°39′38.49″ W0.96 ± 0.22
5La HuertaRiobamba1°39′48.29″ S78°40′35.64″ W2.61 ± 0.25
6Llio 1Riobamba1°33′42.75″ S78°42′46.80″ W1.91 ± 0.22
7Llio 2Riobamba1°33′42.75″ S78°42′46.80″ W2.10 ± 0.17
8Llio 3Riobamba1°33′42.75″ S78°42′46.80″ W4.50 ± 0.77
9Llio 4Riobamba1°33′42.75″ S78°42′46.80″ W1.14 ± 0.28
10Llio 5Riobamba1°33′42.75″ S78°42′46.80″ W2.56 ± 0.49
11Llio 6Riobamba1°33′42.75″ S78°42′46.80″ W1.53 ± 0.28
12Llio 7Riobamba1°33′42.75″ S78°42′46.80″ W3.26 ± 0.37
13MaldonadoRiobamba1°39′19.86″ S78°38′52.87″ W0.53 ± 0.09
14San PabloRiobamba1°33′44.92″ S78°43′3.71″ W4.08 ± 0.37
15ServidoresRiobamba1°39′32.88″ S78°40′18.87″ W1.07 ± 0.19
Table 3. Reservoir tanks studied in the Chimborazo province and weighted mean concentrations of 222Rn.
No.Water SourcesCanton/CityCoordinates222Rn Activity Concentration (Bq/L)
LatitudeLongitude
1Colta (PT)Colta1°42′23.70″ S78°46′42.75″ W2.01 ± 0.58
2BacúnChunchi2°18′25.55″ S78°52′40.33″ W1.65 ± 0.20
3ChitaquiesAlausí2°12′26.00″ S78°50′47.00″ W1.32 ± 0.13
4Plaza de RastroAlausí2°13′10.53″ S78°51′14.40″ W0.99 ± 0.16
5TixánAlausí2°9′4.25″ S78°48′35.42″ W1.05 ± 0.28
6Cubillines (PT)Chambo1°44′52.16″ S78°32′15.74″ W0.55 ± 0.16
7Cumandá (PT)Cumandá2°12′36.01″ S79°7′46.01″ W0.18 ± 0.10
Table 4. Statistical parameters of the radon concentration in groundwater according to geological units—lithologies present in the study area.
Geological Unit/LithologyNo.Min. (Bq/L)Max. (Bq/L)Mean (Bq/L)Median (Bq/L)Standard Deviation (Bq/L)Coefficient of Variation
L140.922.561.972.190.730.37
L2180.534.502.352.331.200.51
L394.2114.789.589.233.040.32
L481.057.522.842.012.140.75
L511.691.691.691.69--
Table 5. Radon concentration in three samples from two water supplies.
Water SupplySample NumberActivity Concentration of 222Rn (Bq/L)Weighted Mean (Bq/L)Ordinary Mean (Bq/L)
Plaza de Rastro11.36 ± 42%0.99 ± 0.161.27 ± 0.37
21.60 ± 29%
30.86 ± 21%
Catequilla113.56 ± 12%14.78 ± 0.9914.83 ± 1.10
215.47 ± 12%
315.45 ± 11%
Table 6. Maximum annual effective doses by ingestion and inhalation of radon contained in the water.
CityMaximum Activity Concentration of 222Rn (Bq/L)Maximum Annual Effective Dose
Ingestion (mSv)Inhalation (mSv)
Colta11.36 ± 0.480.083 ± 0.0040.070 ± 0.003
Pallatanga7.52 ± 0.290.055 ± 0.0020.046 ± 0.002
Guano3.54 ± 0.270.026 ± 0.0020.022 ± 0.002
Chambo14.78 ± 0.990.108 ± 0.0070.091 ± 0.006
Penipe12.65 ± 0.560.092 ± 0.0040.078 ± 0.003
Chunchi1.65 ± 0.20.012 ± 0.0010.010 ± 0.001
Alausí1.32 ± 0.130.010 ± 0.0010.008 ± 0.001
Guamote8.05 ± 0.380.059 ± 0.0030.050 ± 0.002
Riobamba4.50 ± 0.770.033 ± 0.0060.028 ± 0.005
Cumandá *0.18 ± 0.10--
Note: * Concentration below the lower detection limit of RAD H2O.
Table 7. 226Ra concentrations in samples from six drinking water supplies with radon concentrations above the RAD7 detection level, ten days after sampling.
No.Water SupplyCantón/City222Rn Activity Concentration Day 1 (Bq/L)222Rn Activity Concentration Day 10 (Bq/L)22⁶Ra Activity Concentration (Bq/L)
1Guayco 1 (L2)Guano3.54 ± 0.270.41 ± 0.180.49 ± 0.22
2Guayco 3 (L2)Guano2.98 ± 0.420.39 ± 0.160.47 ± 0.19
3Galten 1 (L3)Chambo11.22 ± 0.940.56 ± 0.180.67 ± 0.22
4Galten 2 (L3)Chambo9.23 ± 0.680.51 ± 0.190.61 ± 0.23
5Galten 3 (L3)Chambo8.16 ± 0.660.49 ± 0.140.59 ± 0.16
6Galten 4 (L3)Chambo9.65 ± 0.500.49 ± 0.140.59 ± 0.17
Disclaimer/Publisher’s Note: The statements, opinions and data contained in all publications are solely those of the individual author(s) and contributor(s) and not of MDPI and/or the editor(s). MDPI and/or the editor(s) disclaim responsibility for any injury to people or property resulting from any ideas, methods, instructions or products referred to in the content.

