Article

Spatiotemporal Variation of Runoff and Its Influencing Factors in the Yellow River Basin, China

College of Water Resources and Civil Engineering, Zhengzhou University, Zhengzhou 450001, China
*
Author to whom correspondence should be addressed.
Water 2023, 15(11), 2058; https://doi.org/10.3390/w15112058
Submission received: 24 April 2023 / Revised: 21 May 2023 / Accepted: 25 May 2023 / Published: 29 May 2023
(This article belongs to the Section Hydrology)

Abstract

:
Runoff is an important component of water resources and also the basis for regional water resources development and utilization. In order to explore the new characteristics of the spatiotemporal variation of runoff in the whole Yellow River Basin, the spatiotemporal variation of runoff in the Yellow River Basin from 1982 to 2012 was studied based on the measured runoff data of 14 representative basins in the upper, middle, and lower reaches of the Yellow River Basin. The results showed that the runoff depth of the Yellow River Basin from 1982 to 2012 showed a decreasing trend, with a decrease rate of 0.3 mm/a. Among them, the discharge depth decreased significantly (p < 0.01) from 1982 to 1999, with a rate of 1.55 mm/a. Most of the area of the basin has a discharge depth of 0–10 mm, which is relatively dry. The area of higher runoff depth (40–100 mm) is decreasing and gradually concentrating in high-altitude steep-slope areas, while the area of lower runoff depth (0–10 mm) is increasing and spreading to low-altitude gentle-slope areas. After 1999, the discharge in the four sub-basins in the upper reaches decreased, and most of the sub-basins in the middle reaches also showed a decreasing trend, while the discharge in a few sub-basins, such as Qinhe River and Yiluo River, increased. The discharge depth of the sub-basins in the lower reaches increased, but the magnitude and rate of change of most of the sub-basins were consistent with the overall trend of the Yellow River Basin, which showed a decreasing trend.

1. Introduction

Runoff is a key component of the terrestrial hydrological cycle and the most important source of surface water resources. In recent decades, climate change, characterized by rising temperatures and changes in precipitation, has had a significant impact on the hydrological cycle in river basins, leading to changes in the spatiotemporal distribution of river runoff [1,2,3]. At the same time, under intensive human activities, the characteristics of the underlying surface of the basin have undergone drastic changes, which, to some extent, have altered the water production and discharge processes of the basin [4]. On the other hand, water-related activities such as reservoir regulation and water use have directly disturbed the original laws of river discharge [5]. In recent decades, under the dual influence of natural changes and human activities, significant changes have occurred in the discharge of many rivers in China, the United States, Europe, and southwestern Australia, affecting regional water resources. Therefore, it is of great importance to scientifically identify the evolution law of river discharge to support sustainable economic and social development and human survival [6,7,8].
The global discharge of many rivers has changed significantly due to the combined effects of climate change and human activities, seriously threatening regional water resources. McMahon et al. (2007) [9] analyzed annual and monthly discharge data for at least 10 years from 1221 rivers worldwide and found that global mean discharge and storage have changed significantly, particularly in southern Africa and Australia. Milly et al. (2005) [10] and Pachauri (2007) [11] used 12 climate models to simulate and predict that by 2050, the average annual runoff in high-latitude regions worldwide is expected to increase by 10–40 percent, while in some arid regions in mid-latitude regions, it is expected to decrease by 10–30 percent. Millimn et al. (2008) [12] found that in the second half of the 20th century, the runoff of most mid-latitude rivers worldwide decreased by 60% due to human activities.
The Yellow River is a well-known large river with a high sediment load, ranking as the second largest river in China and the fifth longest river in the world. As an important water source for northwestern and northern China, it is considered the lifeline of the Yellow River Basin [13,14,15]. Under the background of frequent human activities and global climate warming in the basin, especially in the past two decades, the effects of returning farmland to forest and river channel regulation projects have led to significant changes in sediment discharge of major rivers. Research by Mu et al. (2007) [16] showed that the Yellow River is also one of the rivers whose flow has been drastically changed by human activities. In the 27-year period from 1972 to 1998, the Yellow River had 21 years of downstream flow interruption, with a total of 1050 days of interruption. In the 1990s, downstream flow interruptions in the Yellow River became more frequent, the duration of the interruption became longer, and the interrupted section continued to extend upstream [17]. There have been many studies on the characteristics of flow changes in the Yellow River, mainly related to the effects of land use changes on flow, the effects of human activities on flow, and the analysis of flow sequences during downstream interruptions, and many of these studies have focused on a specific section or region. However, there has been insufficient comprehensive analysis of the flow of the entire Yellow River basin, making it difficult to systematically and deeply understand the new characteristics of spatial and temporal changes in the flow of the entire river [18,19,20]. We divide the Yellow River basin into 14 sub-basins, and integrate and analyze the evolution of the Yellow River’s flow at the whole basin scale, in order to comprehensively understand the changes in the Yellow River’s flow and provide scientific reference for regional water resource planning and optimal allocation of water and soil conservation measures.

2. Materials and Methods

2.1. Study Area

The Yellow River Basin is located in 96° E–119° E, 32° N–42° N (Figure 1), with a total length of 5464 km. It covers four geographical units: the Qinghai-Tibet Plateau, the Inner Mongolia Plateau, the Loess Plateau, and the Huang-Huai-Hai Plain, with a basin area of 752,443 × 104 km2. The temperature in the basin varies greatly throughout the year, with temperatures generally ranging from 31–37 °C north of 37° N and 21–31 °C in the south. There is a large diurnal temperature range throughout the basin, with a temperature difference of 13–16.5 °C between day and night. Annual precipitation in most areas ranges from 200–650 mm, with the southern part of the upper and lower reaches receiving more than 650 mm of precipitation. Due to the influence of topography, precipitation on the northern slopes of the Qinling Mountains on the southern border can reach 700–1000 mm, while some areas in Ningxia and Inner Mongolia receive less than 150 mm of precipitation. Precipitation is unevenly distributed, with a north-south precipitation ratio of more than 5. The Yellow River Basin is dry in spring and winter and rainy in summer and fall, with 70% of annual precipitation occurring from June to September and 40% in July and August. The inter-annual variability of precipitation is significant, with the ratio of maximum to minimum annual precipitation ranging from 1.7 to 7.5. In this study, several sub-basins were selected in the upper, middle, and lower reaches of the Yellow River basin, and the locations of water control stations for sub-basins 1–14 are shown in Figure 1 and their corresponding names are listed in Table 1.

2.2. Datasets

The meteorological and hydrological data used in this study include the following: (1) The annual cumulative precipitation and mean temperature datasets with 1 km resolution from 1982 to 2019 for the whole country, obtained from the National Science and Technology Infrastructure Platform-National Earth System Science Data Center (http://www.geodata.cn), (accessed on 16 May 2021). (2) NDVI data are from GIMMS~NDVI3g~V1.0 dataset (https://ecocast.arc.nasa.gov/data/pub/gimms/3g.v1/), (accessed on 5 June 2021) and shared Data for MOD13Q1 Class products provided by NASA (https://lpdaac.usgs. gov) (accessed on 7th December 2020). The pixel dichotomy method was used to convert NDVI into vegetation coverage [21]. (3) The monthly runoff, soil moisture and soil temperature dataset with a resolution of 0.08333° from 1960 to 2012 in China, obtained from the National Science and Technology Infrastructure Platform-National Earth System Science Data Center (http://www.geodata.cn), (accessed on 19 November 2020). The corresponding product files are in NetCDF (NC) format. This dataset was generated by the TRIPLEX-GHG model, which is driven by land surface basic information data and historical meteorological data. The accuracy of the publicly available and verified data used to drive the model simulation has been validated in relevant academic or diploma theses [22].

2.3. Methodology

2.3.1. Theil–Sen Median Method

The Theil–Sen Median method, also known as the Sen’s slope estimator, is a non-parametric trend analysis method. It has high computational efficiency and is insensitive to measurement errors and outliers. It is widely used in the calculation of long time series data. The formula for the Sen’s slope estimator is as follows:
β = median ( x j x i j i ) , j > i
where xj and xi represent time series data; if β is greater than 0, the time series data show an increasing trend, otherwise they show a decreasing trend. The specific calculation formula is as follows:
s l o p e = n × i = 1 n ( i × X i ) i = 1 n i i = 1 n X i n × i = 1 n i 2 ( i = 1 n i ) 2
where slope is the slope of the simple linear regression equation of variable X with the time variable; i is the time variable, which is an integer from 1 to n; n is the number of years in the study period; and Xi is the average X in the i-th year. If slope is less than 0, it indicates a decreasing trend of the X series with time, while if it is greater than 0, it indicates an increasing trend. The absolute value of the slope indicates the rate of change of X, with a larger absolute value indicating a faster change.

2.3.2. Analysis of Runoff Depth

The Yellow River Basin is vast in size and has a large difference in elevation between its eastern and western regions. Studies have shown that there are significant differences in runoff depth across different elevations and slopes in the Yellow River Basin, and vegetation also has different growth tendencies in different regions. Compared with forests and grasslands, cropland in the Yellow River Basin tends to have lower elevations and gentler slopes. In areas with high elevation and steep slopes, there is mainly mutual transformation between forests and grasslands, while in areas with low elevation and gentle slopes, there is mainly mutual transformation between farmland and man-made land. Based on this, the introduction of topographic factors such as elevation and slope can provide a more effective and in-depth explanation of the spatiotemporal pattern changes of runoff in the Yellow River Basin.
Using digital elevation models (DEM) and slope topographic data, the elevation of the Yellow River Basin was divided into six types based on the elevation levels of the three steps in the western, central, and eastern parts of the basin: 0–800 m, 800–1200 m, 1200–1600 m, 1600–2000 m, 2000–2500 m, and more than 2500 m, with area ratios of 12%, 18.5%, 28%, 10.7%, 5.2%, and 25.6%, respectively. The slope of the Yellow River basin was divided into three types: 0–10°, 10–20°, and greater than 20°, which accounted for 40%, 53.2%, and 6.8% of the total area, respectively.
The Yellow River basin is divided into three climatic regions: arid, semi-arid, and semi-humid. The distribution of runoff depth decreases from southeast to northwest, with the annual runoff depth in mountainous areas reaching 300 mm or more, while in the Ordos, Ningxia, and Inner Mongolia Hetao Plain, the annual runoff depth is less than 5 mm. Due to the special geographical location of the Yellow River basin, the spatial heterogeneity of runoff is obvious. In order to study and explain the pattern of runoff variation in more detail, the runoff is divided into five levels: T1 (0–10 mm), T2 (10–40 mm), T3 (40–70 mm), T4 (70–100 mm), and T5 (>100 mm).

3. Results and Discussion

3.1. Overall Characteristics of Runoff in the Yellow River Basin

Taking 1999 as the time division point, and using t1: 1982–1999 and t2: 2000–2012 as two sub-periods, the changes in runoff depth in the Yellow River Basin before and after the 21st century are analyzed. Due to geographical factors such as being located in arid, semi-arid, and semi-humid climate zones and having a large latitude and longitude span, the runoff in the Yellow River Basin and other elements, such as precipitation, temperature and vegetation cover, have strong spatial heterogeneity. According to Figure 2, the multi-year characteristic of runoff in the Yellow River Basin shows a spatial pattern, which is abundant in the south, scarce and dry in the north, and scarce in the northwest but abundant in the southeast. In addition, the distribution patterns of climate elements (precipitation, temperature), vegetation cover, soil moisture, and soil temperature are similar to those of runoff depth. This is consistent with most research findings [23,24].
Due to the influence of geographical location, climatic conditions, underlying surface conditions, and human activities, the basic hydroclimatic conditions of the sub-basins in the Yellow River basin also show significant differences. According to Table 2, water resources are abundant in the downstream sub-basins such as Daicunba, Wuzhi-Lijin, with the average annual runoff depth ranging from 70 to 140 mm, while compared with the upper sub-basins of Xiaoheyan-Shizuishan and Shizuishan-Toudaoguai with higher latitude and arid climate, the average annual runoff depth is about 0.97 mm. The overall runoff level in sub-basins located in the middle reaches of the Yellow River Basin is between the upstream and downstream levels, with sub-basins located relatively farther north, such as Fenhe River, Jinghe River, and Kuyehe River, being drier with less precipitation and lower runoff depth (10–15 mm), while sub-basins located relatively farther south, such as Weihe River and Yiluo River, have lower runoff depth (38–73 mm). According to Table 3, the average annual runoff depth in the Yellow River basin was 30.81 mm and 28.59 mm in T1 and T2 periods, respectively, and 29.87 mm in the whole period from 1982 to 2012. After 1999, the runoff depth of the four upstream sub-basins decreased, while most of the sub-basins in the middle reaches showed a decreasing trend, and only a few sub-basins, such as the Qinhe River and the Yiluo River, showed an increasing trend. The discharge depth of the downstream sub-basins increased, but the changes in most sub-basins were consistent with the overall trend of the Yellow River Basin and showed a decreasing trend (Table 3). During the t1 period, the magnitude of change decreased, while during the t2 period, it increased. The change rates of the middle reaches subbasins were more consistent with those of the Yellow River Basin, with the Jinghe, Beiluohe, and Weihe rivers showing a significant decreasing trend in the runoff depth during the T1 period and an increasing trend during the T2 period, most of which were not significant (Table 3). Overall, from 1982 to 2012, the runoff depth in the Yellow River Basin showed a decreasing trend (slope = 0.3 mm/a). However, the trend was not significant (p = 0.14). Meanwhile, the vegetation cover showed an overall significant increasing trend during the same period [25,26,27]. Specifically, in the middle reaches of the Yellow River, the vegetation coverage has increased at the fastest rate in history over the past 30 years, while the discharge depth has decreased at the most obvious rate. This indicates that a series of large-scale projects, such as farmland reclamation, afforestation, and grassland restoration, have significantly increased the vegetation cover, leading to a decrease in runoff [28,29]. This is consistent with the findings of Yang et al. (2022) [23], who believed that the restoration of vegetation in the middle reaches of the Yellow River was the main cause of the sharp decrease in runoff. The spatial distribution pattern of the runoff depth showed significant consistency with other related factors, with higher values in the southeast and lower values in the northwest. The increase in runoff depth in the Yellow River basin after 1999 may also be closely related to climate change and human activities. Since 1961, the climate in the Yellow River basin has gradually become warmer and drier, with a temperature increase rate of 0.33 °C/10a [30]. The rising temperature has led to the melting of glaciers in the headwaters of the basin, resulting in the formation and accumulation of river runoff, which has created a compensatory mechanism for the runoff consumption of vegetation growth [31].
The runoff values vary significantly at different altitudes. T1 is mainly distributed in areas between 800 and 2500 m above sea level, with a wide distribution range and an area ratio of 51.02%, indicating that the basin is relatively dry and water-scarce. T2 is mainly distributed in areas between 800 and 1600 m above sea level, as well as above 2500 m, with an area ratio of 24.35%. T3T5 are mainly concentrated in areas above 2500 m above sea level (Figure 3a). This study suggests that over the past 30 years, different levels of runoff depth in the Yellow River Basin have shown different spatial trends. There has been a trend for the high-level discharge depth to converge in the high-altitude and steep-slope areas, while the low-level discharge depth has spread to the low-altitude and gentle-slope areas, such as the southeastern spread of the middle reaches and the convergence in the headwater region. This is consistent with the conclusion of Zhao et al. (2019) [32] that vegetation restoration leads to a decrease in both runoff and streamflow. Precipitation has a significant influence on the distribution of runoff depth. In areas of the Yellow River Basin with less than 400 mm of precipitation, the runoff depth is basically between 0 and 10 mm, while in areas with more than 400–600 mm of precipitation, the runoff depth is basically greater than 40 mm (Figure 3b). Temperature and soil temperature have a similar effect on the distribution of runoff depth. T1 is mainly distributed in areas with a temperature higher than 7 °C, while other higher runoffs (T3T5) are mainly distributed in areas with a temperature lower than 3 °C or higher than 11 °C, indicating that the upstream areas with lower temperatures and the downstream areas with higher temperatures have a higher runoff depth (Figure 3c,f). Areas with a vegetation cover fraction (FVC) greater than 0.6 have a higher runoff depth level, while areas with a FVC less than 0.4 have runoff depths generally less than 40 mm, indicating that in these areas with larger FVC, the effect of vegetation restoration is very well, which plays the role of water conservation (Figure 3d). T1T2 are concentrated in areas with soil moisture between 10 and 20%, while T3T5 are basically distributed in areas with soil moisture greater than 10% (Figure 3e). Overall, most of the runoff in the Yellow River Basin is concentrated in areas with a slope less than 20°, with T1T2 accounting for a large area of 79.07%, while the area ratio of T3T5 is only 12.01%, indicating that runoff is concentrated in gentle-slope areas, but the basin as a whole is relatively dry (Figure 3g).

3.2. Temporal Variation Characteristics of Runoff in the Yellow River Basin

3.2.1. Analysis of Runoff Change Rate

From 1982 to 2012, the water discharge depth in the Yellow River Basin showed a decreasing trend with a slope of 0.3 mm/a. From 1982 to 1999, there was a significant decreasing trend in water discharge depth (p < 0.01) with a slope of 1.55 mm/a, while from 2000 to 2012, there was an increasing trend in water discharge depth (p < 0.05) with a slope of 1.47 mm/a, but with large fluctuations and instability (Figure 4a). Vegetation cover also showed a significant increase during this period [33,34,35]. This seems to contradict the belief of other hydrologists that an increase in vegetation cover leads to a decrease in streamflow. The reason is that in other studies, the spatial scale of the selected basin is relatively small, while the Yellow River basin has a relatively large spatial scale. In addition, most of the previous studies focused on the effect of the Grain for Green project in the middle reaches of the Yellow River on its runoff, without considering the overall situation of the Yellow River basin [36]. The water discharge depth in Datong River and Huangshui River is at a higher level, and the overall change amplitude is larger, reaching the historical maximum in 1990. In contrast, the water discharge depth in the northwestern Hetao Plain area, from Xiaheyuan to Shizuishan and from Shizuishan to Toudaoguai, is relatively low, with small fluctuation amplitude and range. From 1982 to 2012, the fluctuation trend of the annual water discharge depth in the eight sub-basins of the middle reaches was consistent with that of the Yellow River basin. Among them, the six sub-basins in the northern part, namely Fenhe River, Jinghe River, Kuye River, Beiluo River, Qinhe River, and Wuding River, all showed changes in water discharge depth between 0 and 50 mm. The sub-basins in the southern region, namely Weihe River and Yiluo River, had a relatively high water discharge depth with a maximum of 275 mm, which is consistent with the spatial characteristic of more water in the south than in the north of the basin (Figure 4c). The water discharge depth in the two downstream sub-basins, Wuzhi-Lijin and Daicunba, fluctuated greatly and showed an extremely unstable trend, indicating a significant periodic change in the abundance and scarcity of downstream water discharge. In 2004, the water discharge depth in the downstream reached a historical peak, with levels of 324 mm and 176 mm, respectively, which were significantly higher than those in the upstream and middle reaches sub-basins (Figure 4d).
The runoff depth of different pixels shows significant spatial heterogeneity. During the period t1, the southern region of the basin showed a decreasing trend in runoff depth with a change rate less than 0, and the minimum slope was 18.78 mm/a. The downstream and northeastern regions showed a higher level of change rate with a maximum slope of 7.62 mm/a, indicating an increase in discharge depth. Meanwhile, in the central, northern, and northwestern regions, the change rate of discharge depth was within −2–2 mm, and due to the perennial drought, the discharge depth remained relatively stable with no significant changes. During the t2 period, the rate of change of runoff in the central, northwestern, and northern regions showed a sudden change, and the slope dropped sharply below 0 mm/a. The underlying surface changes were the main reasons for the runoff changes in the Yellow River Basin. After 1999, large-scale afforestation was carried out in the middle reaches of the basin, which led to changes in the underlying surface and thus to changes in discharge. The upper, lower, and middle-south regions of the basin showed an increase in runoff depth rate (slopemax = 18.86 mm/a) (Figure 5b). Overall, during the period 1982–2012, the runoff depth rate in the southern part of the basin decreased with a minimum slope of 4.66 mm/a, while the downstream runoff depth showed an increasing trend with a maximum slope of 5.10 mm/a. The discharge depth in the upstream, northern, and northwestern regions of the basin had small slope values, indicating that the discharge depth remained relatively stable without significant changes. The headwater area was at a higher level, while the northwestern area was at a lower level (Figure 5c). According to the research of Guo et al. (2022) [37], the runoff increases rapidly after deforestation, and it generally takes about ten years for the regional runoff to reach a state of equilibrium. In addition, the time required for runoff to return to equilibrium after afforestation is longer than that after deforestation. Therefore, although water and soil conservation measures such as “Grain for Green” have been initiated in the middle reaches of the Yellow River, human activities such as deforestation still exist in other areas of the basin, such as vegetation destruction caused by land development in the lower reaches and soil erosion caused by tree felling in the headwater area [38]. All these factors can cause a rapid increase in runoff in the Yellow River basin, and the time required for runoff to reach a state of equilibrium after afforestation is longer than that after deforestation before 1999, which is the reason for the increase in runoff depth in the Yellow River basin from 2000 to 2012.

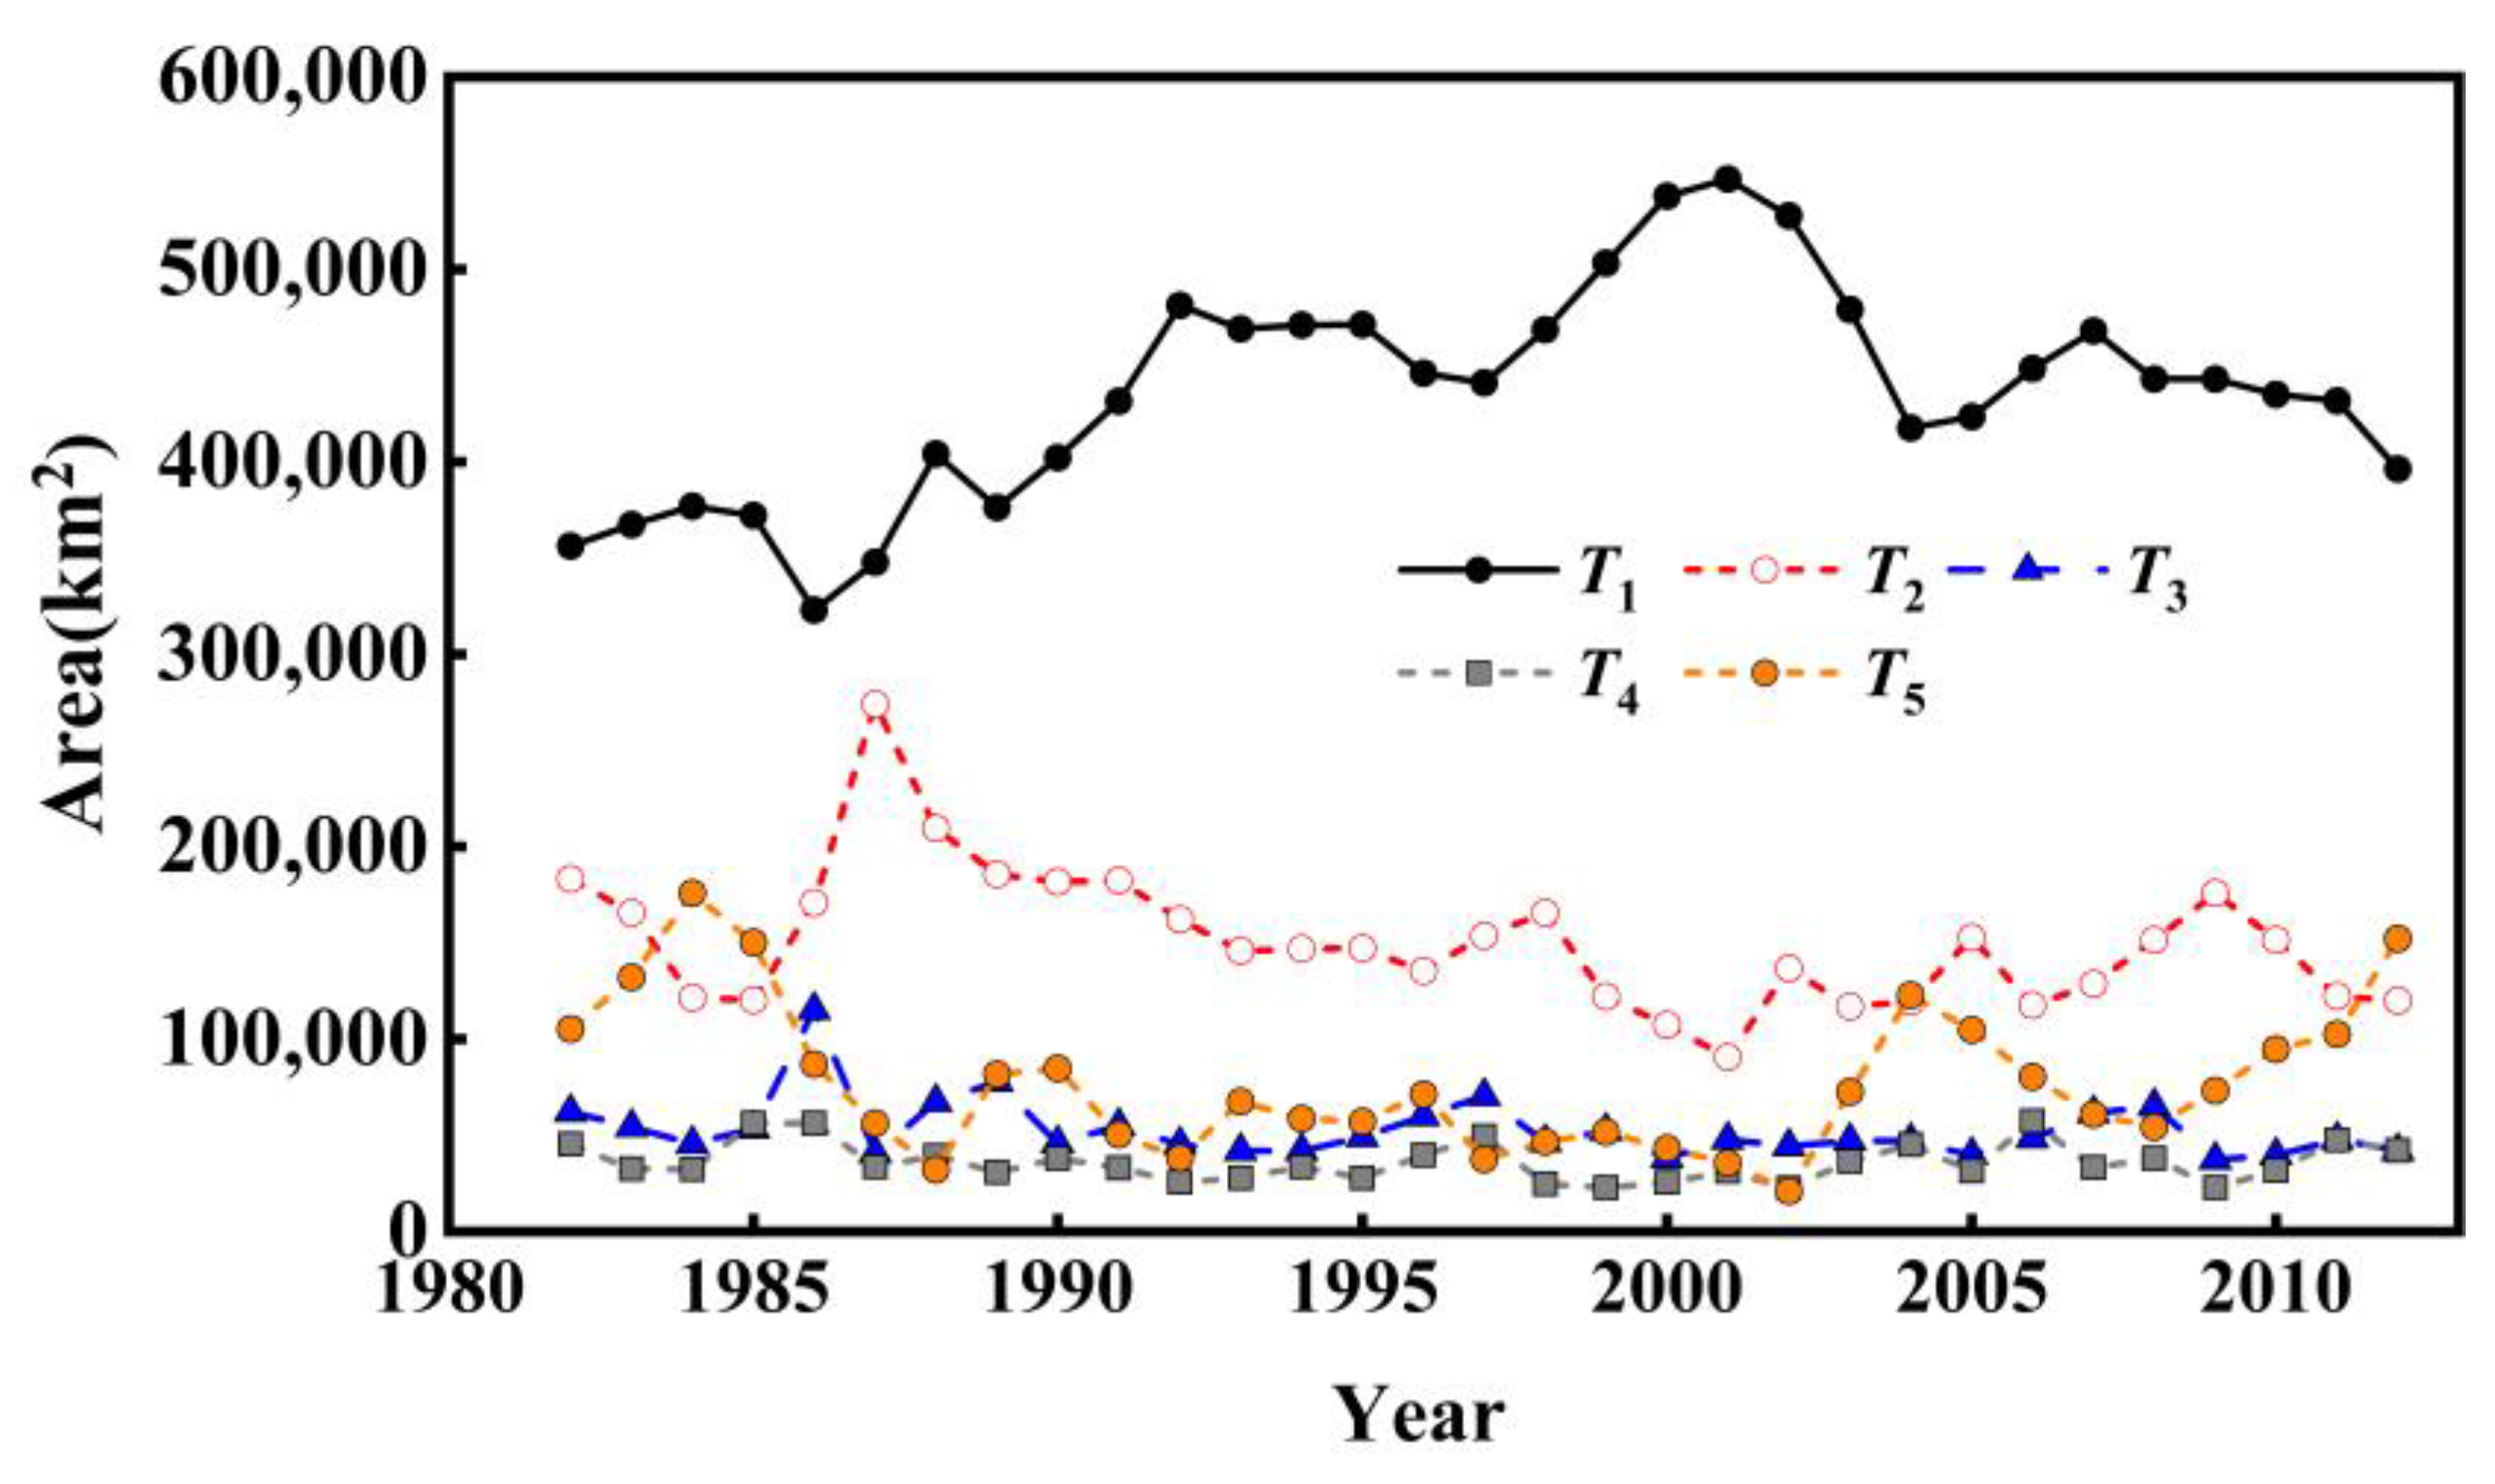
3.2.2. Analysis of Runoff Variation at Different Levels

The differences in the area of runoff depth for the different levels are significant. The area of T1 remains consistently at the highest level, peaking at 5.53 × 10⁴ km2 in 2001, indicating a generally dry basin. The areas of T2 and T5 are at medium to high levels, with historical peak areas of 28.66 × 10⁴ km2 and 1.84 × 10⁴ km2, respectively. T3 and T4 have the smallest areas, both less than 1 × 10⁵ km2. Prior to 2005, the area of T1 increased significantly, while the areas of T2 and T5 decreased slightly. Since the basin area is fixed, this can be generalized as a change in runoff level from high to low, indicating an exacerbation of aridity in the basin after 1982. After 2005, the area of T1 decreased slightly while the area of T5 increased, but overall, the runoff depth in the Yellow River basin is relatively low, with most of the area falling under T1, indicating an arid state (Figure 6).
The T1 area of Datong River, Huangshui River, Xiaheyuan-Shizuishan, and Shizuishan-Toudaoguai is at the highest level. Among them, T2T4 areas of Datong River and Huangshui River occupy a certain area, but their level is lower, and the higher the level, the smaller the area. T2 and T3 showed relatively more obvious changes, but their area is about 1/3 to 1/2 of T1 (2000–4000 km2). T1 occupies almost the whole area of the two upstream basins of Xiaheyuan-Shizuishan and Shizuishan-Toudaoguai, and the trend curve is stable, which is drier than the other two upstream basins (Figure S1). In the middle reaches, T1 and T2 occupy almost all the areas of the other basins, except for the large fluctuations in the deep-water level of the Yellow River. T3T5 showed very small changes from 1982 to 2012. The northern basins, such as Fenhe River, Jinghe River, Kuye River, and Wuding River, were all key areas for returning farmland to forest. Due to the changes in the vegetation of the basins, the changes in the soil and other underlying surfaces have been intensified, exacerbating the trend of decreasing discharge depth in these basins (Figure S1). Due to the relatively abundant water resources, the runoff depth level of the Wuzhi-Lijin and Daicunba basins is high, and the T4 and T5 areas occupy a relatively large proportion and are highly variable. As the downstream outlet of the entire Yellow River basin, the interannual changes in discharge depth are more obvious (Figure S1).

3.3. Spatial Variation Characteristics of Runoff in the Yellow River Basin

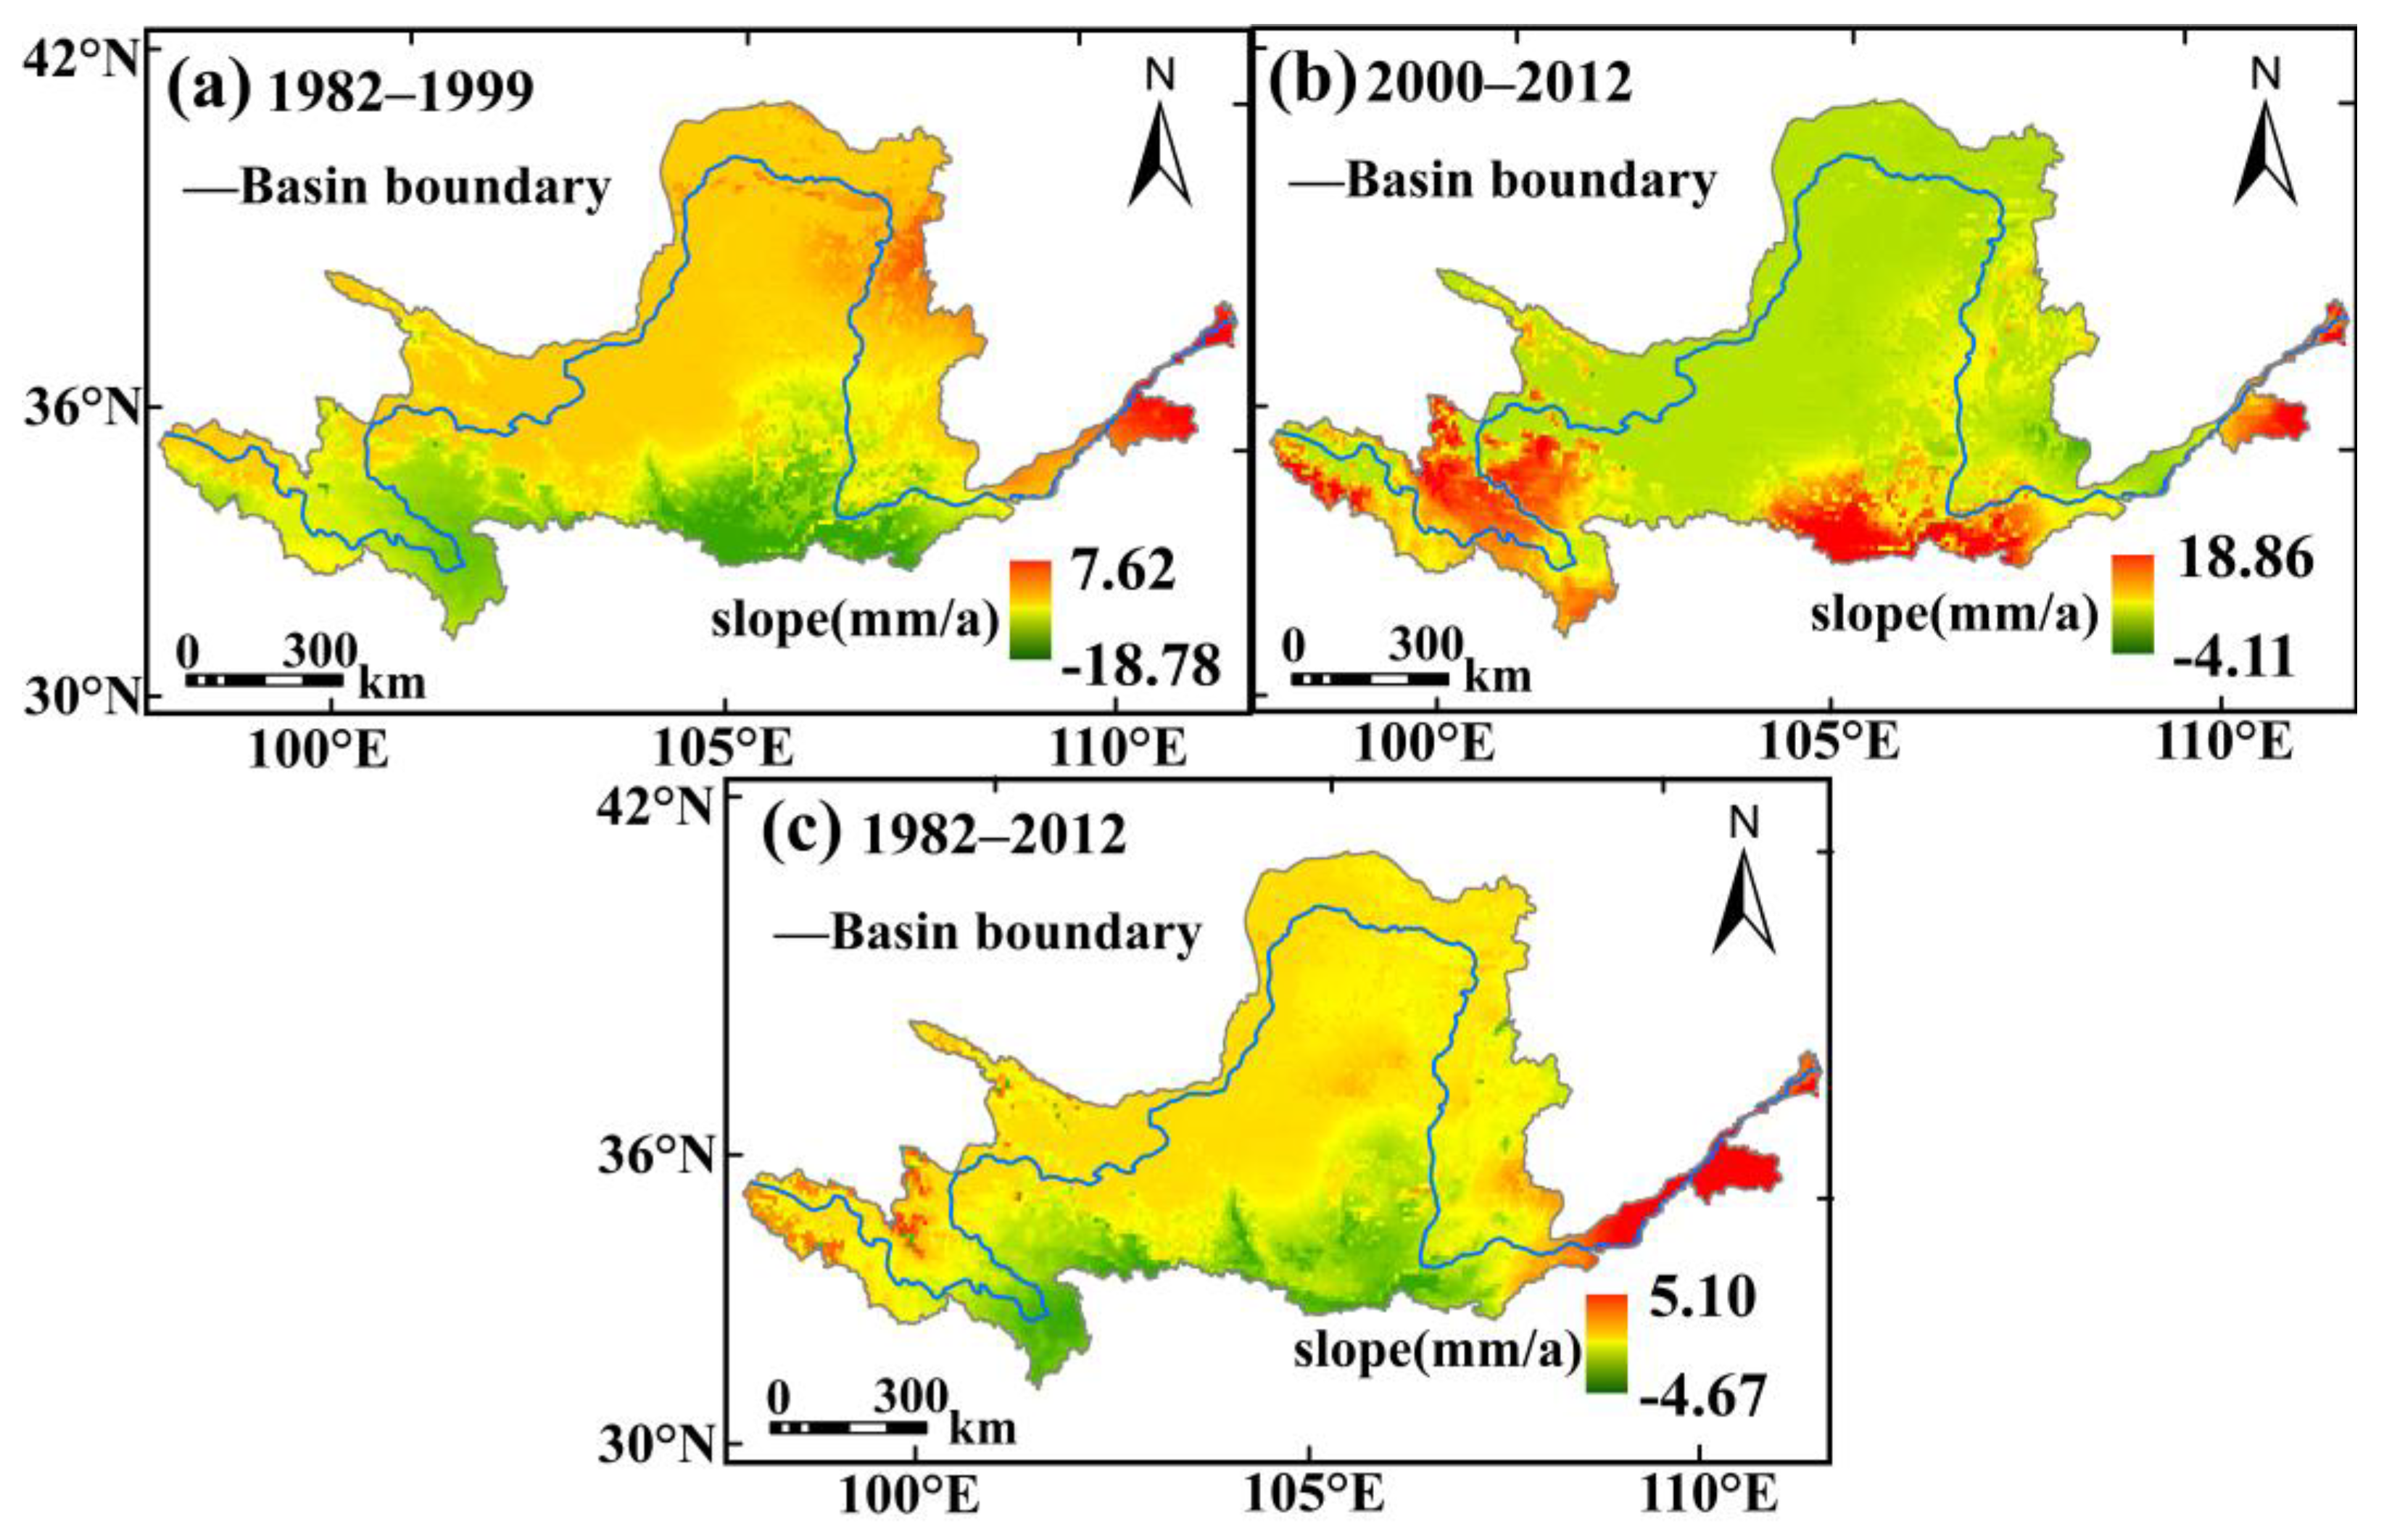
3.3.1. Spatial Changes of Runoff in Different Periods

The spatial heterogeneity of runoff depth in the Yellow River Basin is quite obvious in three different periods, and there are also some differences in the maximum values. The maximum runoff depth was 447.67 mm in T1, 441.41 mm in T2, and 445.04 mm from 1982 to 2012 (Figure 7). The middle reaches of the Yellow River are the areas where the discharge depth has decreased the most, decreasing from northwest to southeast. The increase in temperature, water consumption for vegetation planting, and increased evapotranspiration have caused the runoff depth to decrease to varying degrees in the sub-basins of the middle reaches. In contrast, downstream runoff depth has increased. From 1982 to 2012, the northwestern part of the Yellow River basin was the driest region, while the southern, southeastern, and upstream headwaters were relatively wetter. The runoff changes in the Wuding River, Kuye River, and Fen River were significant, and the degree of drought intensified.

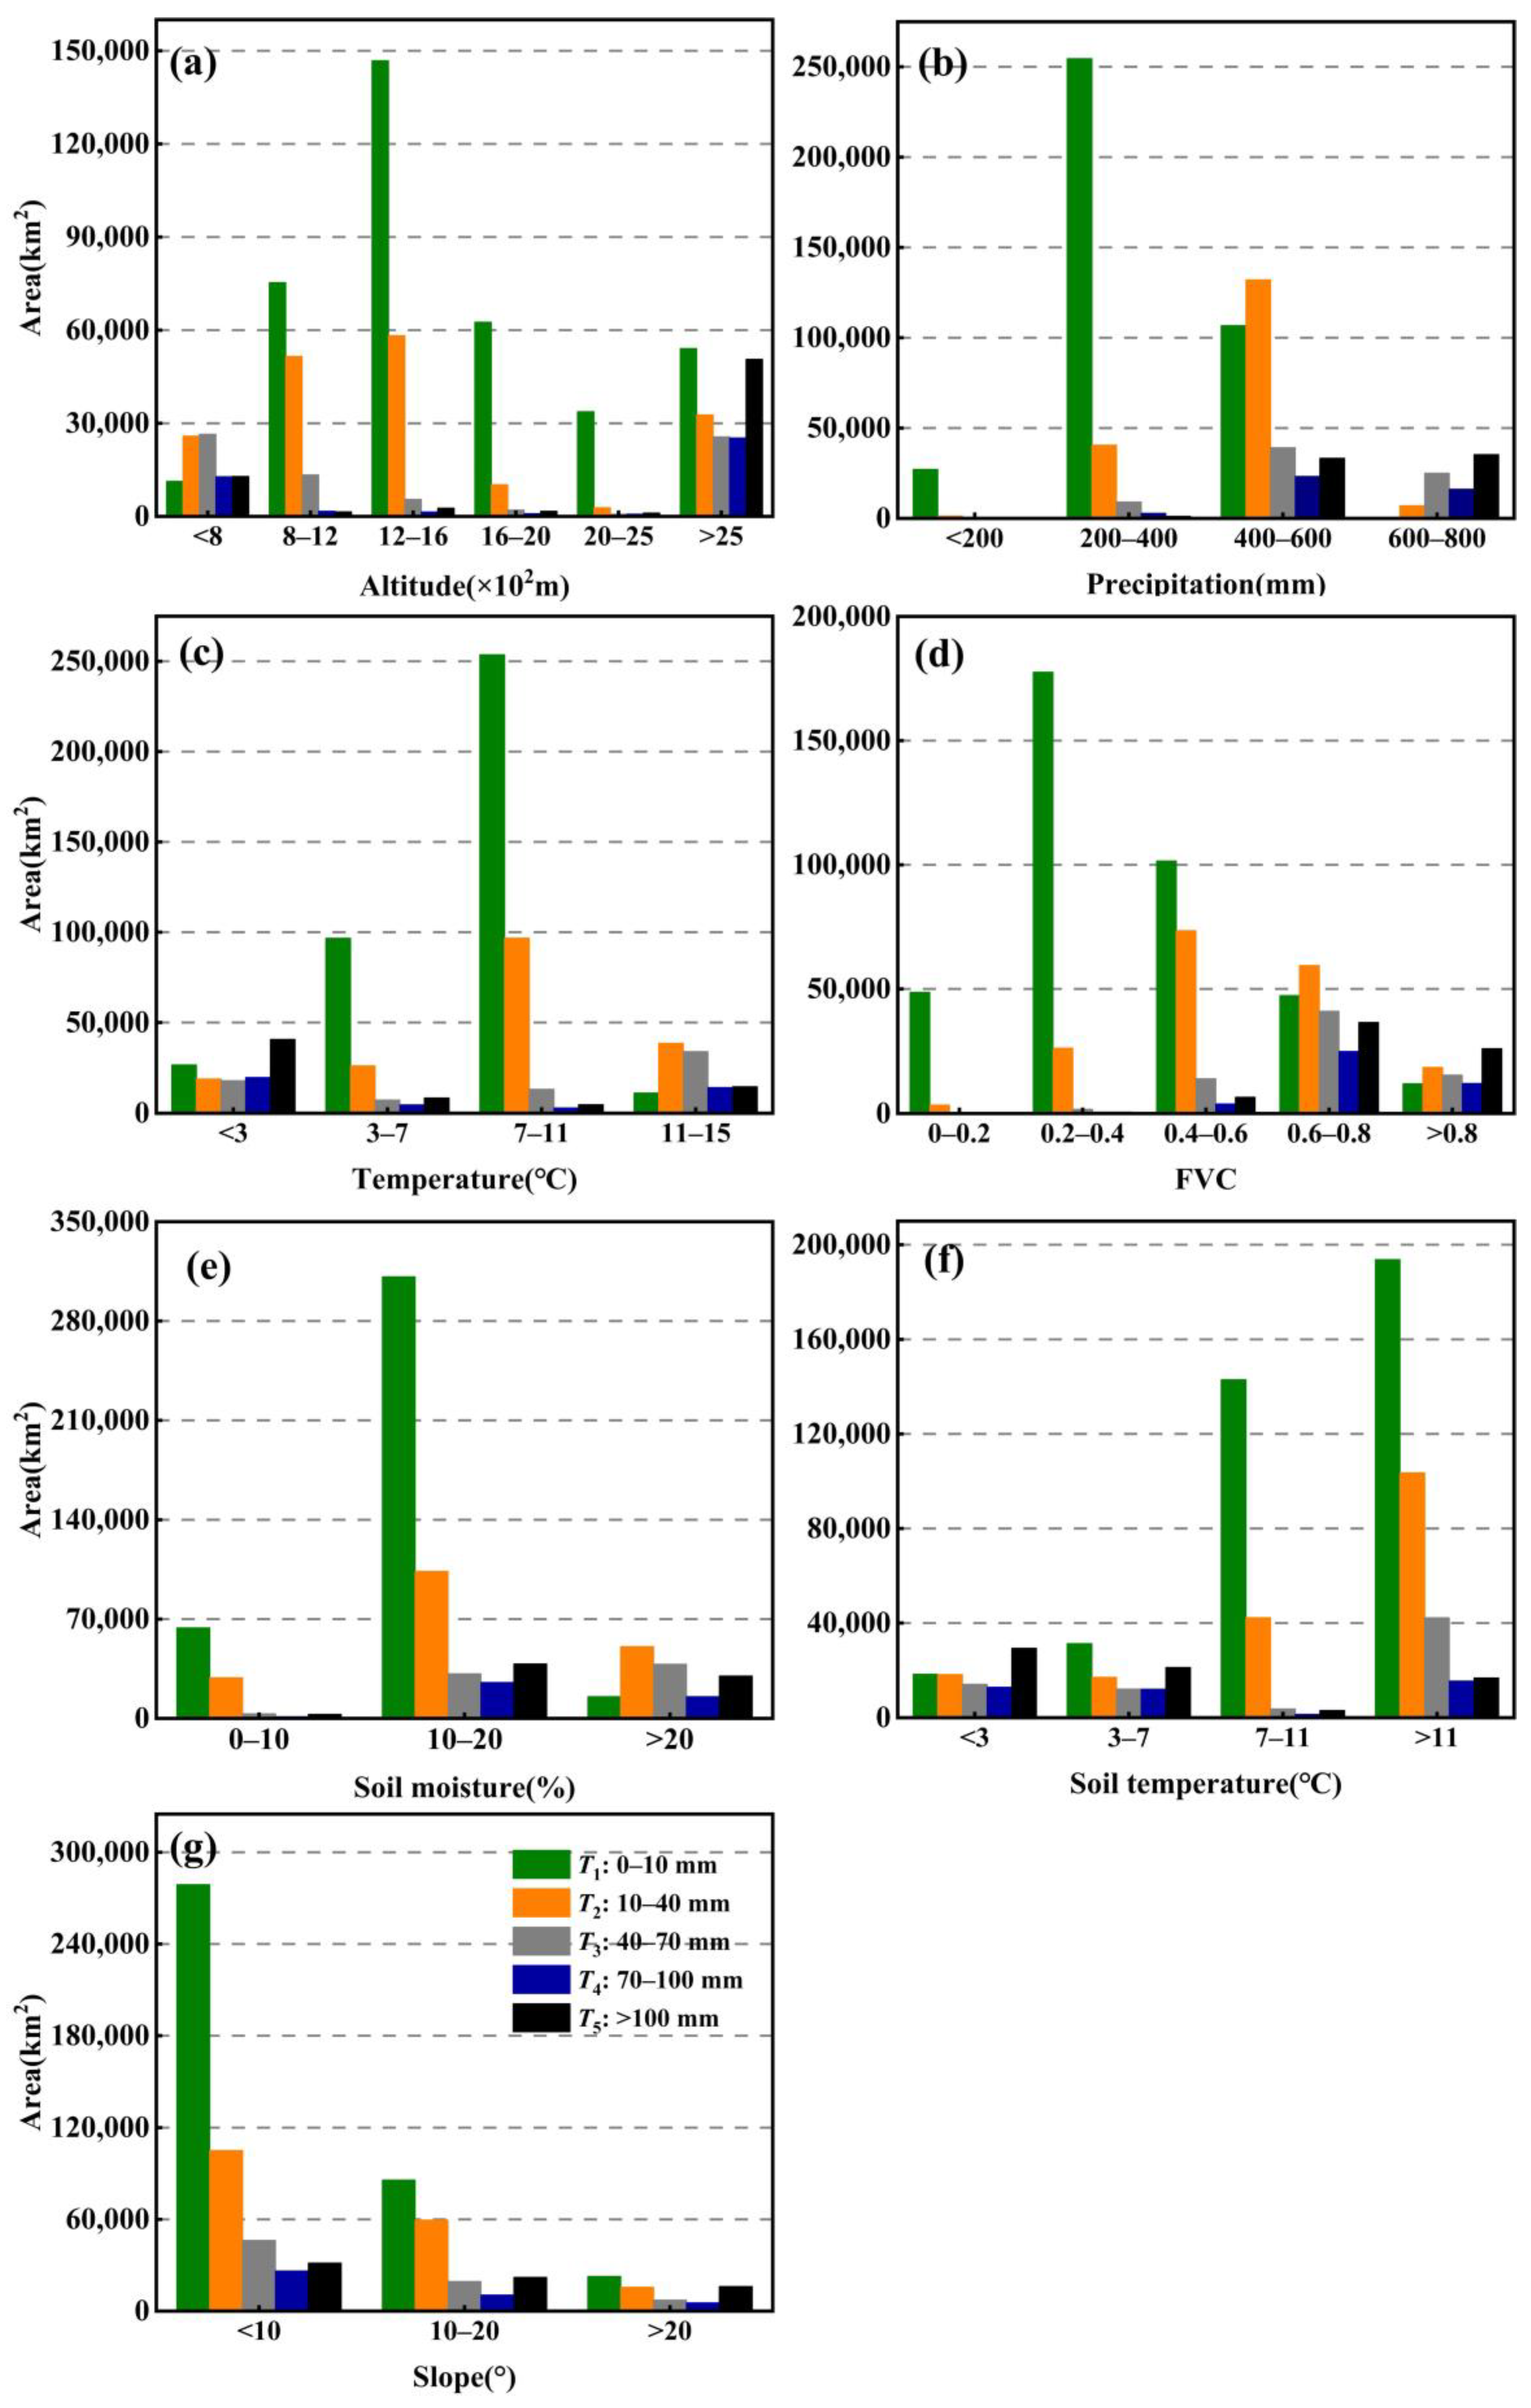
3.3.2. Spatial Variation of Different Runoff Depths

The elevation variability of T3T5 is relatively large, with large fluctuations. For example, T5 reached a historical peak of 4006.52 m in 2002, while it was only 2268.48 m in 1984. This indicates that T5 has been gradually concentrated in high-altitude areas, such as the headwater region, over time, and also shows that areas with high discharge depth have been gradually reduced, exacerbating the aridity of the basin (Figure 8). With increasing discharge, the elevation variability becomes more unstable, and the average elevation increases with increasing discharge. The elevation variability of the low-flow depth is relatively stable, and the amplitude of fluctuation is smaller. Overall, areas with higher elevations in the Yellow River basin have larger discharge depths and larger fluctuations, while areas with lower elevations have smaller discharge depths. The slope of discharge depth and elevation show similarity: the larger the regional slope, the larger the discharge depth and the wider the range of slope changes. For example, the slope of T5 changes between 9°–16°, while T1 changes between 6°–8°, and the stability of changes decreases sequentially from T1 to T5, corresponding to the high-altitude steep-slope area of the river headwater region and the low-altitude gentle-slope area of the Hetao Plain (Figure 8b).
During the T1 and T2 periods, T1 and T5 moved from upland areas to lowland areas, while T2 to T4 moved in the opposite direction, from lowland areas to upland areas, indicating a gradual decrease in overall runoff depth. The decrease in runoff depth in low-altitude areas and the concentration of mid- to high-altitude runoff in high-altitude areas both indicate a decrease in runoff depth throughout the watershed (Table S1). The slope of T1 and T2 increased from gentle slopes to steep slopes, while the slope of T3 to T5 decreased from steep slopes to gentle slopes, indicating a decrease in runoff in the basin (Table S2). When analyzing the sub-basins, it was found that the upstream sub-basins were mainly characterized by T1 and T2 with an increase in slope, and mostly moved from low to high areas. In the middle reaches, the variation of elevation and slope differed significantly among different discharge levels. In the northern part of the basin, such as the Jinghe and Kuyehe rivers, low-flow discharge covered most of the area, and the discharge depth decreased with altitude, while the slope became steeper, indicating that the aridity trend of the basin was spreading to the southeast. In the southern part of the basin, taking Yiluo River as an example, T2 and T3 moved to the high-altitude steep-slope area in the northwest, while T4 and T5 moved to the low-altitude gentle-slope area in the southeast, indicating a decreasing trend of runoff in the basin. Water resources in the downstream sub-basin are relatively abundant, with T4 and T5 occupying the main area, and the runoff depth increased with altitude, while the slope mainly moved toward gentle slopes.

4. Conclusions

Under the background of climate change and intensified human activities, river runoff has changed significantly, and the ecological environmental protection and sustainable development of the Yellow River basin are facing important challenges. The authors collected meteorological and hydrological data of 14 sub-basins in the upper, middle, and lower reaches of the Yellow River from 1982 to 2012, analyzed the variation characteristics of runoff and its influencing factors in the Yellow River Basin, analyzed the possible causes of runoff change, and discussed the regional differentiation of runoff change. The runoff in the Yellow River Basin shows a spatial pattern of less runoff in the south, less runoff in the north, less runoff in the northwest, and more runoff in the southeast. In addition, the distribution pattern of climate elements (precipitation and temperature), vegetation cover, soil moisture, and soil temperature is similar to that of runoff depth. The runoff depth in the Yellow River Basin decreased from 1982 to 2012, and the runoff depth decreased significantly from 1982 to 1999. The runoff depth in most areas of the basin is low, which belongs to a relatively arid state. The area of the higher runoff depth area is decreasing and gradually concentrating in the high-altitude steep-slope area, while the area of the lower runoff depth area is increasing and spreading to the low-altitude gentle-slope area. Further studies are needed to better understand the causes of the observed changes in Yellow River flows and to examine how these changes could affect the ecosystems of the region.

Supplementary Materials

The following supporting information can be downloaded at: https://www.mdpi.com/article/10.3390/w15112058/s1, Figure S1: Variation of runoff depth of different grades in sub-basins of the Yellow River Basin; a-n sub-basins are successively: Datong River, Huangshui River, Shizuishan-Tou Daoguai, Xiaheyan-Shizuishan, Fen River, Jing River, Kuye River, Beiluo River, Qin River, Wei River, Wuding River, Yiluo River, Wuzhi-Lijin River, Daicunba; Table S1: Elevation changes of runoff in the Yellow River Basin and its sub-basins; Table S2: Slope variation of runoff depth in the Yellow River Basin and its sub-basins.

Author Contributions

Conceptualization, S.J.; methodology, S.J.; software, J.C.; validation, S.J.; formal analysis, J.C.; investigation, S.J.; resources, J.C.; data curation, S.J.; writing—original draft preparation, S.J.; writing—review and editing, J.C.; supervision, S.J.; project administration, S.J.; funding acquisition, S.J. All authors have read and agreed to the published version of the manuscript.

Funding

Qian Kehe Zhicheng (2023) Yiban 206; Huang Committee Outstanding young Talents Science and technology project (HQK-202305); the Training Program for Young Backbone Teachers in Colleges and Universities of Henan Province (2021GGJS003); the Henan Natural Science Foundation (212300410413), the Henan Youth Talent Promotion Project (2021HYTP030).

Data Availability Statement

Not applicable.

Conflicts of Interest

The authors declare no conflict of interest.

References

  1. Chen, Y.; Wang, K.; Lin, Y.; Shi, W.; Yi, S.; He, X. Balancing green and grain trade. Nat. Geosci. 2015, 8, 739–741. [Google Scholar] [CrossRef]
  2. Chen, H.; Zhang, X.; Abla, M.; Lü, D.; Yan, R.; Ren, Q. Effects of vegetation and rainfall types on surface runoff and soil erosion on steep slopes on the Loess Plateau, China. Catena 2018, 170, 141–149. [Google Scholar] [CrossRef]
  3. Cordery, I.; Mehrotra, R.; Nazemosadat, M.J. How reliable are standard indicators of stationarity? Stoch. Environ. Res. Risk Assess. 2007, 21, 765–771. [Google Scholar] [CrossRef]
  4. Duan, W.; He, B.; Nover, D.; Fan, J.; Yang, G.; Chen, W. Floods and associated socioeconomic damages in China over the last century. Nat. Hazards 2016, 82, 401–413. [Google Scholar] [CrossRef]
  5. Duan, W.; Hanasaki, N.; Shiogama, H.; Chen, Y.; Zou, S.; Nover, D. Evaluation and future projection of Chinese precipitation extremes using large ensemble highresolution climate simulations. J. Clim. 2019, 32, 2169–2183. [Google Scholar] [CrossRef]
  6. Yang, Z.S.; Milliman, J.D.; Galler, J.; Liu, J.P.; Sun, X.G. Yellow river’s water and sediment discharge decreasing steadily. Eos Trans. Am. Geophys. Union 2013, 79, 589–592. [Google Scholar] [CrossRef]
  7. Yao, W.; Gao, Y.; An, C.; Jiao, P. Analysis of trend of runoff and sediment load in upper and middle reaches of Yellow River at century scale. Adv. Sci. Technol. Water Resour. 2015, 35, 112–120. [Google Scholar]
  8. Ying, O.; Leininger, T.D.; Moran, M. Impacts of reforestation upon sediment load and water outflow in the Lower Yazoo River Watershed, Mississippi. Ecol. Eng. 2013, 61, 394–406. [Google Scholar]
  9. Mcmahon, T.A.; Vogel, R.M.; Peel, M.C. Global streamflows. Part 1: Characteristics of annual streamflows. J. Hydrol. 2007, 347, 243–259. [Google Scholar] [CrossRef]
  10. Milly, P.C.D.; Dunne, K.A.; Vecchia, A.V. Global pattern of trends in streamflow and water availability in a changing climate. Nature 2005, 438, 347–350. [Google Scholar] [CrossRef]
  11. Pachauri, R.K. Climate change 2007: Synthesis report. Contribution of working groups, II and III to the fourth assessment report. Speculum 2007, 77, 586–588. [Google Scholar]
  12. Milliman, J.D.; Farnsworth, K.L.; Jones, P.D. Climatic and anthropogenic factors affecting river discharge to global ocean, 1951–2000. Glob. Planet. Chang. 2008, 62, 187–194. [Google Scholar] [CrossRef]
  13. Li, T.; Wang, S.; Liu, Y.; Fu, B.; Gao, D. Reversal of the sediment load increase in the Amazon basin influenced by divergent trends of sediment transport from the Solimes and Madeira Rivers. Catena 2020, 195, 104804. [Google Scholar] [CrossRef]
  14. Feng, X.; Fu, B.; Piao, S.; Wang, S.; Ciais, P.; Zeng, Z. Revegetation in China’s Loess Plateau is approaching sustainable water resource limits. Nat. Clim. Chang. 2016, 6, 1019–1022. [Google Scholar] [CrossRef]
  15. Xin, Z.; Xu, J.; Zheng, W. Spatiotemporal variations of vegetation cover on the Chinese Loess Plateau (1981–2006): Impacts of climate changes and human activities. Sci. China Ser. D Earth Sci. 2008, 51, 67–78. [Google Scholar] [CrossRef]
  16. Mu, X.M.; Zhang, L.; McVicar, T.R. Analysis of the impact of conservation measures on stream flow regime in catchments of the Loess Plateau, China. Hydrol. Process. 2007, 21, 2124–2134. [Google Scholar] [CrossRef]
  17. Fu, B. Soil erosion and its control in the loess plateau of China. Soil Use Manag. 2010, 5, 76–82. [Google Scholar] [CrossRef]
  18. Fu, G.; Chen, S.; Liu, C.; Shepard, D. Hydro-climatic trends of the Yellow River Basin for the last 50 years. Clim. Chang. 2004, 65, 149–178. [Google Scholar] [CrossRef]
  19. Yu, Y.; Shi, X.; Wang, H.; Yue, C.; Chen, S.; Liu, Y. Effects of dams on water and sediment delivery to the sea by the Huanghe (Yellow River): The special role of water-sediment modulation. Anthropocene 2013, 3, 72–82. [Google Scholar]
  20. Yu, Y.; Wang, H.; Shi, X.; Ran, X.; Cui, T.; Qiao, S. New discharge regime of the Huanghe (Yellow River): Causes and implications. Cont. Shelf Res. 2013, 69, 62–72. [Google Scholar] [CrossRef]
  21. Shi, C.; Zhou, Y.; Fan, X.; Shao, W. A study on the annual runoff change and its relationship with water and soil conservation practices and climate change in the middle Yellow River basin. Catena 2013, 100, 31–41. [Google Scholar] [CrossRef]
  22. Peng, C.; Liu, J.; Dang, Q.; Apps, M.J.; Jiang, H. TRIPLEX: A generic hybrid model for predicting forest growth and carbon and nitrogen dynamics. Ecol. Model. 2002, 153, 109–130. [Google Scholar] [CrossRef]
  23. Yang, L.; Zhao, G.; Tian, P.; Mu, X.; Tian, X.; Feng, J.; Bai, Y. Runoff changes in the major river basins of China and their responses to potential driving forces. J. Hydrol. 2022, 607, 127536. [Google Scholar] [CrossRef]
  24. Wang, L.; Zhou, Y.; Liu, J.; Liu, Y.; Zuo, Q.; Li, Q. Exploring the potential of multispectral satellite images for estimating the contents of cadmium and lead in cropland: The effect of the dimidiate pixel model and random forest. J. Clean. Prod. 2022, 367, 143254. [Google Scholar] [CrossRef]
  25. Zhao, G.J.; Mu, X.M.; Wen, Z.M.; Wang, F.; Gao, P. Soil erosion, conservation, and ecoenvironment changes in the Loess Plateau of China. Land Degrad. Dev. 2013, 24, 499–510. [Google Scholar] [CrossRef]
  26. Zuo, D. Assessing the effects of changes in land use and climate on runoff and sediment yields from a watershed in the Loess Plateau of China. Sci. Total Environ. 2016, 544, 238–250. [Google Scholar] [CrossRef]
  27. Magirl, C.S.; Hilldale, R.C.; Curran, C.A.; Duda, J.J.; Straub, T.D.; Domanski, M. Large-scale dam removal on the Elwha River, Washington, USA: Fluvial sediment load. Geomorphology 2015, 246, 669–686. [Google Scholar] [CrossRef]
  28. Tang, X.; Miao, C.; Yang, X.; Duan, Q.; Lei, X.; Hu, L. Analysis of precipitation characteristics on the loess plateau between 1965 and 2014, based on high-density gauge observations. Atmos. Res. 2018, 213, 264–274. [Google Scholar] [CrossRef]
  29. Wang, H.; Bi, N.; Saito, Y.; Wang, Y.; Sun, X.; Zhang, J. Recent changes in sediment delivery by the Huanghe (Yellow River) to the sea: Causes and environmental implications in its estuary. J. Hydrol. 2010, 391, 302–313. [Google Scholar] [CrossRef]
  30. Li, L.; Zhang, L.; Wang, H.; Wang, J.; Yang, J.W.; Jiang, D.J.; Li, J.-Y.; Qin, D.-Y. Assessing the impact of climate variability and human activities on streamflow from the Wuding river basin in China. Hydrol. Process. 2007, 21, 3485–3491. [Google Scholar] [CrossRef]
  31. Zhang, X.; Zhang, L.; Zhao, J.; Rustomji, P.; Hairsine, P. Responses of streamflow to changes in climate and land use cover in the Loess Plateau, China. Water Resour. Res. 2008, 44, W00A07. [Google Scholar] [CrossRef]
  32. Zhao, A.; Zhang, A.; Liu, J. Assessing the effects of drought and “Grain for Green” Program on vegetation dynamics in China’s Loess Plateau from 2000 to 2014. Catena 2019, 175, 446–455. [Google Scholar] [CrossRef]
  33. Zhao, M.F.; Xiang, W.H.; Peng, C.H.; Tian, D.L. Simulating age-related changes in carbon storage and allocation in a Chinese fir plantation growing in southern China using the 3-PG model. Forest Ecol. Manag. 2009, 257, 1520–1531. [Google Scholar] [CrossRef]
  34. Liu, J.G.; Li, S.X.; Ouyang, Z.Y.; Tam, C.; Chen, X.D. Ecological and socioeconomic effects of China’s policies for ecosystem services. Proc. Natl. Acad. Sci. USA 2008, 105, 9477–9482. [Google Scholar] [CrossRef]
  35. Liu, J.; Gao, G.; Wang, S. The effects of vegetation on runoff and soil loss: Multidimensional structure analysis and scale characteristics. J. Geogr. Sci. 2018, 28, 59–78. [Google Scholar] [CrossRef]
  36. Tian, F.; Liu, L.; Yang, J. Vegetation greening in more than 94% of the Yellow River Basin (YRB) region in China during the 21st century caused jointly by warming and anthropogenic activities. Ecol. Indic. 2021, 125, 107479. [Google Scholar] [CrossRef]
  37. Guo, B.; Wei, C.; Yu, Y. The dominant influencing factors of desertification changes in the source region of Yellow River: Climate change or human activity? Sci. Total Environ. 2022, 813, 152512. [Google Scholar] [CrossRef]
  38. Sun, Z.; Chang, N.; Opp, C. Evaluation of ecological restoration through vegetation patterns in the lower Tarim River, China with MODIS NDVI data. Ecol. Inform. 2011, 6, 156–163. [Google Scholar] [CrossRef]
Figure 1. Study area.
Water 15 02058 g001
Figure 2. Distribution pattern of annual average runoff, vegetation, meteorology, and soil elements in the Yellow River Basin. (a) Average runoff depth in the Yellow River Basin from 1982 to 2012; (b) average precipitation in the Yellow River Basin from 1982 to 2012; (c) average temperature in the Yellow River Basin from 1982 to 2012; (d) average FVC (fraction of vegetation cover) in the Yellow River Basin from 1982 to 2012; (e) average soil volumetric water content in the Yellow River Basin from 1982 to 2012; (f) average soil temperature in the Yellow River Basin from 1982 to 2012. The basins represented by 1–14 are listed in Table 1.
Water 15 02058 g002
Figure 3. Distribution of different level runoff depths in the Yellow River Basin with respect to various related factors. (a) The distribution area of T1T5 level runoff depths in the altitude gradient; (b) the distribution area of T1T5 level runoff depths in the precipitation intensity gradient; (c) the distribution area of T1T5 level runoff depths in the temperature gradient; (d) the distribution area of T1T5 level runoff depths in the vegetation coverage gradient; (e) the distribution area of T1T5 level runoff depths in the soil moisture gradient; (f) the distribution area of T1T5 level runoff depths in the soil temperature gradient; (g) the distribution area of T1T5 level runoff depths in the slope gradient.
Water 15 02058 g003
Figure 4. Interannual variation trend of runoff in the Yellow River Basin and its sub-basins. (a) Yellow River Basin; (b) the upstream of the Yellow River; (c) the midstream of the Yellow River; (d) the downstream of the Yellow River.
Water 15 02058 g004
Figure 5. Change rate of runoff depth in the Yellow River Basin during three periods. (a) Pixel-by- pixel change rate of runoff depth in the Yellow River Basin from 1982 to 1999; (b) Pixel-by-pixel variation rate of runoff depth in the Yellow River Basin from 2000 to 2012; (c) Pixel-by-pixel variation rate of runoff depth in the Yellow River Basin from 1982 to 2012.
Water 15 02058 g005
Figure 6. Variation trend of horizontal runoff depth in the Yellow River Basin.
Water 15 02058 g006
Figure 7. Spatial variation pattern of runoff depth in different periods of the Yellow River Basin. (a) Runoff depth distribution pattern in the Yellow River Basin from 1982 to 1999; (b) distribution pattern of runoff depth in the Yellow River Basin during 2000–2012. (c) distribution pattern of runoff depth in the Yellow River Basin during 1982–2012.
Water 15 02058 g007
Figure 8. Spatial variation of runoff of different grades in the Yellow River Basin. (a) The elevation variation of T1T5 runoff depth in the Yellow River Basin; (b) the gradient change of T1T5 runoff depth in the Yellow River Basin.
Water 15 02058 g008
Table 1. Names of 14 sub-basins in the Yellow River Basin.
RegionsNumbersBasin Name
Upstream 1Datonghe
2Huangshuihe
3Shizuishan-Toudaiguai
4Xiaheyan-Shizuishan
Midstream5Fehe
6Jinghe
7Kuyehe
8Beiluohe
9Qinhe
10Weihe
11Wudinghe
12Yiluohe
Downstream13Wuzhi-Lijin
14Daicunba
Table 2. Annual average profiles of each element in 14 sub-basins of the Yellow River Basin.
No.NameR (mm)RCFVCp (mm)Ta (°C)SM (%)Ts (°C)
1Datonghe18.220.380.66342.776.3222.00 2.11
2Huangshuihe10.840.250.65 371.117.9817.325.71
3Shizuishan-Toudaoguai3.490.230.28253.248.8710.1411.02
4Xiaheyan-Shizuishan0.970.030.28255.339.7210.6912.52
5Fenhe15.580.190.61477.50 13.20 17.1511.20
6Jinghe13.650.170.51478.9911.9518.1711.54
7Kuyehe10.470.070.34386.198.8310.7711.11
8Beiluohe18.240.150.66491.1712.8815.8212.00
9Qinhe20.030.160.72531.8811.9317.7711.93
10Weihe38.540.660.64520.7613.1818.7610.98
11Wudinghe8.990.10 0.35398.419.7211.5711.83
12Yiluohe72.860.260.75652.7413.6720.3114.65
13Wuzhi-Lijin71.960.280.74631.3914.3418.0316.29
14Daicunba140.650.270.69729.8313.3918.1915.84
Note: R, runoff; RC, runoff coefficient; FVC, vegetation coverage; p, precipitation; Ta, air temperature; SM, soil moisture; Ts, soil temperature.
Table 3. Average runoff depth and rate of change in the Yellow River Basin and its sub-basins.
NameAverage (mm)Rate (a−1)
Year1982~19992000~20121982~20121982~19992000~20121982~2012
Yellow River30.8128.5929.87−1.55 **1.47 *−0.3
Datonghe18.7017.5518.22−0.520.98 **−0.08
Huangshuihe11.2310.3010.84−0.33 *0.67 **−0.06
Shizuishan-Toudaoguai4.122.633.490.08−0.05−0.06 *
Xiaheyan-Shizuishan1.180.670.96−0.05 **−0.02−0.03 **
Fenhe18.1012.0815.58−0.370.67−0.31 *
Jinghe15.3111.3513.65−2.14 **1.04−0.53 *
Kuyehe14.095.4610.470.770.03−0.25
Beiluohe20.6814.8518.24−2.89 **0.91−0.77 *
Qinhe17.8223.0920.03−1.12 *−0.45−0.01
Weihe42.1533.5538.54−4.92 **3.44 **−1.11 *
Wudinghe8.789.319.00 −0.36 *0.57 *−0.003
Yiluohe71.1575.1972.85−7.65 **5.25−0.92
Wuzhi-Lijin58.4890.6371.673.04 *2.212.27 **
Daicunba115.07176.08140.654.856.474.30 **
Note: ** p < 0.01; * p < 0.05.
Disclaimer/Publisher’s Note: The statements, opinions and data contained in all publications are solely those of the individual author(s) and contributor(s) and not of MDPI and/or the editor(s). MDPI and/or the editor(s) disclaim responsibility for any injury to people or property resulting from any ideas, methods, instructions or products referred to in the content.

