Abstract
Predicting the second-order rate constants between aromatic contaminants and a sulfate radical () is vital for the screening of pollutants resistant to sulfate radical-based advanced oxidation processes. In this study, a quantitative structure-activity relationship (QSAR) model was developed to predict the values for aromatic contaminants. The relationship between and three molecular descriptors (electron density, steric energy, and ratio between oxygen atoms and carbon atoms) was built through multiple linear regression. The goodness-of-fit, robustness, and predictive ability of the model were characterized statistically with indicators showing that the model was reliable and applicable. Electron density was found to be the most influential descriptor that contributed the most to . All data points fell within the applicability domain, and no outliers existed in the training set. The comparison with other models indicates that the QSAR model performs well in elucidating the mechanism of the reaction between aromatic compounds and sulfate radicals.
1. Introduction
Sulfate radical-based advanced oxidation processes (SR-AOPs) are considered as a promising technology for the treatment of wastewater with recalcitrant organic contaminants [1]. With a high standard reduction potential comparable to that of HO• (E°(/ ) = 2.60 V vs. E°(HO•/OH−) = 2.80 V), the sulfate radical () is highly reactive and capable of mineralizing recalcitrant organic contaminants [2]. Unlike HO•, which reacts unselectively with organic compounds via hydrogen abstraction or addition, prefers to attack organics rich in electron moieties through the single-electron transfer reaction [3]. Therefore, is less affected by the complex water matrix in real wastewaters than HO•. Moreover, has a much longer lifetime than HO•, making its reaction with pollutants more efficient [4]. Peroxydisulfate and peroxymonosulfate have been frequently used as the precursors of , which are more stable and safer for transportation than the commonly used HO• precursor H2O2 [5]. The advantages of make SR-AOPs a potential substitute to HO•-based AOPs.
Aromatic compounds are widely produced and used. Some synthetic aromatic compounds such as pesticides and pharmaceuticals are resistant to conventional wastewater treatment processes and discharged directly into the aquatic environment [6]. They constitute a major group of organic pollutants in the aquatic ecosystem and pose threats to human health due to their potential carcinogenicity [7,8]. SR-AOPs have been extensively studied for the removal of recalcitrant aromatic contaminants [9]. The second-order rate constants of with organic compounds () in aqueous solution range from 105 to 109 M−1 s−1 [10]. Considering that the scavenging of by inorganic anions and natural organic matters in the water matrix will inhibit the degradation of target contaminants [11], only contaminants with higher than those compounds in the water matrix could be removed efficiently in real waters. Currently, the available values are quite limited and obtained mainly through experiments [12]. As there are thousands of aromatic contaminants, experimental measurement of all the values would be laborious, costly, and time consuming. Therefore, it is necessary to develop an alternative method to estimate the values as they are imperative to the assessment of whether a target compound is suitable for SR-AOPs treatment.
Quantitative structure-activity relationship (QSAR) analysis focuses on correlating the molecular descriptors calculated from molecular structures with the activities of the corresponding chemicals (e.g., toxicity and biodegradability) [13,14,15]. QSAR models are mainly used to predict a particular physical or chemical property of a chemical compound and interpret the mechanism behind the prediction [16]. Numerous QSAR models have been developed to predict the rate constants of reactive species such as HO•, O3, singlet oxygen, and hydrated electron with organic contaminants [17,18,19,20]. However, QSAR models for are quite limited. Xiao et al. [21] found that was negatively related to the ratio of oxygen atoms to carbon atoms and the energy gap between the lowest occupied molecule orbital and highest occupied molecule orbital. Unfortunately, their model did not contain a variable positively correlated with the values; thus, it is unable to tell what property of the chemical compound would facilitate its reaction with . Ye et al. [12] developed a model that linked ln with 32 frequencies of structural fragment. However, too many independent variables in the model may cause overfitting problems and reduce the predictive ability of the model [22]. Much more effort could be made to improve the QSAR models for prediction due to a lack of relevant studies currently.
In this study, a QSAR model for predicting the of aromatic compounds was developed and validated by using the multiple linear regression (MLR) method. Two new descriptors (electron density and steric energy) were incorporated into the model to bring new insight into the reaction with aromatic compounds. Following the guidance of The Organization for Economic Cooperation and Development (OECD) for QSAR development [23], statistical characteristics of the developed model were analyzed, the mechanism behind the model was interpreted, and the applicability domain of the model was assessed. Finally, a comparison with previous models was made. The results of this work would help to judge whether an aromatic compound is suitable for SR-AOPs treatment.
2. Materials and Methods
2.1. Dataset
The values (M−1s−1) of 88 aromatic compounds were collected from published literature, and the corresponding references are cited in Table S1. Five descriptors, i.e., electron density, steric energy (kcal/mol), the ratio between the number of oxygen atoms and carbon atoms, volume of the molecule (Å3), and octanol–water partitioning coefficient were calculated to represent the physical properties of selected chemicals. The electron density (E) represents the probability of an electron appearing in a specific space around an atom or molecule. The electron density on each atom of an aromatic compound was calculated by Gaussian 16 Rev. A.03 with HF method at 6-31G level [24]. The highest electron density on the benzene ring was selected as the descriptor E. Steric energy (S) is the sum of energies that resulted from bonded and non-bonded energies within a molecule, which reflects the energy due to the geometry of a molecule [25]. The calculation of S was run on the Chem3D 20.1.1 with the MM2 Dynamics method. The ratio between the number of oxygen atoms and carbon atoms (O/C) of a molecule was found to be negatively correlated with [21]. The molecular volume (V) and octanol–water partition coefficient (logP) of each compound were obtained from Molinspiration Cheminformatics free web services (https://www.molinspiration.com, accessed date: 25 June 2021). The and descriptor values of selected aromatic compounds are listed in Table S1. The 88 aromatic compounds were randomly divided into a training set and validation set with a ratio of 3:1. The data in the training set were used to develop the QSAR model, while the data in the validation set were used to verify the predictive ability of the developed model. MATLAB R2021b was used for the generation of the QSAR model and its validation.
2.2. QSAR Model Development and Characterization
The QSAR model in this study depicts the linear relationship between
and the molecular descriptors, as shown in Equation (1). A stepwise multiple linear regression method was used to determine the significant descriptors in the model. A model with all five descriptors was built first. Then, the p-value of each descriptor was calculated. The descriptors with a p-value lower than the significance level (0.05) were considered as insignificant and then excluded from the model one by one until all the descriptors left were significant.
The degree of multicollinearity among the descriptors was reflected by the variance inflation factor (VIF), which was calculated by Equation (2) [26]. The is the coefficient of determination when conducting multiple linear regression between the ith descriptor and all the other descriptors. A value of 10 was suggested as the threshold of VIF, above which the multicollinearity is considered as severe [27]. The goodness-of-fit of the model was assessed by , adjusted () and the root mean square error (RMSE). and RMSE were calculated by Equations (3) and (4), respectively, where n is the number of compounds in the training set, k is the number of descriptors, yi is the experimental of the ith compound, and is the predicted . Leave-one-out cross-validation was conducted to estimate the robustness of the developed model. For all compounds in the training set, one compound was removed from the training set each time to test the model, and the rest of the compounds were used to train the model [28]. The indicator of leave-one-out cross-validation was calculated by Equation (5), where is the log predicted from model with the ith compound removed from the training set, and is the average experimental log of the training set [28]. measures the robustness of the developed model [29].
2.3. Validation of the Model
The validation set was used to test the predictive ability of the model developed from the training set. The indicator was defined as Equation (6), where is the experimental of the jth compound in the validation set, is the predicted of the jth compound in the validation set, and is the average of all compounds in the training set. A higher value means a better prediction by the model, and 0.5 was suggested as the threshold [30,31]. The external RMSE was calculated by Equation (7), which gauges the deviation of predicted values from the experimental ones.
Moreover, the conditions below should be met so that the predictive ability of the model could be considered satisfactory [30]:
where is the correlation coefficient between the predicted and experimental values; is the coefficient of determination when the experimental is regressed against the predicted with the fitting curve through the origin and k is the corresponding slope; is the coefficient of determination when the predicted is regressed against the experimental with the fitting curve through the origin, and is the corresponding slope.
A y-randomization test was used to verify the robustness of the developed model by measuring the degree of chance correlation between and the descriptors [32]: the randomly shuffled values in the training dataset were regressed against the fixed descriptors for several times to generate new MLR models, of which the R2 shall be poor. The y-randomization test was conducted with Scikit-learn 1.0.2 [33] and the code was used to calculate the R2 for each shuffle was listed in Text S1.
2.4. Relative Contribution of Each Descriptor
The relative contribution of each descriptor to the predicted was estimated with Equation (11), where Ei, Si, and (O/C)i are the descriptors of the ith compound, and Di is one of the three descriptors in the model. The analysis of relative contribution would help to elaborate on the role of each descriptor in the model.
2.5. Applicability Domain
The applicability domain (AD) is used to define a region of chemicals with specific structures where the model could make an accurate prediction [29]. The visualization of AD was fulfilled by the Williams plot, of which the X-axis refers to hat values (leverages), and the Y-axis refers to standardized residuals (δ) [34]. The hat value was calculated with Equation (12), where hi is the hat value of the ith compound, X is the n × k descriptor matrix containing all compounds in the training set, and xi is the 1 × k descriptor vector of the ith compound (n is the number of compounds in the training set and k is the number of descriptors) [35]. The critical hat value (h*) was calculated with Equation (13) [36]. When hi < h* and δ < 3, the predicted of the ith compound is considered reliable [21]. The standardized residual of the ith compound was calculated with Equation (14) [37].
3. Results
3.1. Selection of Significant Descriptors
Backward stepwise regression was performed on the training set (n = 66) to select significant descriptors for the model. As shown in Table 1, when all five descriptors were included in the model, three descriptors (O/C, logV, and logP) were found to be insignificant, as their p-values were above the significance level of 0.05.

Table 1.
Selection of significant descriptors for the QSAR model by backward stepwise regression (n = 66).
After excluding logP from the model, O/C became significant while logV was still insignificant. The decrease in and and the increase in RMSE were results from reducing the overfitting by taking out logP. Finally, the logV was removed from the model, and the descriptors left were all significant. Meanwhile, was increased and RMSE was decreased, indicating that the overfitting was reduced with an unnecessary descriptor removed. The formula of the model is shown below:
3.2. Exclusion of Outliers
The analysis of residuals of the training set could help to identify outliers that affected the goodness-of-fit of the model. As shown in Figure 1, the compounds whose residual confidence intervals did not include zero point were classified as outliers and colored in red. After removing the identified outliers, the MLR would be repeatedly conducted to find new outliers until all the residual confidence intervals included the zero point.
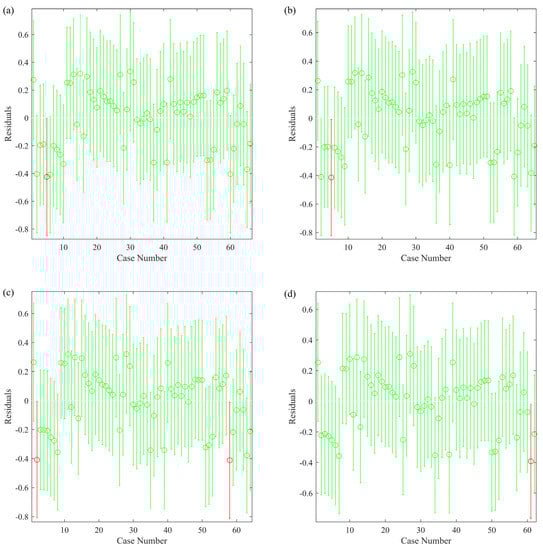
Figure 1.
Identification of outliers in the training set by residual analysis: (a) first round; (b) second round; (c) third round; (d) fourth round. Red circles represent the outliers identified in each round.
After four rounds of MLR, five compounds in the training set were removed to improve the goodness-of-fit of the model. The final formula of the developed model is shown in Equation (16). By removing five outliers, was increased from 0.672 to 0.748, and RMSE was decreased from 0.220 to 0.193, indicating that the goodness-of-fit was significantly improved.
3.3. Statistical Characteristics of the Developed Model
The statistical indicators of the model before and after excluding the five outliers are listed in Table 2. After excluding the outliers from the training set, the goodness-of-fit and robustness of the model were both improved. Even though and RMSEext were slightly decreased, was increased. Therefore, the predictive ability of the model remained stable after the exclusion of outliers.
Table 2.
Statistical characterization of the model before and after excluding the outliers.
The conditions listed in inequalities 8–10 were all met, showing a satisfactory predictive ability of the model. The VIF of E, S, and O/C were 1.48, 1.11, and 1.32, respectively. Therefore, the multicollinearity among the variables was negligible, as the VIF values were well below the threshold of 10 and close to 1. As shown in Figure 2, the values of descriptors were far away from the flat surfaces, which represent the fitting results of E, S, and O/C by MLR when the other two descriptors acted as independent variables. It confirms that there is little multicollinearity among E, S, and O/C, suggesting the model has high stability [38].
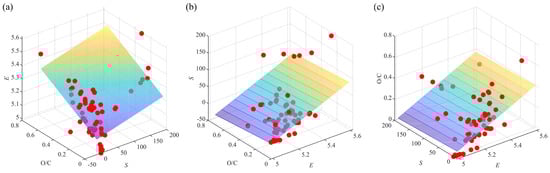
Figure 2.
Multicollinearity analysis among descriptors: (a) E; (b) S; (c) O/C.
The predicted versus the experimental is shown in Figure 3. The prediction made by the QSAR model agreed quite well with the experimental results, showing a high predictive ability of the developed model. The result of the y-randomization test is shown in Figure S1. The poor R2 values (<0.16) for the MLR models developed from shuffled against E, S, and O/C indicate that there is no chance correlation. Therefore, the MLR model developed (Equation (16)) can be trusted to predict values from new descriptors.
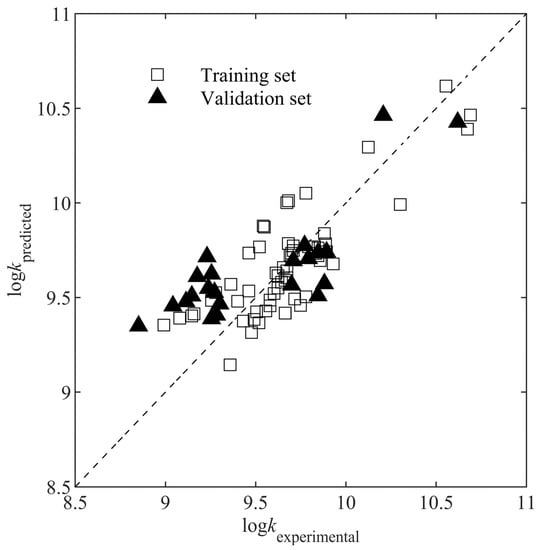
Figure 3.
Predicted versus experimental .
4. Discussion
4.1. Interpretation of the Model
The coefficient of E is 1.7751, as shown in Equation (16), which is much larger than the other two coefficients, indicating that the change of per unit E is the highest. Therefore, E is the most influential factor in the model. As shown in Figure 4, E also contributed the most to . reacts with aromatic compounds mainly through single electron transfer (SET) from the benzene ring to the radical. As the occurrence of the SET process requires the electron extraction from the nucleophile [39], the electron density of the benzene ring may play an essential role in the electron transfer rate between and aromatic compounds. It was assumed in this study that the highest electron density on the carbon atom of the benzene ring was positively correlated with ; i.e., a higher electron density would lead to a faster reaction rate, which is consistent with the result of the model, as the coefficient of E is positive.
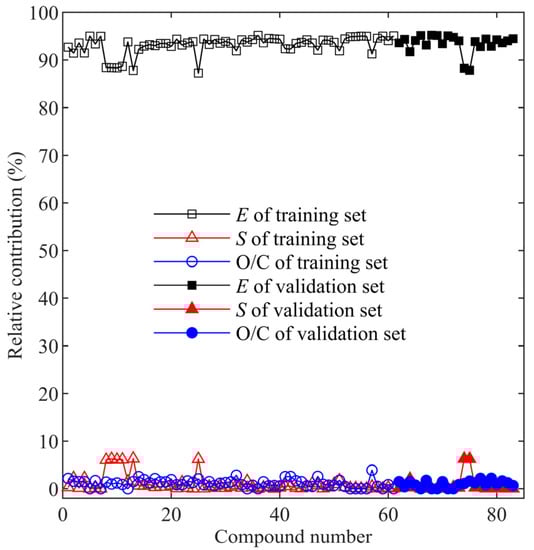
Figure 4.
The relative contribution of three descriptors to .
As shown in Figure 5a, R2 of vs. E is 0.455, suggesting a moderate correlation between the rate constant and electron density. However, Luo et al. [40] observed no clear relationship between the Gibbs free energy of SET (, which represents the reactivity of toward aromatic contaminants) and the total electrostatic potential charge on the benzene ring (ESP, which represents the electron density on the benzene ring). The disparity might be due to the different ways in calculating electron density. In this study, the highest rather than the total electron density on the carbon atom in the benzene ring was used as it was assumed that might preferentially attack the carbon atom in the benzene ring with the highest electron density.
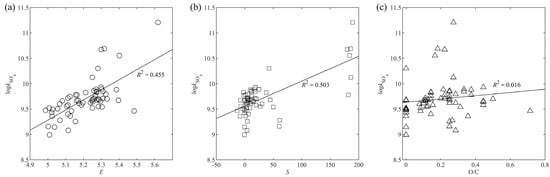
Figure 5.
Correlation between and each descriptor: (a) E; (b) S; (c) O/C.
The coefficient of S is 0.0036, of which the absolute value is the least among the three coefficients. Therefore, S is the least influential factor in the model. As shown in Figure 4, the relative contribution of S was comparable to that of O/C for most of the aromatic compounds selected, except for those with the benzenesulfonamide moiety, which shows a much higher contribution of S than that of O/C. The steric energy is a sum of energies from bond stretching, bending, torsion, Van der Waals, and electrostatic interactions within a molecule [41]. The lowest energy conformation of a molecule is most favored, and it is achieved when the steric energy is minimized [25]. As the reactivity of a molecule is affected by its geometry, there should be a certain kind of relationship between the steric energy and the reactivity of a molecule. The positive correlation between S and indicates that higher steric energy tends to make the aromatic molecule more reactive to . As shown in Figure 5b, R2 of the linear regression between S and is 0.503, which is even higher than that between E and . However, the data points in Figure 5b were closely gathered, while in Figure 5a, the data points were scattered around the regression line. Therefore, a higher R2 of vs. S does not mean a higher correlation between and S.
The negative coefficient of O/C (–0.5836) indicates that the increase in oxygen content would inhibit the reactivity of aromatic compounds toward . Oxygen atoms, especially those attached directly to the benzene ring, have a strong ability to withdraw electrons from the benzene ring. As a result, the electron density on the benzene ring is reduced, and the electron transfer process is hindered. Xiao et al. [21] also reported that was negatively correlated with O/C, and the correlation was quite strong as R2 of O/C was 0.621. They suggested that an increase in O/C would decrease the number of H atoms, thus weakening the H abstraction by , which would slow down the reaction. However, no clear linear relationship was observed between and O/C in this study (Figure 5c). There were only six compounds containing no oxygen atom in the training set (65 compounds in total) of Xiao et al. [21], while there were 11 in the training set of this study (61 compounds in total). The difference in training set composition might lead to the disparity in the importance of O/C to the models.
4.2. Applicability Domain
The standardized residual depicts the difference between the experimental and predicted results. As shown in Figure 6, all the δ values were within ±3, indicating no outlier existed. The hi value represents how far the xi value of the ith compound deviates from the average X value of all the compounds [42]. There was only one compound (gallate ion) in the training set with an hi larger than h*, which could be called a “good high leverage point”, as it made the model more stable and accurate [42]. It was suggested that such a compound would have excessive influence during the model development process [34]. The developed model exhibits good extrapolating ability, as all data points from the validation set were within the AD, suggesting that the of chemicals with structures similar to those in the training set may be reliably predicted.
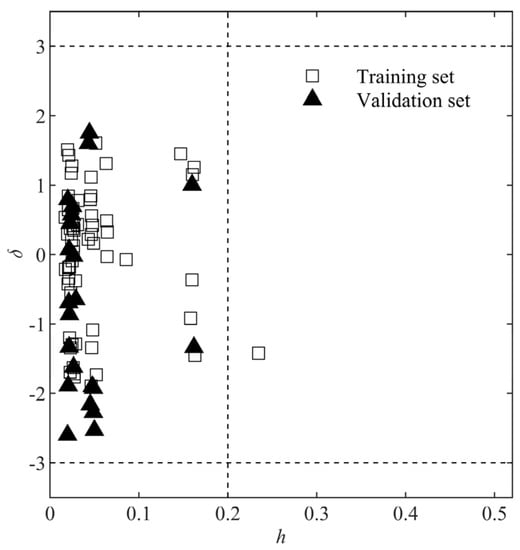
Figure 6.
Williams plot for the QSAR model. The vertical dashed line is the boundary where h equals h*. The horizontal dashed lines are the boundaries where δ = ±3.
4.3. Comparison with Other Models
Studies regarding the QSAR model for prediction are quite limited, and only two relevant literatures could be found. The comparison between previous models and the one developed in this study is listed in Table 3.
Table 3.
A comparison of QSAR models for prediction.
Xiao et al. [21] developed the first QSAR model for prediction using the MLR method. Their model has a better goodness-of-fit, robustness, and predictive ability than the one in this study. However, the ratio of oxygen atoms to carbon atoms was the dominant descriptor in their model, which would limit the prediction of for compounds without oxygen atoms. Moreover, both descriptors in the model have negative coefficients, which means that the model could only reveal the factors that reduce the reactivity of compounds toward . In this study, the model consists of two descriptors with positive coefficients and one descriptor with a negative coefficient. Therefore, both enhancing and inhibitory factors to the reaction between aromatic compounds and are explained by the model. Ye et al. [12] developed two models with 32 molecular fragment descriptors by using MLR and artificial neural network (ANN), respectively. They found that the ANN model showed much better goodness-of-fit but much lower predictive ability than MLR. Considering that the number of descriptors was close to the number of compounds in the training set, overfitting would weaken the predictive ability of the model developed by Ye et al. [12], which was also reflected by the low (0.62 for MLR and 0.42 for ANN). In addition, the descriptors in their model stand for the frequencies of structural fragments, which possess no physical meaning. Therefore, the mechanism behind the model was difficult to explain. In contrast, our model has successfully reduced the overfitting problem by excluding insignificant descriptors, and the physical properties of each descriptor help to elucidate the mechanism behind the reaction between aromatic compounds and .
5. Conclusions
In this study, a QSAR model was developed and validated to predict the second-order rate constants between aromatic compounds and . The stepwise MLR was used to exclude insignificant descriptors, and the final model was composed of E (electron density), S (steric energy), and O/C (number of oxygen atoms vs. carbon atoms). Residual analysis was applied to remove outliers from the training set, and the goodness-of-fit of the model was improved. The statistical indicators for goodness-of-fit (= 0.735), robustness ( = 0.694), and predictive ability ( = 0.603 and = 0.648) suggest that the model is satisfactory and applicable. E was the most influential descriptor and contributed most to the . The positive coefficient of E suggests that higher electron density on the benzene ring could enhance its reactivity to , which is consistent with the assumption that the reaction between and aromatic compounds was achieved mainly through single electron transfer from the benzene ring to the radical. S is positively correlated with , suggesting that higher steric energy could improve the reactivity of aromatic compounds via affecting its geometry. An increase in O/C would decrease as oxygen is electron withdrawing, so that the electron density on the benzene ring could be depleted. All data points in the validation set fell into the applicability domain, suggesting that the model is suitable for aromatic compounds with various functional groups. The comparison with other models shows that the QSAR model developed performed better in mechanism elucidation and overfitting reduction.
Supplementary Materials
The following supporting information can be downloaded at: https://www.mdpi.com/article/10.3390/w14050766/s1, Table S1: Values of molecular descriptors and for selected aromatic compounds [43,44,45,46,47,48,49,50,51,52,53,54,55,56,57,58,59,60,61,62,63,64,65,66,67,68,69,70,71,72,73,74,75]; Text S1. Python code for the y-randomization test; Figure S1. The R2 of shuffled regressed against fixed E, S and O/C.
Author Contributions
Conceptualization, H.D., J.H.; methodology, H.D., J.H.; investigation, H.D.; writing—original draft preparation, H.D.; writing—review and editing, J.H.; visualization, H.D.; supervision, J.H.; project administration, J.H.; funding acquisition, J.H. All authors have read and agreed to the published version of the manuscript.
Funding
This research received no external funding.
Institutional Review Board Statement
Not applicable.
Informed Consent Statement
Not applicable.
Data Availability Statement
The data presented in this study is available on request from the corresponding author.
Acknowledgments
This research was supported by the President’s Graduate Fellowship (GRSUP0000003 President Grad Fel-PVO(SP)-IS) awarded by the National University of Singapore.
Conflicts of Interest
The authors declare no conflict of interest.
References
- Xiao, R.; Luo, Z.; Wei, Z.; Luo, S.; Spinney, R.; Yang, W.; Dionysiou, D.D. Activation of peroxymonosulfate/persulfate by nanomaterials for sulfate radical-based advanced oxidation technologies. Curr. Opin. Chem. Eng. 2018, 19, 51–58. [Google Scholar] [CrossRef]
- Oh, W.-D.; Dong, Z.; Lim, T.-T. Generation of sulfate radical through heterogeneous catalysis for organic contaminants removal: Current development, challenges and prospects. Appl. Catal. B-Environ. 2016, 194, 169–201. [Google Scholar] [CrossRef]
- Zhou, D.; Zhang, H.; Chen, L. Sulfur-replaced Fenton systems: Can sulfate radical substitute hydroxyl radical for advanced oxidation technologies? J. Chem. Technol. Biotechnol. 2015, 90, 775–779. [Google Scholar] [CrossRef]
- Oh, W.-D.; Lua, S.-K.; Dong, Z.; Lim, T.-T. Performance of magnetic activated carbon composite as peroxymonosulfate activator and regenerable adsorbent via sulfate radical-mediated oxidation processes. J. Hazard. Mater. 2015, 284, 1–9. [Google Scholar] [CrossRef]
- Wacławek, S.; Lutze, H.V.; Grübel, K.; Padil, V.V.T.; Černík, M.; Dionysiou, D.D. Chemistry of persulfates in water and wastewater treatment: A review. Chem. Eng. J. 2017, 330, 44–62. [Google Scholar] [CrossRef]
- Su, H.; Yu, C.; Zhou, Y.; Gong, L.; Li, Q.; Alvarez, P.J.J.; Long, M. Quantitative structure-activity relationship for the oxidation of aromatic organic contaminants in water by TAML/H2O2. Water Res. 2018, 140, 354–363. [Google Scholar] [CrossRef]
- Seo, J.-S.; Keum, Y.-S.; Li, Q.X. Bacterial degradation of aromatic compounds. Int. J. Env. Res. Public Health 2009, 6, 278–309. [Google Scholar] [CrossRef]
- Fuchs, G.; Boll, M.; Heider, J. Microbial degradation of aromatic compounds—From one strategy to four. Nat. Rev. Microbiol. 2011, 9, 803–816. [Google Scholar] [CrossRef]
- Pari, S.; Wang, I.A.; Liu, H.; Wong, B.M. Sulfate radical oxidation of aromatic contaminants: A detailed assessment of density functional theory and high-level quantum chemical methods. Environ. Sci.-Process Impacts 2017, 19, 395–404. [Google Scholar] [CrossRef] [Green Version]
- Neta, P.; Huie, R.E.; Ross, A.B. Rate Constants for Reactions of Inorganic Radicals in Aqueous Solution. J. Phys. Chem. Ref. Data 1988, 17, 1027–1284. [Google Scholar] [CrossRef]
- Ding, H.; Hu, J. Degradation of ibuprofen by UVA-LED/TiO2/persulfate process: Kinetics, mechanism, water matrix effects, intermediates and energy consumption. Chem. Eng. J. 2020, 397, 125462. [Google Scholar] [CrossRef]
- Ye, T.; Wei, Z.; Spinney, R.; Tang, C.-J.; Luo, S.; Xiao, R.; Dionysiou, D.D. Chemical structure-based predictive model for the oxidation of trace organic contaminants by sulfate radical. Water Res. 2017, 116, 106–115. [Google Scholar] [CrossRef] [PubMed]
- Dudek, A.Z.; Arodz, T.; Galvez, J. Computational Methods in Developing Quantitative Structure-Activity Relationships (QSAR): A Review. Comb. Chem. High Throughput Screen 2006, 9, 213–228. [Google Scholar] [CrossRef]
- Liu, W.; Wang, X.; Zhou, X.; Duan, H.; Zhao, P.; Liu, W. Quantitative structure-activity relationship between the toxicity of amine surfactant and its molecular structure. Sci. Total Environ. 2020, 702, 134593. [Google Scholar] [CrossRef] [PubMed]
- Nolte, T.M.; Chen, G.; van Schayk, C.S.; Pinto-Gil, K.; Hendriks, A.J.; Peijnenburg, W.J.G.M.; Ragas, A.M.J. Disentanglement of the chemical, physical, and biological processes aids the development of quantitative structure-biodegradation relationships for aerobic wastewater treatment. Sci. Total Environ. 2020, 708, 133863. [Google Scholar] [CrossRef]
- Selassie, C.; Verma, R.P. History of quantitative structure-activity relationships. Burg. Med. Chem. Drug Discov. 2003, 1, 1–96. [Google Scholar]
- Li, C.; Zheng, S.; Li, T.; Chen, J.; Zhou, J.; Su, L.; Zhang, Y.-N.; Crittenden, J.C.; Zhu, S.; Zhao, Y. Quantitative structure-activity relationship models for predicting reaction rate constants of organic contaminants with hydrated electrons and their mechanistic pathways. Water Res. 2019, 151, 468–477. [Google Scholar] [CrossRef]
- Huang, Y.; Li, T.; Zheng, S.; Fan, L.; Su, L.; Zhao, Y.; Xie, H.-B.; Li, C. QSAR modeling for the ozonation of diverse organic compounds in water. Sci. Total Environ. 2020, 715, 136816. [Google Scholar] [CrossRef]
- Li, T.; Huang, Y.; Wei, G.; Zhang, Y.-N.; Zhao, Y.; Crittenden, J.C.; Li, C. Quantitative structure-activity relationship models for predicting singlet oxygen reaction rate constants of dissociating organic compounds. Sci. Total Environ. 2020, 735, 139498. [Google Scholar] [CrossRef]
- Borhani, T.N.G.; Saniedanesh, M.; Bagheri, M.; Lim, J.S. QSPR prediction of the hydroxyl radical rate constant of water contaminants. Water Res. 2016, 98, 344–353. [Google Scholar] [CrossRef] [PubMed]
- Xiao, R.; Ye, T.; Wei, Z.; Luo, S.; Yang, Z.; Spinney, R. Quantitative Structure-Activity Relationship (QSAR) for the Oxidation of Trace Organic Contaminants by Sulfate Radical. Environ. Sci. Technol. 2015, 49, 13394–13402. [Google Scholar] [CrossRef] [PubMed]
- Hawkins, D.M. The Problem of Overfitting. J. Chem. Inf. Comput. Sci. 2004, 44, 1–12. [Google Scholar] [CrossRef] [PubMed]
- OECD. Guidance Document on the Validation of (Quantitative) Structure-Activity Relationship [(Q) SAR] Models; Organisation for Economic Co-Operation and Development: Paris, France, 2007. [Google Scholar]
- Frisch, M.J.; Trucks, G.W.; Schlegel, H.B.; Scuseria, G.E.; Robb, M.A.; Cheeseman, J.R.; Scalmani, G.; Barone, V.; Petersson, G.A.; Nakatsuji, H.; et al. Gaussian 16 Rev. A.03; Gausian: Wallingford, CT, USA, 2016. [Google Scholar]
- DeTar, D.F. Calculation of formal steric enthalpy with MM2. J. Org. Chem. 1992, 57, 902–910. [Google Scholar] [CrossRef]
- Craney, T.A.; Surles, J.G. Model-Dependent Variance Inflation Factor Cutoff Values. Qual. Eng. 2002, 14, 391–403. [Google Scholar] [CrossRef]
- Stine, R.A. Graphical Interpretation of Variance Inflation Factors. Am. Stat. 1995, 49, 53–56. [Google Scholar]
- Sudhakaran, S.; Calvin, J.; Amy, G.L. QSAR models for the removal of organic micropollutants in four different river water matrices. Chemosphere 2012, 87, 144–150. [Google Scholar] [CrossRef]
- Gramatica, P. Principles of QSAR models validation: Internal and external. QSAR Comb. Sci. 2007, 26, 694–701. [Google Scholar] [CrossRef]
- Tropsha, A.; Gramatica, P.; Gombar, V.K. The Importance of Being Earnest: Validation is the Absolute Essential for Successful Application and Interpretation of QSPR Models. QSAR Comb. Sci. 2003, 22, 69–77. [Google Scholar] [CrossRef]
- Golbraikh, A.; Tropsha, A. Beware of q2! J. Mol. Graph. Model. 2002, 20, 269–276. [Google Scholar] [CrossRef]
- Kaneko, H. Estimation of predictive performance for test data in applicability domains using y-randomization. J. Chemom. 2019, 33, e3171. [Google Scholar] [CrossRef]
- Pedregosa, F.; Varoquaux, G.; Gramfort, A.; Michel, V.; Thirion, B.; Grisel, O.; Blondel, M.; Prettenhofer, P.; Weiss, R.; Dubourg, V. Scikit-learn: Machine learning in Python. J. Mach. Learn. Res. 2011, 12, 2825–2830. [Google Scholar]
- Netzeva, T.I.; Worth, A.P.; Aldenberg, T.; Benigni, R.; Cronin, M.T.D.; Gramatica, P.; Jaworska, J.S.; Kahn, S.; Klopman, G.; Marchant, C.A.; et al. Current Status of Methods for Defining the Applicability Domain of (Quantitative) Structure-Activity Relationships: The Report and Recommendations of ECVAM Workshop 521,2. ATLA-Altern. Lab. Anim. 2005, 33, 155–173. [Google Scholar] [CrossRef] [PubMed]
- Atkinson, A.C. Plots, Transformations and Regression: An Introduction to Graphical Methods of Diagnostic Regression Analysis. 1985. Available online: https://books.google.rs/books/about/Plots_Transformations_and_Regression.html?id=L1SqAAAAIAAJ&redir_esc=y (accessed on 25 June 2021).
- Liu, Y.; Cheng, Z.; Liu, S.; Tan, Y.; Yuan, T.; Yu, X.; Shen, Z. Quantitative structure activity relationship (QSAR) modelling of the degradability rate constant of volatile organic compounds (VOCs) by OH radicals in atmosphere. Sci. Total Environ. 2020, 729, 138871. [Google Scholar] [CrossRef]
- Montgomery, D.; Runger, G. Applied Statistics and Probability for Engineers; John Wily and Sons, Inc.: Hoboken, NJ, USA, 2018. [Google Scholar]
- Ding, H.; Chen, C.; Zhang, X. Linear solvation energy relationship for the adsorption of synthetic organic compounds on single-walled carbon nanotubes in water. SAR QSAR Environ. Res. 2016, 27, 31–45. [Google Scholar] [CrossRef]
- Ashby, E.C. Single-electron transfer, a major reaction pathway in organic chemistry. An answer to recent criticisms. Acc. Chem. Res. 1988, 21, 414–421. [Google Scholar] [CrossRef]
- Luo, S.; Wei, Z.; Dionysiou, D.D.; Spinney, R.; Hu, W.-P.; Chai, L.; Yang, Z.; Ye, T.; Xiao, R. Mechanistic insight into reactivity of sulfate radical with aromatic contaminants through single-electron transfer pathway. Chem. Eng. J. 2017, 327, 1056–1065. [Google Scholar] [CrossRef]
- Siafarika, P.; Kouderis, C.; Kalampounias, A.G. Non-Debye segmental relaxation of poly-N-vinyl-carbazole in dilute solution. Mol. Phys. 2021, 119, e1802075. [Google Scholar] [CrossRef]
- Jaworska, J.; Nikolova-Jeliazkova, N.; Aldenberg, T. QSAR Applicability Domain Estimation by Projection of the Training Set in Descriptor Space: A Review. ATLA-Altern. Lab. Anim. 2005, 33, 445–459. [Google Scholar] [CrossRef]
- O’Neill, P.; Steenken, S.; Schulte-Frohlinde, D. Formation of radical cations of methoxylated benzenes by reaction with hydroxyl radicals, thallium(2+), silver(2+), and peroxysulfate (SO4.−) in aqueous solution. Optical and conductometric pulse radiolysis and in situ radiolysis electron spin resonance study. J. Phys. Chem. 1975, 79, 2773–2779. [Google Scholar]
- Steenken, S.; O’Neill, P.; Schulte-Frohlinde, D. Formation of radical zwitterions from methoxylated benzoic acids. 1. One electron oxidation by thallium(2+), silver(2+), and sulfate(1−) ions. J. Phys. Chem. 1977, 81, 26–30. [Google Scholar] [CrossRef]
- Choure, S.C.; Bamatraf, M.M.M.; Rao, B.S.M.; Das, R.; Mohan, H.; Mittal, J.P. Hydroxylation of Chlorotoluenes and Cresols: A Pulse Radiolysis, Laser Flash Photolysis, and Product Analysis Study. J. Phys. Chem. A 1997, 101, 9837–9845. [Google Scholar] [CrossRef]
- Zhang, T.; Chen, Y.; Leiknes, T. Oxidation of Refractory Benzothiazoles with PMS/CuFe2O4: Kinetics and Transformation Intermediates. Environ. Sci. Technol. 2016, 50, 5864–5873. [Google Scholar] [CrossRef] [Green Version]
- Canle López, M.; Fernández, M.I.; Rodríguez, S.; Santaballa, J.A.; Steenken, S.; Vulliet, E. Mechanisms of Direct and TiO2-Photocatalysed UV Degradation of Phenylurea Herbicides. Chemphyschem 2005, 6, 2064–2074. [Google Scholar] [CrossRef]
- Kilic, M.Y.; Abdelraheem, W.H.; He, X.; Kestioglu, K.; Dionysiou, D.D. Photochemical treatment of tyrosol, a model phenolic compound present in olive mill wastewater, by hydroxyl and sulfate radical-based advanced oxidation processes (AOPs). J. Hazard. Mater. 2019, 367, 734–742. [Google Scholar] [CrossRef] [PubMed]
- Neta, P.; Madhavan, V.; Zemel, H.; Fessenden, R.W. Rate constants and mechanism of reaction of sulfate radical anion with aromatic compounds. J. Am. Chem. Soc. 1977, 99, 163–164. [Google Scholar] [CrossRef]
- Kwon, M.; Kim, S.; Yoon, Y.; Jung, Y.; Hwang, T.-M.; Lee, J.; Kang, J.-W. Comparative evaluation of ibuprofen removal by UV/H2O2 and UV/S2O82− processes for wastewater treatment. Chem. Eng. J. 2015, 269, 379–390. [Google Scholar] [CrossRef]
- Li, A.; Wu, Z.; Wang, T.; Hou, S.; Huang, B.; Kong, X.; Li, X.; Guan, Y.; Qiu, R.; Fang, J. Kinetics and mechanisms of the degradation of PPCPs by zero-valent iron (Fe°) activated peroxydisulfate (PDS) system in groundwater. J. Hazard. Mater. 2018, 357, 207–216. [Google Scholar] [CrossRef]
- Real, F.J.; Acero, J.L.; Benitez, J.F.; Roldan, G.; Casas, F. Oxidation of the emerging contaminants amitriptyline hydrochloride, methyl salicylate and 2-phenoxyethanol by persulfate activated by UV irradiation. J. Chem. Technol. Biotechnol. 2016, 91, 1004–1011. [Google Scholar] [CrossRef]
- Rickman, K.A.; Mezyk, S.P. Kinetics and mechanisms of sulfate radical oxidation of β-lactam antibiotics in water. Chemosphere 2010, 81, 359–365. [Google Scholar] [CrossRef]
- Toth, J.E.; Rickman, K.A.; Venter, A.R.; Kiddle, J.J.; Mezyk, S.P. Reaction Kinetics and Efficiencies for the Hydroxyl and Sulfate Radical Based Oxidation of Artificial Sweeteners in Water. J. Phys. Chem. A 2012, 116, 9819–9824. [Google Scholar] [CrossRef]
- Sharma, S.B.; Mudaliar, M.; Rao, B.S.M.; Mohan, H.; Mittal, J.P. Radiation Chemical Oxidation of Benzaldehyde, Acetophenone, and Benzophenone. J. Phys. Chem. A 1997, 101, 8402–8408. [Google Scholar] [CrossRef]
- Mahdi Ahmed, M.; Barbati, S.; Doumenq, P.; Chiron, S. Sulfate radical anion oxidation of diclofenac and sulfamethoxazole for water decontamination. Chem. Eng. J. 2012, 197, 440–447. [Google Scholar] [CrossRef]
- Mohan, H.; Mittal, J.P. Direct evidence for H+-catalysed dehydration of fluorohydroxycyclohexadienyl radical: A pulse radiolysis study. J. Chem. Soc.-Faraday Trans. 1995, 91, 2121–2126. [Google Scholar] [CrossRef]
- Caregnato, P.; David Gara, P.M.; Bosio, G.N.; Gonzalez, M.C.; Russo, N.; Michelini, M.d.C.; Mártire, D.O. Theoretical and Experimental Investigation on the Oxidation of Gallic Acid by Sulfate Radical Anions. J. Phys. Chem. A 2008, 112, 1188–1194. [Google Scholar] [CrossRef]
- Li, H.; Liu, Y.; Tang, R.; Zhang, P.; Fu, H.; Yao, S.; Wang, W. Pulse radiolysis study on gatifloxacin—A fluoroquinolone antibiotic. Sci. China-Chem. 2012, 55, 1358–1363. [Google Scholar] [CrossRef]
- Paul, J.; Jensen, S.; Dukart, A.; Cornelissen, G. Optimization of a preparative multimodal ion exchange step for purification of a potential malaria vaccine. J. Chromatogr. A 2014, 1366, 38–44. [Google Scholar] [CrossRef]
- Lanzafame, G.M.; Sarakha, M.; Fabbri, D.; Vione, D. Degradation of Methyl 2-Aminobenzoate (Methyl Anthranilate) by H2O2/UV: Effect of Inorganic Anions and Derived Radicals. Molecules 2017, 22, 619. [Google Scholar] [CrossRef] [Green Version]
- Lian, L.; Yao, B.; Hou, S.; Fang, J.; Yan, S.; Song, W. Kinetic Study of Hydroxyl and Sulfate Radical-Mediated Oxidation of Pharmaceuticals in Wastewater Effluents. Environ. Sci. Technol. 2017, 51, 2954–2962. [Google Scholar] [CrossRef]
- Geeta, S.; Sharma, S.B.; Rao, B.S.M.; Mohan, H.; Dhanya, S.; Mittal, J.P. Study of kinetics and absorption spectra of OH adducts of hydroxy derivatives of benzaldehyde and acetophenone. J. Photochem. Photobiol. A Chem. 2001, 140, 99–107. [Google Scholar] [CrossRef]
- Acero, J.L.; Benítez, F.J.; Real, F.J.; Rodríguez, E. Degradation of selected emerging contaminants by UV-activated persulfate: Kinetics and influence of matrix constituents. Sep. Purif. Technol. 2018, 201, 41–50. [Google Scholar] [CrossRef]
- Roder, M.; Földiák, G.; Wojnárovits, L. Electron transfer from cresols to N3, BrO2, ClO2, NO2 and SO−4 radicals: Correlation between rate constants and one-electron reduction potentials. Radiat. Phys. Chem. 1999, 55, 515–519. [Google Scholar] [CrossRef]
- Tao, Y.; Monfort, O.; Brigante, M.; Zhang, H.; Mailhot, G. Phenanthrene decomposition in soil washing effluents using UVB activation of hydrogen peroxide and peroxydisulfate. Chemosphere 2021, 263, 127996. [Google Scholar] [CrossRef] [PubMed]
- Herrmann, H.; Exner, M.; Jacobi, H.W.; Raabe, G.; Reese, A.; Zellner, R. Laboratory studies of atmospheric aqueous-phase free-radical chemistry: Kinetic and spectroscopic studies of reactions of NO3 and SO4− radicals with aromatic compounds. Faraday Discuss. 1995, 100, 129–153. [Google Scholar] [CrossRef]
- Sabharwal, S.; Kishore, K.; Moorthy, P.N. Pulse radiolysis study of oxidation reactions of sulphacetamide in aqueous solutions. Radiat. Phys. Chem. 1994, 44, 499–506. [Google Scholar] [CrossRef]
- Zhang, R.; Yang, Y.; Huang, C.-H.; Zhao, L.; Sun, P. Kinetics and modeling of sulfonamide antibiotic degradation in wastewater and human urine by UV/H2O2 and UV/PDS. Water Res. 2016, 103, 283–292. [Google Scholar] [CrossRef]
- Zhou, L.; Ferronato, C.; Chovelon, J.-M.; Sleiman, M.; Richard, C. Investigations of diatrizoate degradation by photo-activated persulfate. Chem. Eng. J. 2017, 311, 28–36. [Google Scholar] [CrossRef]
- Merga, G.; Aravindakumar, C.T.; Rao, B.S.M.; Mohan, H.; Mittal, J.P. Pulse radiolysis study of the reactions of SO with some substituted benzenes in aqueous solution. J. Chem. Soc.-Faraday Trans. 1994, 90, 597–604. [Google Scholar] [CrossRef]
- Zhang, R.; Sun, P.; Boyer, T.H.; Zhao, L.; Huang, C.-H. Degradation of Pharmaceuticals and Metabolite in Synthetic Human Urine by UV, UV/H2O2, and UV/PDS. Environ. Sci. Technol. 2015, 49, 3056–3066. [Google Scholar] [CrossRef]
- Buxton, G.V.; Salmon, G.A.; Williams, J.E. The Reactivity of Biogenic Monoterpenes towards OH· and SO4− Radicals in De-Oxygenated Acidic Solution. J. Atmos. Chem. 2000, 36, 111–134. [Google Scholar] [CrossRef]
- Matta, R.; Tlili, S.; Chiron, S.; Barbati, S. Removal of carbamazepine from urban wastewater by sulfate radical oxidation. Environ. Chem. Lett. 2011, 9, 347–353. [Google Scholar] [CrossRef]
- Lu, X.; Shao, Y.; Gao, N.; Chen, J.; Deng, H.; Chu, W.; An, N.; Peng, F. Investigation of clofibric acid removal by UV/persulfate and UV/chlorine processes: Kinetics and formation of disinfection byproducts during subsequent chlor(am)ination. Chem. Eng. J. 2018, 331, 364–371. [Google Scholar] [CrossRef]
Publisher’s Note: MDPI stays neutral with regard to jurisdictional claims in published maps and institutional affiliations. |
© 2022 by the authors. Licensee MDPI, Basel, Switzerland. This article is an open access article distributed under the terms and conditions of the Creative Commons Attribution (CC BY) license (https://creativecommons.org/licenses/by/4.0/).