Article

New Sets of Primers for DNA Identification of Non-Indigenous Fish Species in the Volga-Kama Basin (European Russia)

by
Dmitry P. Karabanov
1,*,
Eugeniya I. Bekker
2,
Dmitry D. Pavlov
1,
Elena A. Borovikova
1,
Yulia V. Kodukhova
1 and
Alexey A. Kotov
2,*
1
I.D. Papanin Institute for Biology of Inland Waters of Russian Academy of Sciences, 152742 Borok, Yaroslavl Area, Russia
2
A.N. Severtsov Institute of Ecology and Evolution of Russian Academy of Sciences, Leninsky Prospect 33, 119071 Moscow, Russia
*
Authors to whom correspondence should be addressed.
Water 2022, 14(3), 437; https://doi.org/10.3390/w14030437
Submission received: 16 December 2021 / Revised: 27 January 2022 / Accepted: 29 January 2022 / Published: 1 February 2022
(This article belongs to the Special Issue Species Richness and Diversity of Aquatic Ecosystems)

Abstract

:
Adequate species’ identification is critical for the detection and monitoring of biological invasions. In this study, we proposed and assessed the efficiency of newly created primer sets for the genetic identification of non-indigenous species (NIS) of fishes in the Volga basin based on: (a) a “long” fragment of cytochrome c oxidase subunit one of the mitochondrial gene (COI) (0.7 kb), used in “classical” DNA barcoding; (b) a short 3’-fragment (0.3 kb) of COI, suitable for use in high-throughput sequencing systems (i.e., for dietary analysis); (c) fragment of 16S mitochondrial rRNA, including those designed to fill the library of reference sequences for work on the metabarcoding of communities and eDNA studies; (d) a fragment of 18S nuclear rRNA, including two hypervariable regions V1-V2, valuable for animal phylogeny. All four sets of primers demonstrated a high amplification efficiency and high specificity for freshwater fish. Also, we proposed the protocols for the cost-effective isolation of total DNA and purification of the PCR product without the use of commercial kits. We propose an algorithm to carry out extremely cheap studies on the assessment of biological diversity without expensive equipment. We also present original data on the genetic polymorphism of all mass NIS fish species in the Volga-Kama region. The high efficiency of DNA identification based on our primers is shown relative to the traditional monitoring of biological invasions.

1. Introduction

An in-depth study of species’ expansions outside their historical ranges was formulated as a special task of recent biological sciences in the monograph of Charles Elton [1]. To date, identification of non-indigenous species (NIS), as well as corridors and vectors of biological invasions, is essential for rational environmental management and the implementation of sustainable development goals [2]. Early identification of NIS is difficult because of their initial paucity, and the understandable imperfectness of a morphological identification of a species that is new for a particular region. Therefore, the first reports of NIS often appear when they have already successfully invaded new ecosystems. Thus, the effectiveness of biological invasion monitoring and developing methods for controlling (and combating with) unwanted species are closely related to their fast and accurate identification [3,4,5,6]. Currently, DNA barcoding based on sequences of the first subunit of mitochondrial cytochrome oxidase c (COI, COX) is regarded sometimes as the ultima ratio for animal identification [7]. Traditionally, the 25/26 nucleotide primers LCO1490 and HCO2198 have been used for DNA barcoding [8]. However, genetic differences between different groups of animals result in a low specificity of the primers, which is reflected in a relatively low level of amplification success or even the complete absence of a PCR product, even in the case of a sufficient amount of non-degraded DNA [9,10,11]. Therefore, the next logical step is the development of more specific sets of primers for specific animal groups. For fishes, specific primers were developed originally for Australian species [12] then a “universal cocktail” was proposed [13], based on the mitochondrial genomes of economically important fish groups. Different primer sets have their advantages and disadvantages and the need for a balance between specificity and universality is obvious [14,15,16].
Identification of NIS of fish in Europe is a very important problem, because recently we have observed significant changes in indigenous fish communities in many river basins (i.e., due to creation of a system of artificial reservoirs, which have led to more favorable conditions for a range expansion in a number of aquatic organisms). The Volga River basin (including its largest affluent, the Kama River), one of the largest river basin in Europe (with 1.36 million km2 [17,18,19]), is densely populated, intensively used and is subject to a strong anthropogenic transformation [20,21,22]. A cascade of dams was created during Soviet times; several large reservoirs were formed in different portions of the basin [23]. The Volga basin is connected with several other large river basins by shipping channels, forming the meridian “Ponto–Volga–Baltic invasion corridor”, the largest in Europe [24,25,26]. Since the 1950–60s, non-indigenous hydrobionts became common in the Volga basin [19,27,28], and NIS of fishes have been detected during 1970–1980. All previous records were summarized and discussed in publications appearing only in the 21st century [19,25,29].
A total of 77 bony fish species inhabit the studied basin. However, even in the case of a very conservative approach in our littoral catches, the proportion of alien species ranges from 8 to 32% in different reservoirs of the Volga River and from 2 to 16% in reservoirs of the Kama River [29]. To date, 17 non-indigenous fish species are found in the Volga-Kama basin:
(1)
Ponto-Caspian marine faunistic complexes expanding their distribution ranges north: Benthophilus stellatus (Sauvage, 1874), Clupeonella cultriventris (Nordmann, 1840), Knipowitschia longecaudata (Kessler, 1877), Neogobius fluviatilis (Pallas, 1814), Neogobius melanostomus (Pallas, 1814), Ponticola gorlap (Iljin, 1949), Ponticola syrman (Nordmann, 1840), Proterorhinus semipellucidus (Kessler, 1877), Syngnathus abaster Risso, 1827;
(2)
Arctic freshwater faunistic complexes expanding their distribution ranges south: Osmerus eperlanus (Linnaeus, 1758), Coregonus albula (Linnaeus, 1758), and
(3)
escaped aquaculture specimens or deliberate introductions: Acipenser spp., Anguilla anguilla (Linnaeus, 1758), Ctenopharyngodon idella (Valenciennes, 1844), Hypophthalmichthys molitrix (Valenciennes, 1844), Ictalurus punctatus (Rafinesque, 1818), Perccottus glenii Dybowski, 1877.
Other NIS are represented by single findings: Salmo trutta Linnaeus, 1758, Oncorhynchus mykiss (Walbaum, 1792), Pungitius platygaster (Kessler, 1859), Pungitius pungitius (Linnaeus, 1758), Poecilia reticulata Peters, 1859, Pterygoplichthys sp., Oreochromis sp.
Unfortunately, only a few publications on any aspects of the genetics of NIS in the Volga-Kama are known to date [19,30,31,32], although fast and high-quality genetic diagnostics of NIS fish dispersing in the region is a relevant task for the control of biological invasions. The first study of fish biodiversity based on eDNA [30] has revealed only half of the taxa known for the region, and moreover, some taxa were apparently identified incorrectly. Finally, the authors [32] concluded that more specific primers must be used for such an analysis.
The designing of highly effective specific primers for such purposes is necessary. Moreover, special attention should be paid to the optimization of the methods’ costs, making the genetic identification of NIS a cheap routine method for experts in the applied sciences and water management. In this study, we proposed and assessed the efficiency of newly created primer sets for the genetic identification of NIS of fishes in the Volga-Kama basin based on: (a) “long” COI fragment (0.7 kb) used in “classical” DNA barcoding [12]; (b) short COI 3’-fragment (0.3 kb), suitable for using in high-throughput sequencing systems [33] (i.e., for dietary analysis [34,35]); (c) 16S fragment of mitochondrial rRNA, including those designed to fill the library of reference sequences, for work on the metabarcoding of communities and eDNA studies [36]; (d) fragment of 18S nuclear rRNA, including two hypervariable regions V1-V2, valuable for animal phylogeny [37]. Also, we propose protocols for the cost-effective isolation of total DNA and purification of the PCR product without the use of commercial kits.

2. Materials and Methods

2.1. Sampling

IBIW RAS has a special Governmental Permit for catching biological resources. Most samples from the Volga-Kama basin were caught during the Annual Complex Biological Expeditions of the IBIW RAS on an expedition vessel “Akademik Topchiev” in the summer field seasons from 2005 to 2020 (Figure 1; Supplement Tables S1 and S2); see our previous publication [29] for a detailed description of these works. More than 19 thousand fish specimens were initially analyzed, but most of the catch was released back into the water with minimal damage, and only NIS fish were taken from the catch and fixed in 95% ethanol. Additional samples were collected in other regions, or obtained from colleagues permitted to collect ichthyological samples. Finally, some samples were provided by regional environmental inspectors (see the column “Controversial primary definition” in Supplement Table S1).
The species were identified based on morphological characteristics, using the keys of Koblitckaya, Kottelat, and Freyhof and Makeeva et al. [38,39,40]. The scientific names are represented according to the latest edition of the FishBase database [41], and macro-systematics follows the latest edition of “Fishes of the World” [42]. For molecular genetic analysis, a portion of the caudal fin blade or a piece of skin and muscles behind the dorsal fin was taken from each specimen and fixed in 95% ethanol cooled to −20 °C, while the voucher specimen was fixed in 4% formalin for subsequent morphological analysis. Fish larvae, as well as fragmented samples, were fixed entirely in 95% ethanol. The alcohol samples were stored at +4 °C in the dark.
All vouchers are kept at the collection of the Ecology of Fishes of I. D. Papanin Institute for Biology of Inland Waters of the Russian Academy of Sciences, Borok, Russia, see Supplement Table S1.

2.2. Primer Design

For the design of primers, we selected the complete sequences of the fragments of interest from the GenBank database (NCBI). For the analysis of the COI and 16S loci, 16 complete mitochondrial genomes of Clupeiformes, Cypriniformes, Gobiiformes, Perciformes, and Salmoniformes were selected. For the 18S locus, six complete sequences of the small subunit of nuclear ribosomal RNA of Clupeiformes, Cypriniformes, Perciformes, and Salmoniformes were used. The sequences for each locus were aligned using the MAFFT v.7 algorithm [43], integrated into the Unipro UGENE v.38.1 package [44]. The target region was chosen for COI as a 0.7 kb 5’-region corresponding to the standard fragment for DNA barcoding of fish [12]. A variable 3’-region of a standard fragment [33] with a length of about 0.3 kb, which gives good prospects for use both in classical PCR and NGS platforms, was used for COI metabarcoding. A region of 16S with a 5’-end of about 0.6 kb was selected as being potentially highly informative for the purposes of species identification of fish [36], while a large number of sequences for 16S were generated by the metabarcoding of communities using high-throughput sequencing technologies [45]. The region of the 18S nuclear rRNA locus with a total length of about 0.5 kb, including the hypervariable regions V1-V2, was also selected as an informative marker, giving good results for the identification of almost all large groups of animals [46]. It is known that it shows less diversity than mitochondrial loci [37].
The primers used are represented in Table 1. For the primers, modified M13-tails [47] were added to the COI gene fragment at the 5’-end. In the case of highly degenerate primers with inosine in the composition, this ensures a guaranteed high-quality sequence, preventing the formation of primer and product polymers and providing optimal parameters for the Sanger sequencing reaction [48].

2.3. DNA Extraction, PCR Amplification and Sequencing

A total of 188 samples were used for the analysis of COI polymorphism and 94 samples were used for the analysis of other loci (calculated for standard 96-well plates, taking into account control wells). Genomic DNA was isolated using the Wizard Genomic DNA Purification Kit (Promega Corp., Madison, WI, USA) and QuickExtract DNA Extraction Solution (Epicenter by part Illumina Inc., San Diego, CA, USA), according to the manufacturer’s recommended protocols. After extraction, the concentration and purity of DNA were determined by measuring the optical density at λ 260/280 nm on a microspectrophotometer N50 (Implen GmbH, München, Germany). Also, in order to minimize the cost of DNA extraction without the use of commercial kits, we recommend a salt method for the isolation of nucleic acids without the use of expensive proteinase K, based on the protocol of Douglas et al. [49]. The protocol is represented in Appendix A.
Amplification was performed in individual 250 μL wells of a standard 96-well plate in a T-100 amplifier (Bio-Rad Laboratories Inc., Hercules, CA, USA), as well as in individual 600 μL microtubes in a BIS M111 amplifier (BIS Co., Moscow, Russia). The polymerase chain reaction was carried out in a volume of 25 μL reaction mixture composed of 1 μL DNA template (about 20 ng/μL), 1 unit standard Taq DNA polymerase, SE-buffer (60 mM Tris-HCl (pH 8.5); 2.5 mM MgCl2; 25 mM KCl; 10 mM β-mercaptoethanol; 0.1% Triton X-100 surfactant), 0.25 mM each of deoxy-nucleotide triphosphate (dNTPs) (all the reagents were produced by SibEnzyme Co., Novosibirsk, Russia), and 0.5 μM of each primer set. We used touchdown polymerase chain reaction [50], which reduces the effect of non-specific primer binding and increases the yield of the target product. The PCR protocol consisted of the following steps: primary denaturation for 3 min at +95 °C; 10 cycles of the “ladder” stage, consisting of 30 s of denaturation at +94°C, 45 s of primer annealing at a temperature of +58 °C (+60 °C for mb_if COI primers) in increments of −1 °C per cycle, and a step elongation 80 sec (60 sec for mb_ifCOI primers) at +72 °C. This was followed by 30 cycles of basic PCR, consisting of 30 s of denaturation at +94 °C, 30 s of primer annealing at the appropriate temperature (Table 1), and an elongation step of 60 s (40 s for mb_ifCOI primers) at +72 °C. At the end of the PCR, a final elongation step at +72 °C for 5 min followed, followed by storage at +12 °C.
The presence of the PCR product was checked by electrophoresis in 1.2% agarose gel in TBE buffer (pH 8.2), composed of THAM 89 mM, boric acid 89 mM, and EDTA 2 mM. The approximate molecular weight of the product was determined by comparison with the standard 100 bp + 1.5 kb + 3 kb DNA Ladder (SibEnzyme Co., Russia). DNA was visualized under UV light on a Kvant-312 transilluminator (Helicon Co., Moscow, Russia) with a UV wavelength of 312 nm, with preliminary staining of the gel in a 0.1 mM aqueous solution of ethidium bromide for 10 min and subsequent washing of the gel in distilled water for 15 min.
For PCR product purification we used QIAquick PCR Purification Kit spin columns (Qiagen N.V., Venlo, Netherlands) and ExoSAP-IT PCR Product Cleanup Reagent (Thermo Fisher Scientific Inc., Waltham, MA, USA). In addition, in the presence of a high-quality monomorphic PCR product, we used a simple method of alcohol reprecipitation under “mild conditions”, which was successfully used earlier [51] (see the protocol in Appendix A). The purified PCR product, after determining the DNA concentration, was prepared for sequencing using the BigDye Terminator v3.1 Cycle Sequencing Kit (Thermo Fisher Scientific Inc., USA). Sequencing of sense and antisense strands of PCR products was carried out on an Applied Biosystems 3730 DNA Analyzer automatic sequencer (Syntol Co., Moscow, Russia). Bidirectional sequences were assembled in Sanger Reads Editor add-on of Unipro UGENE package and manually edited. All obtained sequences were preliminarily verified to be fish in the GenBank database (NCBI) using the mBLAST query [52]. The sequences were deposited within GenBank under the numbers MT833701–MT833840 (COI), MZ005797–MZ005873 (16S), and MZ005706–MZ005796 (18S).

2.4. Alignment, Nucleotide Diversity, and Phylogenetic Analysis

Sequence alignment was performed using the MAFFT v.7 algorithm on the Computational Biology Research Center server, Japan (http://mafft.cbrc.jp, accessed on 15 December 2021) [53]. The alignment of each locus occurred independently. For the sequences of the protein-coding COI locus, the “Translation Align” option with the FFT-NS-i strategy was used. To align the sequences of ribosome-coding loci during alignment, the secondary structure of the molecule was taken into account, according to the Q-INS-i strategy.
Nucleotide diversity indices and neutrality tests [54] were calculated using the DnaSP v.6.12 software [55]. We conducted neutrality tests Fs [56] and D [57], which together provide sufficient information both to identify neutrality and to describe demographic processes [58,59].
ModelFinder v.1.6 [60] on the web-portal of the Center for Integrative Bioinformatics Vienna, Austria (http://www.iqtree.org (accessed on 1 June 2021)) [61] was used to search for the best model of nucleotide substitutions. For the COI locus, the substitution pattern was identified for each nucleotide position in the codon (1st, 2nd, 3rd). The selection of the most suitable model was based on the minimum values of the Bayesian information criterion, BIC [62]. It should be noted that the parameters of the BIC model were almost identical to those determined on the basis of the corrected Akaike’s information criterion, AICc [63], which may indicate a high agreement of the calculated models with the real best model.
According to the parameters of the selected model of nucleotide substitutions (Table 2), the phylogenetic tree was reconstructed for each locus. For maximum likelihood (ML) analysis, we used the IQ-TREE v.2.1 algorithm [64]. As a branch support test, we used 10k replicas of the UFboot2 bootstrap test [65], which takes up significantly less computational resources and is highly efficient when compared to traditional tests. Topology estimation for ML trees was based on 1k replicates of SH-aLRT test [66] calculations performed on the W-IQ-TREE server [61]. The ML tree constructed from the initial data is a realized (and not true) phylogenetic tree, and for such a case there is no unambiguous opinion about the correctness of using topological tests to check the monophyly of certain branches. However, in combination with a standard bootstrap, this procedure can be useful for assessing the group monophyly [54].
Reconstruction of the phylogeny using a stochastic approach (Bayesian inference, BI) was carried out using the BEAST2 v.2.6 software package [70]. Through the BEAUti tool [71], all the parameters of the models of nucleotide substitutions identified by ModelFinder were recorded. Based on the ML-test for the presence of a molecular clock, implemented in MEGA-X [72], the null hypothesis of an equal evolutionary rate throughout the tree was not rejected at a 5% significance level. The task of this work did not require the establishing of the exact phylogenetic relationships between species; therefore, the strict molecular clock evolutionary model with the priority of speciation according to the Yule process was chosen as the most suitable for the datasets covering several species [73]. Each analysis included six independent runs of MCMC, 50M generations each, and the selecting of each 50k tree. The effectiveness of MCMC on the convergence of the results of all independent runs with the estimated effective sample size (ESS) for all parameters above 200 was carried out in the Tracer v.1.7 program [74]. After combining the results of all MCMC runs through the LogCombiner, a consensus tree was computed based on the maximum confidence clade (MCC) using the TreeAnnotator [71] with 25% burn-in. After finding consistency in the main clades between BI and ML, the illustrations show only the ultrametric BI trees.
We carried out a comparison between trees (tanglegram) made in BEAST2 separately for COI “long” (about 700 b.p., “traditional” DNA barcoding) and COI “short” (about 350 b.p., “metabarcoding”) sequences, analyzing sequences exactly from the same vouchers on the tanglegram constructed in Dendroscope v.3.7 [75].

2.5. Species Delimitation

Initially, all sequences obtained in the course of this work were individually compared with the records in the NCBI Taxonomy Database [76] and BOLD BINs [77] (COI only). In the case of insufficient data on reference sequences or insufficient resolution of the method, a delimitation procedure based on genetic data was used, which is more related to “integrative taxonomy”. Initially, the level of the “gap” between species was determined based on genetic differences in the ASAP application on the web-server Atelier de BioInformatique, France (https://bioinfo.mnhn.fr/abi/public/asap/ (accessed on 5 June 2021)) [78]. The set of species was determined for the COI locus based on the “simple” uncorrected p-distance, as this is more preferable for the purposes of DNA barcoding [79]. The delimitation scheme was determined by the best asap-score with the minimum P-val. In addition, another approach based on distances and implemented in the “divergence threshold optimizing and clustering approach”, locMin [80], was used for species delimitation. The calculations were performed on the COI gene tree using the algorithm [81] in the “Microsoft R-Open and MKL” 64-bit v.3.5 software (https://mran.microsoft.com/ (accessed on 5 June 2021)) [82]. This implementation is suitable for single-locus studies, correlates well with morphological data, and at the same time is not prone to excessive taxa fragmentation [83].
Since the methods based on the search for the “gaps” between species are well developed only for the COI locus, other delimitation methods were applied for rest of the loci that we analyzed. The generalized mixed yule coalescent model (GMYC) was calculated in “Microsoft R-Open and MKL” software with the ‘splits’ package for consensus with ultrametric gene trees [84]. The multi-rate Poisson tree processes (mPTP) calculation was performed on individual ML gene trees on the Heidelberg Institute for Theoretical Studies web server (http://mptp.h-its.org/ (accessed on 11 June 2021)) [85].
All original materials, namely DNA sequences, alignments, phylogenetic trees, and images used in this study are publicly available in the Open Science Framework repository [86] at the project address https://osf.io/b8qfd/ (accessed on 11 January 2022). First draft of this work is available in MDPI Preprints service at https://dx.doi.org/10.20944/preprints202107.0151.v1 (accessed on 6 July 2021).

3. Results

3.1. Comparison of the Effectiveness of Different Methods of DNA Extraction and Purification of the PCR Products, and the Amplification Efficiency of Different Primer Sets

The isolation on spin columns gave the best DNA quality in terms of the λ 260/280 1.8–2 ratio. However, this is the most expensive method for DNA isolation and purification. The use of QuickExtract gave the highest quantitative yield of nucleic acids, but in this case, after isolation, the sample contained high concentration of peptides, DNA, and RNA fragments. Therefore, such an express method may be recommended for a direct PCR, without long-term storage of the extract. The salt method also showed good quality of the isolated DNA: the quality of the isolation according to the λ 260/280 ratio was 1.2–1.8, which allows the nucleic acid solution to be stored at −50 °C for up to a year almost without DNA degradation. All these methods provided a sufficient yield of the target product; however, the rather high cost and labor intensity of the process (when using spin columns) and the narrow temperature range of working with enzymes limit the usefulness of the commercial kits.
The results of our work using the MifCOI and MifCOI kits showed a high efficiency of PCR for freshwater fish in the studied region. The sequencing success was slightly lower than 100%, probably due to a high rate of the DNA fragmentation in some improperly fixed samples from the fish inspectors (Table 3, Supplement Table S1). The PCR with primers for the mitochondrial ribosomal large subunit (primers if16S) almost always gave a product, however, it has demonstrated a high rate of nonspecific product, which is generally typical for such locus studies [87]. The nuclear locus of the small ribosomal subunit (primers if18S) gave a high success of specific PCR products (Table 3).

3.2. Polymorphism and Nucleotide Diversity of the Studied Loci

In terms of the level of genetic diversity, the NIS fish species we studied in the European part of Russia differ significantly (Table 4). We obtained 146 partial COI sequences of NIS from 72 localities in the Volga-Kama basin, 77 sequences for 16S, and 91 for 18S. Sequence length varied from 669 for COI, 576–581 for 16S, and 417–486 for 18S. Mitochondrial loci exhibit a greater genetic variability than the nuclear 18S locus. Both mitochondrial loci, in contrast to the nuclear 18S, are characterized by a relatively low proportion of G + C nucleotides, which is generally characteristic of animals [88]. The highest genetic diversity is observed in the older families Clupeidae and Cyprinidae. The highest number of segregating sites was revealed to be in the mitochondrial COI and 16S loci, while the nuclear 18S gene is conservative, as was expected. At the same time, all three loci demonstrated a relatively high mutation rate at the order level. The Fs and D neutrality indices reflect a high level of differentiation between species within fish families.

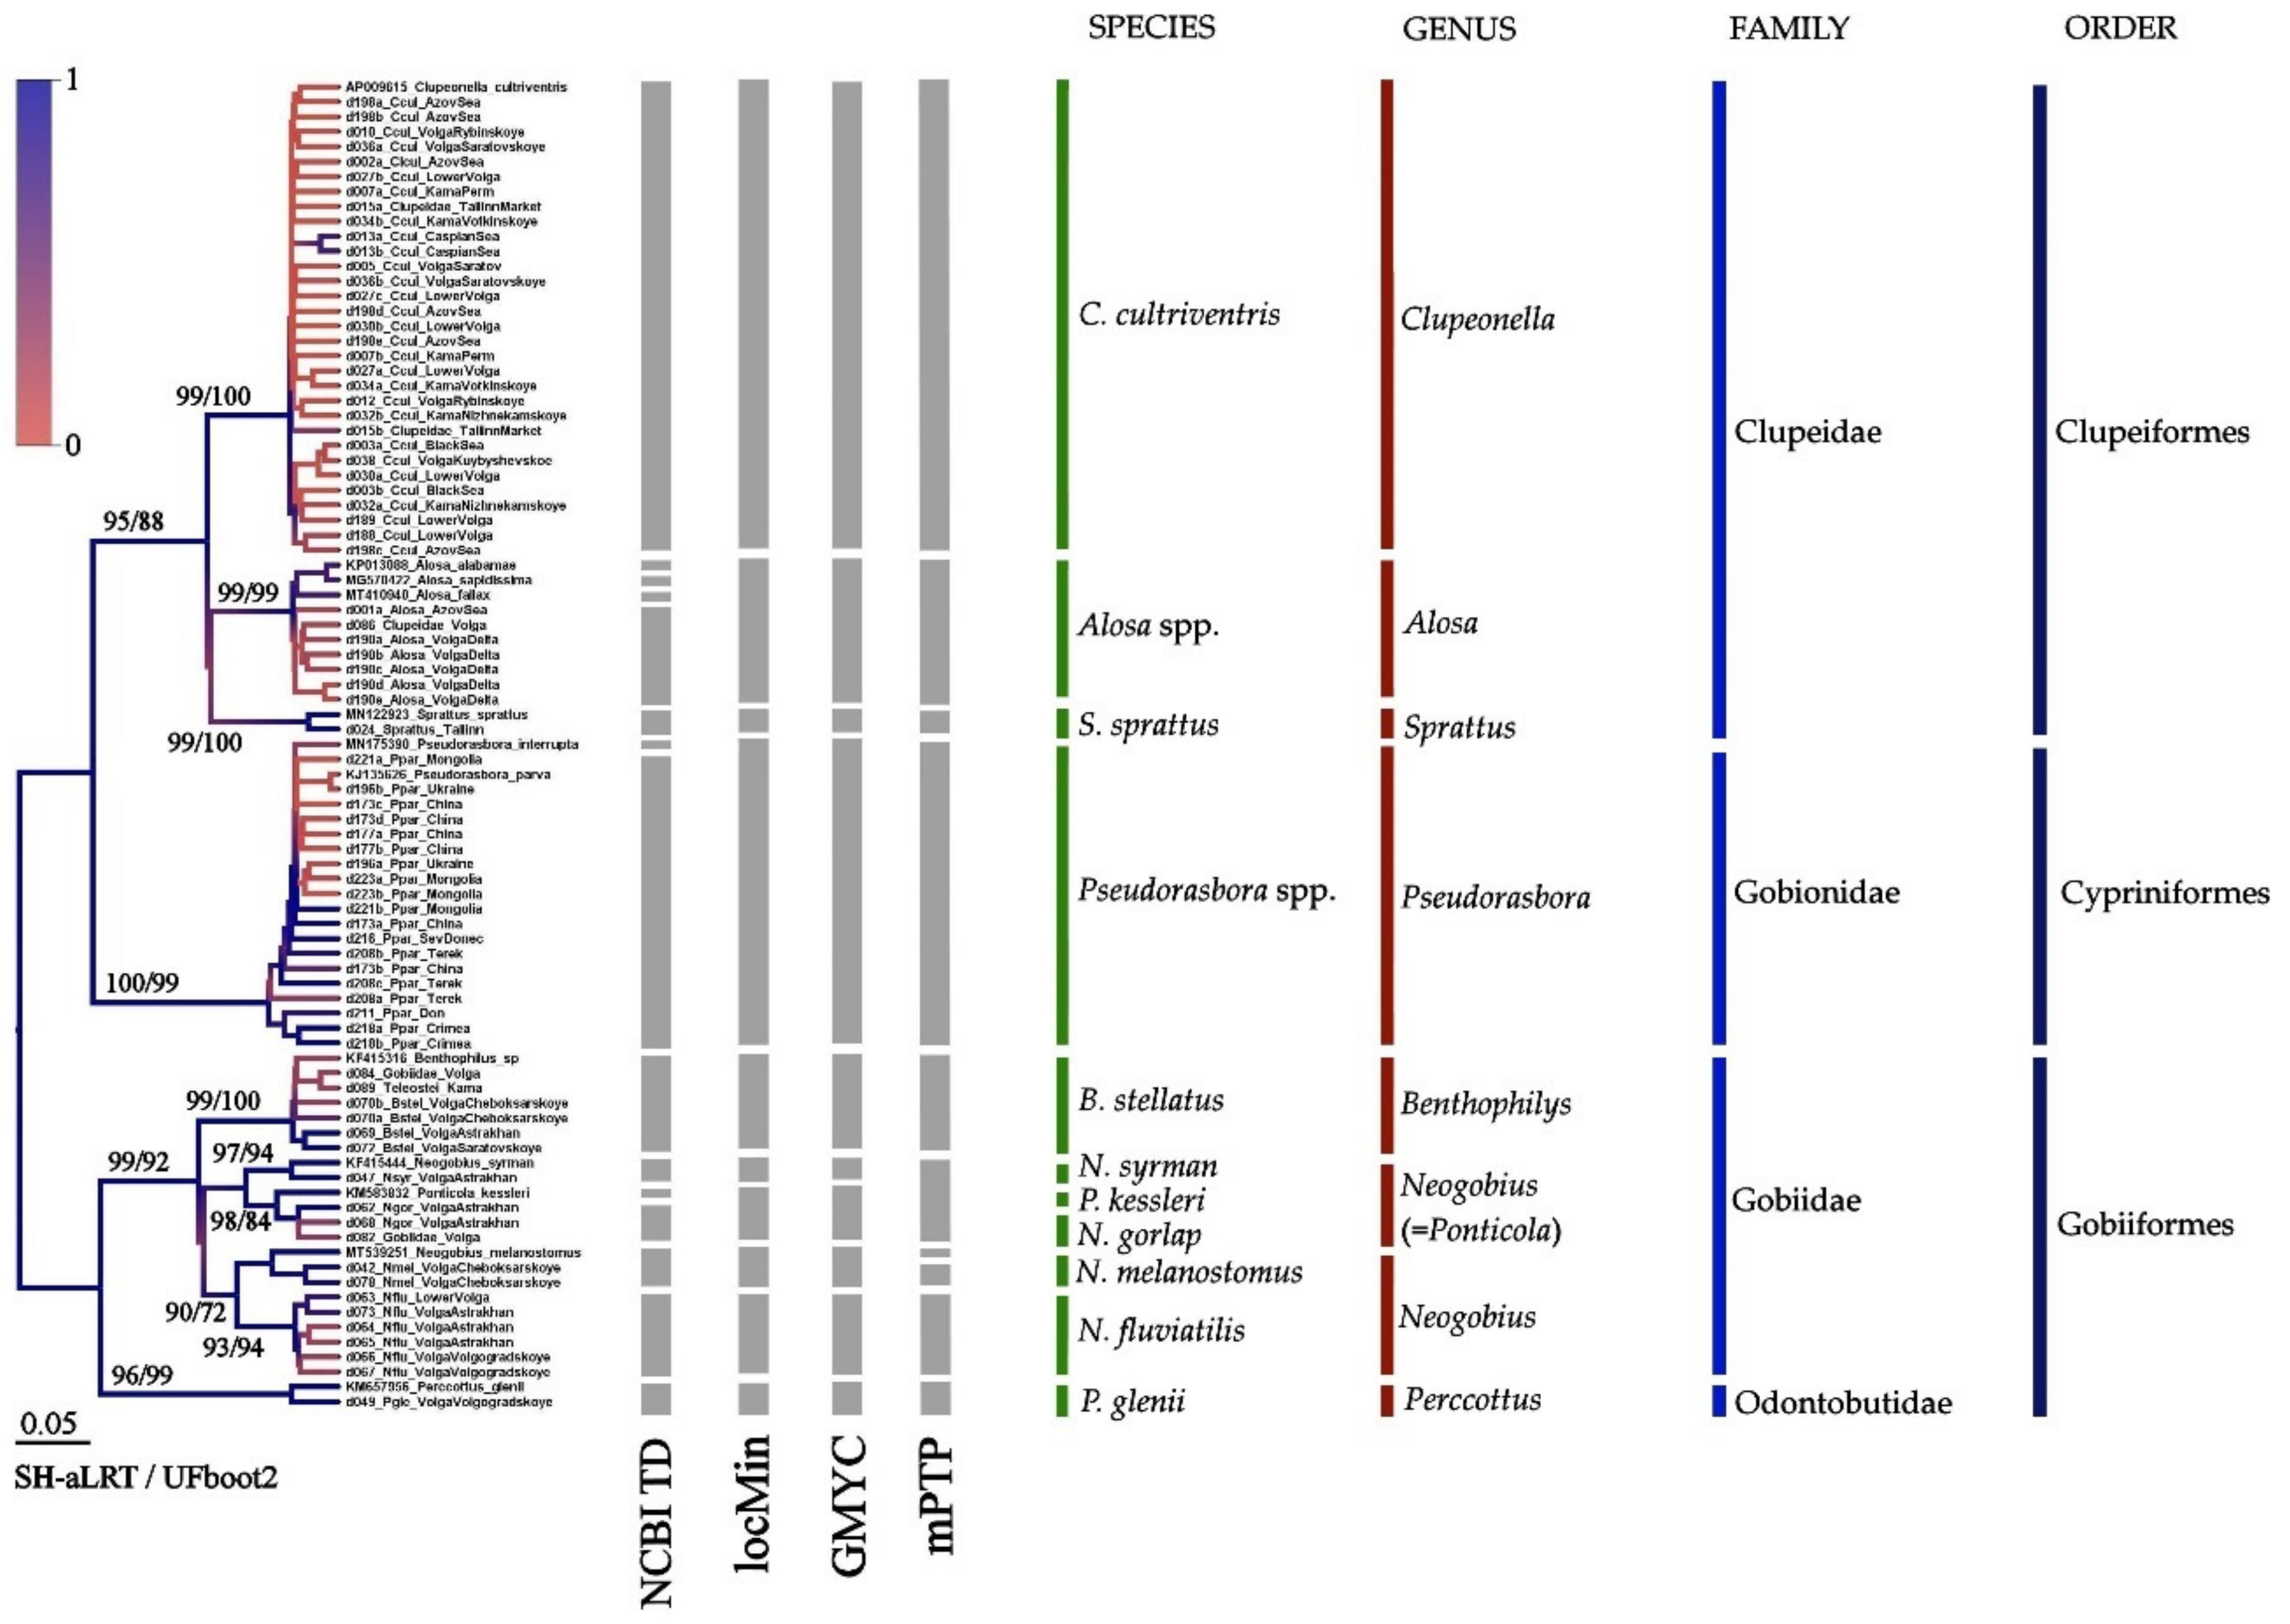
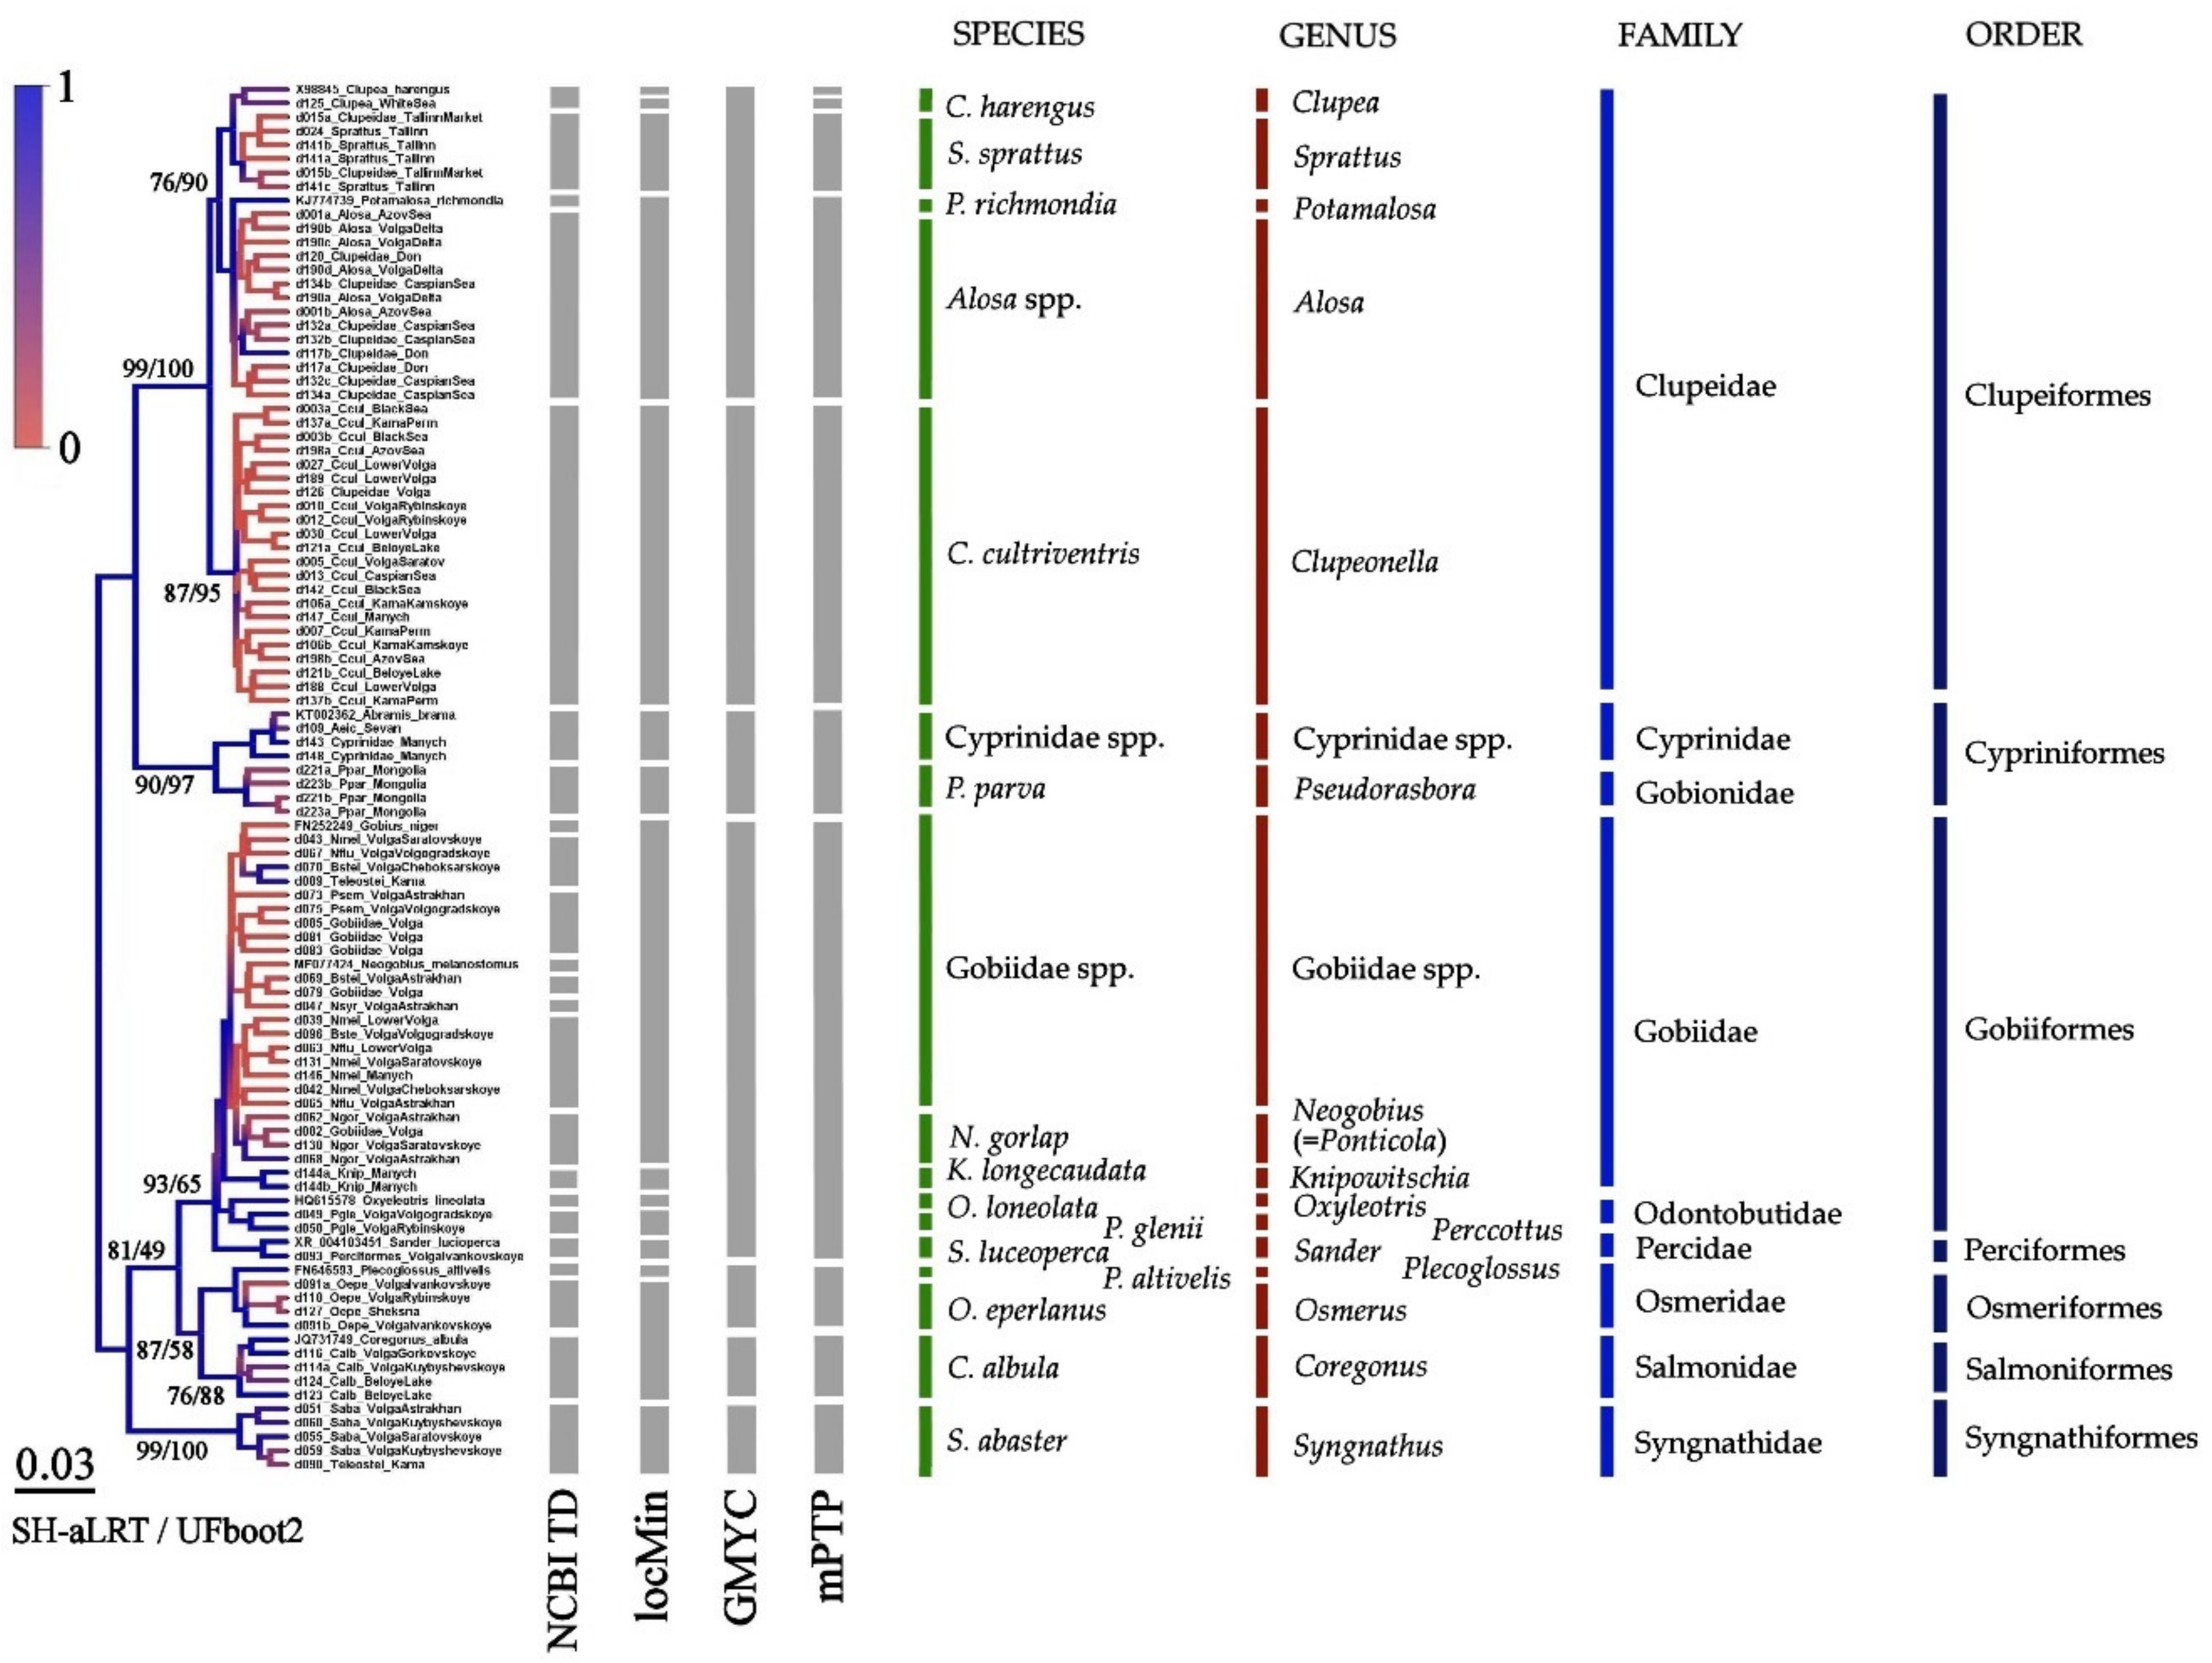
3.3. Results of Species Differentiation Based on DNA Analysis

The trees based on sequences of mitochondrial COI and 16S and nuclear 18S genes are represented in Figure 2, Figure 3, Figure 4 and Figure 5.
Previous authors frequently have deposited COI sequences with definitively incorrect identification of their vouchers, and formal blast with the Taxonomic Databases NCBI and BOLD gives 45 and 39 “clusters” of COI sequences in our dataset (Figure 2). The distant methods (ASAP and locMin) indicated fewer potential species clusters—30 and 26, respectively. The level of species differences based on p-distances was estimated to be 2.2% for ASAP and 1.9% for locMin. At the same time, the GMYC and mPTP indicated only 25 potential mOTUs (molecular operational taxonomic units). The highest genetic diversity was observed within the family Cypriniformes (up to 9 mOTUs). All “conventional” morphological species there were supported as being mOTUs. In contrast, a version of a high taxonomic diversity of Knipowischia, Benthophylus, and Coregonus was not supported by our analysis. The tree topology corresponds well with the traditional taxonomy and is characterized by a high statistical support of terminal branches. Only Salmoniformes is paraphyletic in the tree, explained by the incorrect positioning of Knipowitschia and Sander, which is to be expected, keeping in mind a lower resolution of the locus for the deep branches (higher than genus). The tree based on “short” COI sequences corresponded fully to the tree based on “long” sequences (Appendix B, Figure A1).
The tree of the 16S locus is represented in Figure 3. Based on the Taxonomic Database NCBI, we could select 15 clades in our dataset, but such a high number mainly reflects previous incorrect voucher identifications, rather than a real species diversity. All other methods (locMin, GMYC and mPTP) indicated 10 well-supported clades. Unfortunately, a limited number of the 16S sequences in the international databases makes impossible an accurate comparison of the 16S and COI datasets.
The nuclear 18S tree is represented in Figure 4. In contrast to 23 “species” selected, based on the Taxonomic Database NCBI, other methods indicated significantly lower numbers: locMin-15, GMYC-7 and mPTP-10, respectively. The species resolution of this locus is apparently low (because it separated even well-recognized taxa based on morphological characteristics), although the support of families is high: those are monophyletic, moreover, the tree topology corresponds well with fish macro-taxonomy.
Our comparison of the three trees’ topology (Appendix B, Figure A2) clearly indicates that the COI and 16S loci have the best support of the species clusters. At the same time, the 18S tree has a lower resolution at the species and even genus levels, but it is more adequate for phylogenetic purposes. The locus also could be used for the resolution of dubious cases and possible cases of hybridization (although we did not find any mitonuclear conflicts in our dataset).

4. Discussion

4.1. Primers’ Efficiency

The proposed research design allowed us to estimate the full cost of a single sequence (with all associated costs, from DNA extraction to obtaining the sequencing results) as being less than 2 USD (or about 3 USD for sequenced in both directions), which is comparable in its cost to the most modern high-throughput sequencing systems [89]. Moreover, our routine method does not require expensive equipment, and the technique of laboratory work and the processing of results is available to any researcher from low-income countries.
All our new primer pairs demonstrated a high efficiency. It should be noted here that by “specific sequencings success” we specifically mean the exact match between DNA identification by COI and other loci, as well as by the morphological characteristics of vouchers. It is likely that, in this case, the incomplete efficiency is explained by DNA degradation (some of the delivered samples were poorly preserved) and contamination from other fish specimens during total sample preservation.
The problem of the contamination by DNA from other organisms is quite common, which has consequences even for the international databases [90,91]. Thus, to improve the accuracy of DNA identification, it is desirable to use several loci and to study carefully the morphological characteristics of the vouchers. This is the only way to obtain a high-quality library of sequences that unambiguously corresponds to a particular species [92]. We tested the ifCOImb primer set to amplify a shorter product, similar to the meek reads used in the metabarcoding method [33]. Despite doubts about the universality of the COI locus, the latter, even when using incomplete fragments, provides reliable data for the animal species identification [93].
Our ifCOImb primers set showed the highest level of efficiency for the DNA identification of fishes (Table 3). Moreover, using “long” and “short” sets of sequences from our material led to similar topologies of the reconstructed trees (Appendix B, Figure A1). We believe that the amplicon length and design of these primers are suitable for modern high-throughput sequencing platforms [94] and may be used both for routine molecular research and work with community DNA or eDNA [30]. Another advantage of these short fragments is less stringent requirements for the quality of the DNA matrix, which allows the analysis of samples with poorly preserved and fragmented DNA (that often arrives from environmental services). Finally, the use of a fragment with a length of about 0.4 kb may significantly reduce the amplification time and the use of reagents for sequencing.
For accurate identification of “short” COI sequences, we need to create a library of the reference sequences from precisely defined voucher types. Fortunately, a huge number of sequences has now been accumulated for many freshwater NIS in European water bodies (i.e., in GenBank National Center for Biotechnology Information (www.ncbi.nlm.nih.gov/genbank/ (accessed on 1 June 2021)) [95], as well as BOLD: The Barcode of Life Data System (http://www.boldsystems.org/ (accessed on 1 June 2021)) [96]). The missing data may become available when working with the products obtained from the MifCOI primers. For them, a good amplification success is provided by a high degeneracy and the presence of inosine in the 3’-region, which greatly increases the efficiency of hybridization of the primer with the matrix [97]. Sequencing problems for such primers are solved by using M13-tails, which makes it possible to neutralize the influence of the primer dimers, degeneracy, and the use of non-canonical bases. In this case, it is possible to work without a single read from the forward or reverse primer, which significantly reduces the cost of sequencing.
The issue of a positive control when working with a degraded matrix (i.e., DNA can be damaged due to poor preservation; imperfect storage and transportation of samples) is a specific point, and the 16S locus is proposed for using in such cases [13]. However, it gave several false positive results in our study. It is characteristic not only of fish, but also of human DNA, the contamination of which cannot be fully avoided. It is easier to reconcile the issue of positive control, for example, by conducting routine studies on “short” COI sequences synthesized from the ifCOImb primer pair and the 18S locus. Sequencing of the obtained products allows us to determine accurately the species of fish. Also, due to the requirement for a shorter matrix, the rate of successful sequences even exceeded that for 16S (Table 3). It may also be noted that the use of the proposed primers may be successful in ifCOImb high-throughput sequencing systems for the purpose of DNA metabarcoding [98], and also to detect compliance with food product quality [34].
We should also note the success of the if18S primers, although the 18S locus demonstrates a rather low species variability [37]. However, the presence of conserved regions ensures efficient alignment of these sequences, and the hypervariable regions V1-V2 provide a fairly high level of variability. Also, the results of this locus analysis show a high similarity with results based on mitochondrial genes; hence, nucleotide sequences of ribosomal small subunits can be used successfully in phylogeographic reconstructions [99]. An additional advantage of this locus is its multiple copies (in contrast to most protein-coding genes) and the absence of individual polymorphism (in contrast to internal spacers). Therefore, the 18S study may be a good addition to the “classical” DNA barcoding, including the using of high-throughput sequencing systems [46]. The only limitation of the widespread use of this nuclear marker is still the low representation in the international databases of nucleotide sequences.
Only the 18S tree (Figure 4) corresponds well to the accepted phylogeny [100], while phylogenies based on mtDNA contradict the former. A similar effect is well known for other gene trees [101]. This could be explained by a strongly varying rate of accumulation of nucleotide substitutions during the evolution of various genes, and may be accompanied by a long branch attraction [102]. But for utilitarian purposes of species identification based on the COI locus, the correctness of the reconstructed phylogeny of higher taxa is irrelevant. If required, data on some more conservative nuclear loci should be used for this purpose [103].
The proposed sets of primers demonstrated a high efficiency in amplification and a high specificity for both freshwater NIS and other fish taxa. We propose (Figure 5) to use the MifCOI primer set to accumulate sequence data for reference samples of non-indigenous fishes from different locations. For a mass routine analysis, we propose to use the “short” COI sequences obtained from the ifCOImb primers. The sequences obtained from the if16S primers can be relevant in the study of local populations and for the accumulation of data for comparative analysis in the study of communities during metabarcoding studies. The use of the if18S primers may be used simultaneously as a positive control of PCR success, as well as to verify the results of the barcoding by mtDNA. The 18S gene tree may be used as a guide-tree to determine a general topology of the phylogenetic tree for higher taxa.

4.2. Application of New Primer Sets for the Detection of Non-Indigenous Fish Species in the Volga-Kama Basin

It is well-known that different delimitation methods give different numbers of OTUs [104,105,106]. We do not discuss here the positive and negative traits of each delimitation approach. We demonstrate that by using our primers we were able to identify successfully all NIS which have penetrated the Volga-Kama basin. Moreover, different algorithms of the OTUs delimitation gave non-contradicting results.
The most widespread and numerous NIS from the family Clupeidae in the Volga basin is the common kilka, Clupeonella cultriventris. For comparison to this species, we used the sequences of a related species, the European sprat Sprattus sprattus (Linnaeus 1758) from the GenBank. These two morphologically similar species could be separated easily based on all loci studied here. It was confirmed by our analysis of some samples from the commercial networks: samples d015a, d015b of the “European sprat” (according to the seller label) belonged, in reality, to the kilka. Probably, the seller was misled by the supplier, who provided a less expensive kilka instead of a more expensive sprat, as was reported many times in previous studies of commercial samples [34]. Also, according to the results of our DNA analysis, most juveniles of “herring” in the lower reaches of the Volga and Don are both indigenous kilka (as it was expected, see [107]) and also the Caspian-Black Sea herring of the genus Alosa Linck, 1790. Here, we detected the expanding of its distribution range towards the North, and that the invaders may escape the attention of researchers using traditional monitoring.
The most widespread NIS of the family Cyprinidae in Europe is the stone moroko or topmouth gudgeon, Pseudorasbora parva (Temminck & Schlegel 1846) [108]. Although this species has not yet been found in the Volga-Kama region, it is common in the neighboring basin of the Don River, another large river in Europe [109]. Specimens in some samples received from our colleagues from scientific and environmental organizations of Russia, which were identified as P. parva, in reality belonged to some other, non-invasive, species from several genera (Alburnus, Alburnoides, Rhinocypris, and Scrdinius). Initially mistaken identification could be explained by general problems in the identification of the cyprinid fry [110], where the morphometric characters of several species overlap strongly, and differences may only be revealed by analyxing the pharyngeal teeth.
Representatives of the family Gobiidae are among the most numerous NIS in Europe [111]. Taxonomy of the gobiids is extremely complicated and the validity of a number of taxa requires additional studies [112]. Our DNA barcoding confirmed the findings of the syrman goby, Ponticola syrman, in the Astrakhan Region, while its distribution was previously regarded as being limited to estuarine zones of the rivers [113]. In addition, in the upstream reaches of the Volga River near Volgograd, the long-tailed longtail dwarf goby Knipowitschia longecaudata (Kessler, 1877) was detected [114]. Most likely, its donor region is the Don River basin, and the Volga-Don navigable canal served as a transit corridor for this species. Another “invisible” NIS is the stellate tadpole goby, Benthophilus stellatus. The Kuibyshev Reservoir, where the Caspian and Azov-Black Sea phylogenetic lineages are mixed [115], serves as a secondary spread center of stellate tadpole goby. DNA identification of other gobiids is usually straightforward: for round goby, Neogobius melanostomus, monkey goby, Neogobius fluviatilis, and Caspian bighead goby Ponticola gorlap, mOTUs coincide with “traditional” species. Only genetic markers could adequately identify the species of tubenose goby Proterorhinus Smitt, 1900. It was previously believed that the Volga basin is inhabited by tubenose goby Proterorhinus semilunaris (Heckel, 1837) [116]. However, a comparison of the sequences from the Volga with the reference ones from the Black Sea [117] showed that the Volga populations are represented by P. semipellucidus instead of P. semilunaris of the Black Sea origin.
The family Odontobutidae Hoese & Gill, 1993 is represented in Europe by only a single NIS—the Chinese (mud) sleeper, Perccottus glenii [118]. Genetic identification of this invader is simple, although its larvae may easily be confused with juvenile percids in the course of routine hydrobiological monitoring.
The identification of a sole representative of the pipefishes from the family Syngnathidae Rafinesque, 1810, namely the black-striped pipefish, Syngnathus abaster, does not cause problems. Earlier, some genetically distinct groups of the pipefish populations of the Caspian and Black Seas were revealed [119]. Our DNA barcoding shows significant differences between the marine pipefish populations from the Caspian Sea and freshwater Eastern European populations, which possibly reflects their micro-phylogenesis and adaptation to the life in fresh waters (as it was shown for kilka, see above).
Non-indigenous species of the family Salmonidae Rafinesque, 1815 have arrived in the Volga through the “northern” invasion corridor. DNA identification of the European smelt Osmerus eperlanus does not cause problems. However, identification of another salmonid, vendace Coregonus albula, is difficult in the frame of “traditional” barcoding. For the European vendace from the Volga River basin, the haplotypes similar to those in four different species of the coregonids were found (Figure 2). This fact may be explained by an extremely low genetic variability at the COI locus, which is insufficient for an adequate discrimination of the species. It is also possible that the entire complex is represented by a single polymorphic species [120].

5. Conclusions

The proposed primers, in combination with research design, made it possible to carry out extremely cheap studies on the assessment of biological diversity, using genetic analysis without expensive equipment, and techniques for conducting laboratory work and processing of the results available to any researcher. High efficiency of DNA identification based on our new primer sets is shown above when compared to traditional monitoring methods of biological invasions.
Therefore, immediate application of the primer sets designed in this study allowed for the proper identification of all usual NIS through the whole Volga basin, confirmed or refuted some finding of the NIS located there, and revealed several cases of distribution range expansions in species originally inhabiting the Black and Caspian seas.

Supplementary Materials

The following are available online at https://www.mdpi.com/article/10.3390/w14030437/s1, Supplement Table S1: Samples; Supplement Table S2: fish catches in 2005–2021.

Author Contributions

Conceptualization, D.P.K. and A.A.K.; methodology, D.P.K.; software, D.P.K.; validation, D.P.K., E.I.B., E.A.B. and A.A.K.; formal analysis, D.P.K.; investigation, D.P.K., E.I.B. and A.A.K.; resources, D.P.K. and D.D.P.; data curation, D.P.K. and Y.V.K.; writing—original draft preparation, D.P.K., D.D.P. and A.A.K.; writing—review and editing, D.P.K. and A.A.K.; visualization, D.P.K. and Y.V.K.; supervision, A.A.K.; project administration, Y.V.K.; funding acquisition, E.I.B. All authors have read and agreed to the published version of the manuscript.

Funding

Genetic research was supported by the Russian Foundation for Basic Research grant no. 20-34-70020. The sampling of the materials was carried out as part of the IBIW RAS State Assignment no. 121051100104-6.

Data Availability Statement

All material examined in this study are openly available at the facilities listed, and by the catalogue numbers in the Materials and Methods section above. Original sequences are deposited to NCBI GenBank. All vouchers are kept at the collection of the Ecology of Fishes of I.D. Papanin Institute for Biology of Inland Waters of Russian Academy of Sciences, Borok, Russia. Data available at Open Science Framework project: Karabanov, D.P, 2021. OSF. Dataset. https://osf.io/b8qfd/. Preprint (2021) is available at https://dx.doi.org/10.20944/preprints202107.0151.v1 (accessed on 6 July 2021).

Acknowledgments

This study would have been impossible without a large number of colleagues from scientific and environmental organizations who helped in organizing field studies and sampling. We are unable to list everyone here by name, so as not to miss and not offend anyone. Separately, we would like to thank V.S. Artamonova and A.A. Makhrov for help and advice on DNA analysis, as well as Yu. Yu. Dgebuadze for general guidance on the part of the study related to biological invasions. Many thanks to R.J. Shiel for linguistic editing of an earlier draft.

Conflicts of Interest

The authors declare no conflict of interest. The funders had no role in the design of the study; in the collection, analyses, or interpretation of data; in the writing of the manuscript, or in the decision to publish the results.

Appendix A

Appendix A.1. DNA Extraction Protocol

All manipulations, if not specified separately, are carried out at room temperature.
The sample is taken from 300 mg of alcoholized or frozen fish tissue (preferably muscles and skin), dried on filter paper, and crushed into standard 1.5 mL microtubes.
To each tube is added 500 μL of sterile saline buffer preheated to + 60 °C [0.5 M NaCl; 100 mM Tris-HCl pH 8.0; 5 mM EDTA pH 8.0] in which the fish tissues are ground until the finest homogenate is obtained. The presence of bone debris or scales in the sample does not affect the efficiency of DNA extraction.
After grinding, 100 μL of the mixture [10% SDS; 1% β-mercaptoethanol] is added. For more efficient lysis of especially valuable samples, to improve the quality of recovery, an aqueous solution of proteinase K can also be added to a final concentration of 100 mkg/mL. The mixture is thoroughly mixed and incubated at +60 °C in a thermostat until the tissues are completely dissolved (depending on the sample, this process takes from 1 to 8 h).
During the lysis process, the samples are intensively mixed every 15 min on a vortex, after the drops are discarded by short-term centrifugation, and the tubes are again placed in a thermostat (the best effect is achieved when using a heated shaker-incubator).
Next, 300 μL of an aqueous solution of 5 M NaCl is added to each sample, the mixture is intensively mixed on a vortex for 30 s, after which it is centrifuged for 20 min at 16,000× g.
The supernatant in a volume of 600 μL is carefully placed (without stirring up the sediment) into individual clean microtubes, and an equal volume, 96% ethanol cooled to −20 °C is added to it. The DNA precipitation takes place at −20 °C for 1 h.
At the end of this stage, the samples are centrifuged for 20 min at 16,000× g and the supernatant is carefully removed.
The precipitate-containing nucleic acids are washed with 600 μL of 80% ethanol cooled to −20 °C, and the samples are finally centrifuged for 20 min at 16,000× g.
Depending on the amount of DNA, the washing step can be skipped, although this will somewhat reduce the purification quality, but will significantly increase the product yield.
After removing the supernatant, the sediment is briefly dried (2 min at +60 °C) and then dissolved in 100 μL of sterile water.
The isolation quality by the λ 260/280 ratio is 1.2–1.8, which allows the nucleic acid solution obtained in this way to be stored at −50 °C for up to a year with practically no DNA degradation.

Appendix A.2. PCR Product Purification Protocol

Ethanol is added to the amplification mixture to a final concentration of 70% and ammonium acetate to a final concentration of 125 mM. For one probe (10 μL PCR product), add 50 μL of the mixture, which contains 4.7 μL H2O, 1.5 μL NH4Ac 5M and 43.8 μL C2H5OH.
The mixture is gently mixed and reprecipitation proceeds at room temperature for 20 min.
At the end of this stage, the samples are centrifuged for 20 min at 16,000× g and the supernatant is carefully removed.
The precipitate containing nucleic acids is washed with 600 μL of 80% ethanol cooled to −20 °C, and centrifuged again for 20 min at 16,000× g.
After removing the supernatant, the sediment is briefly dried (2 min at + 60 °C) and then dissolved in 20 μL of sterile water.
The nucleic acid solution obtained in this way can be stored at −50 °C for up to a year with practically no DNA degradation.

Appendix B

Figure A1. A tanglegram of phylogenetic trees for mitochondrial COI sequences by “long” form MifCOI (left) and “short” form ifCOImb (right) primers sets. All pictures in high resolution available online: https://osf.io/b8qfd/ (accessed on 6 July 2021).
Water 14 00437 g0a1
Figure A2. Topology of the BI genetic tree based on sequences of COI, 16S and 18S loci. Node supports are posterior probabilities, indicated as coloration.
Water 14 00437 g0a2

References

  1. Elton, C.S. The Ecology of Invasions by Animals and Plants: New Edition; University of Chicago Press: Chicago, IL, USA; London, UK, 2000; ISBN 0226206386. [Google Scholar]
  2. Robertson, P.A.; Mill, A.; Novoa, A.; Jeschke, J.M.; Essl, F.; Gallardo, B.; Geist, J.; Jarić, I.; Lambin, X.; Musseau, C.; et al. A proposed unified framework to describe the management of biological invasions. Biol. Invasions 2020, 22, 2633–2645. [Google Scholar] [CrossRef]
  3. Lodge, D.M.; Williams, S.; MacIsaac, H.J.; Hayes, K.R.; Leung, B.; Reichard, S.; Mack, R.N.; Moyle, P.B.; Smith, M.; Andow, D.A.; et al. Biological invasions: Recommendations for U.S. policy and management. Ecol. Appl. 2006, 16, 2035–2054. [Google Scholar] [CrossRef] [Green Version]
  4. Makhrov, A.A.; Karabanov, D.P.; Koduhova, Y.V. Genetic methods for the control of alien species. Russ. J. Biol. Invasions 2014, 5, 194–202. [Google Scholar] [CrossRef]
  5. McGeoch, M.A.; Genovesi, P.; Bellingham, P.J.; Costello, M.J.; McGrannachan, C.; Sheppard, A. Prioritizing species, pathways, and sites to achieve conservation targets for biological invasion. Biol. Invasions 2016, 18, 299–314. [Google Scholar] [CrossRef] [Green Version]
  6. Miralles, L.; Ibabe, A.; González, M.; García-Vázquez, E.; Borrell, Y.J. “If you know the enemy and know yourself”: Addressing the problem of biological invasions in ports through a new NIS invasion threat score, routine monitoring, and preventive action plans. Front. Mar. Sci. 2021, 8, e633118. [Google Scholar] [CrossRef]
  7. Hebert, P.D.N.; Cywinska, A.; Ball, S.L.; deWaard, J.R. Biological identifications through DNA barcodes. Proc. R. Soc. Lond. B Biol. Sci. 2003, 270, 313–321. [Google Scholar] [CrossRef] [Green Version]
  8. Folmer, O.; Black, M.; Hoeh, W.; Lutz, R.; Vrijenhoek, R. DNA primers for amplification of mitochondrial cytochrome c oxidase subunit I from diverse metazoan invertebrates. Mol. Marine Biol. Biotechnol. 1994, 3, 294–299. [Google Scholar]
  9. Sharma, P.; Kobayashi, T. Are “universal” DNA primers really universal? J. Appl. Genet. 2014, 55, 485–496. [Google Scholar] [CrossRef]
  10. Jacquot, S.; Chartoire, N.; Piguet, F.; Hérault, Y.; Pavlovic, G. Optimizing PCR for mouse genotyping: Recommendations for reliable, rapid, cost effective, robust and adaptable to high-throughput genotyping protocol for any type of mutation. Curr. Protoc. Mouse Biol. 2019, 9, e65. [Google Scholar] [CrossRef] [Green Version]
  11. Kadri, K. Polymerase Chain Reaction (PCR): Principle and applications. In Synthetic Biology—New Interdisciplinary Science; Nagpal, M.L., Boldura, O.-M., Balta, C., Enany, S., Eds.; IntechOpen: London, UK, 2020; pp. 1–17. ISBN 978-1-78984-089-6. [Google Scholar]
  12. Ward, R.D.; Zemlak, T.S.; Innes, B.H.; Last, P.R.; Hebert, P.D.N. DNA barcoding Australia’s fish species. Philos. Trans. R. Soc. B 2005, 360, 1847–1857. [Google Scholar] [CrossRef]
  13. Ivanova, N.V.; Zemlak, T.S.; Hanner, R.H.; Hebert, P.D.N. Universal primer cocktails for fish DNA barcoding. Mol. Ecol. Notes 2007, 7, 544–548. [Google Scholar] [CrossRef]
  14. Lemmon, G.H.; Gardner, S.N. Predicting the sensitivity and specificity of published real-time PCR assays. Ann. Clin. Microbiol. Antimicrob. 2008, 7, 18. [Google Scholar] [CrossRef] [PubMed] [Green Version]
  15. Malpartida-Cardenas, K.; Rodriguez-Manzano, J.; Yu, L.-S.; Delves, M.J.; Nguon, C.; Chotivanich, K.; Baum, J.; Georgiou, P. Allele-specific isothermal amplification method using unmodified self-stabilizing competitive primers. Anal. Chem. 2018, 90, 11972–11980. [Google Scholar] [CrossRef] [PubMed] [Green Version]
  16. Brown, D.C.; Turner, R.J. Lessons and considerations for the creation of universal primers targeting non-conserved, horizontally mobile genes. Appl. Environ. Microbiol. 2020, 87, e02181-20. [Google Scholar] [CrossRef]
  17. Frolova, N.L.; Agafonova, S.A.; Kireeva, M.B.; Povalishnikova, E.S.; Pakhomova, O.M. Recent changes of annual flow distribution of the Volga basin rivers. Geogr. Environ. Sustain. 2017, 10, 28–39. [Google Scholar] [CrossRef]
  18. Schletterer, M.; Shaporenko, S.I.; Kuzovlev, V.V.; Minin, A.E.; van Geest, G.J.; Middelkoop, H.; Gorski, K. The Volga: Management issues in the largest river basin in Europe. River Res. Appl. 2019, 35, 510–519. [Google Scholar] [CrossRef]
  19. Mineeva, N.; Lazareva, V.; Litvinov, A.; Stepanova, I.; Chuiko, G.; Papchenkov, V.; Korneva, L.; Scherbina, G.; Pryanichnikova, E.; Perova, S.; et al. The Volga River. In Rivers of Europe, 2nd ed.; Tockner, K., Zarfl, C., Robinson, C., Eds.; Elsevier: Amsterdam, The Netherlands, 2021; pp. 27–79. ISBN 9780081026120. [Google Scholar]
  20. Reshetnyak, O.S.; Nikanorov, A.M.; Bryzgalo, V.A.; Kosmenko, L.S. Anthropogenic transformation of the aquatic ecosystem of the Lower Volga. Water Resour. 2013, 40, 667–676. [Google Scholar] [CrossRef]
  21. Ellis, E.C. Anthropogenic transformation of the terrestrial biosphere. Philos. Trans. R. Soc. A 2011, 369, 1010–1035. [Google Scholar] [CrossRef]
  22. Mukharamova, S.; Ivanov, M.; Yermolaev, O. Assessment of anthropogenic pressure on the Volga Federal District territory using river basin approach. Geosciences 2020, 10, 139. [Google Scholar] [CrossRef] [Green Version]
  23. Avakyan, A.B. Volga-Kama cascade reservoirs and their optimal use. Lakes Reservoirs 1998, 3, 113–121. [Google Scholar] [CrossRef]
  24. Bij de Vaate, A.; Jazdzewski, K.; Ketelaars, H.A.; Gollasch, S.; van der Velde, G. Geographical patterns in range extension of Ponto-Caspian macroinvertebrate species in Europe. Can. J. Fish. Aquat. Sci. 2002, 59, 1159–1174. [Google Scholar] [CrossRef]
  25. Slynko, Y.V.; Korneva, L.G.; Rivier, I.K.; Papchenkov, V.G.; Scherbina, G.H.; Orlova, M.I.; Therriault, T.W. The Caspian-Volga-Baltic invasion corridor. In Invasive Aquatic Species of Europe. Distribution, Impacts and Management; Leppakoski, E., Gollasch, S., Olenin, S., Eds.; Springer: Dordrecht, The Netherlands, 2002; pp. 399–411. ISBN 978-90-481-6111-9. [Google Scholar]
  26. Panov, V.E.; Alexandrov, B.; Arbaciauskas, K.; Binimelis, R.; Copp, G.H.; Grabowski, M.; Lucy, F.; Leuven, R.S.E.W.; Nehring, S.; Paunović, M.; et al. Assessing the risks of aquatic species invasions via European inland waterways: From concepts to environmental indicators. Integr. Environ. Assess. Manag. 2009, 5, 110–126. [Google Scholar] [CrossRef] [PubMed]
  27. Mordukhai-Boltovskoi, P.D. Caspian Polyphemids in the reservoirs of the Don and Dnieper Rivers. Tr. Inst. Biol. Vnutr. Vod AN SSSR 1965, 8, 37–43. [Google Scholar]
  28. Karabanov, D.P.; Garibian, P.G.; Bekker, E.I.; Sabitova, R.Z.; Kotov, A.A. Genetic signature of a past anthropogenic transportation of a Far-Eastern endemic Cladoceran (Crustacea: Daphniidae) to the Volga Basin. Water 2021, 13, 2589. [Google Scholar] [CrossRef]
  29. Karabanov, D.P.; Pavlov, D.D.; Bazarov, M.I.; Borovikova, E.A.; Gerasimov, Y.V.; Kodukhova, Y.V.; Smirnov, A.K.; Stolbunov, I.A. Alien species of fish in the littoral of Volga and Kama reservoirs (Results of complex expeditions of IBIW RAS in 2005–2017). Trans. IBIW RAS 2018, 82, 67–80. [Google Scholar] [CrossRef]
  30. Lecaudey, L.A.; Schletterer, M.; Kuzovlev, V.V.; Hahn, C.; Weiss, S.J. Fish diversity assessment in the headwaters of the Volga River using environmental DNA metabarcoding. Aquat. Conserv. 2019, 29, 1785–1800. [Google Scholar] [CrossRef] [Green Version]
  31. Schenekar, T.; Schletterer, M.; Lecaudey, L.A.; Weiss, S.J. Reference databases, primer choice, and assay sensitivity for environmental metabarcoding: Lessons learnt from a re-evaluation of an eDNA fish assessment in the Volga headwaters. River Res. Appl. 2020, 36, 1004–1013. [Google Scholar] [CrossRef] [Green Version]
  32. Schenekar, T.; Schletterer, M.; Weiss, S.J. Development of a TaqMan qPCR protocol for detecting Acipenser ruthenus in the Volga headwaters from eDNA samples. Conserv. Genet. Resour. 2020, 12, 395–397. [Google Scholar] [CrossRef] [Green Version]
  33. Leray, M.; Yang, J.Y.; Meyer, C.P.; Mills, S.C.; Agudelo, N.; Ranwez, V.; Boehm, J.T.; Machida, R.J. A new versatile primer set targeting a short fragment of the mitochondrial COI region for metabarcoding metazoan diversity: Application for characterizing coral reef fish gut contents. Front. Zool. 2013, 10, 34. [Google Scholar] [CrossRef] [Green Version]
  34. Sultana, S.; Ali, M.E.; Hossain, M.A.M.; Naquiah, N.; Zaidul, I.S.M. Universal mini COI barcode for the identification of fish species in processed products. Food Res. Int. 2018, 105, 19–28. [Google Scholar] [CrossRef]
  35. Ando, H.; Mukai, H.; Komura, T.; Dewi, T.; Ando, M.; Isagi, Y. Methodological trends and perspectives of animal dietary studies by noninvasive fecal DNA metabarcoding. Environ. DNA 2020, 2, 391–406. [Google Scholar] [CrossRef]
  36. Cawthorn, D.-M.; Steinman, H.A.; Witthuhn, R.C. Evaluation of the 16S and 12S rRNA genes as universal markers for the identification of commercial fish species in South Africa. Gene 2012, 491, 40–48. [Google Scholar] [CrossRef] [PubMed]
  37. Tang, C.Q.; Leasi, F.; Obertegger, U.; Kieneke, A.; Barraclough, T.G.; Fontaneto, D. The widely used small subunit 18S rDNA molecule greatly underestimates true diversity in biodiversity surveys of the meiofauna. Proc. Natl. Acad. Sci. USA 2012, 109, 16208–16212. [Google Scholar] [CrossRef] [PubMed] [Green Version]
  38. Koblitckaya, A.F. Handbook of Juvenile Freshwater Fish; Lyogkaia i Pishchevaia Promyshlennost: Moscow, Russia, 1981. [Google Scholar]
  39. Kottelat, M.; Freyhof, J. Handbook of European Freshwater Fishes; Publications Kottelat: Cornol, Switzerland, 2007; ISBN 2839902982. [Google Scholar]
  40. Makeeva, A.P.; Pavlov, D.S.; Pavlov, D.A. Atlas of Larvae and Juveniles of Freshwater Fishes of Russia; KMK Scientific Press Ltd.: Moscow, Russia, 2011; ISBN 978-5-87317-714-1. [Google Scholar]
  41. Froese, R.; Pauly, D. (Eds.) FishBase. World Wide Web Electronic Publication. Available online: www.fishbase.org (accessed on 15 June 2021).
  42. Nelson, J.S.; Grande, T.; Wilson, M.V.H. Fishes of the World, 5th ed.; John Wiley & Sons: Hoboken, NJ, USA, 2016; ISBN 9781118342336. [Google Scholar]
  43. Katoh, K.; Standley, D.M. MAFFT multiple sequence alignment software version 7: Improvements in performance and usability. Mol. Biol. Evol. 2013, 30, 772–780. [Google Scholar] [CrossRef] [PubMed] [Green Version]
  44. Okonechnikov, K.; Golosova, O.; Fursov, M. Unipro UGENE: A unified bioinformatics toolkit. Bioinformatics 2012, 28, 1166–1167. [Google Scholar] [CrossRef] [Green Version]
  45. Santos, A.; van Aerle, R.; Barrientos, L.; Martinez-Urtaza, J. Computational methods for 16S metabarcoding studies using Nanopore sequencing data. Comput. Struct. Biotechnol. J. 2020, 18, 296–305. [Google Scholar] [CrossRef]
  46. Hadziavdic, K.; Lekang, K.; Lanzen, A.; Jonassen, I.; Thompson, E.M.; Troedsson, C. Characterization of the 18S rRNA gene for designing universal eukaryote specific primers. PLoS ONE 2014, 9, e87624. [Google Scholar] [CrossRef] [Green Version]
  47. Messing, J. New M13 vectors for cloning. Methods Enzymol. 1983, 101, 20–78. [Google Scholar] [CrossRef]
  48. Jennings, W.B.; Ruschi, P.A.; Ferraro, G.; Quijada, C.C.; Silva-Malanski, A.C.G.; Prosdocimi, F.; Buckup, P.A. Barcoding the Neotropical freshwater fish fauna using a new pair of universal COI primers with a discussion of primer dimers and M13 primer tails. Genome 2019, 62, 77–83. [Google Scholar] [CrossRef]
  49. Douglas, A.M.; Georgalis, A.M.; Benton, L.R.; Canavan, K.L.; Atchison, B.A. Purification of human leucocyte DNA: Proteinase K is not necessary. Anal. Biochem. 1992, 201, 362–365. [Google Scholar] [CrossRef]
  50. Green, M.R.; Sambrook, J. Touchdown Polymerase Chain Reaction (PCR). Cold Spring Harb. Protoc. 2018, 2018, prot095133. [Google Scholar] [CrossRef] [PubMed]
  51. Makhrov, A.A.; Artamonova, V.S.; Karabanov, D.P. Finding of topmouth gudgeon Pseudorasbora parva (Temminck et Schlegel) (Actinopterygii: Cyprinidae) in the Brahmaputra River basin (Tibetan Plateau, China). Russ. J. Biol. Invasions 2013, 4, 174–179. [Google Scholar] [CrossRef]
  52. Chen, Y.; Ye, W.; Zhang, Y.; Xu, Y. High speed BLASTN: An accelerated MegaBLAST search tool. Nucleic Acids Res. 2015, 43, 7762–7768. [Google Scholar] [CrossRef] [Green Version]
  53. Katoh, K.; Rozewicki, J.; Yamada, K.D. MAFFT online service: Multiple sequence alignment, interactive sequence choice and visualization. Brief. Bioinform. 2019, 20, 1160–1166. [Google Scholar] [CrossRef] [Green Version]
  54. Nei, M.; Kumar, S. Molecular Evolution and Phylogenetics; Oxford University Press: New York, NY, USA, 2000; ISBN 0195135857. [Google Scholar]
  55. Rozas, J.; Ferrer-Mata, A.; Sanchez-DelBarrio, J.C.; Guirao-Rico, S.; Librado, P.; Ramos-Onsins, S.E.; Sanchez-Gracia, A. DnaSP 6: DNA sequence polymorphism analysis of large data sets. Mol. Biol. Evol. 2017, 34, 3299–3302. [Google Scholar] [CrossRef] [PubMed]
  56. Fu, Y.X. Statistical tests of neutrality of mutations against population growth, hitchhiking and background selection. Genetics 1997, 147, 915–925. [Google Scholar] [CrossRef] [PubMed]
  57. Tajima, F. Statistical method for testing the neutral mutation hypothesis by DNA polymorphism. Genetics 1989, 123, 585–595. [Google Scholar] [CrossRef]
  58. Ramirez-Soriano, A.; Ramos-Onsins, S.E.; Rozas, J.; Calafell, F.; Navarro, A. Statistical power analysis of neutrality tests under demographic expansions, contractions and bottlenecks with recombination. Genetics 2008, 179, 555–567. [Google Scholar] [CrossRef] [Green Version]
  59. Garrigan, D.; Lewontin, R.; Wakeley, J. Measuring the sensitivity of single-locus “neutrality tests” using a direct perturbation approach. Mol. Biol. Evol. 2010, 27, 73–89. [Google Scholar] [CrossRef] [Green Version]
  60. Kalyaanamoorthy, S.; Minh, B.Q.; Wong, T.K.F.; von Haeseler, A.; Jermiin, L.S. ModelFinder: Fast model selection for accurate phylogenetic estimates. Nat. Methods 2017, 14, 587–589. [Google Scholar] [CrossRef] [Green Version]
  61. Trifinopoulos, J.; Nguyen, L.-T.; von Haeseler, A.; Minh, B.Q. W-IQ-TREE: A fast online phylogenetic tool for maximum likelihood analysis. Nucleic Acids Res. 2016, 44, W232–W235. [Google Scholar] [CrossRef] [PubMed] [Green Version]
  62. Schwarz, G. Estimating the dimension of a model. Ann. Stat. 1978, 6, 461–464. [Google Scholar] [CrossRef]
  63. Hurvich, C.M.; Tsai, C.-L. Regression and time series model selection in small samples. Biometrika 1989, 76, 297–307. [Google Scholar] [CrossRef]
  64. Minh, B.Q.; Schmidt, H.A.; Chernomor, O.; Schrempf, D.; Woodhams, M.D.; von Haeseler, A.; Lanfear, R. IQ-TREE 2: New models and efficient methods for phylogenetic inference in the genomic era. Mol. Biol. Evol. 2020, 37, 1530–1534. [Google Scholar] [CrossRef] [Green Version]
  65. Hoang, D.T.; Chernomor, O.; von Haeseler, A.; Minh, B.Q.; Le Vinh, S. UFBoot2: Improving the ultrafast bootstrap approximation. Mol. Biol. Evol. 2018, 35, 518–522. [Google Scholar] [CrossRef] [PubMed]
  66. Guindon, S.; Dufayard, J.-F.; Lefort, V.; Anisimova, M.; Hordijk, W.; Gascuel, O. New algorithms and methods to estimate maximum-likelihood phylogenies: Assessing the performance of PhyML 3.0. Syst. Biol. 2010, 59, 307–321. [Google Scholar] [CrossRef] [PubMed] [Green Version]
  67. Felsenstein, J. Evolutionary trees from DNA sequences: A maximum likelihood approach. J. Mol. Evol. 1981, 17, 368–376. [Google Scholar] [CrossRef]
  68. Yang, Z. Maximum likelihood phylogenetic estimation from DNA sequences with variable rates over sites: Approximate methods. J. Mol. Evol. 1994, 39, 306–314. [Google Scholar] [CrossRef] [Green Version]
  69. Soubrier, J.; Steel, M.; Lee, M.S.Y.; Der Sarkissian, C.; Guindon, S.; Ho, S.Y.W.; Cooper, A. The influence of rate heterogeneity among sites on the time dependence of molecular rates. Mol. Biol. Evol. 2012, 29, 3345–3358. [Google Scholar] [CrossRef] [Green Version]
  70. Bouckaert, R.; Vaughan, T.G.; Barido-Sottani, J.; Duchene, S.; Fourment, M.; Gavryushkina, A.; Heled, J.; Jones, G.; Kuhnert, D.; de Maio, N.; et al. BEAST 2.5 : An advanced software platform for Bayesian evolutionary analysis. PLoS Comput. Biol. 2019, 15, e1006650. [Google Scholar] [CrossRef] [Green Version]
  71. Drummond, A.J.; Suchard, M.A.; Xie, D.; Rambaut, A. Bayesian phylogenetics with BEAUti and the BEAST 1.7. Mol. Biol. Evol. 2012, 29, 1969–1973. [Google Scholar] [CrossRef] [PubMed] [Green Version]
  72. Kumar, S.; Stecher, G.; Li, M.; Knyaz, C.; Tamura, K. MEGA X: Molecular Evolutionary Genetics Analysis across Computing Platforms. Mol. Biol. Evol. 2018, 35, 1547–1549. [Google Scholar] [CrossRef] [PubMed]
  73. Gernhard, T. The conditioned reconstructed process. J. Theor. Biol. 2008, 253, 769–778. [Google Scholar] [CrossRef] [PubMed] [Green Version]
  74. Rambaut, A.; Drummond, A.J.; Xie, D.; Baele, G.; Suchard, M.A. Posterior summarization in Bayesian phylogenetics using Tracer 1.7. Syst. Biol. 2018, 67, 901–904. [Google Scholar] [CrossRef] [Green Version]
  75. Huson, D.H.; Scornavacca, C. Dendroscope 3: An interactive tool for rooted phylogenetic trees and networks. Syst. Biol. 2012, 61, 1061–1067. [Google Scholar] [CrossRef] [Green Version]
  76. Schoch, C.L.; Ciufo, S.; Domrachev, M.; Hotton, C.L.; Kannan, S.; Khovanskaya, R.; Leipe, D.; Mcveigh, R.; O’Neill, K.; Robbertse, B.; et al. NCBI Taxonomy: A comprehensive update on curation, resources and tools. Database 2020, 2020, baaa062. [Google Scholar] [CrossRef]
  77. Ratnasingham, S.; Hebert, P.D.N. A DNA-based registry for all animal species: The barcode index number (BIN) system. PLoS ONE 2013, 8, e66213. [Google Scholar] [CrossRef] [Green Version]
  78. Puillandre, N.; Brouillet, S.; Achaz, G. ASAP: Assemble species by automatic partitioning. Mol. Ecol. Resour. 2021, 21, 609–620. [Google Scholar] [CrossRef]
  79. Collins, R.A.; Boykin, L.M.; Cruickshank, R.H.; Armstrong, K.F. Barcoding’s next top model: An evaluation of nucleotide substitution models for specimen identification. Methods Ecol. Evol. 2012, 3, 457–465. [Google Scholar] [CrossRef]
  80. Brown, S.D.J.; Collins, R.A.; Boyer, S.; Lefort, M.-C.; Malumbres-Olarte, J.; Vink, C.J.; Cruickshank, R.H. Spider: An R package for the analysis of species identity and evolution, with particular reference to DNA barcoding. Mol. Ecol. Resour. 2012, 12, 562–565. [Google Scholar] [CrossRef]
  81. Rangel-Medrano, J.D.; Ortega-Lara, A.; Marquez, E.J. Ancient genetic divergence in bumblebee catfish of the genus Pseudopimelodus (Pseudopimelodidae: Siluriformes) from northwestern South America. PeerJ 2020, 8, e9028. [Google Scholar] [CrossRef] [PubMed]
  82. Microsoft R. Core Team. Microsoft R Open Application Network; Microsoft Corporsation: Redmond, WA, USA, 2021. [Google Scholar]
  83. Ota, R.P.; Machado, V.N.; Andrade, M.C.; Collins, R.A.; Farias, I.P.; Hrbek, T. Integrative taxonomy reveals a new species of pacu (Characiformes: Serrasalmidae: Myloplus) from the Brazilian Amazon. Neotrop. Ichthyol. 2020, 18. [Google Scholar] [CrossRef]
  84. Fujisawa, T.; Barraclough, T.G. Delimiting species using single-locus data and the Generalized Mixed Yule Coalescent approach: A revised method and evaluation on simulated data sets. Syst. Biol. 2013, 62, 707–724. [Google Scholar] [CrossRef] [PubMed] [Green Version]
  85. Kapli, P.; Lutteropp, S.; Zhang, J.; Kobert, K.; Pavlidis, P.; Stamatakis, A.; Flouri, T. Multi-rate Poisson tree processes for single-locus species delimitation under maximum likelihood and Markov chain Monte Carlo. Bioinformatics 2017, 33, 1630–1638. [Google Scholar] [CrossRef] [Green Version]
  86. Foster, E.D.; Deardorff, A. Open Science Framework (OSF). J. Med. Libr. Assoc. 2017, 105, 203–206. [Google Scholar] [CrossRef] [Green Version]
  87. Walker, S.P.; Barrett, M.; Hogan, G.; Flores Bueso, Y.; Claesson, M.J.; Tangney, M. Non-specific amplification of human DNA is a major challenge for 16S rRNA gene sequence analysis. Sci. Rep. 2020, 10, 16356. [Google Scholar] [CrossRef]
  88. Wise, C.A.; Sraml, M.; Rubinsztein, D.C.; Easteal, S. Comparative nuclear and mitochondrial genome diversity in humans and chimpanzees. Mol. Biol. Evol. 1997, 14, 707–716. [Google Scholar] [CrossRef] [Green Version]
  89. Chang, J.J.M.; Ip, Y.C.A.; Ng, C.S.L.; Huang, D. Takeaways from Mobile DNA Barcoding with BentoLab and MinION. Genes 2020, 11, 1121. [Google Scholar] [CrossRef]
  90. Longo, M.S.; O’Neill, M.J.; O’Neill, R.J. Abundant human DNA contamination identified in non-primate genome databases. PLoS ONE 2011, 6, e16410. [Google Scholar] [CrossRef] [Green Version]
  91. Ciufo, S.; Kannan, S.; Sharma, S.; Badretdin, A.; Clark, K.; Turner, S.; Brover, S.; Schoch, C.L.; Kimchi, A.; DiCuccio, M. Using average nucleotide identity to improve taxonomic assignments in prokaryotic genomes at the NCBI. Int. J. Syst. Evol. Microbiol. 2018, 68, 2386–2392. [Google Scholar] [CrossRef]
  92. Palandacic, A.; Naseka, A.; Ramler, D.; Ahnelt, H. Contrasting morphology with molecular data: An approach to revision of species complexes based on the example of European Phoxinus (Cyprinidae). BMC Evol. Biol. 2017, 17, 184. [Google Scholar] [CrossRef] [PubMed] [Green Version]
  93. Andujar, C.; Arribas, P.; Yu, D.W.; Vogler, A.P.; Emerson, B.C. Why the COI barcode should be the community DNA metabarcode for the metazoa. Mol. Ecol. 2018, 27, 3968–3975. [Google Scholar] [CrossRef]
  94. Piper, A.M.; Batovska, J.; Cogan, N.O.I.; Weiss, J.; Cunningham, J.P.; Rodoni, B.C.; Blacket, M.J. Prospects and challenges of implementing DNA metabarcoding for high-throughput insect surveillance. Gigascience 2019, 8, giz092. [Google Scholar] [CrossRef] [PubMed]
  95. Clark, K.; Karsch-Mizrachi, I.; Lipman, D.J.; Ostell, J.; Sayers, E.W. GenBank. Nucleic Acids Res. 2016, 44, D67–D72. [Google Scholar] [CrossRef] [PubMed] [Green Version]
  96. Ratnasingham, S.; Hebert, P.D.N. BOLD: The Barcode of Life Data System (http://www.barcodinglife.org). Mol. Ecol. Notes 2007, 7, 355–364. Available online: http://www.barcodinglife.org (accessed on 15 December 2021). [CrossRef] [Green Version]
  97. Christopherson, C.; Sninsky, J.; Kwok, S. The effects of internal primer-template mismatches on RT-PCR: HIV-1 model studies. Nucleic Acids Res. 1997, 25, 654–658. [Google Scholar] [CrossRef] [Green Version]
  98. Miya, M.; Gotoh, R.O.; Sado, T. MiFish metabarcoding: A high-throughput approach for simultaneous detection of multiple fish species from environmental DNA and other samples. Fish. Sci. 2020, 86, 939–970. [Google Scholar] [CrossRef]
  99. Garibian, P.G.; Karabanov, D.P.; Neretina, A.N.; Taylor, D.J.; Kotov, A.A. Bosminopsis deitersi (Crustacea: Cladocera) as an ancient species group: A revision. PeerJ 2021, 9, e11310. [Google Scholar] [CrossRef]
  100. Betancur-R, R.; Wiley, E.O.; Arratia, G.; Acero, A.; Bailly, N.; Miya, M.; Lecointre, G.; Ortí, G. Phylogenetic classification of bony fishes. BMC Evol. Biol. 2017, 17, 162. [Google Scholar] [CrossRef] [Green Version]
  101. Mohanty, A.; Swain, S.; Kar, S.K.; Hazra, R.K. Analysis of the phylogenetic relationship of Anopheles species, subgenus Cellia (Diptera: Culicidae) and using it to define the relationship of morphologically similar species. Infect. Genet. Evol. 2009, 9, 1204–1224. [Google Scholar] [CrossRef]
  102. Bergsten, J. A review of long-branch attraction. Cladistics 2005, 21, 163–193. [Google Scholar] [CrossRef] [PubMed]
  103. Wright, J.J.; David, S.R.; Near, T.J. Gene trees, species trees, and morphology converge on a similar phylogeny of living gars (Actinopterygii: Holostei: Lepisosteidae), an ancient clade of ray-finned fishes. Mol. Phylogenet. Evol. 2012, 63, 848–856. [Google Scholar] [CrossRef] [PubMed]
  104. Carstens, B.C.; Pelletier, T.A.; Reid, N.M.; Satler, J.D. How to fail at species delimitation. Mol. Ecol. 2013, 22, 4369–4383. [Google Scholar] [CrossRef] [PubMed]
  105. Luo, A.; Ho, S.Y.W. The molecular clock and evolutionary timescales. Biochem. Soc. Trans. 2018, 46, 1183–1190. [Google Scholar] [CrossRef] [PubMed]
  106. Kotov, A.A.; Garibian, P.G.; Bekker, E.I.; Taylor, D.J.; Karabanov, D.P. A new species group from the Daphnia curvirostris species complex (Cladocera: Anomopoda) from the eastern Palaearctic: Taxonomy, phylogeny and phylogeography. Zool. J. Linn. Soc. 2021, 191, 772–822. [Google Scholar] [CrossRef]
  107. Luzhnyak, V.A. Materials on the ichthyofauna of the Middle Don basin. J. Ichthyol. 2010, 50, 750–756. [Google Scholar] [CrossRef]
  108. Karabanov, D.P.; Kodukhova, Y.V.; Kutsokon, Y.K. Expansion of stone moroko Pseudorasbora parva (Cypriniformes, Cyprinidae) into Eurasian reservoirs. Vestn. Zool. 2010, 44, 115–124. [Google Scholar]
  109. Karabanov, D.P.; Kodukhova, Y.V.; Slyn’ko, Y.V. New finds of topmouth gudgeon Pseudorasbora parva (Temm. et Schl., 1846) in the European part of Russia. Russ. J. Biol. Invasions 2010, 1, 156–158. [Google Scholar] [CrossRef]
  110. Karabanov, D.P.; Kodukhova, Y.V.; Pashkov, A.N.; Reshetnikov, A.N.; Makhrov, A.A. “Journey to the West”: Three phylogenetic lineages contributed to the invasion of Stone Moroko, Pseudorasbora parva (Actinopterygii: Cyprinidae). Russ. J. Biol. Invasions 2021, 12, 67–78. [Google Scholar] [CrossRef]
  111. Hirsch, P.E.; N’Guyen, A.; Adrian-Kalchhauser, I.; Burkhardt-Holm, P. What do we really know about the impacts of one of the 100 worst invaders in Europe? A reality check. Ambio 2016, 45, 267–279. [Google Scholar] [CrossRef] [Green Version]
  112. Medvedev, D.A.; Sorokin, P.A.; Vasil’ev, V.P.; Chernova, N.V.; Vasil’eva, E.D. Reconstruction of phylogenetic relations of Ponto-Caspian gobies (Gobiidae, Perciformes) based on mitochondrial genome variation and some problems of their taxonomy. J. Ichthyol. 2013, 53, 702–712. [Google Scholar] [CrossRef]
  113. Freyhof, J. Diversity and distribution of freshwater Gobies from the Mediterranean, the Black and Caspian Seas. In The Biology of Gobies; Patzner, R., Van Tassell, J.L., Kovacic, M., Kapoor, B.G., Eds.; CRC Press: Boca Raton, FL, USA, 2011; pp. 279–288. ISBN 9780429062872. [Google Scholar]
  114. Kodukhova, Y.V.; Karabanov, D.P. Finding of Longtail Dwarf Goby Knipowitschia longecaudata (Actinopterygii: Gobiidae) in the upper part of unregulated section of the Volga River. Inland Water Biol. 2021, 14, 620–625. [Google Scholar] [CrossRef]
  115. Kodukhova, Y.V.; Borovikova, E.A.; Karabanov, D.P. First record of stellate tadpole goby Benthophilus stellatus (Sauvage, 1874) (Actinopterygii: Gobiidae) in the Rybinsk Reservoir. Inland Water Biol. 2016, 9, 428–430. [Google Scholar] [CrossRef]
  116. Slynko, Y.V.; Borovikova, E.A.; Gurovskii, A.N. Phylogeography and origin of freshwater populations of tubenose gobies of genus Proterorhinus (Gobiidae: Pisces) in Ponto-Caspian Basin. Russ. J. Genet. 2013, 49, 1144–1154. [Google Scholar] [CrossRef]
  117. Neilson, M.E.; Stepien, C.A. Evolution and phylogeography of the tubenose goby genus Proterorhinus (Gobiidae: Teleostei): Evidence for new cryptic species. Biol. J. Linn. Soc. 2009, 96, 664–684. [Google Scholar] [CrossRef] [Green Version]
  118. Reshetnikov, A.N. The current range of Amur sleeper Perccottus glenii Dybowski, 1877 (Odontobutidae, Pisces) in Eurasia. Russ. J. Biol. Invasions 2010, 1, 119–126. [Google Scholar] [CrossRef]
  119. Kiryukhina, N.A. Molecular and genetic variability in populations of Syngnathus nigrolineatus Eichwald 1831 and ways of expansion in the Volga River basins on the basis of mitochondrial DNA sequence analysis. Russ. J. Biol. Invasions 2013, 4, 249–254. [Google Scholar] [CrossRef]
  120. Borovikova, E.A.; Artamonova, V.S. Vendace (Coregonus albula) and least cisco (Coregonus sardinella) are a single species: Evidence from revised data on mitochondrial and nuclear DNA polymorphism. Hydrobiologia 2021, 848, 4241–4262. [Google Scholar] [CrossRef]
Figure 1. Sampling sites in the Volga-Kama basin (red circles, the basin boundaries are marked by a brown line) and some other river basins (pink circles).
Water 14 00437 g001
Figure 2. BI tree for mitochondrial COI locus (“long” products of MifCOI primers set). Gray columns indicate probable mOTUs. Node supports are posterior probabilities indicated as coloration, SH-aLRT test, and UFboot2 as a percentage.
Water 14 00437 g002
Figure 3. BI tree for mitochondrial 16S locus. Gray columns indicate probable mOTUs. Node supports are posterior probabilities indicated as coloration, SH-aLRT test, and UFboot2 as a percentage.
Water 14 00437 g003
Figure 4. BI tree for nuclear 18S locus. Gray columns indicate probable mOTUs. Node supports are posterior probabilities indicated as coloration, SH-aLRT test, and UFboot2 as a percent.
Water 14 00437 g004
Figure 5. The approximate success of using various genetic loci for the DNA identification of alien species of freshwater fish. The degree of efficiency is proportional to the gradient of the fill.
Water 14 00437 g005
Table 1. Genes, primers, and annealing temperatures used in this study. M13 tails for sequencing are highlighted by lower case type.
GenePrimerSequence 5′-3′Annealing
Temperature (°C)
Full Amplicon
Length (Kb)
COI
(long)
MifCOI-Ftgt aaa acg acg gcc agt tCA CAA AGA VAT TGG YAC CCT ITA520.7
MifCOI-Rcag gaa aca gct atg acta CIG GGT GIC CRA ARA AYC ARA AIA
COI
(short)
ifCOImb-FGGD ACH GGN TGA ACD GTH TAY CCB CC560.4
ifCOImb-RTGD CCA AAR AAY CAG AAB ARG TGA TG
16Sif16SaCTG CCC TGT GAC CAA AAG TT520.6
if16SbGGT CCT TTC GTA CTA GGA AG
18Sif18S1TAA CAT ATG CTT GTC TCA AAG500.5
if18S2CCT GTA TTG TTA TTT TTC GTC AC
M13sM13seq-Ftgt aaa acg acg gcc agt t55Seq.
M13seq-Rcag gaa aca gct atg act a
Table 2. Models of nucleotide substitutions.
LocusPositionBest Model (BIC)
1stTIM3e {0.1698, 2.1566, 12.5089} + FQ + G4 {0.1709}
COI2ndF81 + F
3rdTIM3 {0.7556, 9.7639, 4.9699} + F {0.2885, 0.3166, 0.1141, 0.2805} + R3 {0.0078, 0.0093, 0.6312, 0.5571, 0.3608, 1.7961}
16S TPM2 {3.2961, 8.5094} + F {0.2888, 0.2442, 0.2371, 0.2298} + G4 {0.2244}
18S TIM2e {0.4296, 0.2174, 3.6492} + FQ + G4 {0.1817}
Base substitution rates: F81–Felsenstein’s model [67], variable base frequencies, all substitutions equally likely; TIM2e—transition model with equal base frequencies and AC = AT, CG = GT; TIM3—transition model with unequal base frequencies and AC = CG, AT = GT; TIM3e—transition model with equal base frequencies and AC = CG, AT = GT; TPM2—three-parameter model with equal base frequencies and AC = AT, AG = CT, CG = GT. Base frequencies: +F-empirical base frequencies; +FQ-equal base frequencies. Rate heterogeneity across sites: +G4-discrete Gamma model [68] with four categories; +R-FreeRate model [69] that generalizes the +G model by relaxing the assumption of Gamma-distributed rates. Non-standard model parameters are indicated in {}.
Table 3. Amplification and sequencing success with all studied primers sets.
Primers SetPercentage of PCR and Sequencings Success
LCO\HCO [8]78
Fish-1 [12]84
Fish-2 [12]78
COI-1 [13]87
MifCOI91
ifCOImb98
if16S98
if18S97
Table 4. Metrics of genetic diversity from mitochondrial and nuclear loci in the studied NIS fish.
Loci/OrdersNnsG + CSEtahHdPikFsD
COI (mitochondrial)
Clupeiformes556690.486173206360.970.08758.21.811.04
Cypriniformes176690.451172220160.990.07953.2−0.63−0.78
Gobiiformes496690.478233342240.940.12986.715.90.47
Osmeriformes46690.4868830.830.0064.001.16−0.82
Perciformes16690.461001-0---
Salmoniformes56690.4954430.700.0031.800.46−0.41
Syngnathiformes156690.476212190.840.0085.10−1.04−0.86
COI (total)1466690.478277515920.980.177118.81.210.92
16S (mitochondrial)
Clupeiformes395770.5027082120.730.02816.226.93−0.59
Cypriniformes195760.4503233110.780.0169.430.21−0.01
Gobiiformes195810.486121154110.930.07039.786.40−0.40
16S (total)775810.483176261320.910.11966.2414.80.85
18S (nuclear)
Clupeiformes434580.559151670.700.0104.703.750.86
Cypriniformes74860.573111140.710.0125.812.071.58
Gobiiformes274450.546111270.630.0041.80−0.95−1.41
Osmeriformes44630.555001-0---
Perciformes14420.545001-0---
Salmoniformes44410.5402230.830.0021.00−0.88−0.71
Syngnathiformes54170.5811120.600.0010.600.621.22
18S (total)914860.5465159190.870.04115.606.801.11
N—number of sequences; ns—total number of sites (excluding sites with gaps or missing data); G + C—guanine and cytosine content; S—number of segregating (polymorphic) sites; Eta—total number of mutations; h—number of haplotypes; Hd—haplotype (gene) diversity; Pi—nucleotide diversity per site; k—average number of nucleotide differences; Fs—Fu’s neutrality statistic [56]; D—Tajima D neutrality test [57], all values are not statistically significant p < 0.05.
Publisher’s Note: MDPI stays neutral with regard to jurisdictional claims in published maps and institutional affiliations.

