Abstract
The Juksan weir, installed in the Yeongsan river in South Korea from 2010 to 2012, has secured sustainable water resources and helped control flooding. However, low river flow velocities due to the weir have deteriorated the quality of the river water. For natural river restoration, the water gate was opened in 2017. In this study, the three-dimensional finite difference model Visual MODFLOW was used to analyze the effects of gate opening on stream–aquifer interactions. A conceptual model was developed to simulate the stream–aquifer dynamics caused by the operation of the water gate at the Juksan weir. Groundwater data were also analyzed to determine the impacts of weir operations on groundwater quality. Our results indicate that a lower river level due to the weir opening changed the groundwater flow, which then affected the water balance. The change in groundwater flow increased the variability of the groundwater quality which had homogenized because of induced recharge after the construction of the weir. This could affect groundwater use in agricultural areas near the weir. Therefore, further groundwater monitoring and hydrodynamic analyses are required to anticipate and address any potential issues.
1. Introduction
As part of the Four Major Rivers Restoration Project, 16 weirs were constructed on four major rivers in South Korea from 2010 to 2012, which helped to meet water demands during the dry season and control flooding. Many studies have shown that hydraulic structures such as weirs and dams are useful for replenishing groundwater resources [1,2]. Water filling at the weir caused an increase in the groundwater level during the dry season [3], while river level management at the Changnyong-Hamman weir in the Nakdong River resulted in a decline in the average groundwater level during the wet season [4].
Low river flow velocities due to a weir can lead to deterioration in river water quality and changes in sediment deposition [5]. Weir construction affects the aquatic environment [6], which changes the algal occurrence characteristics [7,8]. After a weir is constructed, algal blooms can develop due to decreased turbidity, although the nutrient concentrations are reduced [9,10]. In addition, sediment is deposited in the riverbed upstream of the weir [11], which has produced increases in the flood stages of the Geum River [12]. The sediment structure and characteristics can change the conductance between the riverbed and the aquifer, which also affects the quality of the groundwater and river water [13].
In 2017, the water gates of 9 weirs on the Geum, Yeongsan, and Nakdong Rivers were opened on a trial basis for natural river restoration. Changes in water quality and the aquatic ecosystems were monitored to analyze the impacts of the weir opening. After the weir was opened, the flow velocities in the rivers increased, which had a positive impact on the river and its ecosystem, such as reduction of green algae and improvement of water quality. However, a lowered river level due to the weir opening has caused groundwater depletion and influenced the crop production in the nearby cultivation areas.
The variations in the river water level change the groundwater flow in riparian areas, leading to changes in the water balance [14]. This could also affect stream–aquifer interactions [15]. In addition, weir-induced hydrodynamics can significantly influence the water quality and aquatic ecosystems [3,16], thereby affecting groundwater use in agricultural areas near the weirs. For example, the groundwater can be degraded due to contaminated river water, while saline groundwater can be diluted by induced river water [17,18]. The decrease in groundwater temperature could also led to crop cold damage in water-curtain greenhouses [19]. Therefore, evaluating the impacts of weir operation on the groundwater system is required, while groundwater modeling can be used to predict the response of the aquifer system to the variations in the river level [20,21]. However, a few studies have investigated the effect of weir operation on groundwater. A numerical model showed that the groundwater discharge rates increased about 1.9 times following the Baekje weir opening [22], and the other model indicated that river level change accounted for approximately 50–90% of groundwater decline during the weir opening period [23].
In this study, we evaluate the effects of the opening of the Juksan weir on stream–aquifer interactions in the Yeongsan River, South Korea. The groundwater flow and storage caused by the weir opening was investigated using Visual MODFLOW Classic (Waterloo Hydrogeologic Inc., Waterloo, ON, Canada), a three-dimensional finite difference model [24]. Groundwater and river water data were used to analyze the relation between the transmissivity of the aquifer and the groundwater level response rate following a change in the river level. In addition, changes in groundwater quality were analyzed to evaluate the effects of the water gate operation at the weir on hydrochemical properties using groundwater data.
2. Materials and Methods
2.1. Study Area and Hydrogeological Setting
The study area is a 6.4 km2 alluvial aquifer, located on the left bank of the Yeongsan River near the Juksan weir, South Korea (34°57′33″–34°58′59″ N, 126°36′50″–126°39′23″ E) (Figure 1). The Yeongsan River flows in a meandering pattern from east to west in the northern part of the study area. The western part of the study area is characterized by hilly terrain, with an oxbow lake located in the center of the study area. The oxbow lake was created during a river straightening project (conducted in 1980) that cut off the left-bank meander [25]. The width of the Yeongsan River varies from 150 to 370 m, and the width of the oxbow lake varies from 100 to 220 m. Juksan weir is located near the downstream confluence of the oxbow lake. A hydroelectric power plant was installed at the upstream confluence of the oxbow lake during the construction of the Juksan weir in 2012. The oxbow lake drains into the Yeongsan River via the downstream confluence. The bedrock in this region consists predominantly of biotite granites. Quaternary alluvium that was deposited in a fluvial environment unconformably overlies the bedrock and is distributed along the Yeongsan River and the oxbow lake. The alluvium is composed of clay, sand, and gravel characterized by fining-upward sequences. It is therefore a confined aquifer. The surface elevation in the study area ranges from 3.3 m to 4.9 m.
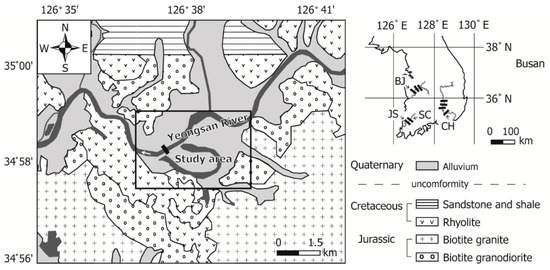
Figure 1.
Location and geological map of the study area near the Juksan weir (JS) in the Yeongsan River Basin, South Korea (modified from [26]).
Figure 2a shows the locations of groundwater monitoring wells in the study area. Groundwater data obtained from 17 monitoring wells were used to analyze the effect of the weir opening on groundwater levels and quality. The monitoring wells are installed in the alluvium. The river monitoring wells and stream–groundwater quality monitoring wells were installed in 2012 and 2016, respectively, to monitor groundwater variations caused by the construction of the weir.
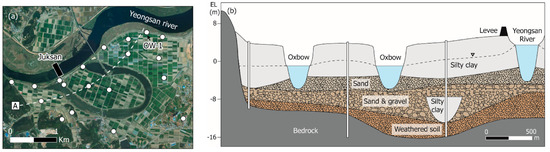
Figure 2.
(a) Locations of the monitoring wells and (b) sedimentary units in the alluvial deposits along transect A.
Figure 2b shows the sedimentary structures in the alluvial deposits along transect A with the groundwater level observed in May 2018. Columnar sections at three monitoring well sites were used to analyze the distribution of the sedimentary layers. The alluvial deposits are characterized by fining-upward sequences. The upper and middle alluvial materials consist of silty clays and sand with thicknesses of 6.7 and 2.6 m, respectively. The lower 4.8 m are composed of sand, gravel, and weathered soil. A permeable layer is located in the lower alluvium, where groundwater actively interacts with river water.
Figure 3 shows the groundwater use in the study area. The study area is characterized by agricultural fields that cultivate barley and rice. Barley and rice are cultivated during the summer and are irrigated with water from the river, not groundwater. Groundwater is mostly used for domestic and agricultural purposes in the bedrock of the hinterland. The groundwater pumping rates for each well vary from 140 to 36,500 m3/year for domestic and from 180 to 24,300 m3/year for agriculture purposes.
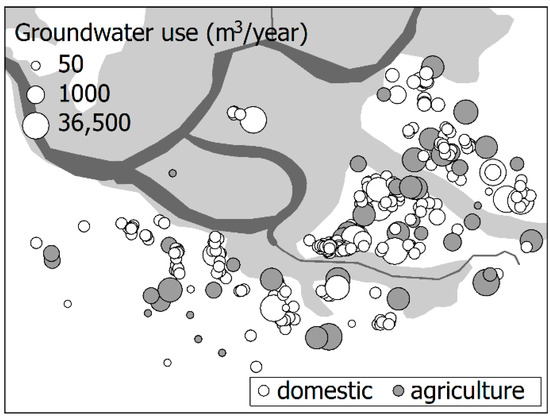
Figure 3.
Groundwater use in the study area.
Water levels vary with precipitation and water gate operation at the weir. Figure 4 shows variations in water level observed at site OW-1 with the corresponding river levels recorded upstream of the Juksan weir. An action took place to recover the river stage to the original level by opening the weir in 2017. The river level decreased from 3.5 m to 2.5 m in June 2017 and decreased further to 1.5 m in November 2017. These decreases were due to water gate operations at Juksan weir for natural restoration of the Yeongsan River, which also decreased the local groundwater levels. The groundwater levels were lower than the river levels during the period when the river level was maintained due to the management of the Juksan weir. Groundwater induced from the river discharges into the oxbow lake in the area upstream of the Juksan weir.
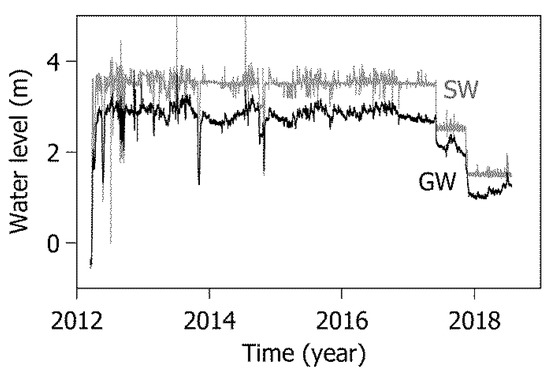
Figure 4.
Time series of groundwater level from OW-1 with the corresponding river levels upstream of the Juksan weir.
2.2. Model Development
Visual MODFLOW was used to simulate groundwater flow in the alluvial stream–aquifer system during water gate operation of the Juksan weir. The partial differential equation that describes the groundwater flow can be solved analytically by employing advanced techniques. For example, Strack [27] has suggested the analytic element method, in which analytical solutions of simple conditions and stresses are superimposed to obtain solutions for complex case studies. Contrary to the numerical methods, analytical solutions have the advantage that they do not require discretization of the volume or area. Inevitably, post-processing is required to obtain the water balance. On the other hand, the calculation of the water balance of the discretization cells is intrinsic to the numerical methods. Depending on the discretization type, the numerical methods can be classified into finite element [28], finite difference [29], and finite volume [30]. In this study, we have used MODFLOW, a finite difference model [31], because we want to study the water balance of the aquifer and because of the simplicity of this method.
Figure 5 shows the model domain with the selected boundary conditions. We used 430 columns and 300 rows, with grid dimensions of 10 m by 10 m. The aquifer was vertically divided into three layers to reflect the heterogeneity of the fluvial-alluvial deposits [32,33,34]. The upper layer consisted of silty clay, the middle layer consisted of sand, and the lower layer was composed of gravel and weathered soil. Average surface elevations were used for each layer and the groundwater surface elevation was 5 m. The average thicknesses of the upper, middle, and lower layers of the aquifer were 7 m, 4 m, and 5 m, respectively. Each layer was assumed to be isotropic and homogeneous.
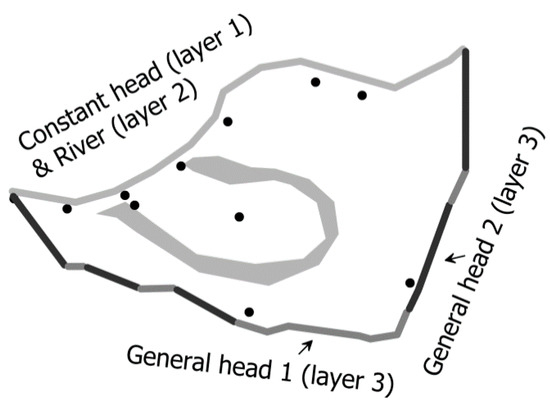
Figure 5.
Conceptual model showing boundary conditions and locations of 11 the monitoring wells.
The Yeongsan River and the oxbow lake were represented by a Constant Head Boundary package (Dirichlet condition) in the upper layer and a River package (Cauchy conditions) in the middle layer. The constant head boundary assumes the boundary with a specified head. In the river boundary, flow across the boundary is directly proportional to the head difference between the river level and groundwater level until the groundwater level is lower than the riverbed [35], after which a certain amount of flow occurs. The river level upstream of the weir was set to 3.5 m (the management level of the Juksan weir), while the river level downstream of the weir and the oxbow lake were set to −1 m. The alluvium and bedrock in the hinterland were implemented as a General Head Boundary package (Cauchy conditions) in the lower layer. The general head boundary behaves as Cauchy boundary type, and the difference with the river boundary is that the flow is infinitely increased without being limited by the groundwater level. The water level in the hinterland and the conductance of the river boundary and general head boundary conditions were then calibrated (discussed in the following section). A groundwater recharge rate of 165 mm/year was applied to the top layer of the model, which was calculated from the annual precipitation (1193 mm) and the recharge factor (0.14) in the study area [36].
The hydraulic conductivities of the upper and middle layers were assumed to be 0.001 m/day and 5 m/day, respectively. The hydraulic conductivity of the lower layer was 55 m/day, which was estimated from pumping and recovery test data and the thickness of the layer [37]. Groundwater actively interacts with river water through the lower layer of the aquifer in the study area. The average hydraulic conductivity of granite (0.4 m/day) was used for the bedrock conductivity in the study area [36]. Groundwater pumping was not considered in the model because groundwater use in the study area is negligible (Figure 3) and did not affect the model calibration due to the high hydraulic conductivity. The effect of groundwater use in the hinterland was reflected by calibrating the water level of the general head boundary condition.
2.3. Model Calibration
The steady state model was calibrated using trial and error, whereby we adjusted the model parameters until the fit between the model output and the observations was acceptable. The developed model was calibrated by changing the conductance of the river, the general head boundary conditions, and the water level of the general head boundary condition. Model calibration was achieved by matching the calculated heads with groundwater data obtained from 11 monitoring wells while the management level of the Juksan weir was 3.5 m. The average groundwater level in 2016 was also used for model calibration.
Several trial and error simulations indicated that an acceptable fit was obtained between the observed and simulated heads when the conductance values were 300 m2/day for the river, and 8 m2/day and 2 m2/day for the alluvium and bedrock in the hinterland, respectively. Sensitivity analyses indicated that the normalized root mean square error (NRMSE) decreased and became constant by increasing the conductance of the river boundary condition above 100 m2/day (Figure 6a). This illustrates that the oxbow lake is well-connected to the alluvium, unlike normal oxbow lakes in which low-permeability sediments are deposited due to the absence of river flow. We presumed that there was no settling of fine suspended sediments, since the oxbow lake water flows from drainage channels in the hinterland that drain into the Yeongsan River downstream of the oxbow lake. In addition, the water flow caused by the operation of the hydroelectric power plant allows the riverbed to be eroded.
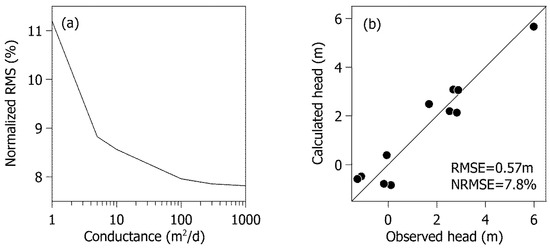
Figure 6.
(a) Sensitivity analysis results of the conductance for river boundary condition and (b) comparison of calculated and observed groundwater levels in monitoring wells.
The agreement obtained between the calculated and measured heads after calibration is shown in Figure 6b. The root mean square error (RMSE) and the NRMSE between the observed and calculated heads were 0.57 m and 7.8%, respectively. This indicates an acceptable agreement between the calibrated model and the monitoring data [38].
3. Results and Discussion
3.1. Analysis of Groundwater Level Decline
The stream–aquifer interactions are controlled by the hydrogeologic environment, including the geologic characteristics of the aquifer [39]. Groundwater and river water data were used to analyze the impacts of the transmissivity on the groundwater level reaction rate following a change in the river level. The groundwater and river water data were obtained from the Juksan (JS) and Seungchon (SC) weirs in the Yeongsan River, the Beakje (BJ) weir in the Geum River, and the Changnyeong-Haman (CH) weir in the Nakdong River (Figure 1).
Figure 7 shows the groundwater level response rate following a change in the river level due to the opening of the four weirs. The response rate () was calculated as follows:
where and are calculated slopes of observed decline of water level change with time in groundwater and river water, respectively. The response rate increased with increasing transmissivity, which means that the transmissivity of the aquifer is an important factor for determining the response rate. The groundwater level near the Changnyeong Haman weir decreased immediately following a decrease in the river level due to a high transmissivity. In contrast, the groundwater level response rate near the Seungchon weir was low because of a low transmissivity.
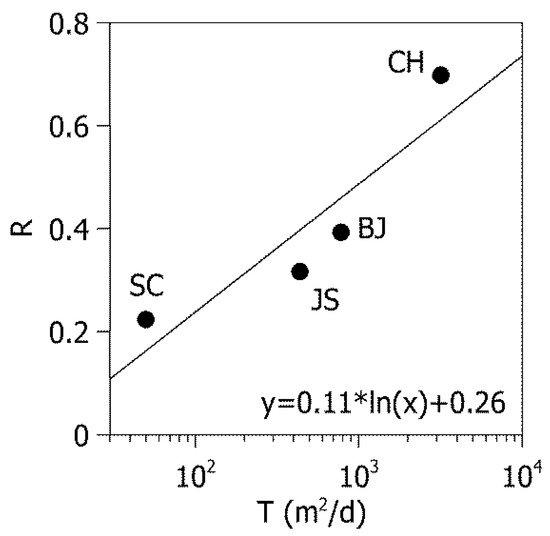
Figure 7.
Relation between the transmissivity (T) of the aquifer and the groundwater level response rate (R) following a change in the river level.
3.2. Impacts of Water Gate Operation on Stream–Aquifer Interaction
The groundwater level of the alluvial deposit responds rapidly to the fluctuations of the river level, indicating that groundwater and river water are directly interrelated through the riverbed [40]. The model results show that the groundwater level is still lower than the river level in the area upstream of the weir after the weir was opened, which indicates a losing stream (Figure 8a,b). The groundwater induced recharge from the Yeongsan River discharged into the oxbow lake. The groundwater level decreased further in riparian areas upstream of the weir due to the weir opening, and the groundwater level decreased with increasing distance from the river (Figure 8c). This effect was especially apparent in the area upstream of the weir, except for the area inside the oxbow lake, which was the most affected.
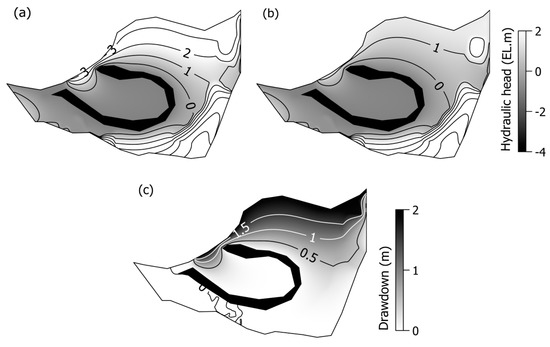
Figure 8.
Changes in groundwater level due to water gate operation of Juksan weir (a) when the river level was 3.5 m and (b) 1.5 m, and (c) the drawdown.
Table 1 lists the water balance computed by the Visual MODFLOW simulation. The induced recharge from the Yeongsan River upstream of the weir is the major groundwater source and decreased by 47%, from 13,000 m3/day to 6900 m3/day, following the opening of the weir. Groundwater discharge also decreased by 23%, from 13,000 m3/day to 10,000 m3/day, in the oxbow lake and by 35%, from 6800 m3/day to 4400 m3/day, in the river downstream of the weir. These results indicated that the decline in river level changed the stream–aquifer interaction, affecting the water balance [41]. The decline in groundwater level in alluvium could also reduce the groundwater storage in the hinterland, and as a result, groundwater pumping rates could be affected with declined groundwater level [42,43].

Table 1.
Water balance in the study area (m3/day).
3.3. Changes in Groundwater Quality
Changes in groundwater flow can affect the groundwater quality [44]. The chemical characteristics of the river water and groundwater were analyzed to determine how their compositions changed using groundwater data collected from 15 monitoring wells [45]. Figure 9 describes the spatial distributions of river water and groundwater quality before (December 2016) and after (November 2017) the weir opening. The river showed Na-HCO3 as the dominant water type according to the classification of Piper [46]. In contrast, groundwater showed various water types: Na-Cl, Ca-HCO3, and Na-HCO3 types. However, in the area upstream of the weir (except inside the oxbow lake), the groundwater quality was homogenized because large volumes of river water flowed into the aquifer following the weir construction in 2012 (Figure 9a). The groundwater quality was the Na-HCO3 type in this area, which is similar to the river water. After the decrease in induced recharge due to the opening of the weir, the groundwater quality in the area upstream of the weir changed, exhibiting various types (Ca-HCO3, Ca-Cl, and Na-Cl) (Figure 9b). On the other hand, there were various types of groundwater quality inside the oxbow lake where the groundwater level was not affected by the weir operation, which was expected to be affected by the geochemical environments and land use [47].
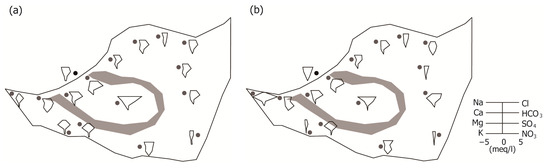
Figure 9.
Stiff diagram plot showing chemical characteristics of river water (black dot) and groundwater (gray dots) (a) when the river level was 3.5 m (December 2016) and (b) 1.5 m (November 2017).
The electrical conductivity (EC) of groundwater in the area upstream of the weir ranged from 170 to 328 μS/cm, whereas the EC inside the oxbow lake ranged from 386 to 728 μS/cm in December 2016. After the weir opening, the EC in the area upstream of the weir increased by 60 μS/cm on average in November 2017.
An interesting feature was observed in the groundwater quality after the weir opening. Figure 10 shows the interquartile ranges (IQR) of the groundwater ions in the upstream area where the groundwater quality was affected by the opening of the weir (Figure 9b). The IQR in the upstream area is smaller than that of the other areas. This means that the variability of the groundwater quality decreased due to the river water induced recharge after the weir was constructed in 2012. After the weir was opened in June 2017, the IQR increased because the variability of the groundwater quality increased due to a decrease in the induced recharge, especially for Ca, Cl, and HCO3 ions. However, no significant changes in variational ranges were indicated in the wells outside of the influence zone.
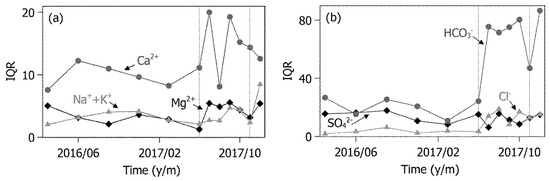
Figure 10.
Variations in the interquartile ranges (IQR) of (a) major cations and (b) anions in groundwater in the area upstream of the Juksan weir, except within the oxbow lake.
It is likely that the drastic increases in ranges of chemical variation after the weir opening are associated with the groundwater velocity change. At the higher water velocity, water chemistry can be more homogenized because dispersion of solutes can be enhanced. It is well known that the dispersion coefficient is proportional to the average linear velocity of groundwater [48]. Before June of 2017, the water level difference between the upstream river stage and the oxbow lake was 4.5 m, and it decreased to 2.5 m after the weir opening.
Decrease of the hydraulic gradient caused decrease in groundwater velocity and dispersion. The groundwater velocity was expected to be decreased by about 40% after the weir opening. At the lower dispersion condition, it is likely that the groundwater should be more influenced by the locally varying geochemical and hydrogeological environments such as redox conditions, mineral and organic compositions, and infiltration. As a result, water chemistry can show spatially wider variation by the reduced groundwater velocity. The reduced variational ranges for SO4 found in Figure 10 (not shown in the figure, but also NO3) are likely to be associated with stronger redox conditions created by slower groundwater movement.
4. Conclusions
The Juksan weir installed on the Yeongsan river in South Korea has secured sufficient water resources, and the water gate was opened to improve the water quality and naturally restore the rivers in 2017. The impacts of the opening of the Juksan weir on stream–aquifer interactions were analyzed using numerical modeling and changes in groundwater quality were analyzed. The conclusions of this study can be summarized as follows:
The groundwater level decreased immediately following a decrease in the river level due to water management at the Juksan weir. In particular, the groundwater level decreased significantly in the areas upstream of the weir, except for the area inside the oxbow lake. As a result, the area upstream of the weir was the most affected and the induced groundwater recharge from the river decreased by 47%, while the hydrological conditions were unchanged.
Changes in groundwater flow due to the weir also had a large impact on groundwater quality. Before the weir was opened, the groundwater quality was homogenous because large volumes of river water recharged the aquifer. However, after the weir was opened, the decreased recharge increased the variations in groundwater quality. This change in groundwater quality due to the water gate operation of the weir could affect groundwater use in agricultural areas. Therefore, further monitoring of the groundwater and further hydrodynamic analyses are both required to anticipate and address any potential issues.
The results of this study can help to predict changes in the groundwater system induced by water gate operations at the weirs, thereby facilitating predictions of potential environmental issues. The results of this study can also help to determine effective integrated water management policies in the region.
Author Contributions
Conceptualization, M.-H.K. and H.L.; investigation, H.L. and M.-H.K.; data analysis, H.L. and J.L.; methodology, M.-H.K. and K.K.; writing—original draft, H.L.; writing—review and editing, H.L. and M.-H.K.; project administration, M.-H.K.; supervision, M.-H.K. All authors have read and agreed to the published version of the manuscript.
Funding
This work was supported by “Human Resources Program in Energy Technology” of the Korea Institute of Energy Technology Evaluation and Planning (KETEP), granted financial resource from the Ministry of Trade, Industry, and Energy, Republic of Korea. (No. 20194010201730). It was also supported by the Basic Research Project (21-3411) of the Korea Institute of Geoscience and Mineral Resources (KIGAM).
Institutional Review Board Statement
Not applicable.
Informed Consent Statement
Not applicable.
Data Availability Statement
The data in this study are available on request from the corresponding author.
Conflicts of Interest
The authors declare no conflict of interest.
References
- Jeong, S.J.; Koo, M.H. Analyzing the effect of a weir construction on the groundwater flow system. J. Soil Groundw. Environ. 2012, 17, 39–48. (In Korean) [Google Scholar] [CrossRef]
- Djuma, H.; Bruggeman, A.; Camera, C.; Eliades, M.; Kostarelos, K. The impact of a check dam on groundwater recharge and sedimentation in an ephemeral stream. Water 2017, 9, 813. [Google Scholar] [CrossRef]
- Lee, H.; Koo, M.H.; Kim, K.; Kim, Y. Spatio-temporal variations in stream-aquifer interactions following construction of weirs in Korea. Groundwater 2016, 54, 448–458. [Google Scholar] [CrossRef]
- Kim, G.B.; Cha, E.J.; Jeong, H.G.; Shin, K.H. Comparison of time series of alluvial groundwater levels before and after barrage construction on the lower Nakdong River. J. Eng. Geol. 2013, 23, 105–115. (In Korean) [Google Scholar] [CrossRef]
- Shin, S.E.; Youn, S.T.; Koh, Y.K.; Oh, K.H. The geochemical characteristics and environmental changes of surface sediments in Yeongsan River area. J. Korean Geomorphol. Assoc. 2015, 22, 31–42. (In Korean) [Google Scholar]
- Cho, H.K.; Lim, H.J.; Kim, S.M. Comparison of water quality before and after four major river project for water monitoring stations located near 8 weirs in Nakdong River. J. Agric. Life Sci. 2018, 52, 89–101. (In Korean) [Google Scholar] [CrossRef]
- Kim, Y.W.; Lee, J.H.; Park, T.J.; Byun, I.G. Variation of water environment and algae occurrence characteristics after weirs construction at Mulgeum site in downstream of the Nakdong River. J. Korean Soc. Hazard Mitig. 2017, 17, 383–392. (In Korean) [Google Scholar] [CrossRef]
- Oh, S.E.; Ahn, H.K.; Chae, S.K. The study on the prediction of algae occurrence by the multiple regression analysis after weir construction at Namhan River. J. Environ. Impact Assess. 2017, 26, 470–478. (In Korean) [Google Scholar]
- Shin, Y.; Yu, H.; Lee, H.; Lee, D.; Park, G. The change in patterns and conditions of algal blooms resulting from construction of weirs in the Youngsan River: Long-term data analysis. Korean J. Ecol. Environ. 2015, 48, 238–252. (In Korean) [Google Scholar] [CrossRef]
- Lee, S.M.; Kim, I.K. Analysis of correlation between cyanobacterial population and water quality factors in the middle and down stream region of nakdong river. J. Korean Soc. Water Wastewater 2017, 31, 93–101. (In Korean) [Google Scholar] [CrossRef]
- Ji, U.; Jang, E.K.; Kim, W. Long-term bed change analysis and equilibrium bed elevation prediction after weir construction in Nakdong River. J. Korea Acad. Ind. 2015, 16, 7089–7097. (In Korean) [Google Scholar]
- Jeong, A.; Jung, K. Analysis of long-term riverbed-level and flood stage variation due to water fate operation of multi-functional weirs at Geum River. J. Korea Water Resour. Assoc. 2015, 48, 379–391. (In Korean) [Google Scholar] [CrossRef]
- Krause, S.; Heathwaite, L.; Binley, A.; Keenan, P. Nitrate concentration changes at the groundwater-surface water interface of a small Cumbrian river. Hydrol. Process. 2009, 23, 2195–2211. [Google Scholar] [CrossRef]
- Levitt, D.G.; Newell, D.L.; Stone, W.J.; Wykoff, D.S. Surface water-groundwater connection at the Los Alamos Canyon weir site: Part 1. Monitoring site installation and tracer tests. Vadose Zone J. 2005, 4, 708–717. [Google Scholar] [CrossRef]
- Matula, S.; Mekonnen, G.B.; Batkova, K.; Nesetril, K. Simulations of groundwater-surface water interaction and particle movement due to the effect of weir construction in the sub-watershed of the river Labe in the town of Decin. Environ. Monit. Assess. 2014, 186, 7755–7770. [Google Scholar] [CrossRef] [PubMed]
- Yang, C.; Zhang, Y.K.; Liu, Y.; Yang, X.; Liu, C. Model-based analysis of the effects of dam-induced river water and groundwater interactions on hydro-biogeochemical transformation of redox sensitive contaminants in a hyporheic zone. Water Resour. Res. 2018, 54, 5973–5985. [Google Scholar] [CrossRef]
- Ray, C.; Soong, T.W.; Lian, Y.Q.; Roadcap, G.S. Effect of flood-induced chemical load on filtrate quality at bank filtration sites. J. Hydrol. 2002, 266, 235–258. [Google Scholar] [CrossRef]
- Lee, H.; Koo, M.H.; Kim, Y. Impacts of seasonal pumping on stream-aquifer interactions in Miryang, Korea. Groundwater 2017, 55, 906–916. [Google Scholar] [CrossRef]
- Moon, S.H.; Kim, Y.; Jeong, Y.Y.; Hwang, J. Groundwater-stream water interaction induced by water curtain cultivation activity in Sangdae-ri area of Cheongju, Korea. Econo. Environ. Geol. 2016, 49, 105–120. (In Korean) [Google Scholar] [CrossRef]
- Wu, B.; Zheng, Y.; Wu, X.; Tian, Y.; Han, F.; Liu, J.; Zheng, C. Optimizing water resources management in large river basins with integrated surface water-groundwater modeling: A surrogate-based approach. Water Resour. Res. 2015, 51, 2153–2173. [Google Scholar] [CrossRef]
- Ahn, S.R.; Kim, S.J. Analysis of water balance by surface-groundwater interaction using the SWAT model for the Han River basin, South Korea. Paddy Water Environ. 2018, 16, 543–560. [Google Scholar] [CrossRef]
- Lee, H.; Koo, M.H.; Cho, B.W.; Oh, Y.H.; Kim, Y.; Cho, S.Y.; Lee, J.Y.; Kim, Y.; Kim, D.H. Effects of Baekje Weir Operation on the Stream–Aquifer Interaction in the Geum River Basin, South Korea. Water 2020, 12, 2984. [Google Scholar] [CrossRef]
- Jung, B.; Kim, D.H.; Moon, H.S.; Kimg, Y. Quantifying effects of river stage control on groundwater system by cluster analysis and groundwater-level modeling. J. Geol. Soc. Korea 2021, 57, 79–97. (In Korean) [Google Scholar] [CrossRef]
- Waterloo Hydrogeologic. Visual Modflow Flex 6.1 User’s Manual; Waterloo Hydrogeologic: Waterloo, ON, Canada, 2019. [Google Scholar]
- Lee, G.R. Study on types and distribution properties of abandoned channels in Korea. Korean Geogr. Soc. 2011, 46, 304–318. (In Korean) [Google Scholar]
- Korea Institute of Geoscience and Mineral Resources. 1: 50,000 Geological Report of the Yeongsanpo Sheet; Korea Institute of Geoscience and Mineral Resources: Daejeon, Korea, 2015. (In Korean) [Google Scholar]
- Strack, O.D.L. Groundwater Mechanics; Prentice Hall: Englewood Cliffs, NJ, USA, 1989; ISBN 0-13-365412-5. [Google Scholar]
- Reddy, J.N. An Introduction to the Finite Element Method; McGraw-Hill: New York, NY, USA, 2010; ISBN 9780071267618. [Google Scholar]
- Grossmann, C.; Roos, H.G.; Stynes, M. Numerical Treatment of Partial Differential Equations; Springer: Berlin/Heidelberg, Germany, 2007; ISBN 978-3-540-71584-9. [Google Scholar]
- Rozos, E.; Koutsoyiannis, D. Error analysis of a multi-cell groundwater model. J. Hydrol. 2010, 392, 22–30. [Google Scholar] [CrossRef]
- McDonald, M.G.; Harbaugh, A.W. The history of MODFLOW. Groundwater 2003, 41, 280–283, PMID 12656294. [Google Scholar] [CrossRef]
- Colombera, L.; Mountney, N.P.; Medici, G.; West, L.J. The geometry of fluvial channel bodies: Empirical characterization and implications for object-based models of the subsurface. AAPG Bull. 2019, 103, 905–929. [Google Scholar] [CrossRef]
- Medici, G.; West, L.J.; Mountney, N.P. Sedimentary flow heterogeneities in the Triassic UK Sherwood Sandstone Group: Insights for hydrocarbon exploration. Geol. J. 2019, 54, 1361–1378. [Google Scholar] [CrossRef]
- Heeren, D.M.; Fox, G.A.; Fox, A.K.; Storm, D.E.; Miller, R.B.; Mittelstet, A.R. Divergence and flow direction as indicators of subsurface heterogeneity and stage-dependent storage in alluvial floodplains. Hydrol. Process. 2014, 28, 1307–1317. [Google Scholar] [CrossRef][Green Version]
- Thomas, E.R. System and Boundary Conceptualization in Groundwater Flow Simulation, Techniques of Water-Resources Investigations of U.S.; U.S. Geological Survey: Reston, VA, USA, 2001.
- Korea Water Resources Corporation. Groundwater Basic Survey Report of Naju Area; Korea Water Resources Corporation: Deajeon, Korea, 2010. (In Korean) [Google Scholar]
- Ministry of Environment. Report of Effect of the Weir Operation on Groundwater; Ministry of Environment: Sejong, Korea, 2018. (In Korean)
- Waterloo Hydrogeologic. Visual Modflow Premium 4.2 User’s Manual; Waterloo Hydrogeologic: Waterloo, ON, Canada, 2006. [Google Scholar]
- Sophocleous, M. Interactions between groundwater and surface water: The state of the science. Hydrogeol. J. 2002, 10, 52–67. [Google Scholar] [CrossRef]
- Lee, J.H.; Hamm, S.Y.; Lee, C.M.; Lee, J.; Kim, H.S.; Kim, G.B. Numerical simulation of groundwater system change in a riverside area due to the construction of an artificial structure. J. Eng. Geol. 2012, 22, 263–274. (In Korean) [Google Scholar] [CrossRef]
- Francis, B.A.; Francis, L.K.; Cardenas, M.B. Water table dynamics and groundwater–surface water interaction during filling and draining of a large fluvial island due to dam–induced river stage fluctuations. Water Resour. Res. 2010, 46, W07513. [Google Scholar] [CrossRef]
- Thin, K.C.; Khaing, M.M.; Aye, K.M. Design and performance analysis of centrifugal pump. World Acad. Sci. Eng. Technol. 2008, 46, 422–429. [Google Scholar]
- Lee, H.; Koo, M.H.; Oh, S. Modeling stream-aquifer interactions under seasonal groundwater pumping and managed aquifer recharge. Groundwater 2019, 57, 216–225. [Google Scholar] [CrossRef]
- Hillel, N.; Wine, M.L.; Laronne, J.B.; Licha, T.; Be’eri-Shlevin, Y.; Siebert, C. Identifying spatiotemporal variations in groundwater–surface water interactions using shallow pore water chemistry in the lower Jordan River. Adv. Water Resour. 2019, 131, 103388. [Google Scholar] [CrossRef]
- Korea Environment Corporation. Groundwater Quality Survey Report of the Groundwater Quality Monitoring Wells; Korea Environment Corporation: Incheon, Korea, 2018. (In Korean) [Google Scholar]
- Piper, A.M. A graphic procedure in the geochemical interpretation of water-analyses. Eos Trans. Am. Geophys. Union 1944, 25, 914–928. [Google Scholar] [CrossRef]
- Kumar, P.; Dasgupta, R.; Johnson, B.A.; Saraswat, C.; Basu, M.; Kefi, M.; Mishra, B.K. Effect of land use changes on water quality in an ephemeral coastal plain: Khambhat City, Gujarat, India. Water 2019, 11, 724. [Google Scholar] [CrossRef]
- Shimojima, E.; Sharma, M.L. The influence of pore water velocity on transport of sorptive and non-sorptive chemicals through an unsaturated sand. J. Hydrol. 1995, 164, 239–261. [Google Scholar] [CrossRef]


Publisher’s Note: MDPI stays neutral with regard to jurisdictional claims in published maps and institutional affiliations. |
© 2021 by the authors. Licensee MDPI, Basel, Switzerland. This article is an open access article distributed under the terms and conditions of the Creative Commons Attribution (CC BY) license (https://creativecommons.org/licenses/by/4.0/).