Abstract
The hydraulic performance of sewers is a major public concern in industrialised countries. In this study, fibre optic distributed temperature sensing (DTS) is used to monitor the discharge of wastewater for three months to assess the performance of a long underground foul sewer in a village in the UK. DTS cables were installed in the invert of sewer pipes to obtain distributed temperature change data along the sewer network. DTS generates a series of two-dimensional data sets (temperature against distance) that can be visualised in waterfall plots to help identify anomalies. The spatial and temperature resolutions are 2 m and 0.2–0.3 °C, respectively. The monitoring data clearly identify high-temperature plumes, which represent the flow of household wastewater in the sewer. Based on the analysis of the waterfall plots, it is found that the flow velocity is about 0.14 m/s under normal conditions. When continuous moderate rain or heavy rain occurs, water backs up from the water treatment plant to upstream distances of up to 400 m and the water flow velocity in the sewer decreases sharply to about 0.03 m/s, which demonstrates the ability of the DTS to localise anomalies in the sewer network.
1. Introduction
The underground public sewer network is one of the largest infrastructure in industrialised countries. For example, in the UK, the total length of the underground sewer system reaches about 250,000 km. In Japan and Germany, this number is 340,000 km and 360,000 km, respectively [1,2,3]. The widespread use of the underground sewer system is rooted in its crucial role in our lives as it protects both our health and the environment. At the same time, the growing use of this sewer network and its ageing bring huge challenges about its management and maintenance. The difficulty of inspection is one such challenge brought about by its large scale and limited accessibility. According to a statistical study of the public sewer network in the UK, there are approximately 5000 collapses and 200,000 blockages happening every year [4]. What is more serious is that these incidences of pipe blockage are commonly linked to flooding and other service failures. For example, Arthur et al. [5] showed that around 13% of 25,000 sewer blockages in England and Wales resulted in internal property flooding. Therefore, monitoring techniques for the long-term hydraulic performance of the sewer network to reduce these incidents are highly valued.
Currently, one of the most common monitoring techniques is visual inspection using closed-circuit television (CCTV) [6]. This technique uses cameras fitted on platforms that travel along sewer pipes and record images. However, this technique has some disadvantages, including being inaccurate and subjective [7]. The second method is acoustic inspection, which is based on the analysis of acoustic intensity data recorded on a group of closely spaced microphones installed in the sewer pipes. Bin Ali et al. [8] used this technology to identify the defects and blockages in a full-scale sewer pipe in a laboratory test. It was shown that the measurement was much faster compared to CCTV technologies. Romanova et al. [9] also found that this technique can detect 79% of the defects identified using CCTV. However, for the acoustic-based method, the need to install microphones makes application in some areas practically infeasible. On the other hand, one important assumption about the application of CCTV and acoustic-based methods for sewer inspection is that the location of blockages is generally linked to a structural defect. However, Blanksby et al. [6] found some contradictions with this assumption by analysing historical flooding incidents and CCTV records. They concluded that most blockages may be due to either local hydraulic conditions or silt and fat inputs, and continual monitoring could provide a better answer for the identification of defects and blockages.
Recent advances make use of distributed temperature sensing (DTS) as an alternative to conventional technologies. These fibre optic sensors are sensitive to subtle temperature changes in the bulk sewage liquor caused by the addition of a fluid of dissimilar temperature, which can indicate unwanted water infiltration into the sewer. This method has been used to detect illicit household sewage connections to stormwater systems [10,11,12]. Schilperoort and Clemens [13] and Langeveld et al. [12] applied fibre optic distributed temperature sensing (DTS) in foul sewer systems. In this study, individual discharges from house connections could be tracked in time and space. In addition, the inflow and in-sewer propagation of stormwater could be monitored. Subsequently, Schilperoort et al. [14] used the same technology to search for stormwater inflows in foul sewers. However, there are also some limitations in these tests. One of the major concerns of this technology has been that the installation of fibre optic cables into sewer pipes can potentially cause blockages, mainly due to wipes and cloths coiling onto the cable. Hence, the period of time of monitoring for most of these studies was a few days, and only a small number of permanent anomalies in the sewer could be captured as opposed to accidental or transient operational problems. One-off surveys do not allow the assessment of long-term performance [15]. Since these early studies, Behshti and Saegrov [15] have shown that the system is viable over longer periods of time by monitoring the sewer system for a period of three months. It showed the applicability of the DTS technique for the quantitative analysis of water infiltration and inflow. Longer term monitoring studies under various scenarios are needed to demonstrate the viability of DTS systems in foull sewers, enhance confidence in its use, and, where applicable, help devise strategies to prevent ragging and increase its longevity.
This paper presents the monitoring results of a DTS study carried out in a foul sewer in the UK during a period of over three months, from 23 March 2015 until to 1 July 2015. Some incidents of sewer blockages and backing up of water, initially reported by the local water treatment plant, could be indentified with the monitoring system when too much stormwater was discharged into the foul sewer.
2. Principles of Optical Scattering Sensors
Fibre optic distributed temperature sensing (DTS) relies on a phenomenon called backscatter-light transmitted in the direction opposite to propagation due to material imperfections and molecular interaction [16,17]. The scattered light contains Rayleigh, Raman, and Brillouin spectral components, as shown in Figure 1. Among the three components, the magnitude of the Raman anti-stokes component is sensitive to temperature changes, which is commonly used in scattering applications for structural monitoring. Scattering occurs along the entire length of the fibre; therefore, the entire fibre acts as a series of distributed sensors. Analytical techniques determine the magnitude of environment temperature along the fibre by monitoring the Raman spectra of the backscattered wavelengths caused by individual pulses of light rather than continuous beams. The anti-Stokes and Stokes Raman scattering intensity and can be written as a function of temperature T as [18],
where h is the Planck constant, is the Boltzmann constants, is the Raman frequency shift, constants and are constants which represent the losses suffered by each signal in the optical system. Accordingly, the Raman ratio is given by [18],
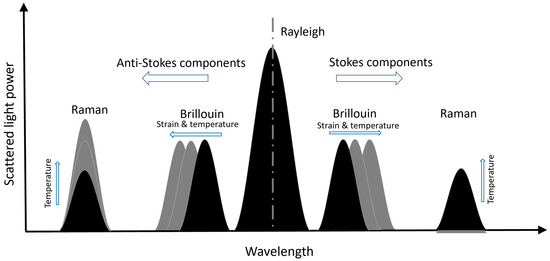
Figure 1.
Principles of optical scattering sensors.
The travel time of the light is then used to determine the distance of the point of interest along the fibre. Responses are averaged to counter the influence of noise and the non-infinitesimal pulse width.
As with all DTS systems, there is a trade-off between the temperature resolution, the spatial resolution, the measuring distance, and the measurement time. The temperature resolution improves with shorter distances, larger spatial resolution, and longer measurement times. Hence, care should be taken when interpreting manufacturer specifications, which are often theoretical predictions given for optimum conditions.
3. Test Site and Instrumentation
The analyser used in this study was a Halo DTS manufactured by Sensornet Ltd., UK. The spatial and sampling resolution of the analyser was 2 m. In this case study, where rapid dilution and dispersion occurs in the sewer over short distances, a spatial resolution ≥2 m was deemed adequate. Measurements of 1 min were taken every 2 min. The temperature resolution, which is linked to noise and therefore the minimal detectable change, was specified by the manufacturer as ≥0.1 °C for a 1 min measurement. The water-sewer investigated in this study is a domestic foul sewer network in a small town in the UK, as shown in Figure 2. The household wastewater and stormwater are discharged directly into this sewer network. If too much stormwater is added to the flow of sewage, domestic foul sewer overflow could result in a potential health and environmental hazard as it may lead to the flooding of properties and sewage treatment works. Hence, one crucial role of the management of such domestic foul sewer system is to reduce the hydraulic overloading and domestic foul sewer overflow emissions.
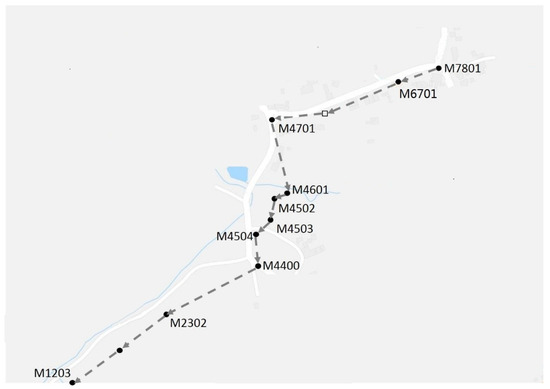
Figure 2.
Surveyed section of the domestic foul sewer.
The sewer runs were validated by identifying manhole locations, measuring run-lengths between sewer access points (manholes), finding locations where the insertion of fibre optics cables into the sewer would be least disruptive, and, where possible, identifying obstacles to the cable path. The total length of the surveyed section of the domestic foul sewer was about 1.1 km.
The insertion of the fibre optic sensing cable into the sewer started downstream from manhole M1203 inside the treatment plant. It was installed in three consecutive runs between manholes M1203, M4400, M4701 and M7801. The longest run was almost 400 m. Longer runs were prevented because of sharp turns at M4400 and M4701. These long single runs, where the cable was pulled from one manhole to another, were made possible by using a lightweight (26 kg/km) steel armoured cable, only 3.8 mm in diameter (BRUsens cable manufactured by Solifos AG, Windisch, Switzerland) with a tensile strength of over 1500 N. The small diameter and the stainless steel loose tube and wires also ensured good thermal conductivity and that the cable was rodent proof over the long-term.
In addition, a remote Casella tipping bucket rainfall gauge was installed on the roof of the treatment works control room. Its purpose was to measure rainfall levels to assist in the identification of monitoring periods that would have higher surface water flow events. Rainfall was monitored from the first day of installation until the system was decommissioned on 1 July 2015.
4. Results and Discussions
In this study, the temperature monitoring of the domestic foul sewer system started in late March and ended in early July. Cumulative rainfall amounts (depths) were recorded every 15 min with a precision of 0.2 mm. The rainfall data for the entire monitoring period commencing 23 March through to 1 July is shown in Figure 3. The main storm events recorded occurred on 3 May (2.8 mm/15 min), 18 May (3.8 mm/15 min), 29 May (3.6 mm/15 min), 13 June (7.2 mm/15 min) and 20 June 2015 (2 mm/15 min).
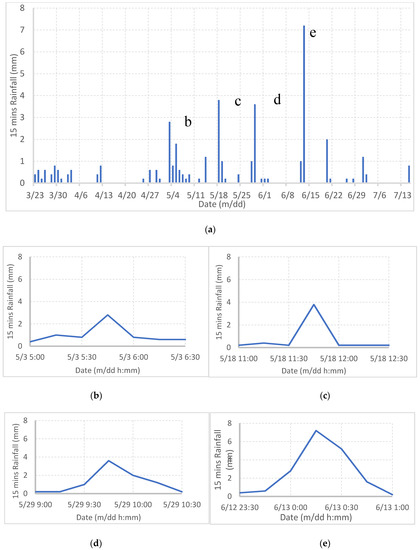
Figure 3.
Recorded rainfall and storm: (a) Recorded rainfall by rainfall gauge; (b) Rainfall on 3 May; (c) Rainfall on 18 May; (d) Rainfall on 29 May; (e) Rainfall on 13 June.
Distributed temperature sensing generates a series of two-dimensional data sets (temperature against distance). The temperature is measured every 2 m for the entire length of the sensor (1170 m) and measurements are taken every two minutes. A waterfall plot shows how this two-dimensional information changes over time and can be used to identify phenomena occurring along the length of the sewer at the time and location they occur. Figure 4 plots DTS monitoring results under normal conditions without rain. X-axis is the distance, y-axis is time. Different colour means different temperature value. Each pixel represents one measured temperature value. The environmental temperature in the sewer pipe was about 10 °C at the beginning of April, 14 °C at the middle of June, so that the predominant colour of the graph was dark blue in April and light blue in June. Hence, to better show the sewer temperature, the colour scale is a little different between spring and summer.
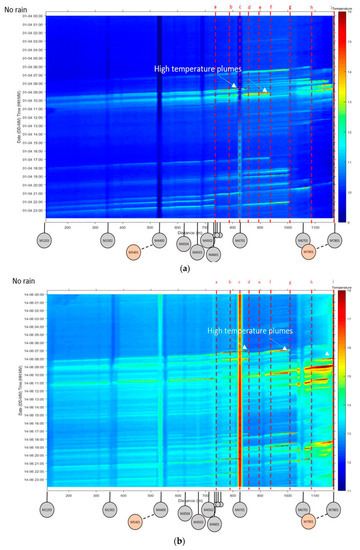
Figure 4.
Distributed temperature sensing (DTS) results without rain: (a) 1 April; (b) 14 June.
Locations at M4400 and M4701 on the graph were manholes where the fibre ends were spliced. The splice was secured underneath the manhole cover by a braided steel cable anchored to the ground just outside the manhole cover area. This resulted in a FOS loop approximately 6 m long. M4400 had a tree canopy, shielding it from direct sunlight. M4701 was completely exposed to sunlight. Hence, two vertical stripes with different colours at these two locations were observed. On the other hand, several high-temperature plumes (a downstream temperature rise during a certain time span and distance) was observed, which indicated that household wastewater from lateral connections from residential dwellings was discharged into the sewer. The location of these discharges is marked with red vertical dotted lines, (a) through to (i). Due to the hot wastewater discharged from household taps and applainaces, the regions of elevated temperatures were about 5–10 °C greater than that of the ambient sewage temperature. Note that the downstream direction is always from right to left and that the high temperature of the wastewater dissipated gradually during the flowing process (red colour changing to yellow/blue) due to the heat transfer between the elevated temperature plumes and colder sewer. Nevetheless, without any impediment to flow, this elevated temperature ingress could be tracked over time, from its point of origin, all the way along the fibre optic sensor to the beginning of the sensor (M1203). These plumes flowed downstream from right to left in approximately 2 h in total. Accordingly, the flow velocity was about 0.14 m/s under normal conditions, which is relatively low and may explain the blockage observed during heavy storm events discussed later. On the other hand, the high temperature of the wastewater dissipated gradually during the flowing process (red colour changing to yellow/blue), due to the heat transfer between the elevated temperature plumes and colder sewer.
Figure 5 shows the DTS monitoring results under moderate rain. As shown in Figure 5, some moderate rain appeared on 3 May and 29 May, with recorded rainfall of 2.8 mm/15 mins and 3.6 mm/15 mins, respectively. This seems to affect the overall sewage temperature which decreased by 1 to 1.5 °C. Some dark blue plumes are observed at 6:00 on 3 May, 10:00 on 29 May and 15:00 on 29 May. For most of the cases, the dark blue plumes dissipated quickly with time, which demonstrated the adequate hydraulic performance of the sewer system under these conditions. On 3 May, subsequent domestic discharges occurring approximately 2 h after the storm resulted in an overall temperature higher than the original temperature suggesting a reduction in flow and therefore in dilution. Discontinuities in elevated temperature trends progressing downstream along the sewer’s length might suggest blockages as the warm waterfront encountered colder stagnant water. Such a discontinuity, at around 6:00 on 3 May, could be seen at 270 m and persisted for approximately 3 h (Figure 5a). This sudden discontinuity in temperature might suggest colder water backing up upstream from the treatment plant. A similar phenomenon was observed on 29 May. Following the larger rainfall amount, there is again a slight discontinuity in temperature at 250 m that may suggest colder water backing up upstream from the treatment plant (Figure 5b). This is not observed for the smaller rainfall event at 15:00. Hence, the occurrence of sewer blockage depended on the rainfall amount.
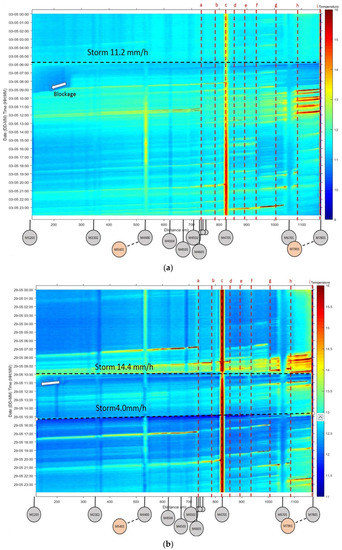
Figure 5.
DTS monitoring results with moderate rain: (a) 3 May; (b) 29 May.
Figure 6 shows the DTS monitoring results with a more serious blockage. Under continuous moderate rain, which started around 20:00 on 4 May, a blockage has resulted in water backing up from manhole M1203 up to the 425 metre mark, as shown by the curved dashed line in Figure 6a. It took the wastewater about 3 hours to flow through the last 300 m of the sewer pipe due to this serious blockage. However, this blockage disappeared after the rain stopped and the sewer flow recovered completely on the morning of the 5 May. A similar situation was observed on 13 June, when a heavy rain of 7.2 mm/15 mins was recorded. The temperature along the entire sewer length rapidly increased by 1–2 °C and reached approximately 14 °C, suggesting a significant volume of warm rainwater entering the sewer. The uniform temperature along the length of the sewer indicated rapid mixing and might indicate that the sewer is filling up. As opposed to previous plots, rainwater was warmer than flowing sewage, which might be due to the change in season. Downstream of M2302 the temperature data suggested decreased flow velocity and an abrupt discontinuity in flow at M2302. Much lower flow velocity downstream of M2302 might suggest that the manhole chamber and pipe further downstream acted as temporary storage of sewage that was flowing into inlet works at a set rate. From this point, warmer flow travelled downstream much slower as illustrated by the higher slopes of the warmer plumes indicated with white arrows in Figure 6b. Anecdotal evidence during an inspection of manhole M2302 on 1 July suggested that the manhole had recently completly fill up as shown by watermarks. It was not possible however to detect specific locations at which a large volume of stormwater would have infiltrated the sewer. This suggested that this water was either coming from upstream of the length of sewer surveyed or that it came from individual dwellings located along the sewer.
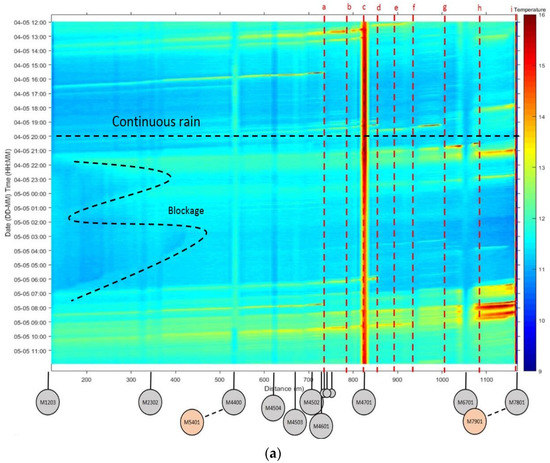
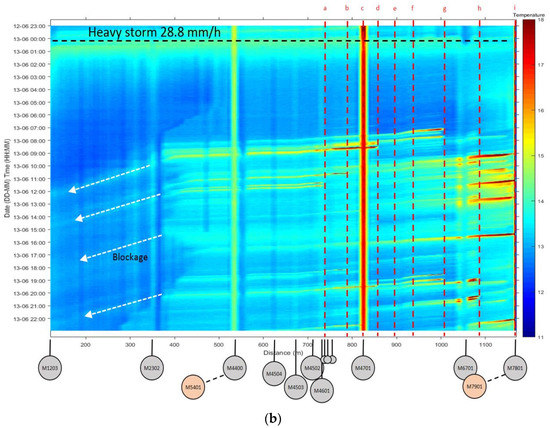
Figure 6.
DTS monitoring results with serious blockage: (a) continuous moderate rain; (b) heavy rain.
Tracking of the position of the front of warmer water plumes transiting through the sewer is plotted in Figure 7. If there was no impediment to flow, this elevated temperature ingress could be tracked over time, from its point of origin, all the way along the fibre optic sensor to the beginning of the sensor (M1203). However, the temperature elevation might reduce abruptly (5 May and 13 June ), indicating that its flow is impeded. The gradient of the passage of warmer water through the sewer can be used to estimate the flow velocity of the sewer. It is shown that the warmer wastewater flowed steadily downstream under most circumstances with no storm or small storm, with an estimated average velocity of about 0.14 m/s. The change in flow velocity for different dates in the monitoring period is very limited, which indicates that the installation of distributed fibre optic cables into the sewer pipe didn’t affect the hydraulic performance of the sewer. On the other hand, there was a remarkable change in velocity for the two cases with continuous rain and heavy rain. Under these conditions, the wastewater flow velocity slowed down sharply to approximately 0.03 m/s due to the temporary blockage in the sewer network. This was because the volume of stormwater discharged into the sewer exceeded the sewer capacity. Fortunately, water did not back up much further than 400 m from the treatment plant and the sewer system recovered to normal soon after the rain stopped (see 14 June). Hence, it is believed that this kind of sewer blockage would not lead to serious internal flooding of the properties situated upstream. This simple approach for estimating flow velocity is described by Langeveld et al. [12]. Schilperoort and Clemens [13] argue that, in the undisturbed flow of wastewater, temperature changes due to dispersion and diffusion over lengths of 1 km are small and in the order of 0.1 °C. Although this method would need to be assessed and validated against conventional measurements, it is an additional feature of a DTS system which allows qualitative assessment of sewer hydraulic performance.
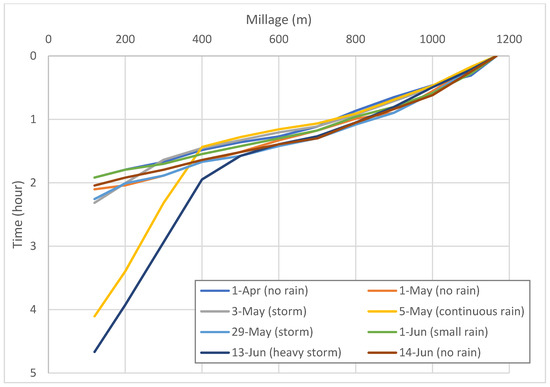
Figure 7.
Tracking of the position of the front of warmer wastewater plumes transiting through the sewer.
5. Conclusions
- The need for better monitoring methods in the sewer system is evident from the literature. Distributed temperature sensing, which uses properties of backscattered light spectrum as a measure of temperature, is a promising and relatively new technique. This paper proposes the use of DTS to monitor the long-term hydraulic performance of the sewer system. The proposed method was tested on a long domestic foul sewer in a village in the UK. The following conclusions are derived: the monitoring of the sewer was successful; the survey did not reveal the presence of damage to the sewer section under test; the survey was able to detect the time and location of residential connections and discharges; it was also possible to determine the location and duration of sewer blockages and backing up of water at the treatment plant.
- DTS captures temperature abnormality very well and is capable of being a standalone surveying system in future installations. The use of temperature to assess the hydraulic performance of the sewer network over the long-term is promising. The length of time the fibre optic cable can stay in a sewer will, however, depend on the size of the sewer pipes, the level of ragging and prevention methods used to reduce it. In this study, the system remained in the sewer for over 3 months, which was sufficient to capture large rainfall events. The little change in estimated flow velocity, outside the heavier storm events, indicates that the installation of the distributed fibre optic cable into the sewer pipe had no noticeable effect on the hydraulic performance of the sewer in the short term.
- The advantages of using DTS to investigate integrity over other techniques are: (i) its capacity to provides a high spatial density of data, (ii) its ease of installation, and (iii) a very low sensor failure rate.
- The monitoring of the sewer in this study suggested that stormwater enters the sewer, and during heavier storms water backs up at the treatment plant to upstream distances of up to 400 m. This conclusion is supported by anecdotal evidence during an inspection of manhole M2302 on 1 July.
- The flow velocity can be estimated based on the analysis of the waterfall plot. Under normal conditions, the average velocity of the wastewater flow in the sewer was about 0.14 m/s. However, under continuous rain and during a heavy storm, the wastewater flow slowed down sharply to an estimated 0.03 m/s and backed up from the treatment plant. This was attributed to the volume of stormwater discharged into the sewer exceeding the sewer capacity and causing a temporary sewer blockage.
- These data could be used to calibrate some geological and hydraulic models, which would provide better predictions of defects and blockages for given geological, climatic, and usage conditions.
Author Contributions
Conceptualization, C.K., P.K., X.X. and Y.R.; methodology, C.K., P.K., X.X. and Y.R.; software, Y.R.; validation, C.K., P.K. and Y.R.; formal analysis, C.K.; investigation, C.K., P.K. and X.X.; writing—original draft preparation, C.K., P.K. and Y.R.; writing—review and editing, C.K., P.K., X.X. and Y.R.; project administration, C.K. All authors have read and agreed to the published version of the manuscript.
Funding
This research was funded by EPSRC, grant number EP/L010917/1 and Innovate UK, grant number 920035. Research data supporting this publication is available from the Cambridge research repository Apollo at https://doi.org/10.17863/CAM.56725.
Acknowledgments
The authors would like to thank the staff of the Cambridge Centre for Smart Infrastructure and Construction (CSIC) for their support. We are especially grateful to Peter Knott for his help with the field deployment.
Conflicts of Interest
The authors declare no conflict of interest.
References
- Pace, N.G. Ultrasonic surveying of fully charged sewage pipes. Electron. Commun. Eng. J. 1994, 6, 87–92. [Google Scholar] [CrossRef]
- Hertzberg, J.; Christaller, T.; Kirchner, F.; Litcht, U.; Rome, E. Sewer robotics. In Proceedings of the 5th Internation Conference Simulation Adaptive Behavior (SAB-98), Cambridge, MA, USA, 24–26 September 1998; pp. 427–436. [Google Scholar]
- Duran, O.; Althoefer, K.; Seneviratne, L.D. State of the art in sensor technologies for sewer inspection. IEEE Sens. J. 2002, 2, 73–81. [Google Scholar] [CrossRef]
- Schrock, B.J. Existing sewer evaluation and rehabilitation. In F-ASCE Manual and Report on Engineering Practice; No. 62: Water Environment Federation Manual of Practice, (ed.); The Joint Task force of the Water Environment Federation and the American Society of Civil Engineers: New York, NY, USA, 1994. [Google Scholar]
- Arthur, S.; Crow, H.; Pedezert, L. Understanding Blockage Formation in Combined Sewer Networks. Water Manag. 2008, 161, 215–221. [Google Scholar] [CrossRef]
- Blanksby, J.; Khan, A.; Jack, A. Assessment of cause of blockage of small diameter sewers. In Proceedings of the International Conference on Sewer Operation and Maintenance, Bradford, UK, 26–28 November 2002. [Google Scholar]
- Dirksen, J.; Clemens, F.H.L.R.; Korving, H.; Cherqui, F.; Le Gauffre, P.; Ertl, T.; Plihal, H.; Müller, K.; Snaterse, C.T.M. The consistency of visual sewer inspection data. Struct. Infrastruct. Eng. 2013, 9, 214–228. [Google Scholar] [CrossRef]
- Bin Ali, M.T.; Horoshenkov, K.V.; Tait, S.J. Rapid detection of sewer defects and blockages using acoustic-based instrumentation. Water Sci. Technol. 2011, 64, 1700–1707. [Google Scholar] [CrossRef] [PubMed]
- Romanova, A.; Horoshenkov, K.V.; Tait, S.J.; Ertl, T. Sewer inspection and comparison of acoustic and CCTV methods. Proc. Inst. Civ. Eng.: Water Manag. 2013, 166, 70–80. [Google Scholar] [CrossRef]
- Hoes, O.A.C.; Schilperoort, R.P.S.; Luxemburg, W.M.J.; Clemens, F.H.L.R.; Van De Giesen, N.C. Locating illicit connections in storm water sewers using fiber-optic distributed temperature sensing. Water Res. 2009, 43, 5187–5197. [Google Scholar] [CrossRef] [PubMed]
- De Haan, C.; Langeveld, J.G.; Schilperoort, R.P.S.; Klootwijk, M. Locating and classifying illicit connections with Distributed Temperature Sensing. In Proceedings of the 12th International Conference on Urban Drainage, Porto Alegre, Brazil, 11–16 September 2011. [Google Scholar]
- Langeveld, J.G.; De Haan, C.; Klootwijk, M.; Schilperoort, R.P.S. Monitoring the performance of a storm water separating manifold with distributed temperature sensing. Water Sci. Technol. 2012, 66, 145–150. [Google Scholar] [CrossRef] [PubMed]
- Schilperoort, R.P.S.; Clemens, F.H.L.R. Fibre-optic distributed temperature sensing in combined sewer systems. Water Sci. Technol. 2009, 60, 1127–1134. [Google Scholar] [CrossRef] [PubMed]
- Schilperoort, R.; Hoppe, H.; De Haan, C.; Langeveld, J. Searching for storm water inflows in foul sewers using fibre-optic distributed temperature sensing. Water Sci. Technol. 2013, 68, 1723–1730. [Google Scholar] [CrossRef] [PubMed]
- Beheshti, M.; Sægrov, S. Quantification assessment of extraneous water infiltration and inflow by analysis of the thermal behavior of the sewer network. Water 2018, 10, 1070. [Google Scholar] [CrossRef]
- Fang, Z.; Chin, K.; Qu, R.; Cai, H. Fundamentals of Optical Fiber Sensors; John Wiley & Sons: Hoboken, NJ, USA, 2012; Volume 226. [Google Scholar]
- Iten, M. Novel Applications of Distributed Fiber-Optic Sensing in Geotechnical Engineering; VDF Hochschulverlag AG: Zurich, Switzerland, 2012; Volume 19632. [Google Scholar]
- Bolognini, G.; Hartog, A. Raman-based fibre sensors: Trends and applications. Opt. Fiber Technol. 2013, 19, 678–688. [Google Scholar] [CrossRef]


© 2020 by the authors. Licensee MDPI, Basel, Switzerland. This article is an open access article distributed under the terms and conditions of the Creative Commons Attribution (CC BY) license (http://creativecommons.org/licenses/by/4.0/).