Evaluation of Satellite Precipitation Products in Simulating Streamflow in a Humid Tropical Catchment of India Using a Semi-Distributed Hydrological Model


Abstract
1. Introduction
2. Materials and Methods
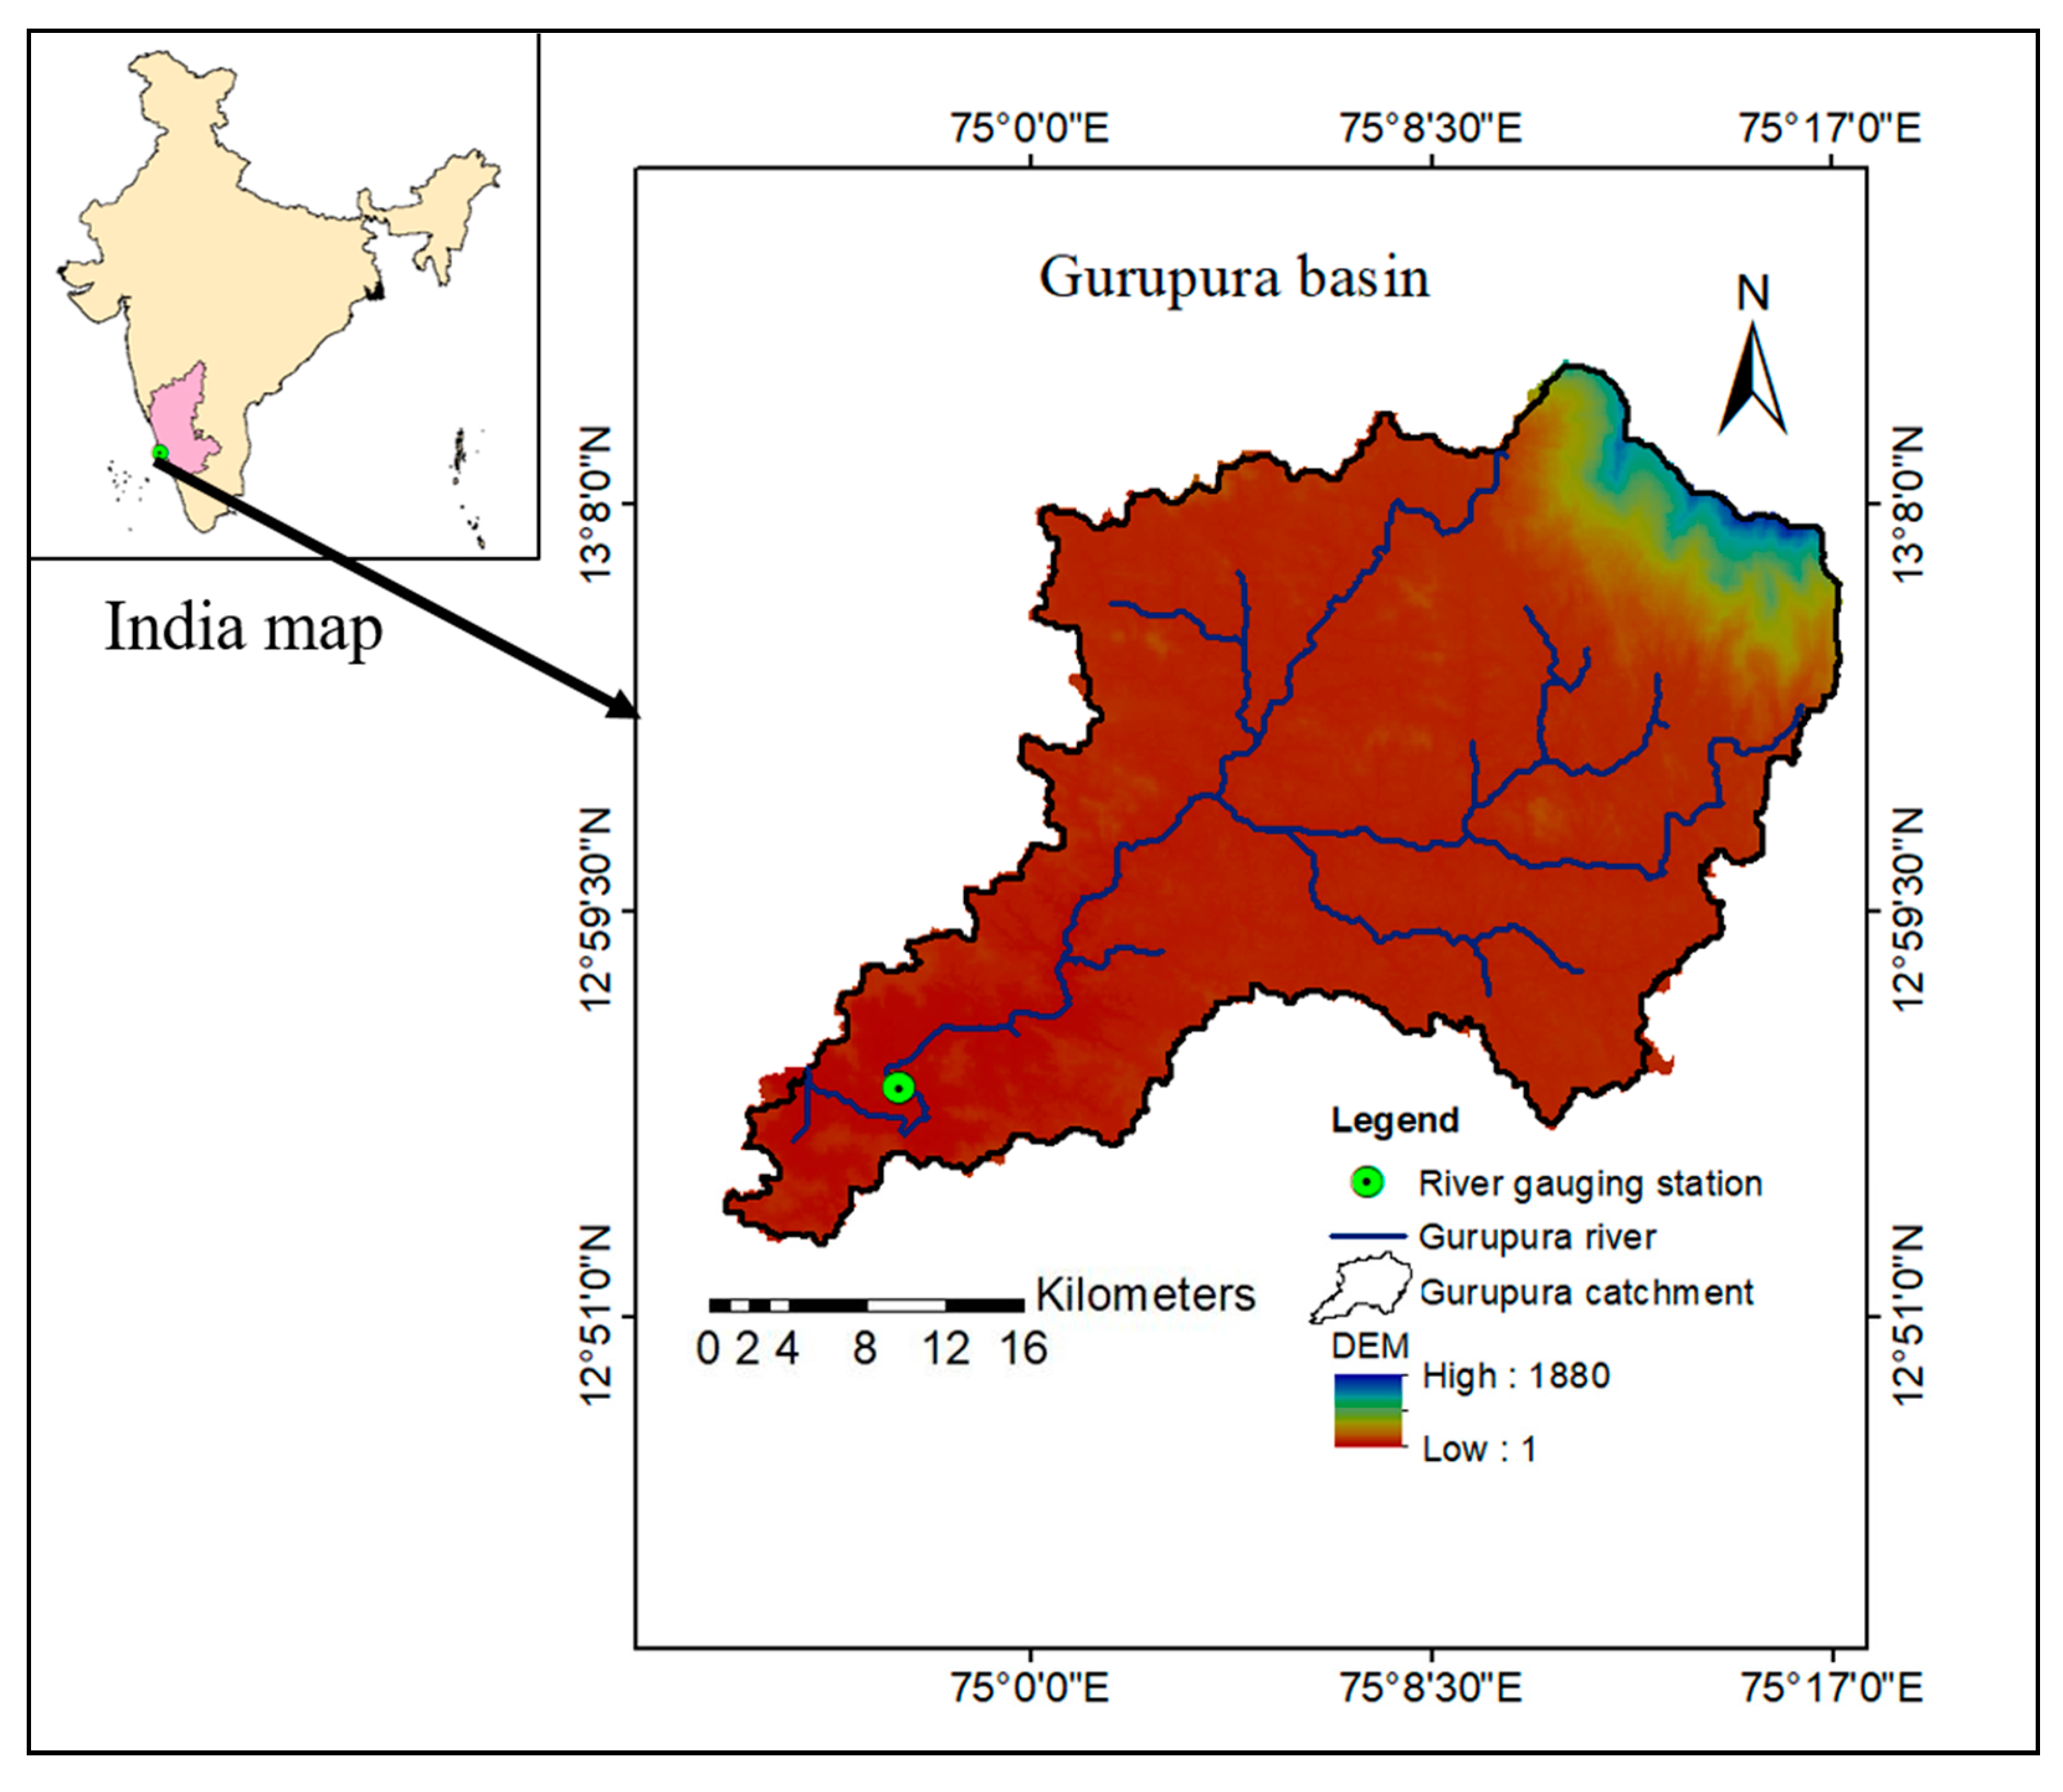
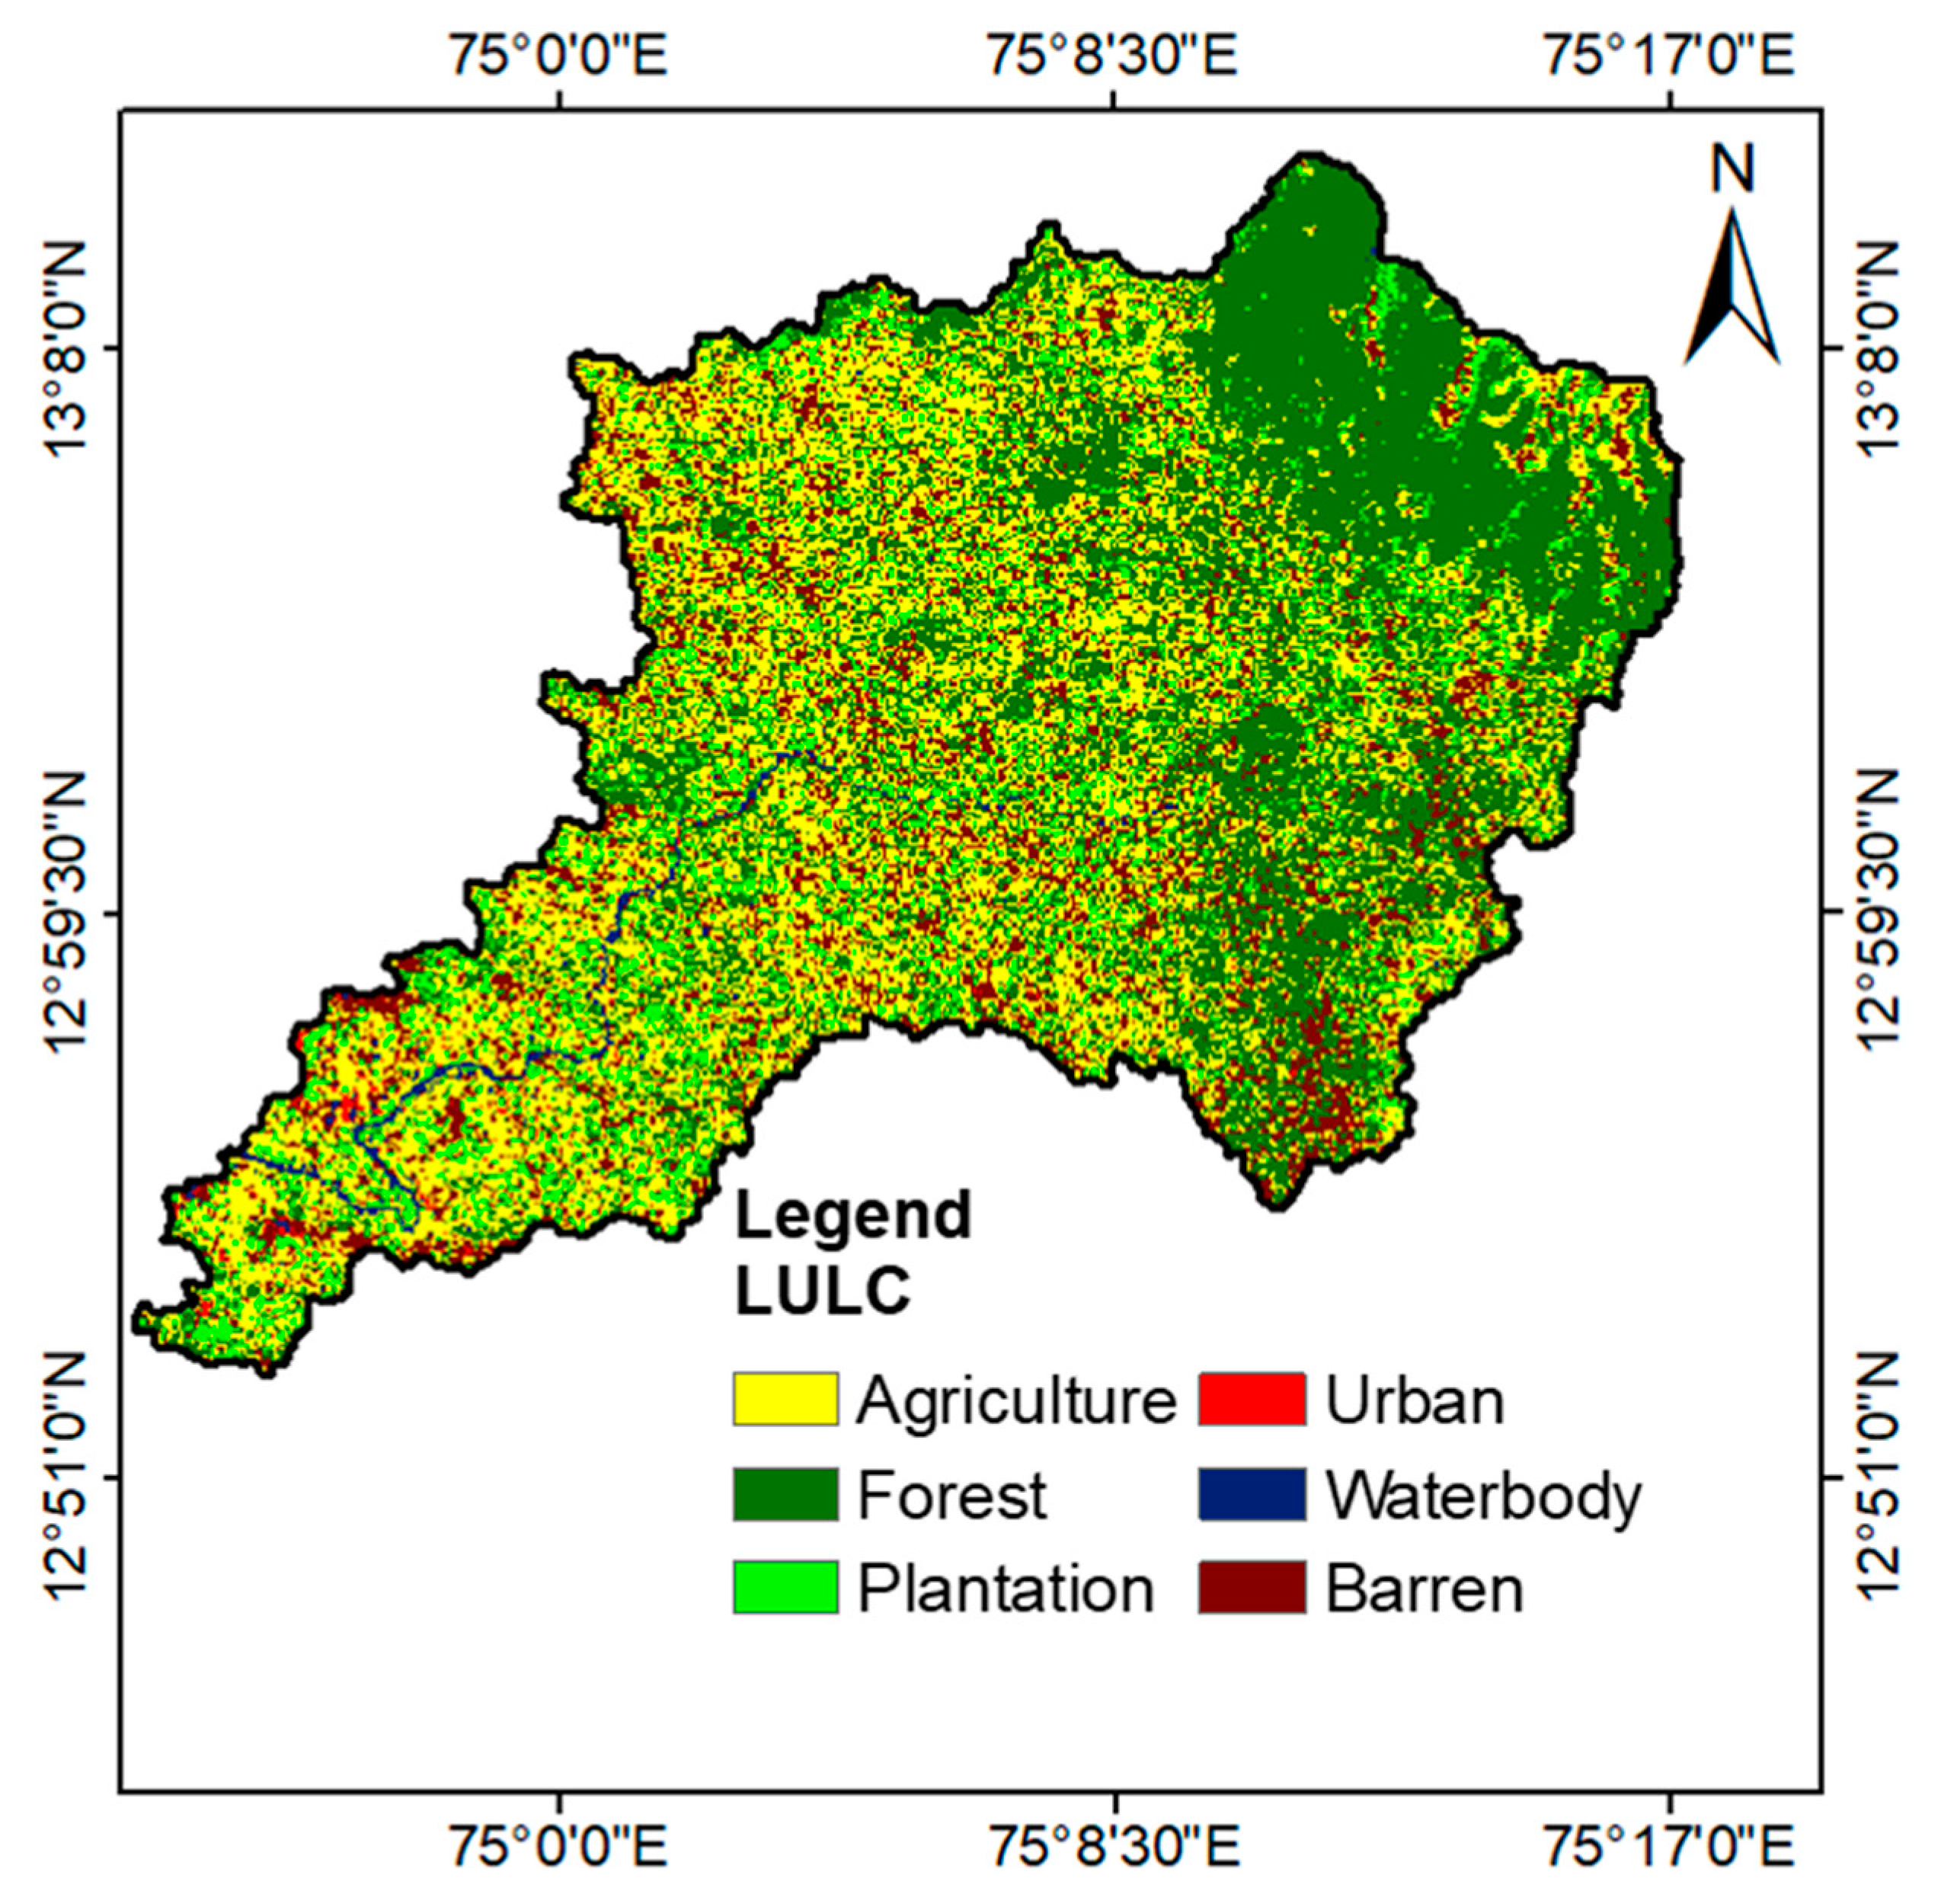
2.1. Study Area
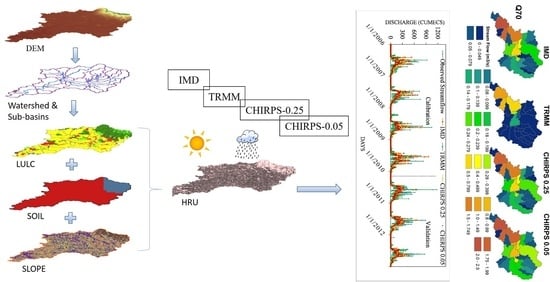
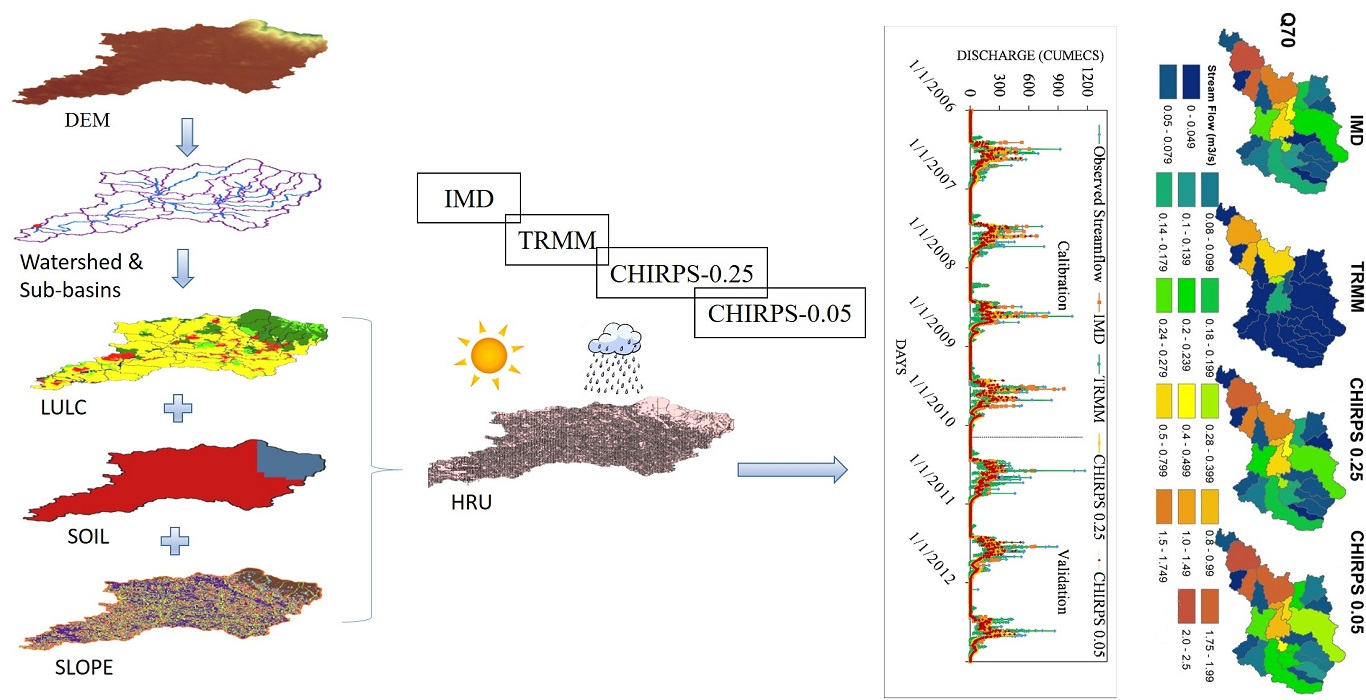
2.2. Hydrological Model
2.2.1. Gauge-Based Meteorological Data
2.2.2. TRMM Rainfall Data
2.2.3. CHIRPS Rainfall Data
2.3. Statistical Evaluation for the Satellite Precipitation Data
2.4. Model Calibration, Validation, and Uncertainty Analysis
2.5. Performance Indices for Streamflow Simulation
2.6. Hydrological Signatures
3. Results and Discussion
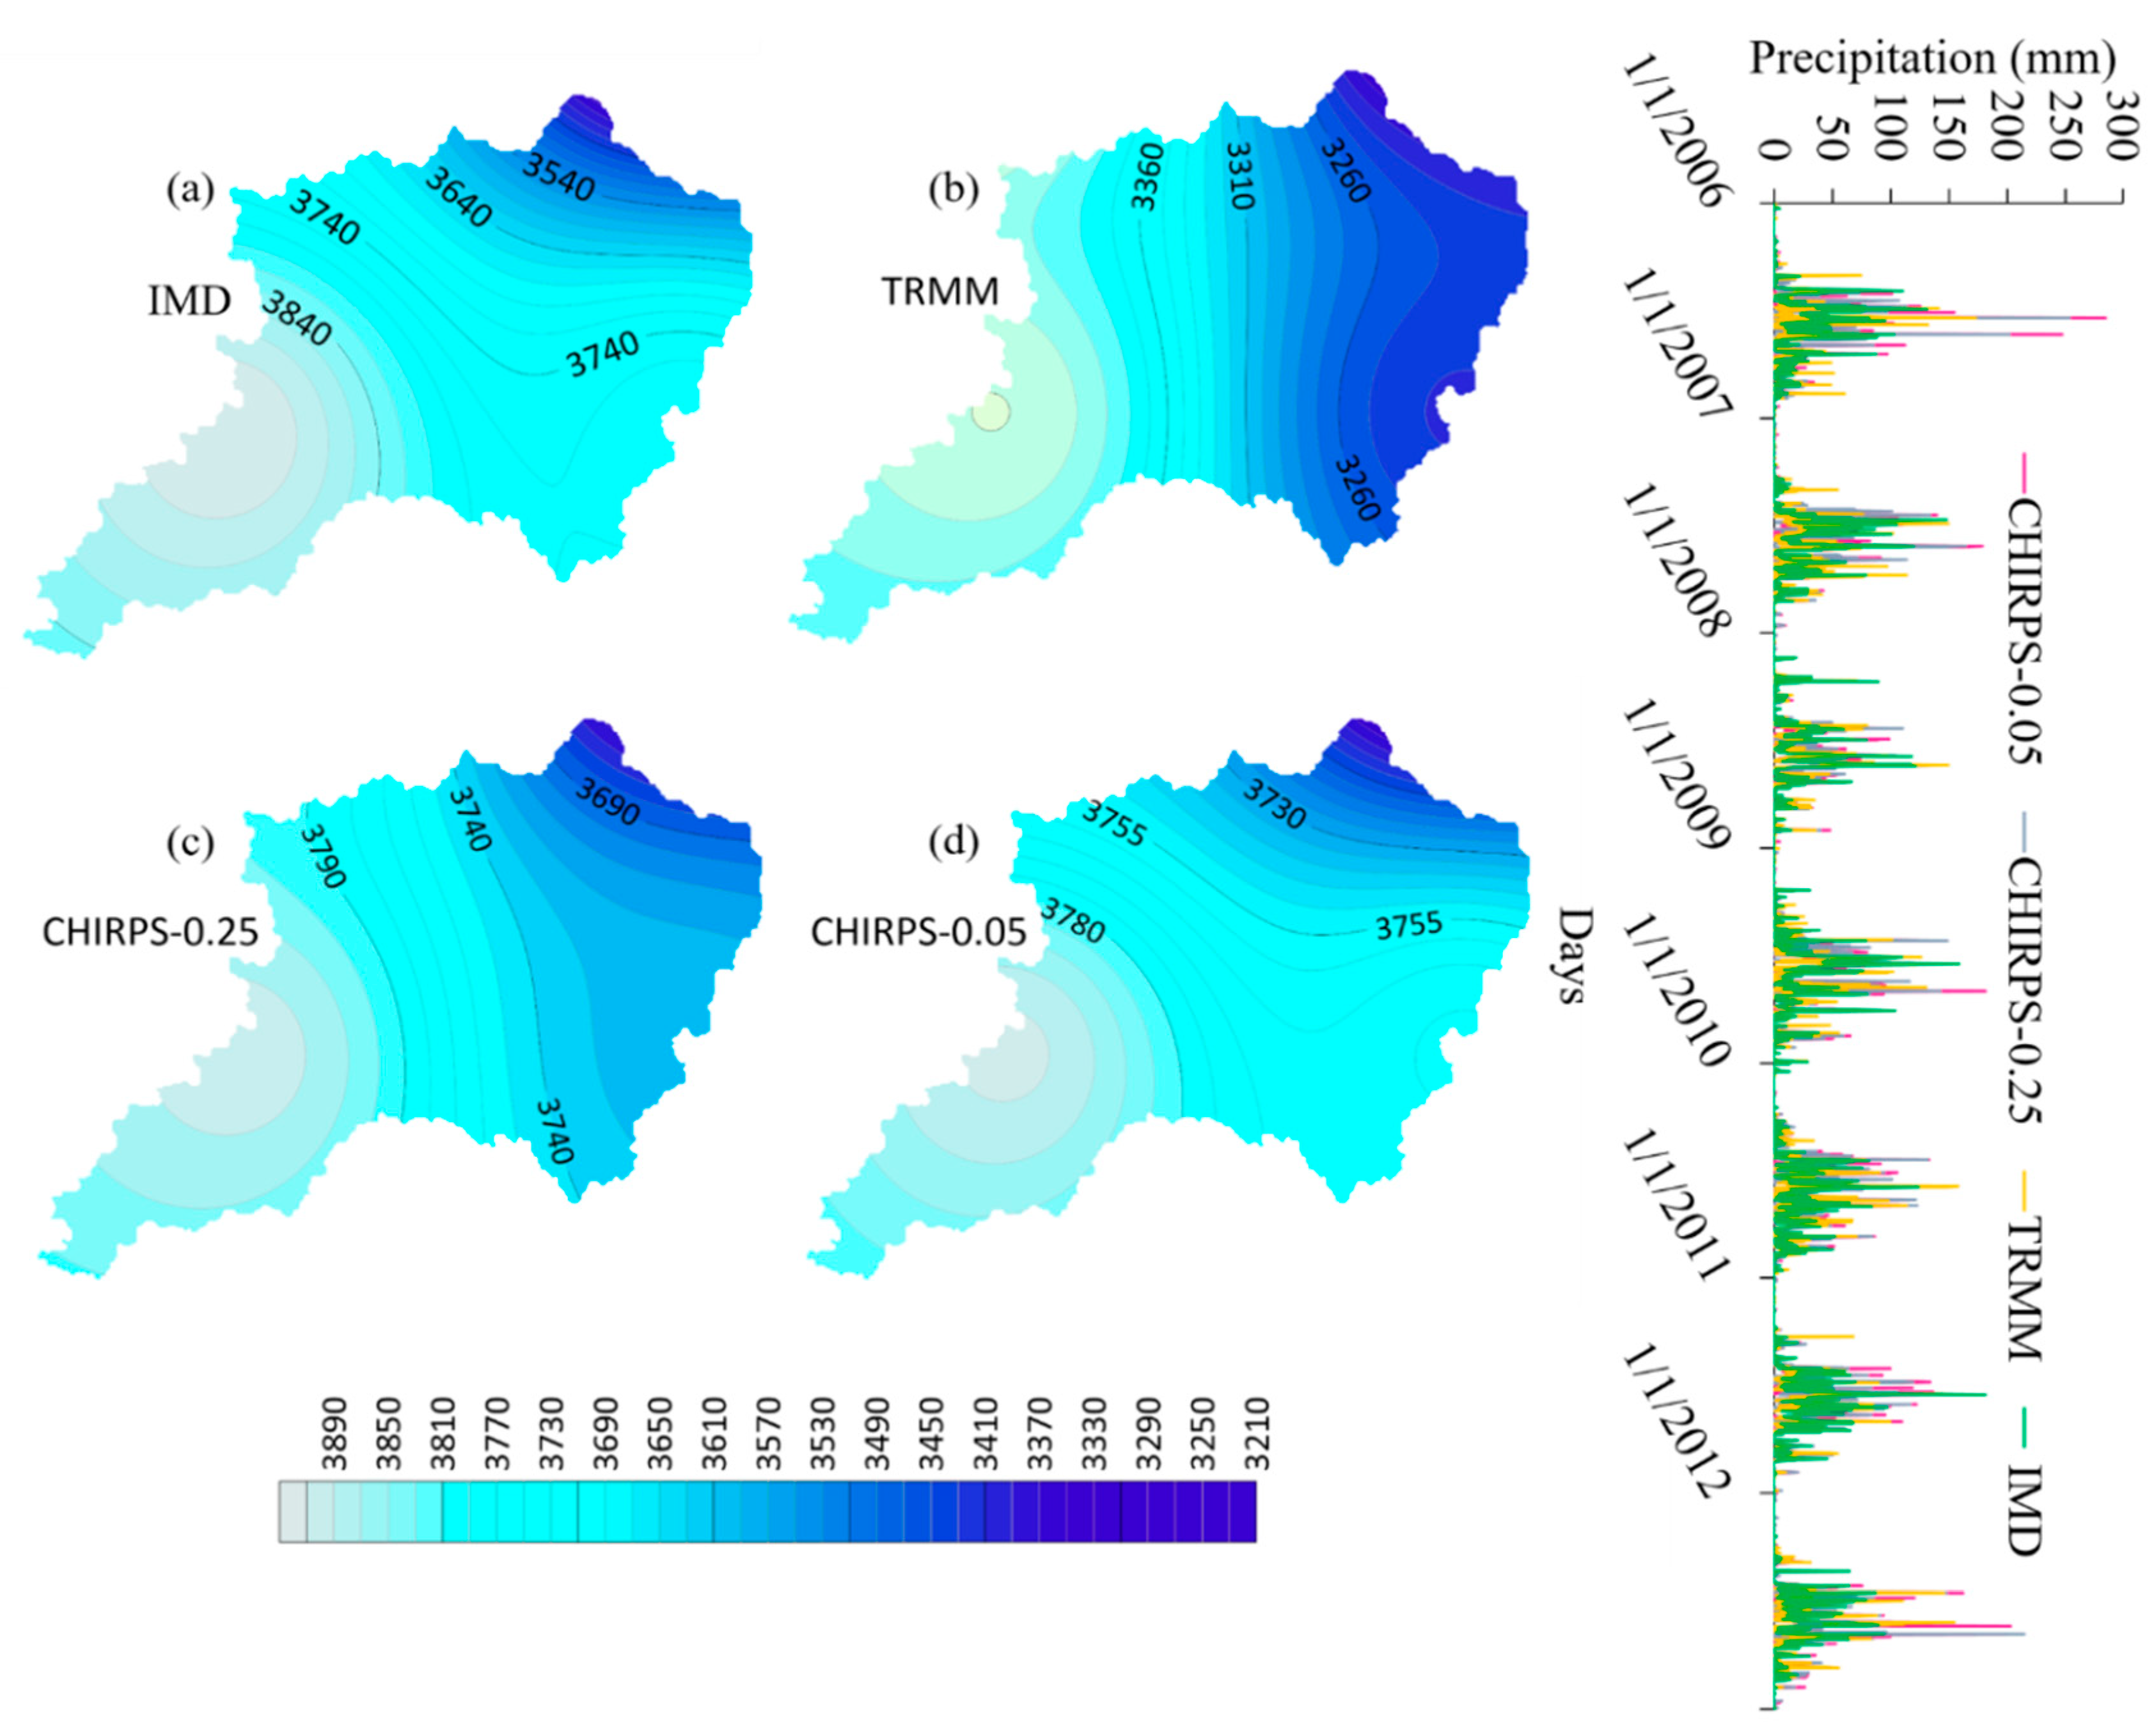
3.1. Spatial Distribution of Rainfall Data
3.2. Categorical and Continuous Statistical Metrics
3.3. Evaluation of Streamflow Generation
3.4. Hydrological Process Simulation
3.5. Uncertainty of Model Parameters
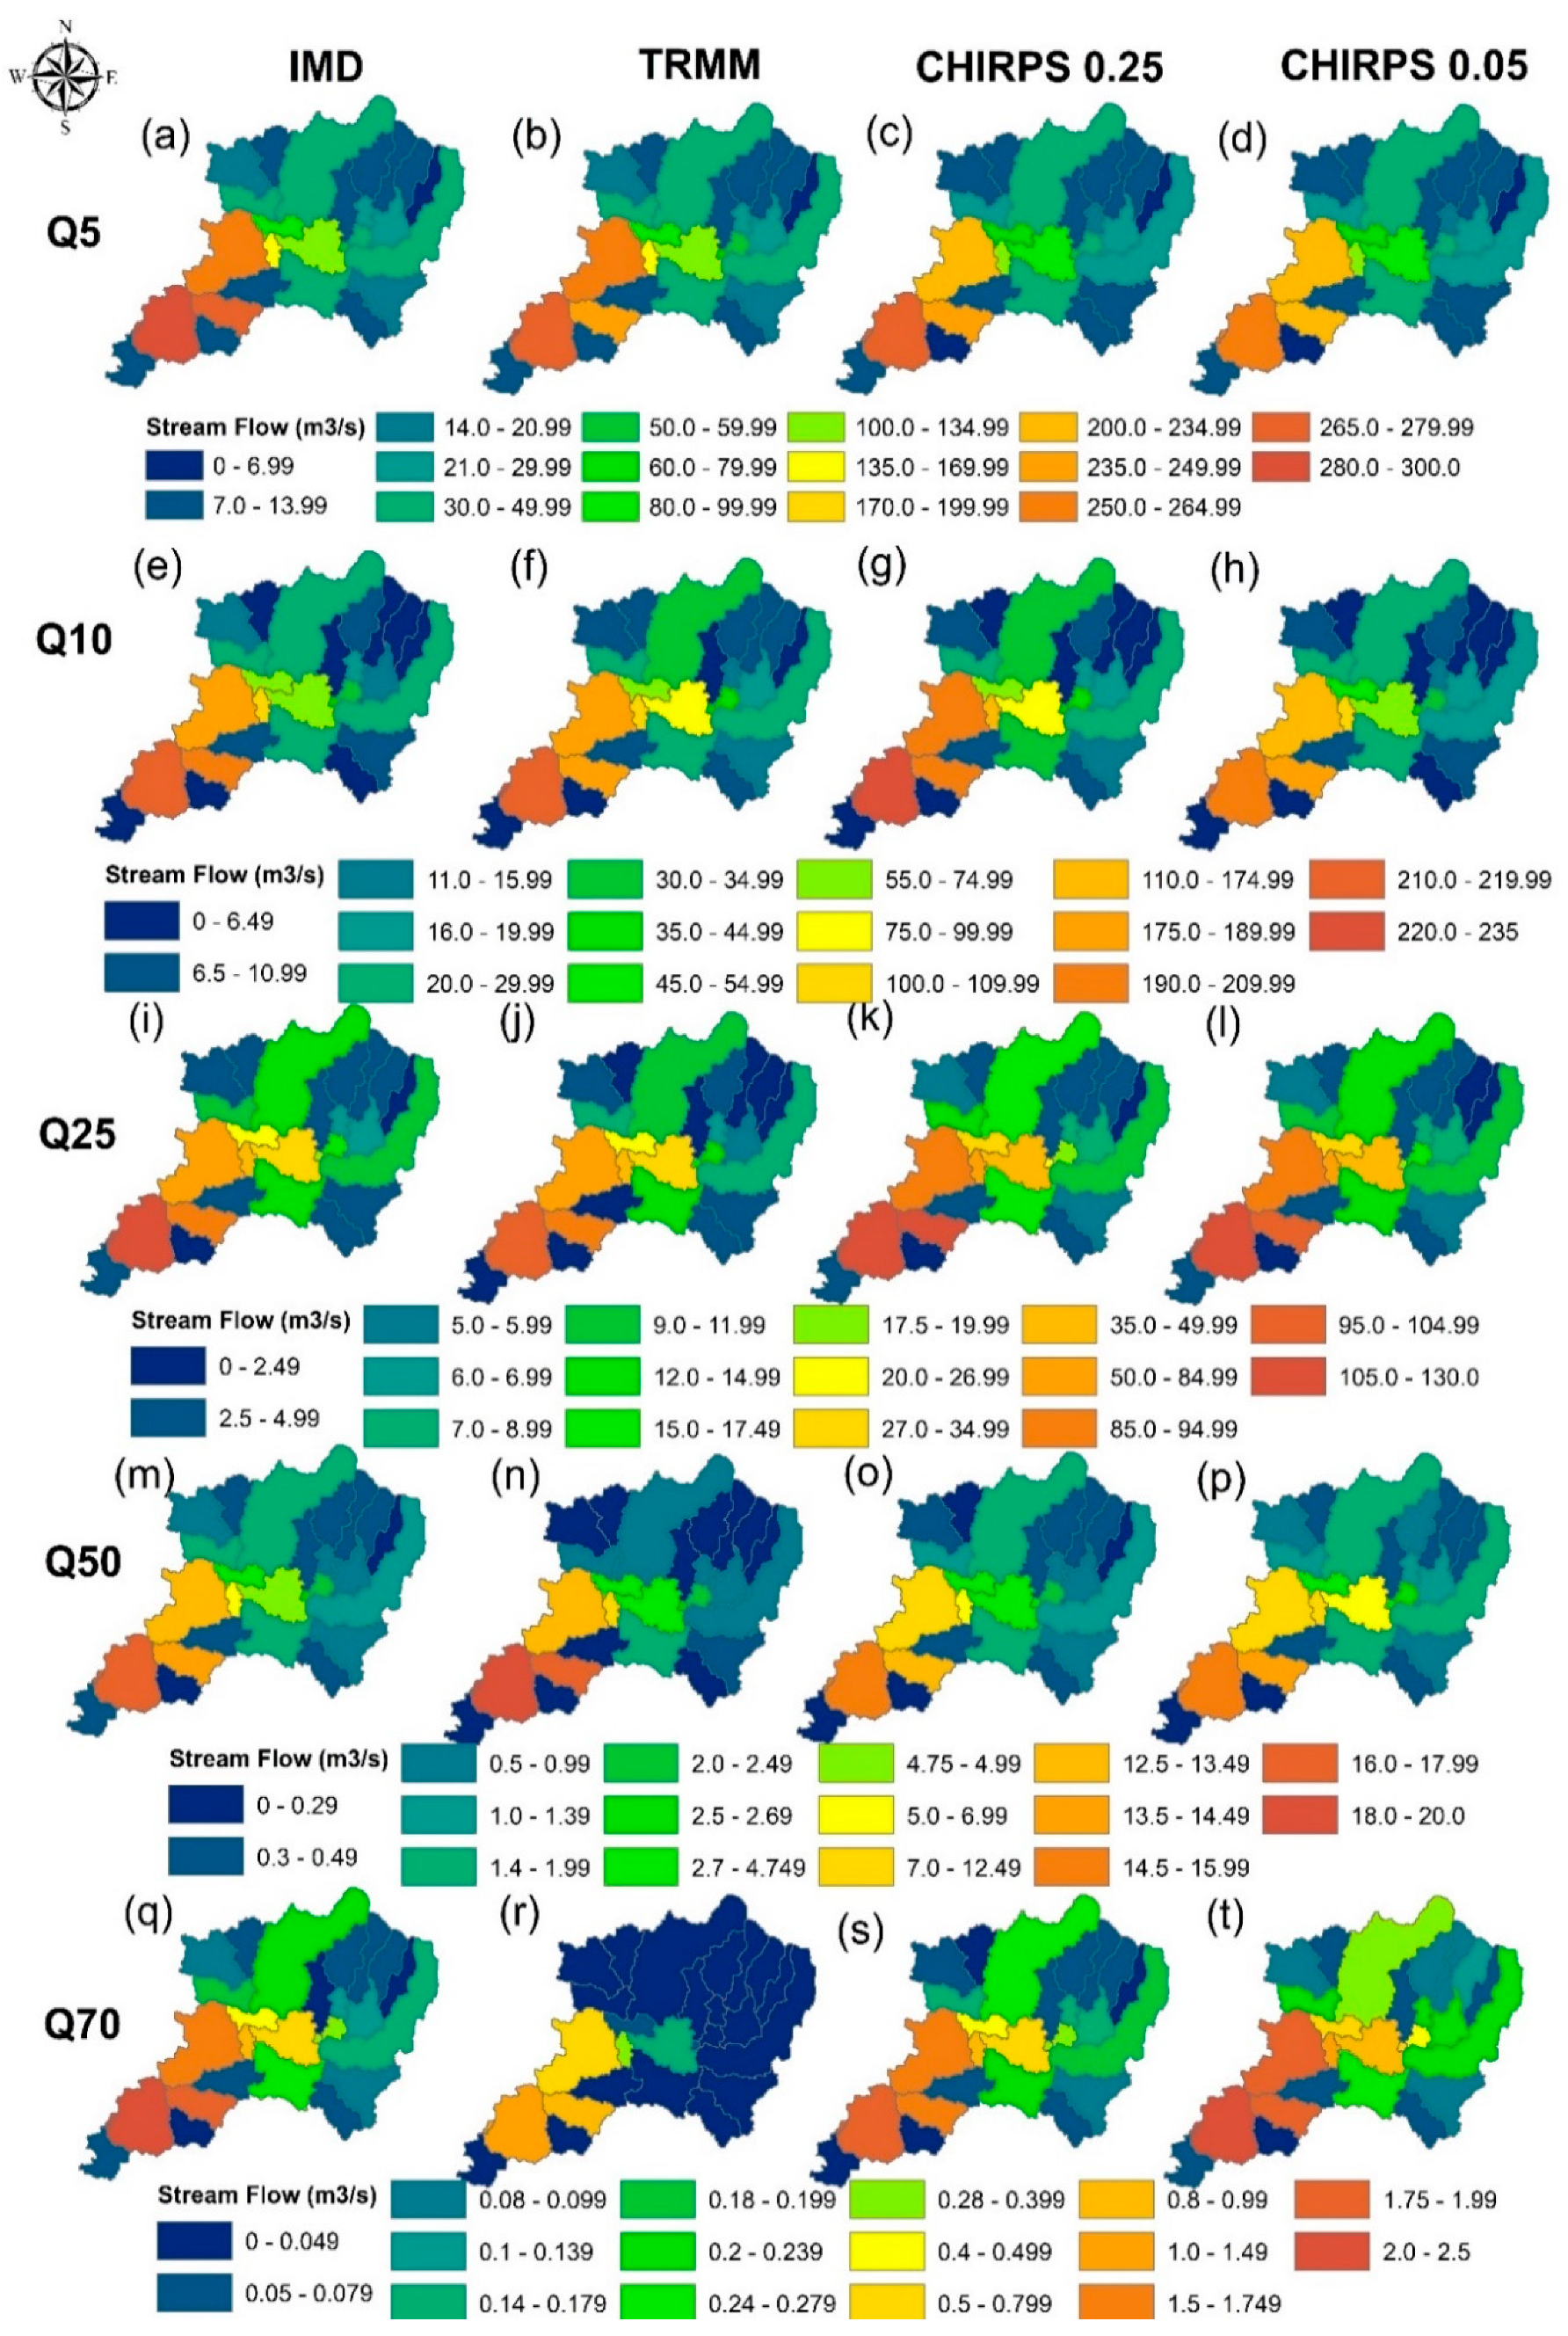
3.6. Distribution of Hydrological Signature over the Catchment
4. Conclusions
Author Contributions
Funding
Acknowledgments
Conflicts of Interest
References
- Gao, F.; Zhang, Y.; Chen, Q.; Wang, P.; Yang, H.; Yao, Y. Comparison of two long-term and high-resolution satellite precipitation datasets in Xinjiang, China. Atmos. Res. 2018, 212, 150–157. [Google Scholar] [CrossRef]
- Stagl, J.; Mayr, E.; Koch, H.; Hattermann, F.F.; Huang, S. Effects of climate change on the hydrological cycle in central and eastern Europe. In Managing Protected Areas in Central and Eastern Europe under Climate Change; Springer: Dordrecht, The Netherlands, 2014; pp. 31–43. [Google Scholar]
- Chappell, A.; Renzullo, L.H.; Raupach, T.J.; Haylock, M. Evaluating geostatistical methods of blending satellite and gauge data to estimate near real-time daily rainfall for Australia. J. Hydrol. 2013, 493, 105–114. [Google Scholar] [CrossRef]
- Su, Y.; Zhao, C.; Wang, Y.; Ma, Z. Spatiotemporal variations of precipitation in China using surface gauge observations from 1961 to 2016. Atmosphere 2020, 11, 303. [Google Scholar] [CrossRef]
- Zhao, C.; Garrett, T.J. Ground-based remote sensing of precipitation in the Arctic. J. Geophys. Res. Atmos. 2008, 113, 1–10. [Google Scholar] [CrossRef]
- Ahmed, K.; Shahid, S.; Wang, X.; Nawaz, N. Evaluation of Gridded Precipitation Datasets over Arid Regions of Pakistan. Water 2019, 11, 210. [Google Scholar] [CrossRef]
- Chen, J.; Wang, Z.; Wu, X.; Chen, X.; Lai, C.; Zeng, Z.; Li, J. Accuracy evaluation of GPM multi-satellite precipitation products in the hydrological application over alpine and gorge regions with sparse rain gauge network. Hydrol. Res. 2019, 50, 1710–1729. [Google Scholar] [CrossRef]
- Tan, X.; Ma, Z.; He, K.; Han, X.; Ji, Q.; He, Y. Evaluations on gridded precipitation products spanning more than half a century over the Tibetan Plateau and its surrounding. J. Hydrol. 2020. [Google Scholar] [CrossRef]
- Huang, W.R.; Liu, P.Y.; Chang, Y.H.; Liu, C.Y. Evaluation and application of satellite precipitation products in studying the summer precipitation variations over Taiwan. Remote Sens. 2020, 12, 347. [Google Scholar] [CrossRef]
- Schuster, G.; Ebert, E.E.; Stevenson, M.A.; Corner, R.J.; Johansen, C.A. Application of satellite precipitation data to analyse and model arbovirus activity in the tropics. Int. J. Health Geogr. 2011, 10, 8. [Google Scholar] [CrossRef]
- Funk, C.; Barbara, S.; Peterson, P.; Barbara, S.; Pedreros, D.H.; States, U.; Survey, G.; Shukla, S.; Barbara, S. The climate hazards infrared precipitation with stations—A new environmental record for monitoring extremes. Sci. Data 2015. [Google Scholar] [CrossRef]
- Ashouri, H.; Hsu, K.L.; Sorooshian, S.; Braithwaite, D.K.; Knapp, K.R.; Cecil, L.D.; Nelson, B.R.; Prat, O.P. PERSIANN-CDR: Daily precipitation climate data record from multisatellite observations for hydrological and climate studies. Bull. Am. Meteorol. Soc. 2015, 96, 69–83. [Google Scholar] [CrossRef]
- Beck, H.E.; Vergopolan, N.; Pan, M.; Levizzani, V.; Van Dijk, A.I.J.M.; Weedon, G.P.; Brocca, L.; Pappenberger, F.; Huffman, G.J.; Wood, E.F. Global-scale evaluation of 22 precipitation datasets using gauge observations and hydrological modeling. Hydrol. Earth Syst. Sci. 2017, 21, 6201–6217. [Google Scholar] [CrossRef]
- Ochoa, A.; Pineda, L.; Crespo, P.; Willems, P. Evaluation of TRMM 3B42 precipitation estimates and WRF retrospective precipitation simulation over the Pacific-Andean region of Ecuador and Peru. Hydrol. Earth Syst. Sci. 2014, 18, 3179–3193. [Google Scholar] [CrossRef]
- Seyyedi, H. Comparing Satellite Derived Rainfall with Ground Based Radar for North-Western Europe. Master’s Thesis, Faculty of Geo-Information and Earth Observation, University of Twente, Enschede, The Netherlands, January 2010. [Google Scholar]
- Kerle, N.; Oppenheimer, C. Satellite remote sensing as a tool in lahar disaster management. Disasters 2002, 26, 140–160. [Google Scholar] [CrossRef] [PubMed]
- Tuo, Y.; Duan, Z.; Disse, M.; Chiogna, G. Evaluation of precipitation input for SWAT modeling in Alpine catchment: A case study in the Adige river basin (Italy). Sci. Total Environ. 2016, 573, 66–82. [Google Scholar] [CrossRef] [PubMed]
- Islam, M.A. Statistical comparison of satellite-retrieved precipitation products with rain gauge observations over Bangladesh. Int. J. Remote Sens. 2018, 39, 2906–2936. [Google Scholar] [CrossRef]
- Li, D.; Christakos, G.; Ding, X.; Wu, J. Adequacy of TRMM satellite rainfall data in driving the SWAT modeling of Tiaoxi catchment (Taihu lake basin, China). J. Hydrol. 2018, 556, 1139–1152. [Google Scholar] [CrossRef]
- Shrestha, N.K.; Qamer, F.M.; Pedreros, D.; Murthy, M.S.R.; Wahid, S.M.; Shrestha, M. Evaluating the accuracy of Climate Hazard Group (CHG) satellite rainfall estimates for precipitation based drought monitoring in Koshi basin, Nepal. J. Hydrol. Reg. Stud. 2017, 13, 138–151. [Google Scholar] [CrossRef]
- Xue, X.; Hong, Y.; Limaye, A.S.; Gourley, J.J.; Huffman, G.J.; Khan, S.I.; Dorji, C.; Chen, S. Statistical and hydrological evaluation of TRMM-based Multi-satellite Precipitation Analysis over the Wangchu Basin of Bhutan: Are the latest satellite precipitation products 3B42V7 ready for use in ungauged basins? J. Hydrol. 2013, 499, 91–99. [Google Scholar] [CrossRef]
- Tarek, M.; Brissette, F.P.; Arsenault, R.; De, É.; West, N. Evaluation of the ERA5 reanalysis as a potential reference dataset for hydrological modelling over North America. Hydrol. Earth Syst. Sci. 2020, 24, 2527–2544. [Google Scholar] [CrossRef]
- Kumar, B.; Lakshmi, V. Accessing the capability of TRMM 3B42 V7 to simulate streamflow during extreme rain events: Case study for a Himalayan River Basin. J. Earth Syst. Sci. 2018, 127, 1–15. [Google Scholar] [CrossRef]
- Himanshu, S.K.; Pandey, A.; Patil, A. Hydrologic evaluation of the TMPA-3B42V7 precipitation data set over an agricultural watershed using the SWAT model. J. Hydrol. Eng. 2018, 23, 1–17. [Google Scholar] [CrossRef]
- Pakoksung, K.; Takagi, M. Effect of satellite based rainfall products on river basin responses of runoff simulation on flood event. Model. Earth Syst. Environ. 2016, 2, 1–14. [Google Scholar] [CrossRef]
- Satgé, F.; Ruelland, D.; Bonnet, M.; Molina, J.; Pillco, R.; Hydrosciences, U.M.R.; Bataillon, P.E.; Cedex, M.; Hydrosciences, U.M.R.; Bataillon, P.E.; et al. Consistency of satellite-based precipitation products in space and over time compared with gauge observations and snow- hydrological modelling in the Lake Titicaca region. Hydrol. Earth Syst. Sci. 2019, 23, 595–619. [Google Scholar] [CrossRef]
- Yilmaz, K.K.; Gupta, H.V.; Wagener, T. A process-based diagnostic approach to model evaluation: Application to the NWS distributed hydrologic model. Water Resour. Res. 2008, 44, 1–18. [Google Scholar] [CrossRef]
- McGlynn, B.L.; Blöschl, G.; Borga, M.; Bormann, H.; Hurkmans, R.; Komma, J.; Nandagiri, L.; Uijlenhoet, R.; Wagener, T. A data acquisition framework for prediction of runoff in un-gauged basins. In Runoff Prediction in Ungauged Basins: Synthesis across Processes, Places and Scales; Blöschl, G., Sivapalan, M., Wagener, T., Viglione, A., Savenije, H., Eds.; Cambridge University Press: Cambridge, UK, 2013; pp. 29–52. [Google Scholar]
- Yaeger, M.A.; Sivapalan, M.; McIsaac, G.F.; Cai, X. Comparative analysis of hydrologic signatures in two agricultural watersheds in east-central Illinois: Legacies of the past to inform the future. Hydrol. Earth Syst. Sci. 2013, 17, 4607–4623. [Google Scholar] [CrossRef]
- Sawicz, K.; Wagener, T.; Sivapalan, M.; Troch, P.A.; Carrillo, G. Catchment classification: Empirical analysis of hydrologic similarity based on catchment function in the eastern USA. Hydrol. Earth Syst. Sci. 2011, 15, 2895–2911. [Google Scholar] [CrossRef]
- Westerberg, I.K.; McMillan, H.K. Uncertainty in hydrological signatures. Hydrol. Earth Syst. Sci. 2015, 19, 3951–3968. [Google Scholar] [CrossRef]
- Zhang, Y.; Chiew, F.H.S.; Li, M.; Post, D. Predicting Runoff Signatures Using Regression and Hydrological Modeling Approaches. Water Resour. Res. 2018, 54, 7859–7878. [Google Scholar] [CrossRef]
- Mudbhatkal, A.; Amai, M. Regional climate trends and topographic influence over the Western Ghat catchments of India. Int. J. Climatol. 2018, 38, 2265–2279. [Google Scholar] [CrossRef]
- Sharannya, T.M.; Mudbhatkal, A.; Mahesha, A. Assessing climate change impacts on river hydrology–A case study in the Western Ghats of India. J. Earth Syst. Sci. 2018, 127, 78. [Google Scholar] [CrossRef]
- Arnold, J.G.; Srinivasan, R.; Muttiah, R.S.; Williams, J.R. Large Area Hydrologic Modeling and Assessment Part I: Model Development. J. Am. Assoc. Am. Water Resour. Assoc. 1998, 34, 73–89. [Google Scholar] [CrossRef]
- Liew, M.W.V.; Garbrecht, J. Hydrologic Simulation of The Little Washita River Experimental Watershed Using SWAT 1. JAWRA J. Am. Water Resour. Assoc. 2003, 39, 413–426. [Google Scholar] [CrossRef]
- Mudbhatkal, A.; Raikar, R.V.; Venkatesh, B.; Mahesha, A. Impacts of climate change on varied River-Flow regimes of southern india. J. Hydrol. Eng. 2017, 22, 1–13. [Google Scholar] [CrossRef]
- Venkatesh, K.; Ramesh, H.; Das, P. Modelling stream flow and soil erosion response considering varied land practices in a cascading river basin. J. Environ. Manag. 2020, 264, 110448. [Google Scholar] [CrossRef]
- Pai, D.S.; Sridhar, L.; Rajeevan, M.; Sreejith, O.P.; Satbhai, N.S.; Mukhopadhyay, B. (1901–2010) daily gridded rainfall data set over India and its comparison with existing data sets over the region. Mausam 2014, 1, 1–18. [Google Scholar] [CrossRef]
- Srivastava, A.K.; Rajeevan, M.; Kshirsagar, S.R. Development of a high resolution daily gridded temperature data set (1969–2005) for the Indian region. Atmos. Sci. Lett. 2009, 10, 249–254. [Google Scholar] [CrossRef]
- Kolluru, V.; Kolluru, S.; Konkathi, P. Evaluation and integration of reanalysis rainfall products under contrasting climatic conditions in India. Atmos. Res. 2020, 246, 105121. [Google Scholar] [CrossRef]
- Fuka, D.R.; Walter, M.T.; Macalister, C.; Degaetano, A.T.; Steenhuis, T.S.; Easton, Z.M. Using the Climate Forecast System Reanalysis as weather input data for watershed models. Hydrol. Process. 2014, 28, 5613–5623. [Google Scholar] [CrossRef]
- Lindsay, R.; Wensnahan, M.; Schweiger, A.; Zhang, J. Evaluation of seven different atmospheric reanalysis products in the arctic. J. Clim. 2014, 27, 2588–2606. [Google Scholar] [CrossRef]
- Tomy, T.; Sumam, K.S. Determining the Adequacy of CFSR Data for Rainfall-Runoff Modeling Using SWAT. Procedia Technol. 2016, 24, 309–316. [Google Scholar] [CrossRef]
- Huffman, G.J.; Adler, R.F.; Bolvin, D.T.; Gu, G.; Nelkin, E.J.; Bowman, K.P.; Hong, Y.; Stocker, E.F.; Wolff, D.B. The TRMM Multisatellite Precipitation Analysis (TMPA): Quasi-global, multiyear, combined-sensor precipitation estimates at fine scales. J. Hydrometeorol. 2007, 8, 38–55. [Google Scholar] [CrossRef]
- Wang, G.; Zhang, X.; Zhang, S. Performance of three reanalysis precipitation datasets over the qinling-daba mountains, eastern fringe of tibetan plateau, China. Adv. Meteorol. 2019, 2019, 1–16. [Google Scholar] [CrossRef]
- Bitew, M.M.; Gebremichael, M. Evaluation of satellite rainfall products through hydrologic simulation in a fully distributed hydrologic model. Water Resour. Res. 2011, 47, 1–11. [Google Scholar] [CrossRef]
- Jiang, Q.; Li, W.; Wen, J.; Qiu, C.; Sun, W.; Fang, Q.; Xu, M.; Tan, J. Accuracy Evaluation of Two High-Resolution Satellite-Based Rainfall Products: TRMM 3B42V7 and CMORPH in Shanghai. Water 2018, 10, 40. [Google Scholar] [CrossRef]
- Abbaspour, K.C.; Rouholahnejad, E.; Vaghefi, S.; Srinivasan, R.; Yang, H.; Kløve, B. A continental-scale hydrology and water quality model for Europe: Calibration and uncertainty of a high-resolution large-scale SWAT model. J. Hydrol. 2015, 524, 733–752. [Google Scholar] [CrossRef]
- Abbaspour, K.C.; Yang, J.; Maximov, I.; Siber, R.; Bogner, K.; Mieleitner, J.; Zobrist, J.; Srinivasan, R. Modelling hydrology and water quality in the pre-alpine/alpine Thur watershed using SWAT. J. Hydrol. 2007, 333, 413–430. [Google Scholar] [CrossRef]
- Khoi, D.N.; Thom, V.T. Parameter uncertainty analysis for simulating streamflow in a river catchment of Vietnam. Glob. Ecol. Conserv. 2015, 4, 538–548. [Google Scholar] [CrossRef]
- Me, W.; Abell, J.M.; Hamilton, D.P. Effects of hydrologic conditions on SWAT model performance and parameter sensitivity for a small, mixed land use catchment in New Zealand. Hydrol. Earth Syst. Sci. 2015, 19, 4127–4147. [Google Scholar] [CrossRef]
- Moriasi, D.N.; Arnold, J.G.; Van Liew, M.W.; Bingner, R.L.; Harmel, R.D.; Veith, T.L. Model Evaluation Guidelines For Systematic Quantification Of Accuracy In Watershed Simulations. Am. Soc. Agric. Biol. Eng. ISSN 2007, 50, 885–900. [Google Scholar] [CrossRef]
- Musie, M.; Sen, S.; Srivastava, P. Comparison and evaluation of gridded precipitation datasets for streamflow simulation in data scarce watersheds of Ethiopia. J. Hydrol. 2019, 579, 124168. [Google Scholar] [CrossRef]
- Booker, D.J.; Snelder, T.H. Comparing methods for estimating flow duration curves at ungauged sites. J. Hydrol. 2012, 434–435, 78–94. [Google Scholar] [CrossRef]
- Weibull, W. A Statistical Distribution Function of Wide Applicability. J. Appl. Mech. 1951, 103, 293–297. [Google Scholar]
- Sudheer, K. Impact of Climate Change on Water Resources in Madhya Pradesh on Water Resources in Madhya Pradesh—An Assessment Report; Indian Institute of Technology: Madras, India, 2016. [Google Scholar]
- Shige, S.; Kida, S.; Ashiwake, H.; Kubota, T.; Aonashi, K. Improvement of TMI rain retrievals in mountainous areas. J. Appl. Meteorol. Climatol. 2013, 52, 242–254. [Google Scholar] [CrossRef]
- Sinha, R.K.; Eldho, T.I. Effects of historical and projected land use/cover change on runoff and sediment yield in the Netravati river basin, Western Ghats, India. Environ. Earth Sci. 2018, 77, 111. [Google Scholar] [CrossRef]
- Young, M.P.; Williams, C.J.R.; Christine Chiu, J.; Maidment, R.I.; Chen, S.H. Investigation of discrepancies in satellite rainfall estimates over Ethiopia. J. Hydrometeorol. 2014, 15, 2347–2369. [Google Scholar] [CrossRef]
- Uniyal, B.; Jha, M.K.; Verma, A.K. Parameter identification and uncertainty analysis for simulating streamflow in a river basin of Eastern India. Hydrol. Process. 2015, 29, 3744–3766. [Google Scholar] [CrossRef]
- Malagò, A.; Pagliero, L.; Bouraoui, F.; Franchini, M. Comparaison de jeux de paramètres calés de modèles SWAT pour les péninsules ibérique et Scandinave. Hydrol. Sci. J. 2015, 60, 949–967. [Google Scholar] [CrossRef]
- Yuan, F.; Wang, B.; Shi, C.; Cui, W.; Zhao, C.; Liu, Y.; Ren, L.; Zhang, L.; Zhu, Y.; Chen, T.; et al. Evaluation of hydrological utility of IMERG Final run V05 and TMPA 3B42V7 satellite precipitation products in the Yellow River source region, China. J. Hydrol. 2018, 567, 696–711. [Google Scholar] [CrossRef]
- Thiemig, V.; Rojas, R.; Zambrano-Bigiarini, M.; De Roo, A. Hydrological evaluation of satellite-based rainfall estimates over the Volta and Baro-Akobo Basin. J. Hydrol. 2013, 499, 324–338. [Google Scholar] [CrossRef]
- Neitsch, S.L.; Arnold, J.G.; Kiniry, J.R.; Williams, J.R. Soil and Water Assessment Tool Theoretical Documentation Version 2009; Texas Water Resources Institute, USDA Agricultural Research Service: College Station, TX, USA, 2011. [Google Scholar]
- Tawde, S.A.; Singh, C. Investigation of orographic features influencing spatial distribution of rainfall over the Western Ghats of India using satellite data. Int. J. Climatol. 2015, 35, 2280–2293. [Google Scholar] [CrossRef]
- Bai, P.; Liu, X. Evaluation of five satellite-based precipitation products in two gauge-scarce basins on the Tibetan Plateau. Remote Sens. 2018, 10, 1316. [Google Scholar] [CrossRef]


| Input Data Type | Spatial/Temporal Resolution | Source/Period |
|---|---|---|
| SRTM Digital Elevation Model (DEM) | 30 m/- | https://earthexplorer.usgs.gov/ |
| Land use map | 30 m/- | Landsat imageries (http://earthexplorer.usgs.gov/2003) |
| Soil map | 500 m/- | Food and Agriculture Organization of the United Nation (FAO)/2002 |
| Meteorological data (rainfall and min-max temperature) | 0.25°/daily | India Meteorological Department (IMD)/1998–2013 |
| TRMM rainfall data | 0.25°/daily | https://disc.gsfc.nasa.gov |
| CHIRPS rainfall data | 0.05° and 0.25°/daily | ftp://ftp.chg.ucsb.edu/pub/org/chg/products/CHIRPS-2.0/global_daily/netcdf/p25 |
| Meteorological data (solar radiation, relative humidity, and wind velocity) | 0.25°/daily | https://globalweather.tamu.edu/1998–2013 |
| Observed Hydrological data (streamflow) | Point/Daily | Central Water Commission (https://indiawris.gov.in/wris/#/)/ 2006–2012 at Addoor |
| Parameter | Description | Lower Limit | Upper Limit | Optimal Value | Process | |||
|---|---|---|---|---|---|---|---|---|
| S1 | S2 | S3 | S4 | |||||
| r_CN2 | Initial SCS CN II Value | −0.20 | 0.20 | −0.08(2) | 0.18(7) | −0.18(1) | −0.12(4) | Runoff |
| v_GW_DELAY | Groundwater delay (days) | 10 | 350 | 22.09(9) | 309.25(8) | 9.56(4) | 14.61(3) | Groundwater |
| v_CH_K2 | Effective hydraulic conductivity in main channel alluvium (mm/h) | 0 | 500 | 291.50(7) | 483.44(5) | 422.13(8) | 487.19(9) | Channel |
| v_Alpha_Bnk | Baseflow alpha factor for bank storage [days] | 0.5 | 1 | 0.79(1) | 0.70(6) | 0.54(9) | 0.89(8) | Channel |
| r_SOL_AWC | Available water capacity of the soil layer | 0 | 1 | 0.31(3) | 0.79(2) | 0.24(2) | 0.73(2) | Soil |
| v_ALPHA_BF | Base flow alpha factor (day) | 0 | 1 | 0.89(6) | 0.42(9) | 0.43(7) | 0.86(5) | Groundwater |
| v_GWQMN | Threshold depth of water in the shallow aquifer required for return flow to occur (mm) | 0 | 5000 | 4100.8(8) | 1391.14(4) | 1706.12(6) | 3742.63(7) | Groundwater |
| v_ESCO | Soil evaporation compensation factors | 0 | 1 | 0.88(4) | 0.45(3) | 0.41(5) | 0.36(6) | Evaporation |
| v_GW_REVAP | Groundwater “revap” coefficient | 0.02 | 0.2 | 0.17(5) | 0.02(1) | 0.11(3) | 0.19(1) | Groundwater |
| TRMM | CHIRPS 0.25 | CHIRPS 0.05 | |
|---|---|---|---|
| POD | 0.74 | 0.71 | 0.58 |
| FAR | 0.11 | 0.18 | 0.16 |
| CSI/TS | 0.67 | 0.85 | 0.52 |
| CC | 0.56 | 0.47 | 0.47 |
| Bias | 0.91 | 1.02 | 1.02 |
| RMSE | 19.44 | 22.78 | 23.74 |
| Scenario | Period of the Model Run | IMD Rainfall Based Model | TRMM Rainfall Based Model | CHIRPS-0.25 Rainfall Based Model | CHIRPS 0.05 Rainfall Based Model | ||||||||
|---|---|---|---|---|---|---|---|---|---|---|---|---|---|
| NSE | PBIAS | R2 | NSE | PBIAS | R2 | NSE | PBIAS | R2 | NSE | PBIAS | R2 | ||
| 1 | Calibration | 0.86 | 0.87 | 0.86 | 0.66 | −21.69 | 0.74 | 0.61 | −7.21 | 0.61 | 0.65 | −2.32 | 0.66 |
| Validation | 0.76 | −13.50 | 0.81 | 0.70 | −12.92 | 0.73 | 0.57 | −7.03 | 0.57 | 0.63 | 0.44 | 0.64 | |
| 2 | Calibration | 0.75 | 10.71 | 0.77 | 0.71 | −14.98 | 0.75 | 0.55 | 4.90 | 0.56 | 0.54 | −1.85 | 0.58 |
| Validation | 0.72 | −5.52 | 0.73 | 0.71 | −8.18 | 0.72 | 0.55 | 3.98 | 0.56 | 0.55 | 2.40 | 0.59 | |
| 3 | Calibration | 0.73 | 2.08 | 0.73 | 0.63 | −27.25 | 0.74 | 0.64 | −6.20 | 0.65 | 0.63 | −0.70 | 0.64 |
| Validation | 0.67 | −13.19 | 0.70 | 0.67 | −19.22 | 0.73 | 0.62 | −7.41 | 0.63 | 0.61 | 1.66 | 0.62 | |
| 4 | Calibration | 0.75 | −0.91 | 0.75 | 0.60 | −30.8 | 0.74 | 0.67 | −9.67 | 0.65 | 0.66 | −13.76 | 0.69 |
| Validation | 0.70 | −16.09 | 0.65 | 0.66 | −22.60 | 0.75 | 0.62 | −10.71 | 0.65 | 0.65 | −11.01 | 0.67 | |
© 2020 by the authors. Licensee MDPI, Basel, Switzerland. This article is an open access article distributed under the terms and conditions of the Creative Commons Attribution (CC BY) license (http://creativecommons.org/licenses/by/4.0/).
Share and Cite
Sharannya, T.M.; Al-Ansari, N.; Deb Barma, S.; Mahesha, A. Evaluation of Satellite Precipitation Products in Simulating Streamflow in a Humid Tropical Catchment of India Using a Semi-Distributed Hydrological Model. Water 2020, 12, 2400. https://doi.org/10.3390/w12092400
Sharannya TM, Al-Ansari N, Deb Barma S, Mahesha A. Evaluation of Satellite Precipitation Products in Simulating Streamflow in a Humid Tropical Catchment of India Using a Semi-Distributed Hydrological Model. Water. 2020; 12(9):2400. https://doi.org/10.3390/w12092400
Chicago/Turabian StyleSharannya, Thalli Mani, Nadhir Al-Ansari, Surajit Deb Barma, and Amai Mahesha. 2020. "Evaluation of Satellite Precipitation Products in Simulating Streamflow in a Humid Tropical Catchment of India Using a Semi-Distributed Hydrological Model" Water 12, no. 9: 2400. https://doi.org/10.3390/w12092400
APA StyleSharannya, T. M., Al-Ansari, N., Deb Barma, S., & Mahesha, A. (2020). Evaluation of Satellite Precipitation Products in Simulating Streamflow in a Humid Tropical Catchment of India Using a Semi-Distributed Hydrological Model. Water, 12(9), 2400. https://doi.org/10.3390/w12092400