A Dynamic Comparison Sustainability Study of Standard Wastewater Treatment System in the Straw Pulp Papermaking Process and Printing & Dyeing Papermaking Process Based on the Hybrid Neural Network and Emergy Framework


Abstract
1. Introduction
2. Methodology
2.1. Study Boundary and Data Collection
2.2. Primary Treatment Processes of WTSPP and WTPDP
2.3. Two Emergy Diagrams of Standard Wastewater Treatment in the Papermaking Plant
2.4. Wastewater Treatment Emergy Fundamental Calculated Process
2.4.1. Energy-Emergy Calculation
2.4.2. Material-Emergy Calculation
2.4.3. Service-Emergy Calculation
2.4.4. Waste-Emergy Calculation
2.4.5. Structural Emergy Flow in the Wastewater Treatment System
- (1)
- wastewater treatment input emergy: renewable energy-emergy, nonrenewable resource-emergy (material-emergy), nonrenewable energy-emergy (energy product emergy), service-emergy.
- (2)
- wastewater treatment output emergy: waste-emergy and main product emergy.
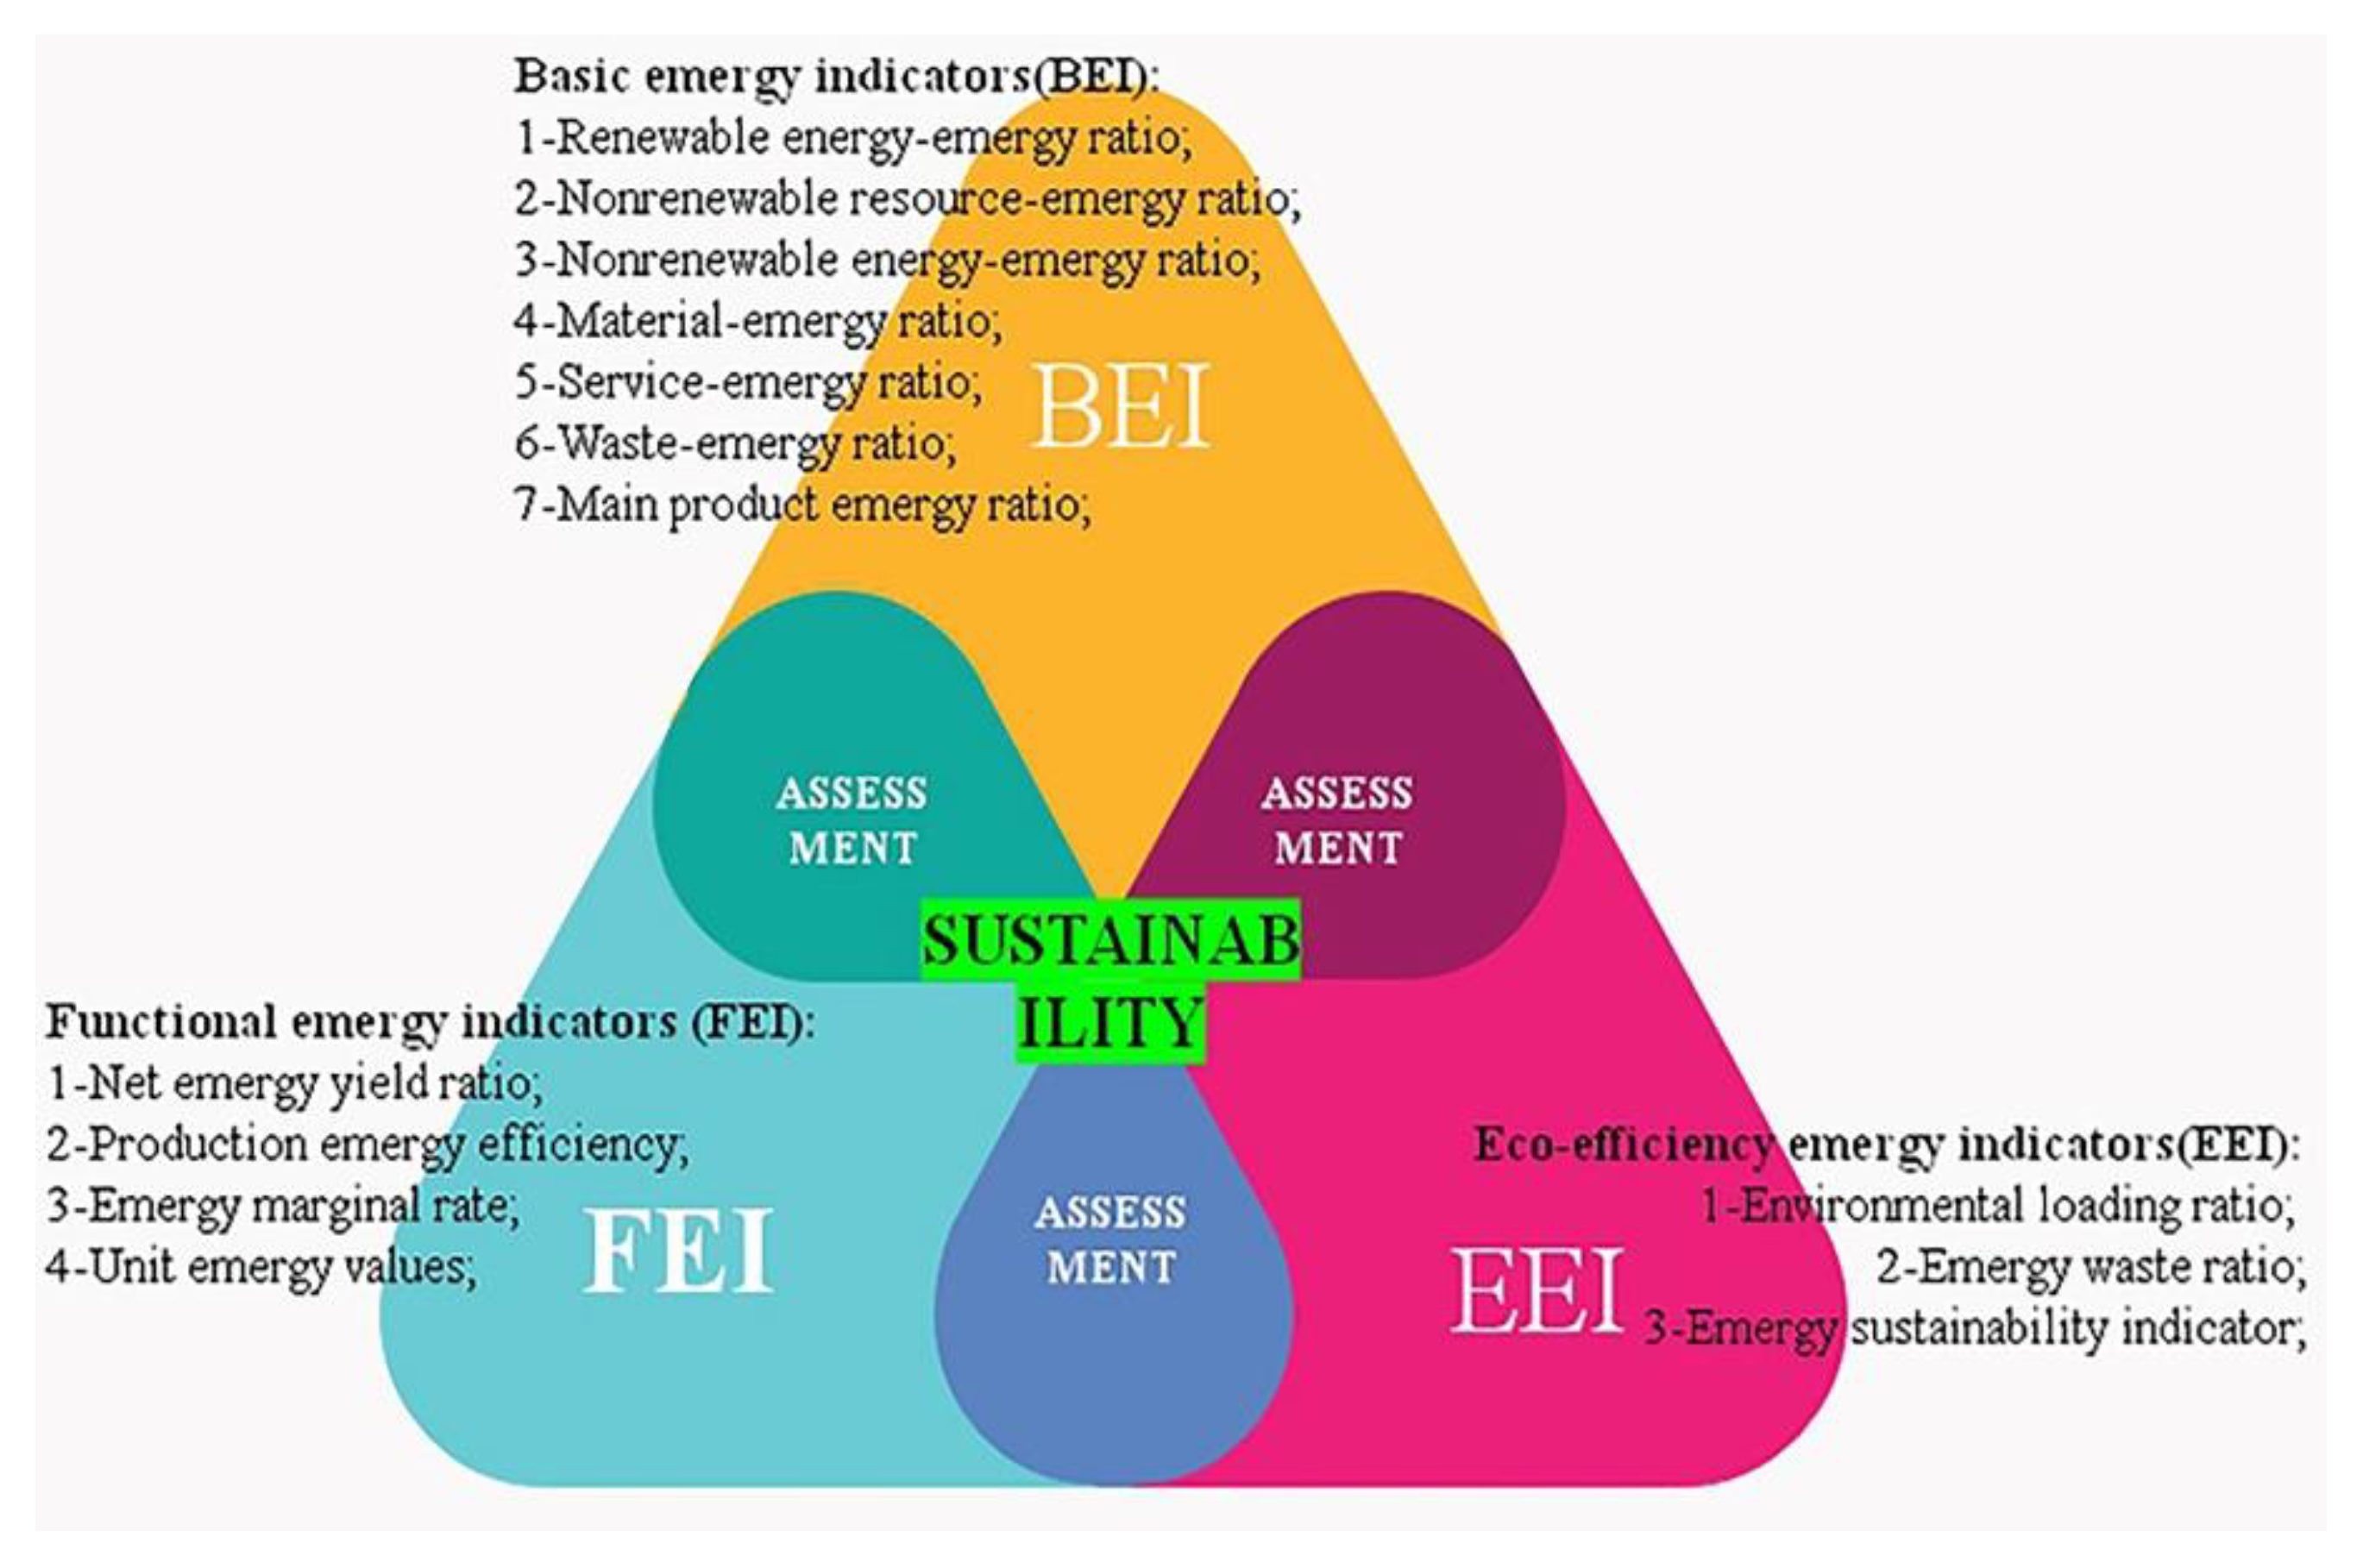
2.5. Wastewater System Emergy Indicators
2.5.1. Basic Emergy Indicators
2.5.2. Functional Emergy Indicators
- (1)
- Net emergy yield ratio (NEYR)
- (2)
- Production emergy efficiency (PEE)
- (3)
- Emergy marginal rate (EMR)
- (4)
- Unit emergy values (UEVs)
2.5.3. Eco-Efficiency Emergy Indicators
- (1)
- Environmental loading ratio (ELR)
- (2)
- Emergy waste ratio (EWR)
- (3)
- Emergy sustainability indicator (ESI)
3. Sustainability Assessment of Two Standard Wastewater Treatment system
3.1. Primary Emergy Table Calculation and Analysis
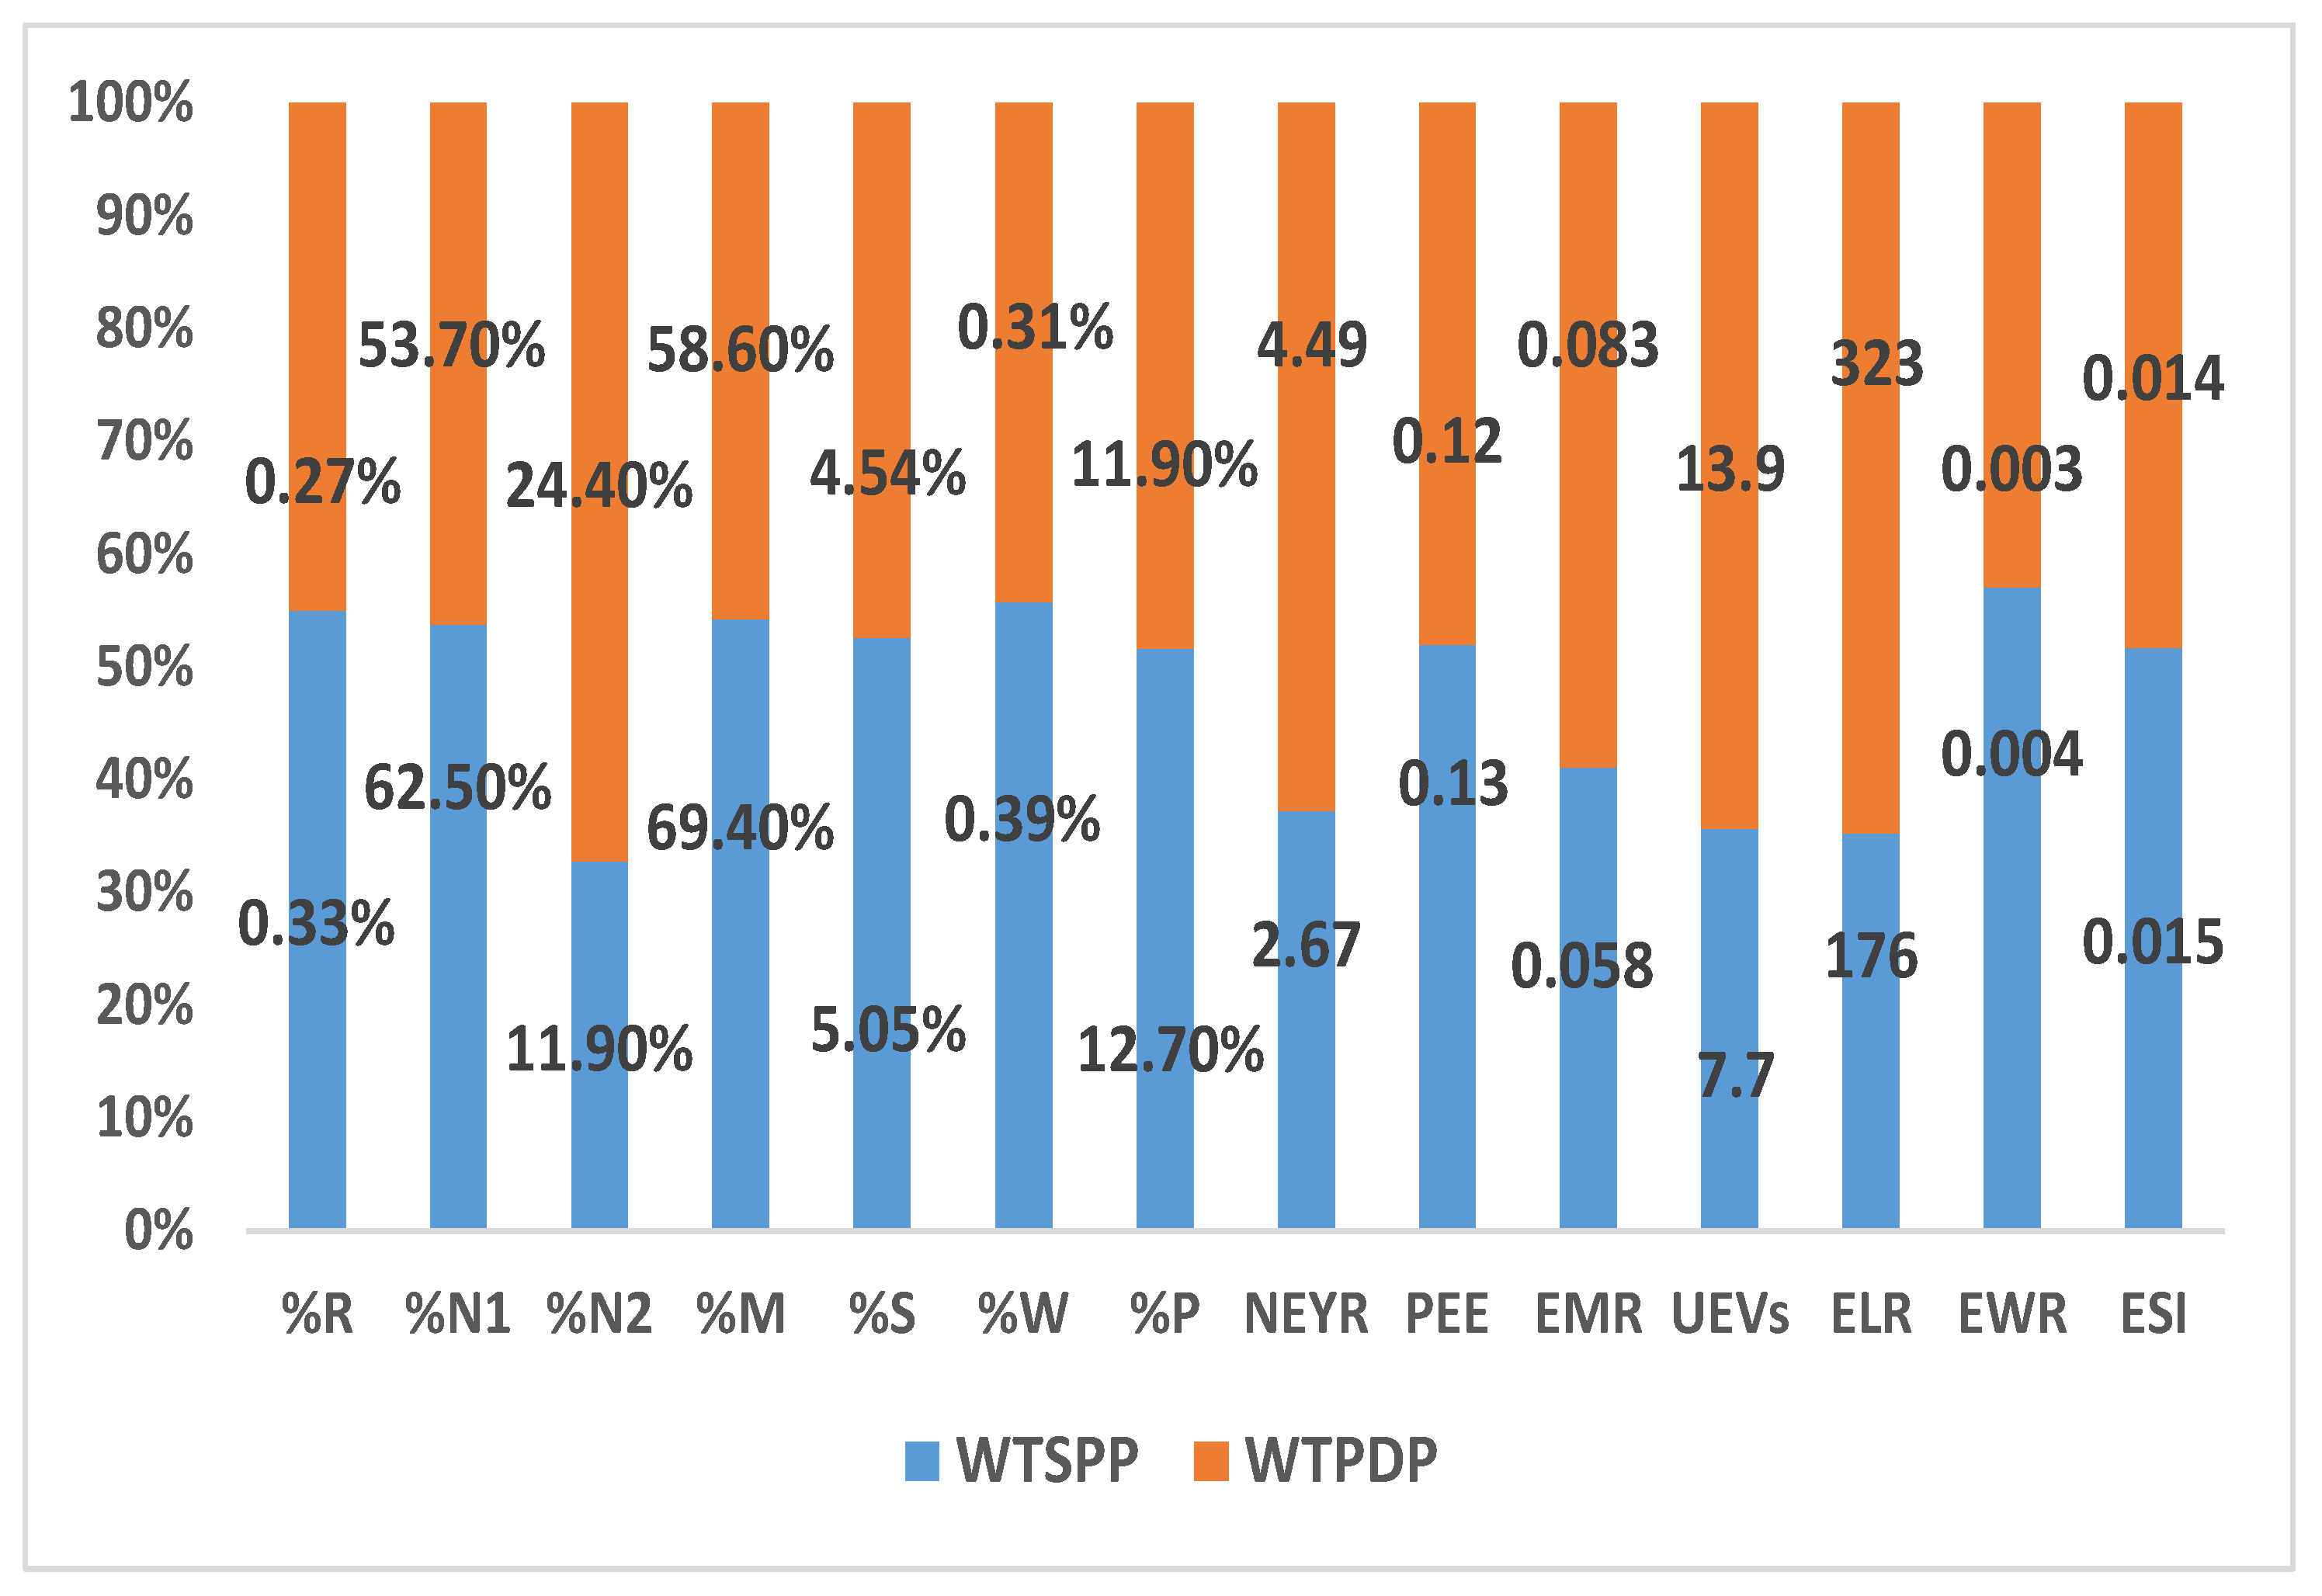
3.2. Entire Sustainability Indicators Analysis
4. Emergy Sustainability Information Analysis Based on the Neural Network Framework
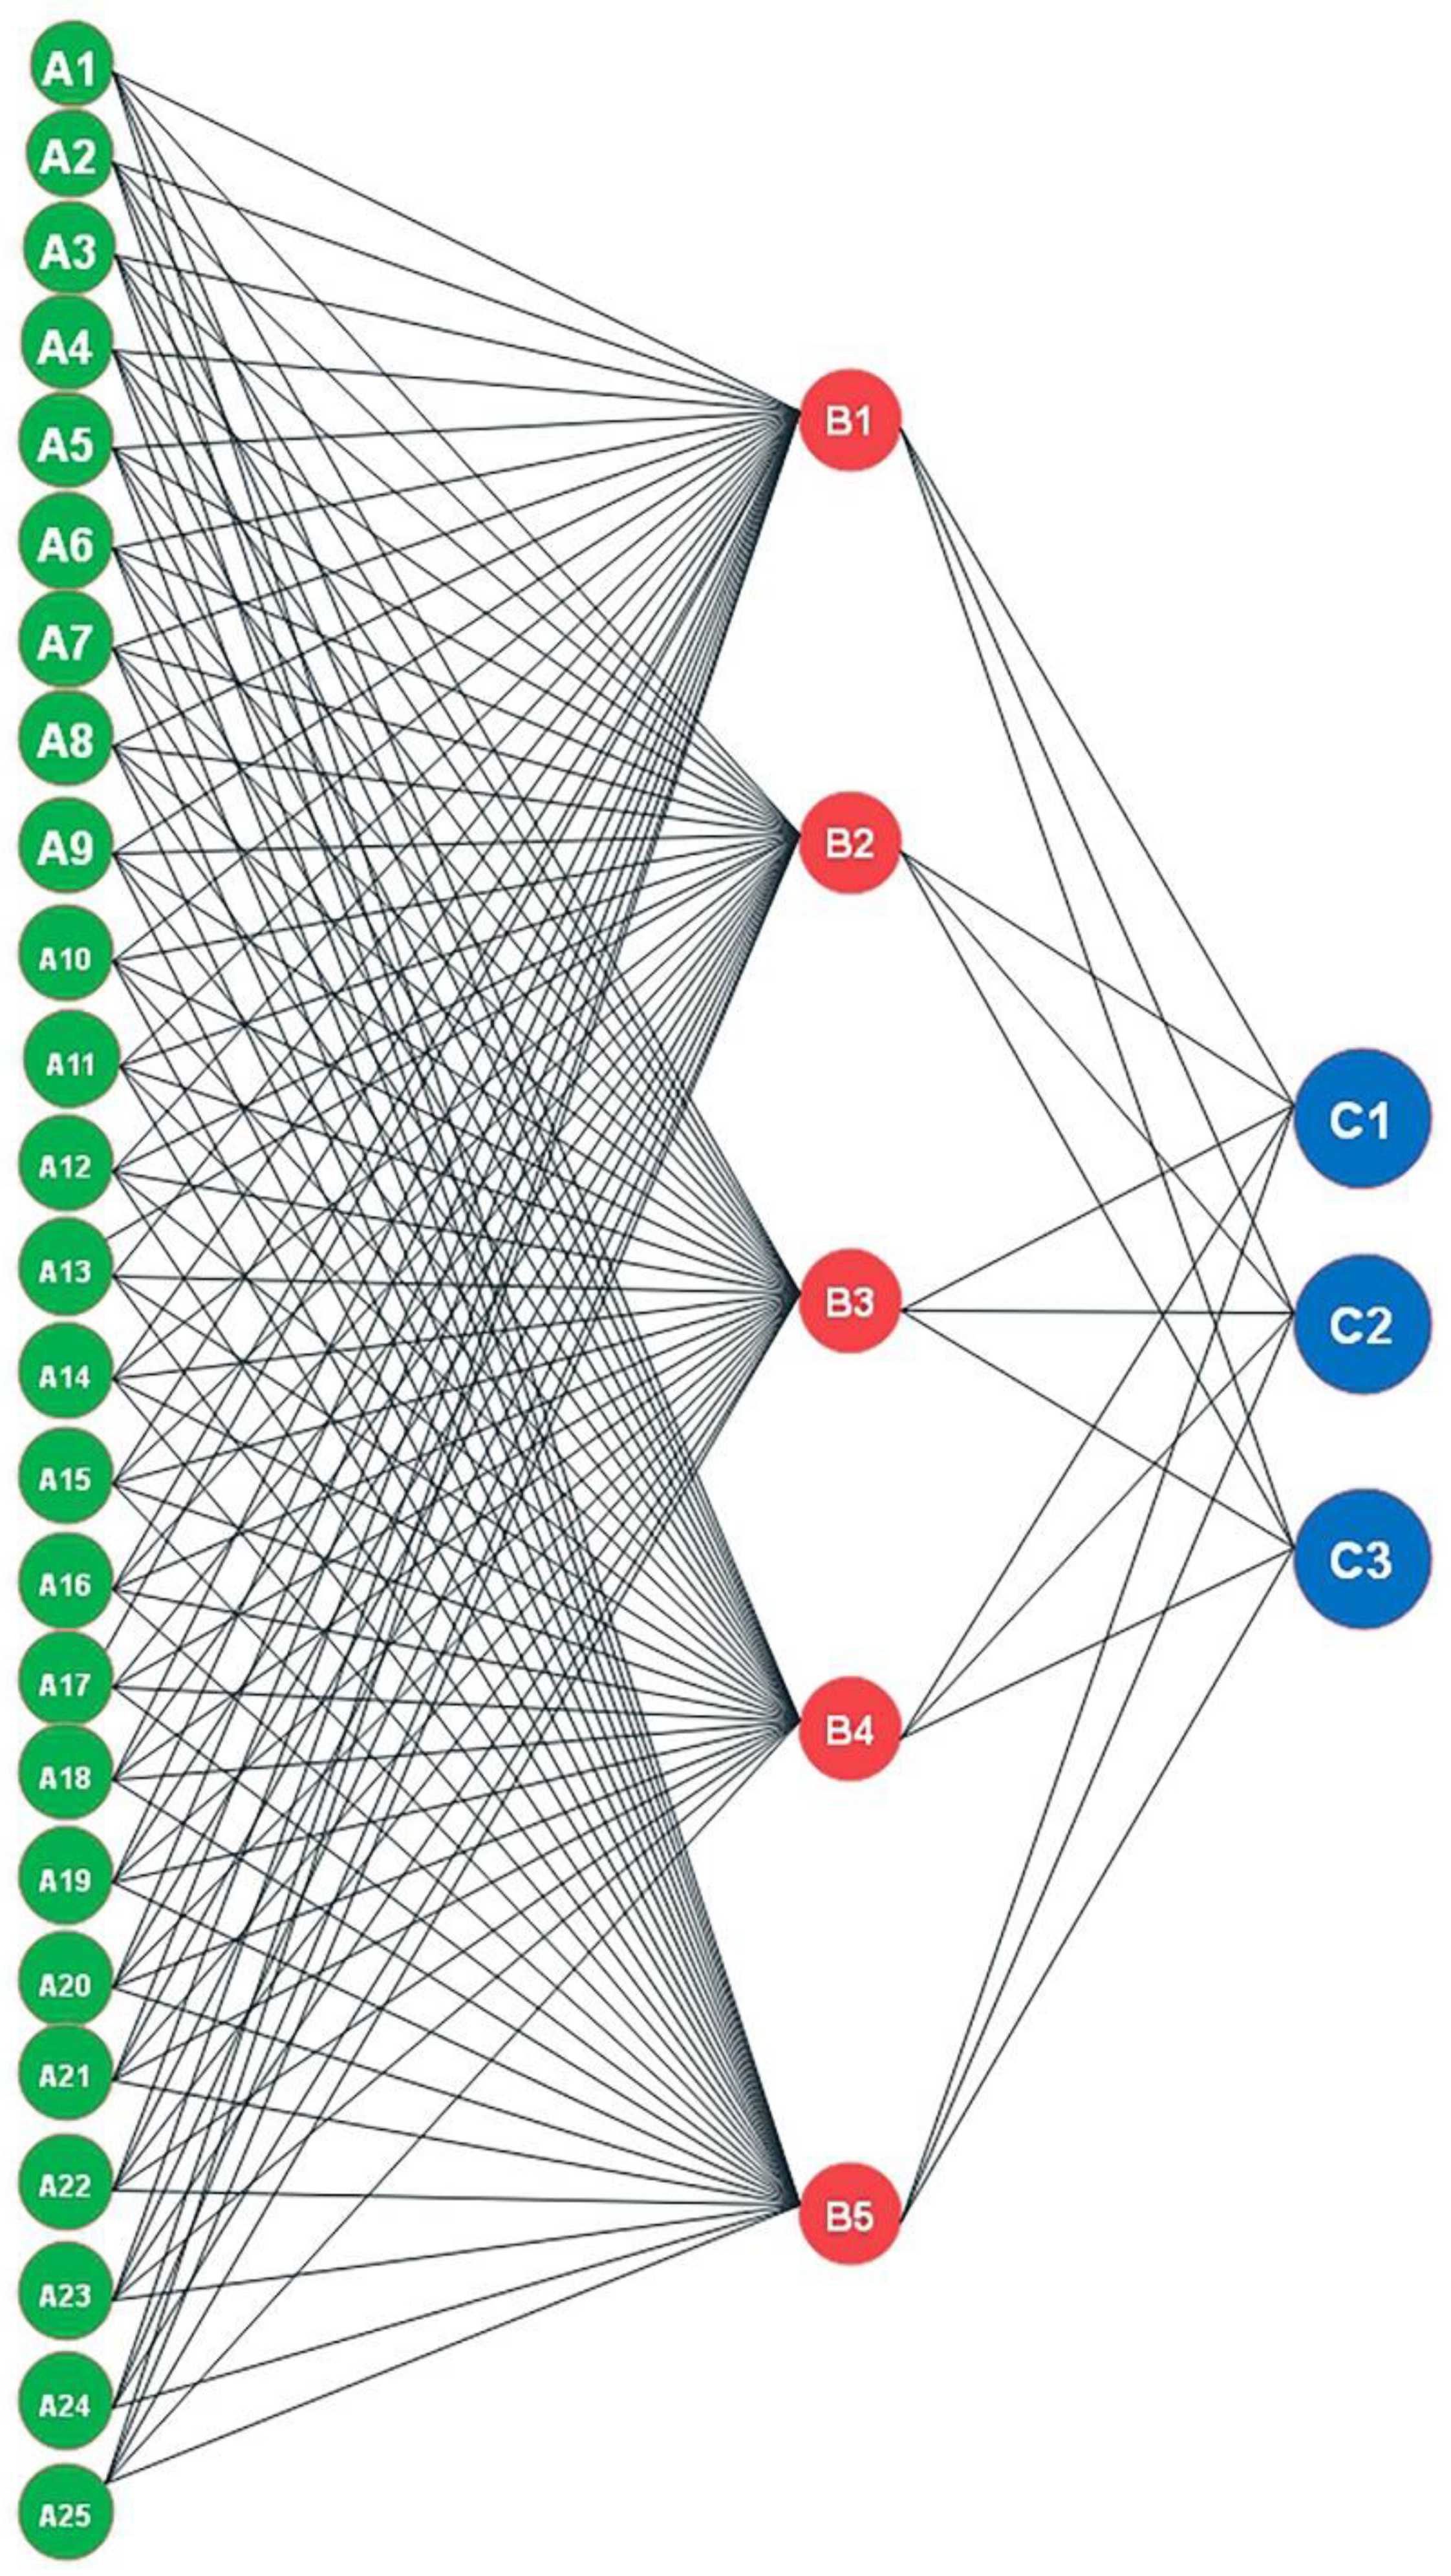
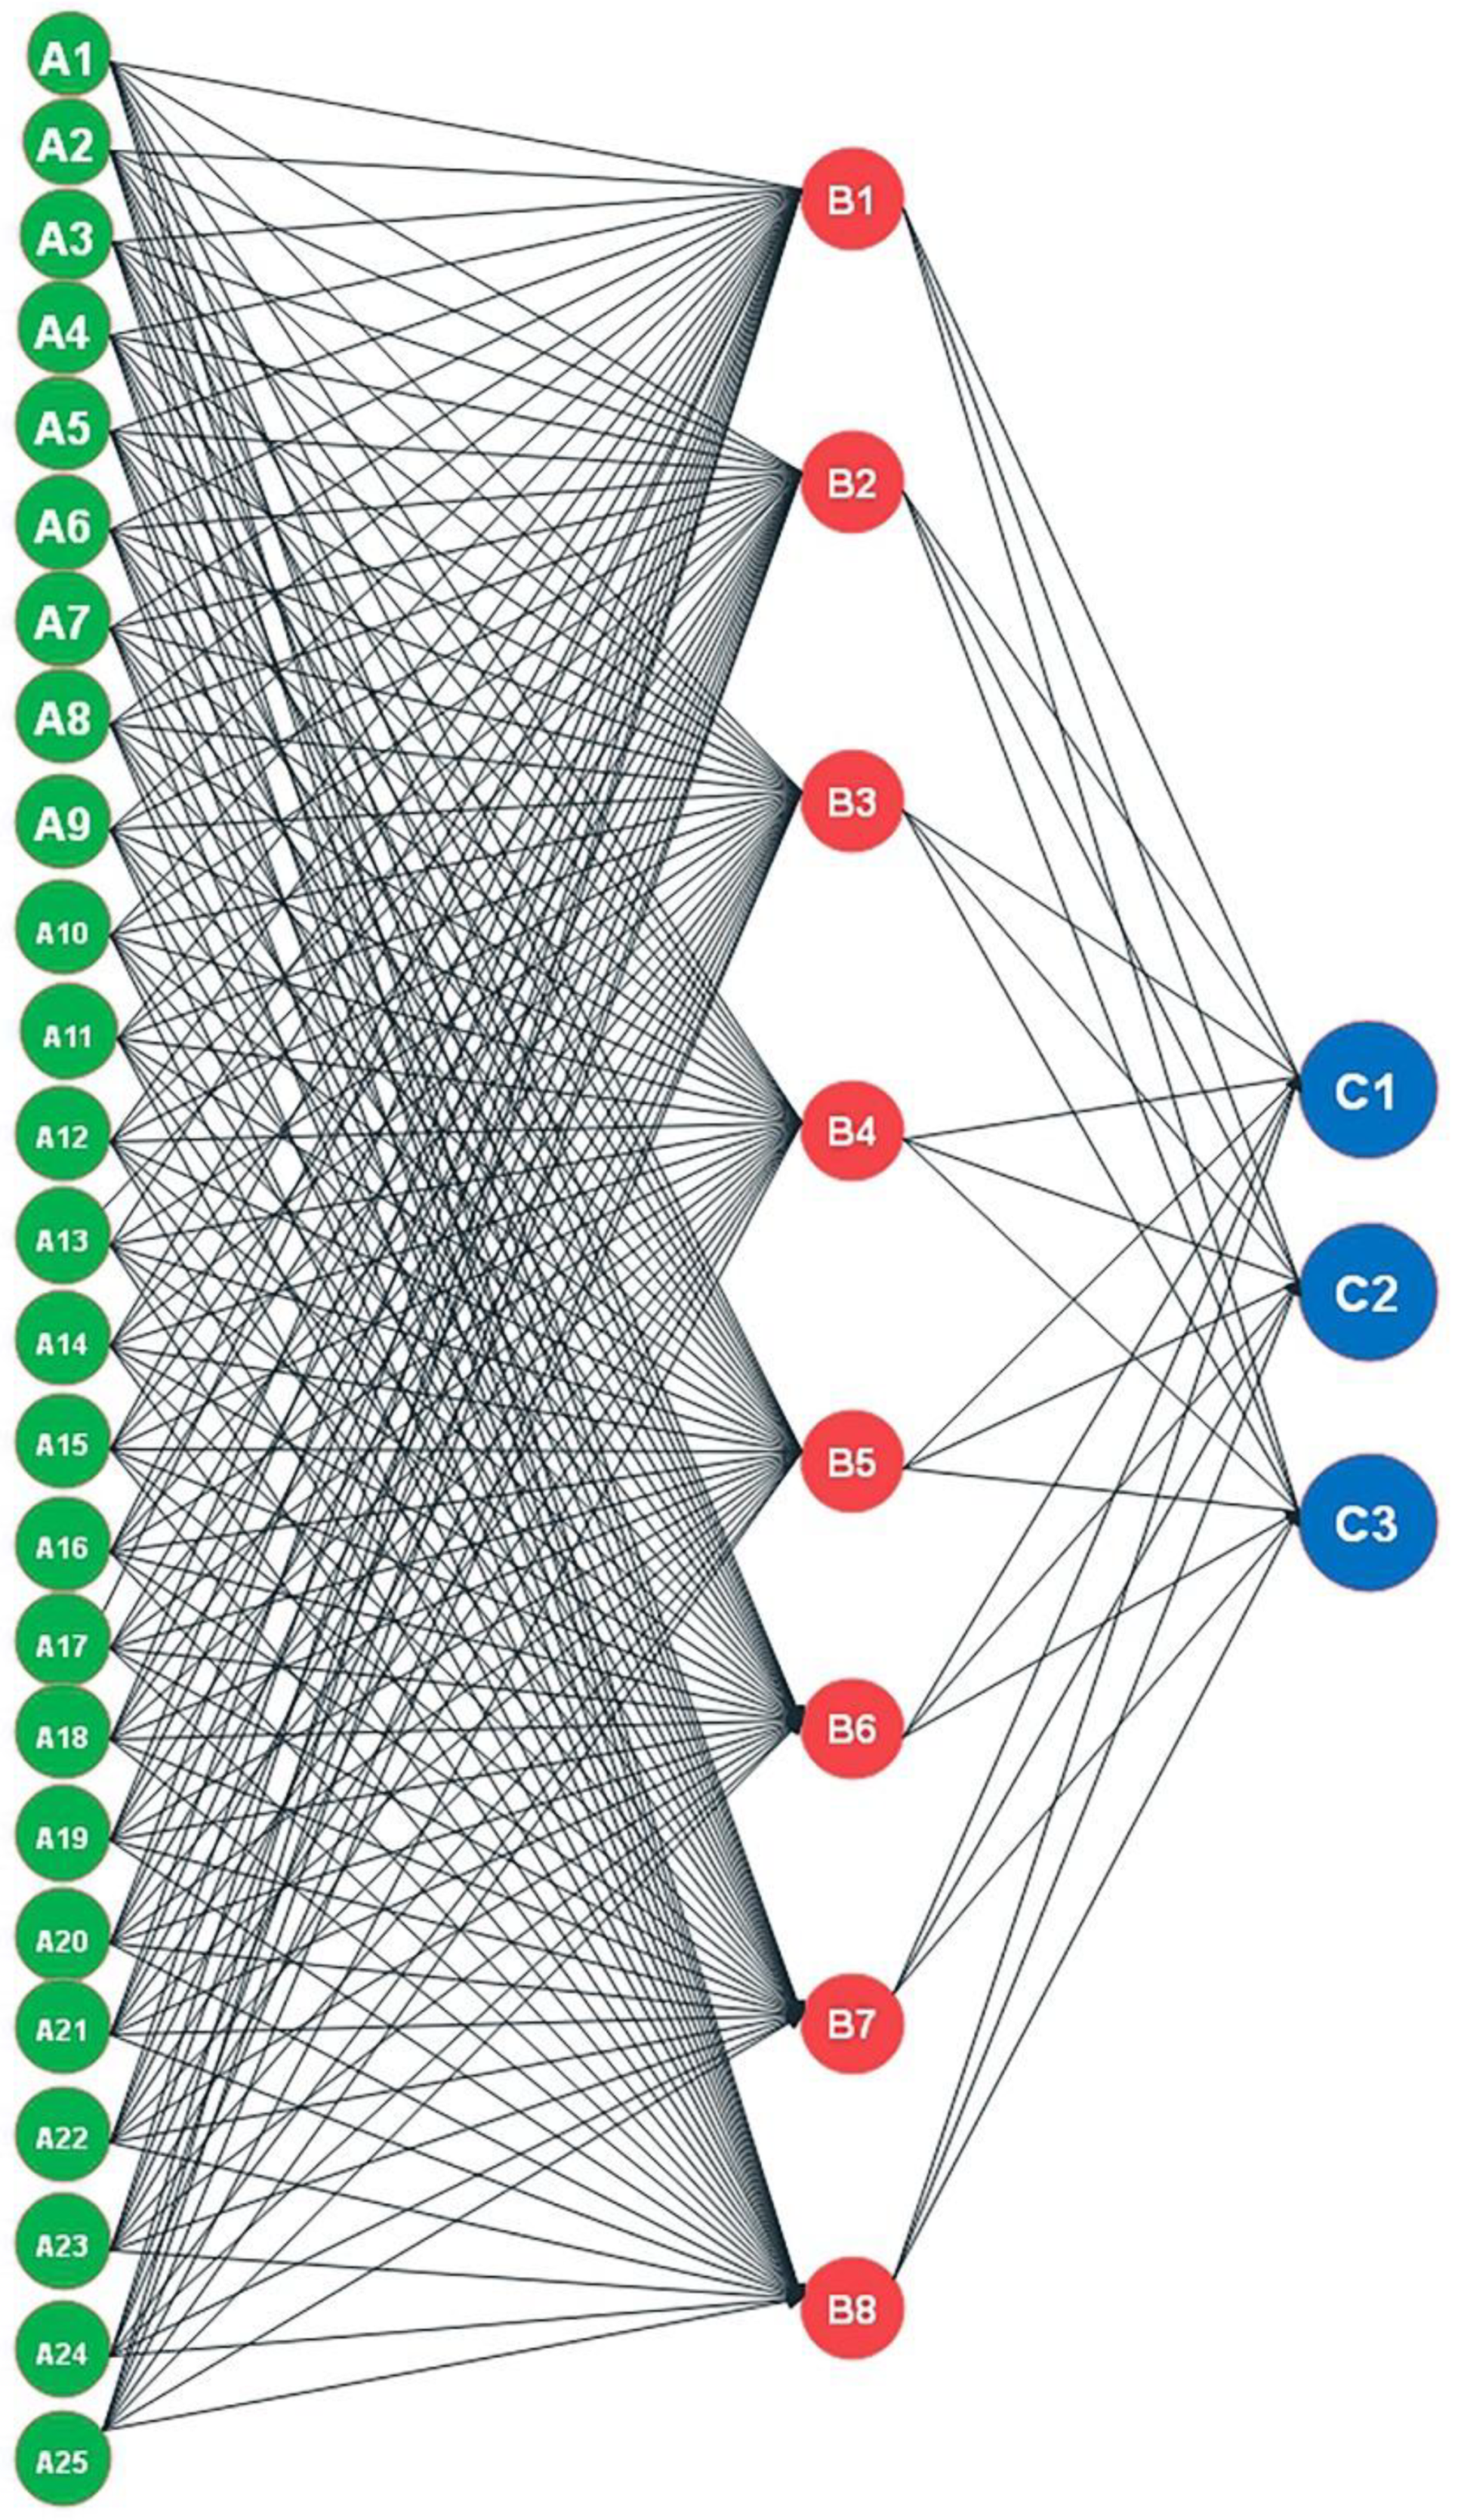
4.1. Basic Neural Network Model of WTSPP and WTPDP
4.2. Neural Network Roadmaps of WTSPP and WTPDP
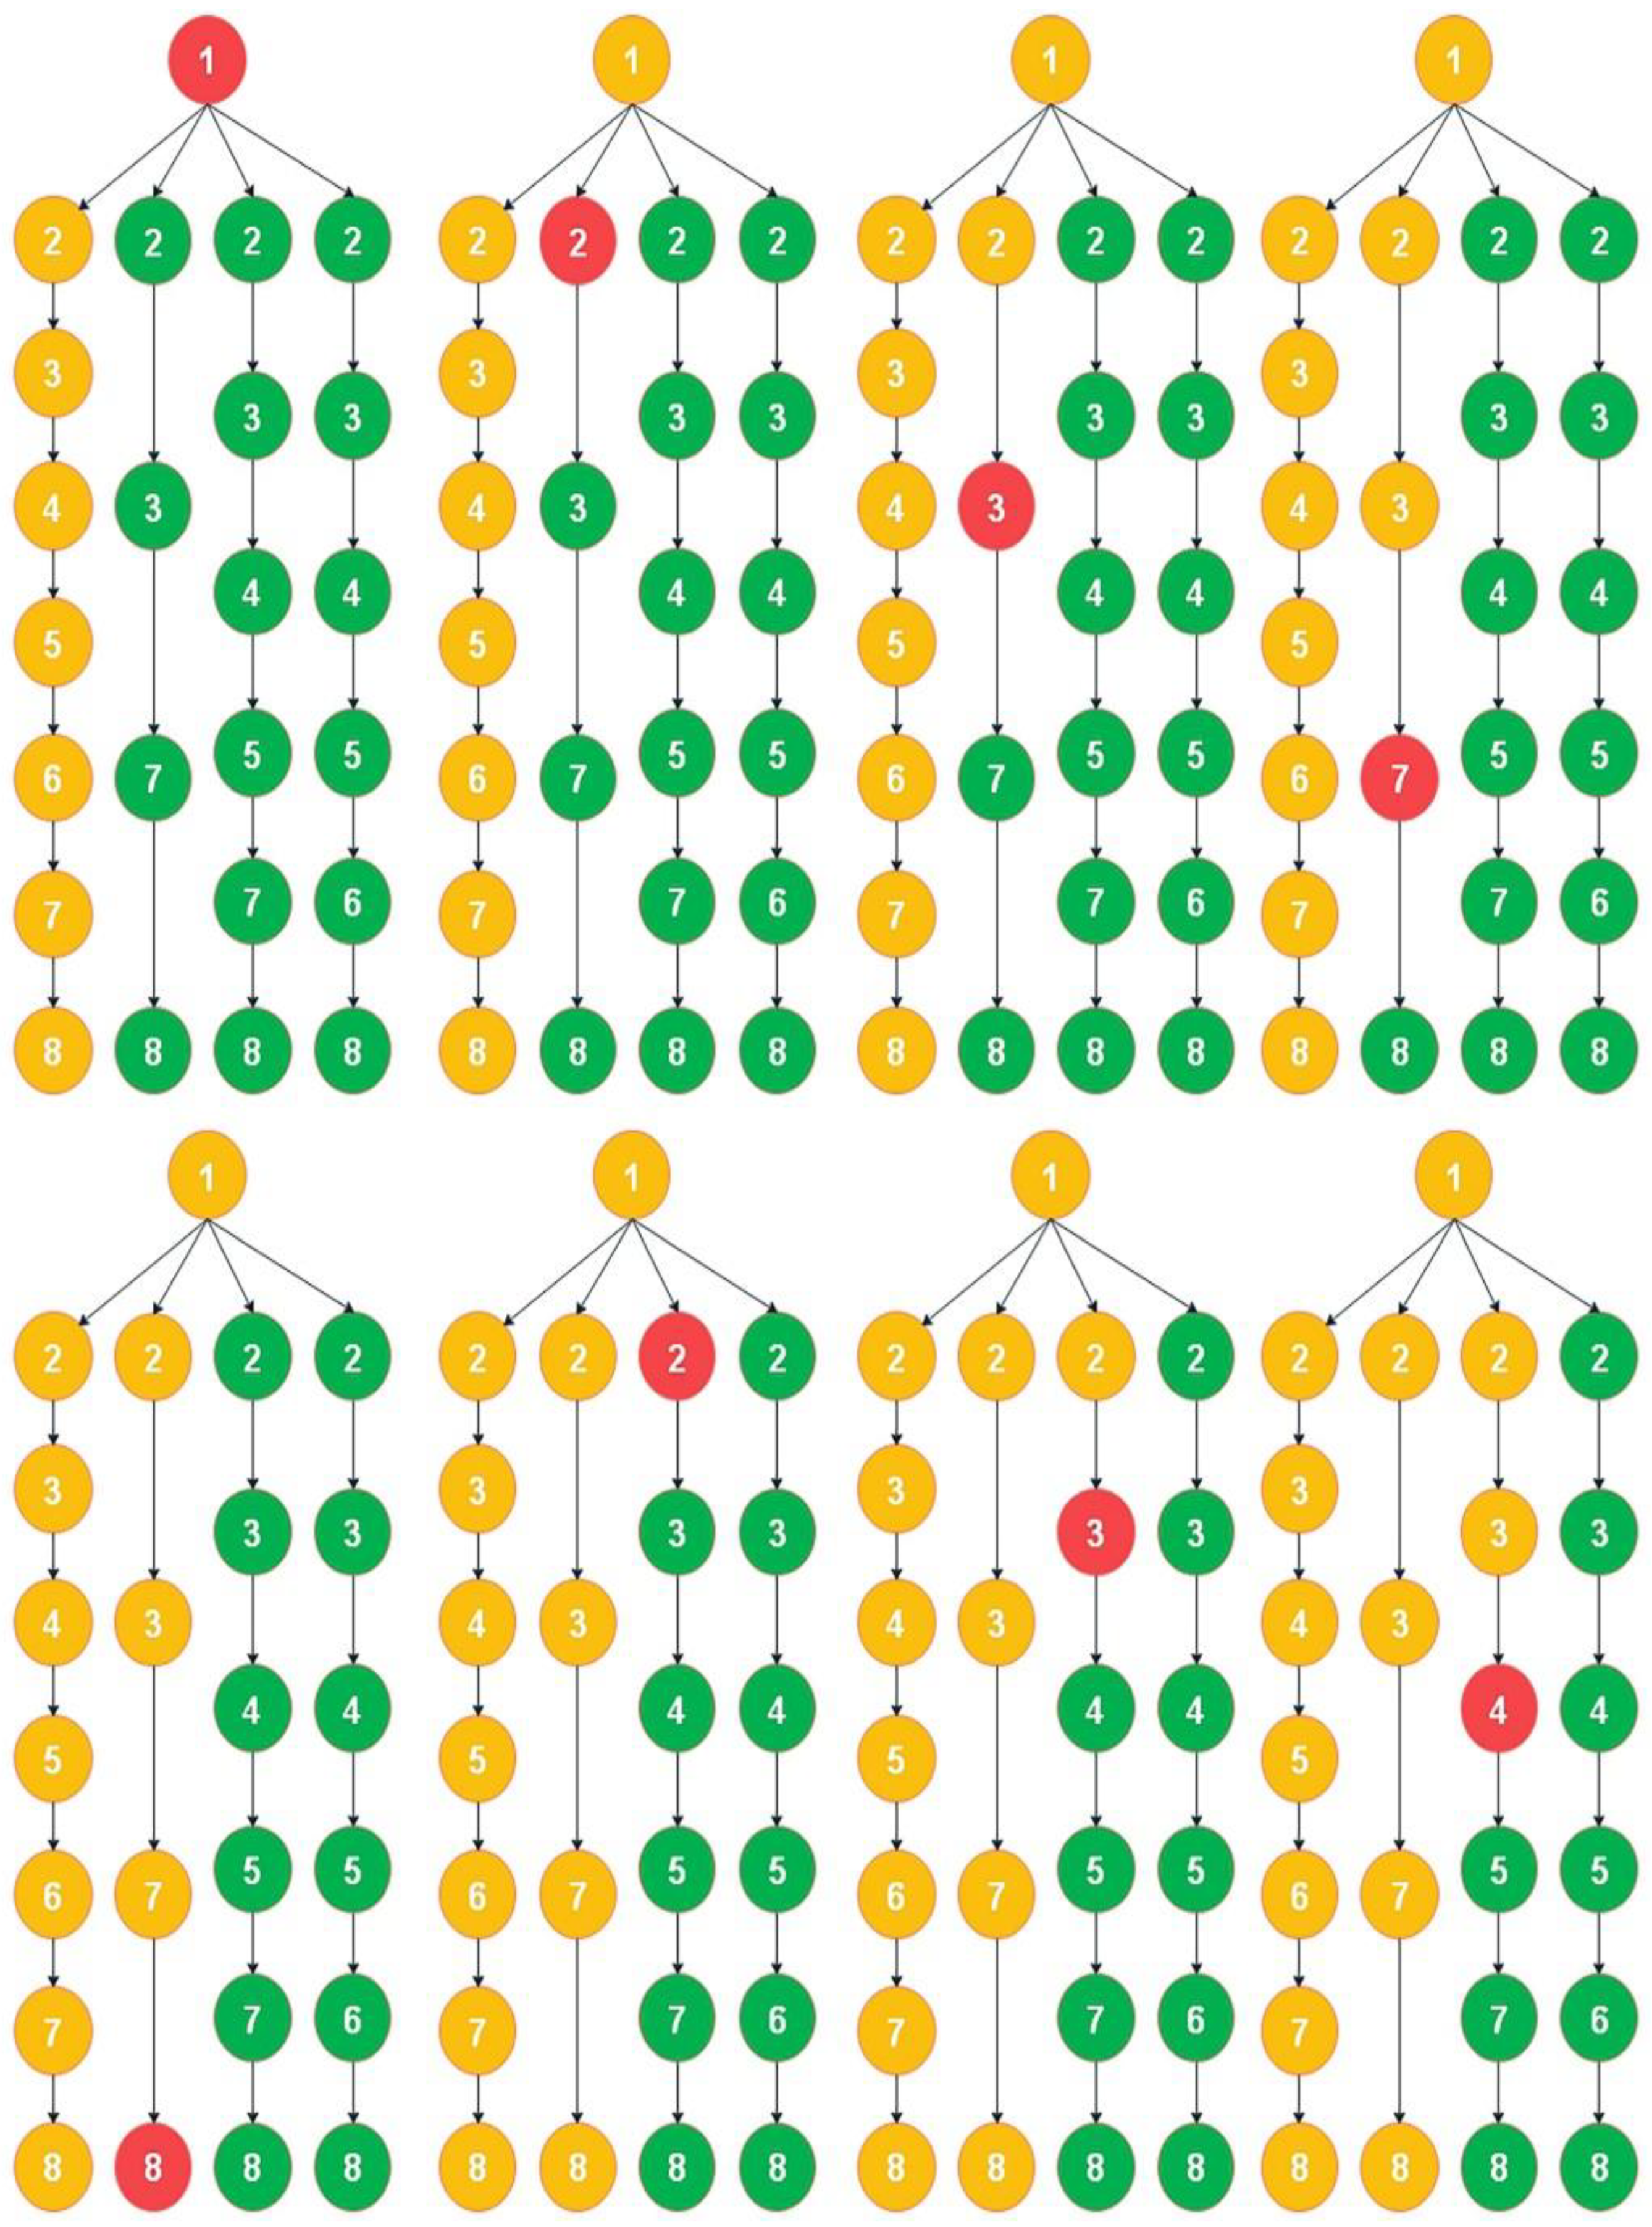
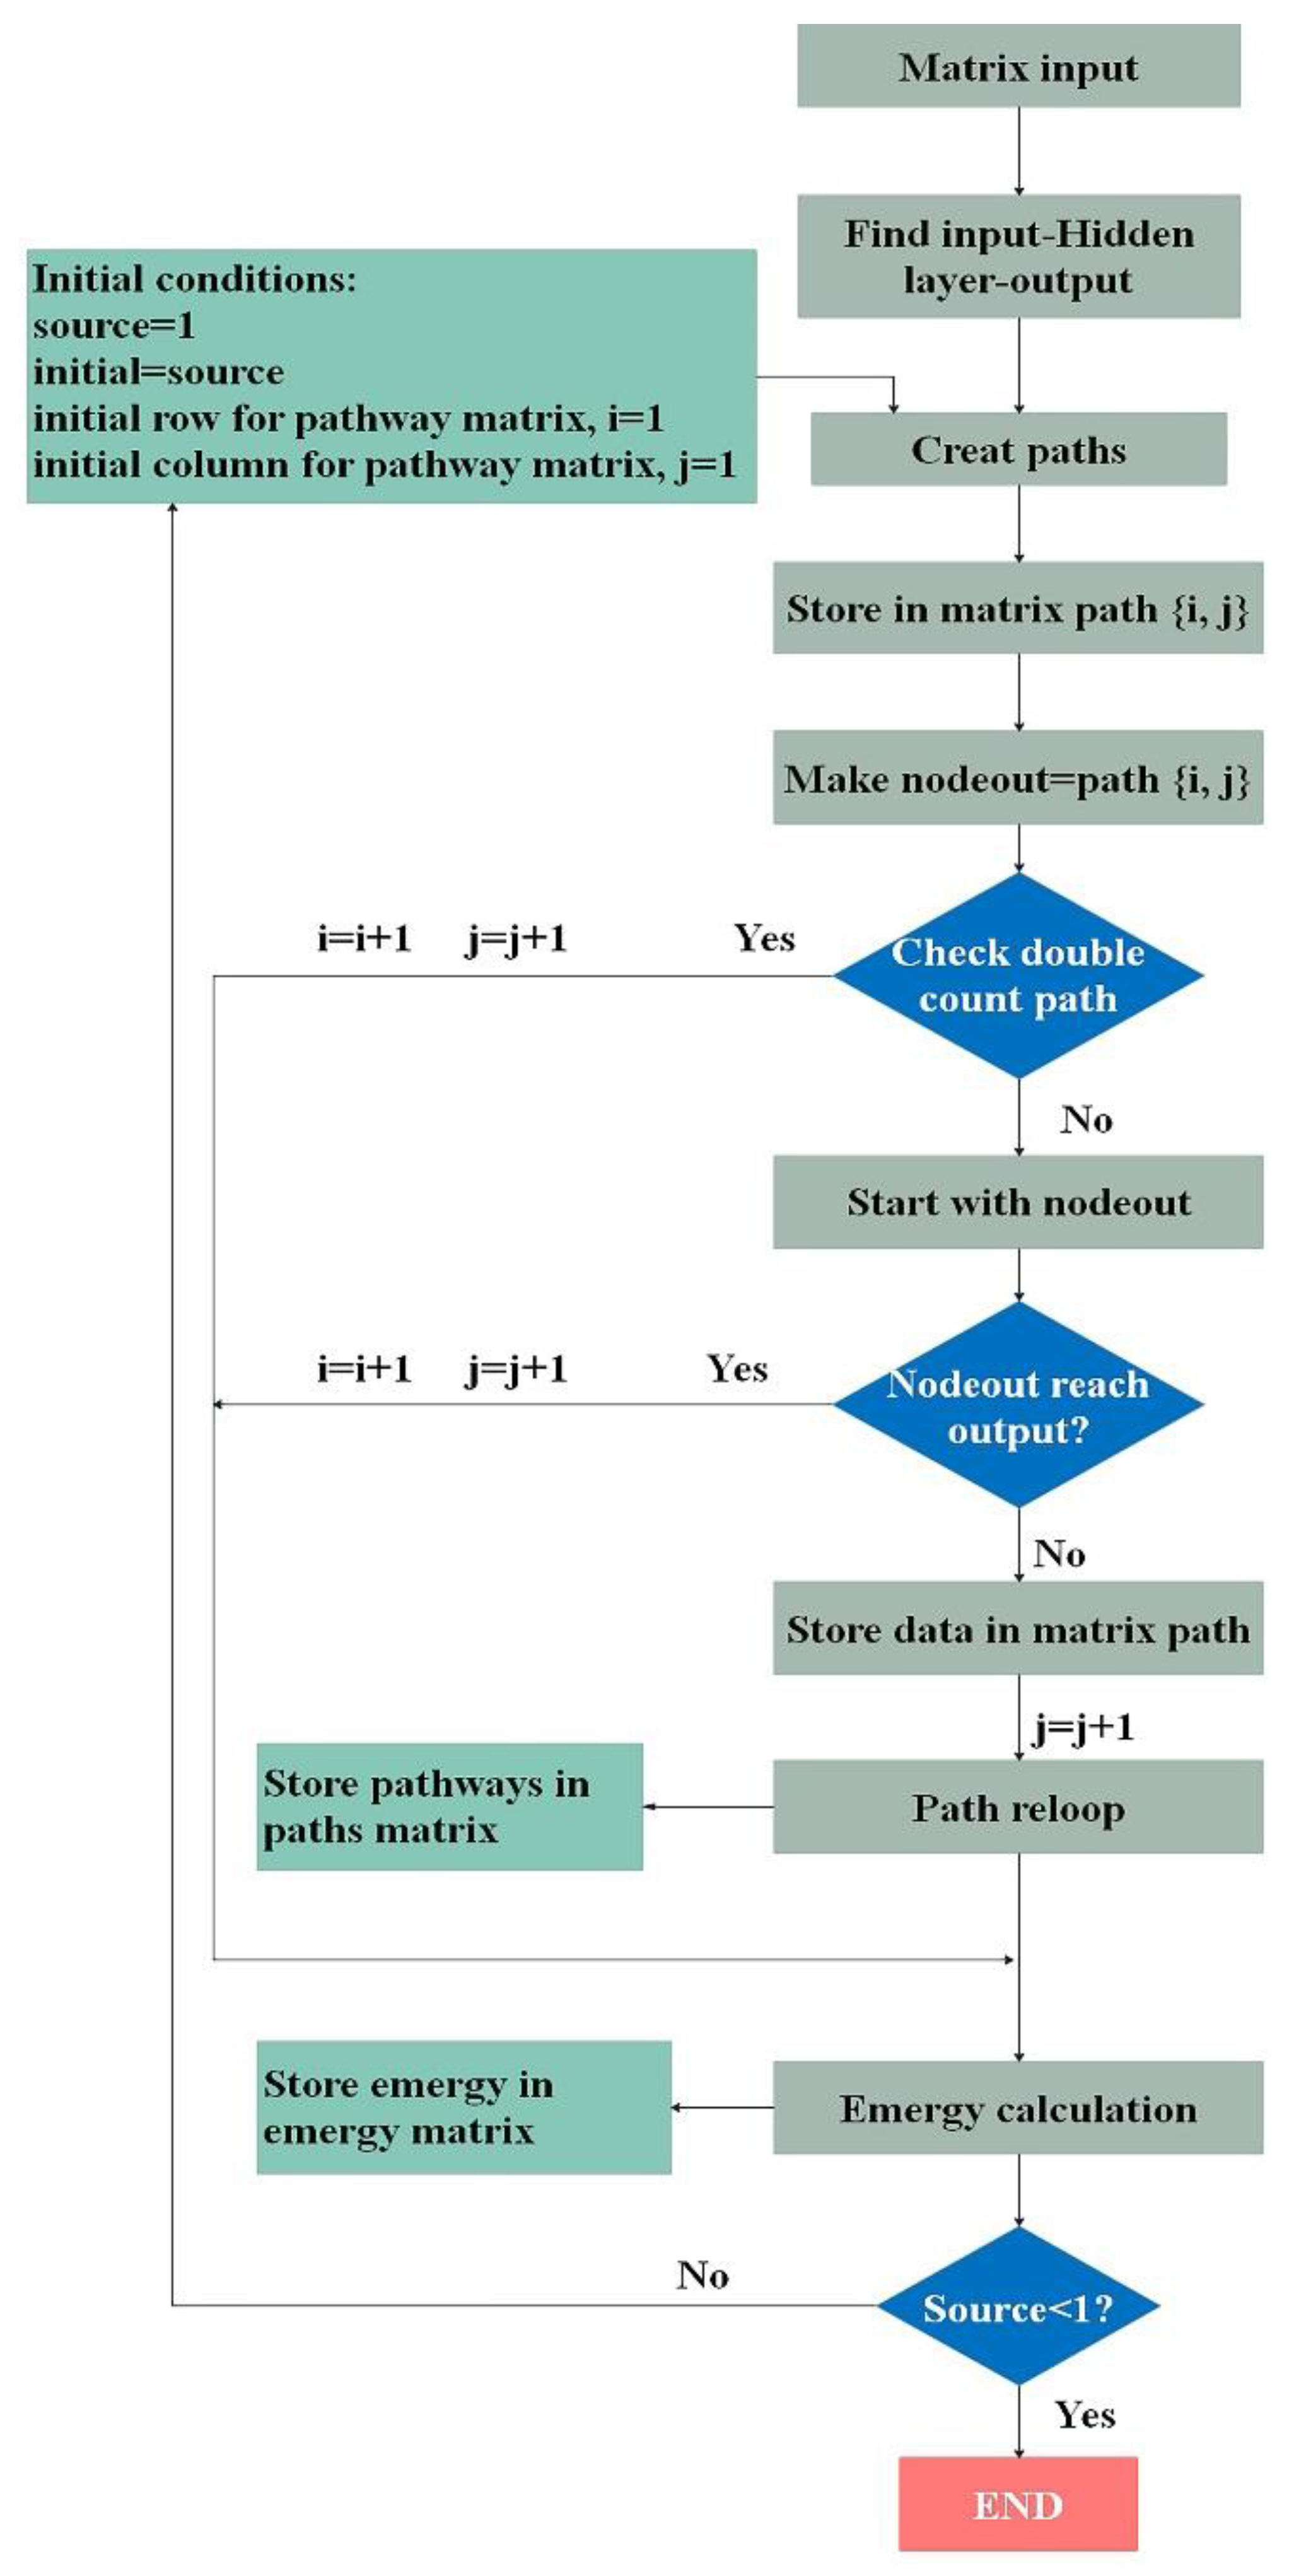
4.3. Neural Network Iteration Path and Algorithm Operation Diagram of WTSPP and WTPDP
4.4. WTSPP and WTPDP Emergy Results Analysis Based on Neural Network
4.4.1. WTSPP and WTPDP Models Sustainability Indicators (ESI) Iterative Result Analysis
4.4.2. WTSPP and WTPDP Models Sustainability Indicators (ESI) Data Regression Analysis
4.4.3. WTSPP and WTPDP Models Sustainability Indicators (ESI) Error Analysis
5. Conclusions
- (1)
- For WTSPP, nonrenewable resources emergy is the primary contributor and accounts for roughly 62.5%, much higher than other proportions. In addition, output emergy is 13.1%, followed by 11.9% of energy input emergy, 6.9% of wastewater treatment chemicals input emergy, 5.05% of service emergy and 0.49% of renewable emergy.
- (2)
- For WTPDP, nonrenewable resources emergy is also the most significant contributor in the entire emergy of WTPDP (53.7%). Energy emergy becomes the second most important factor, accounting for approximately 24.4% of the whole WTPDP emergy, much larger than WTSPP (about 11.9%).
- (3)
- As the vital indicator group, the environmental loading ratio (ELR) is 176 in the WTSPP and 323 in the WTPDP, respectively. Emergy sustainability indicators (ESIs) in the WTSPP and WTPDP, are 0.015 and 0.014, respectively.
- (4)
- Comprehensive calculation results of WTSPP and WTPDP have been conducted based on MATLAB software simulations.
- (5)
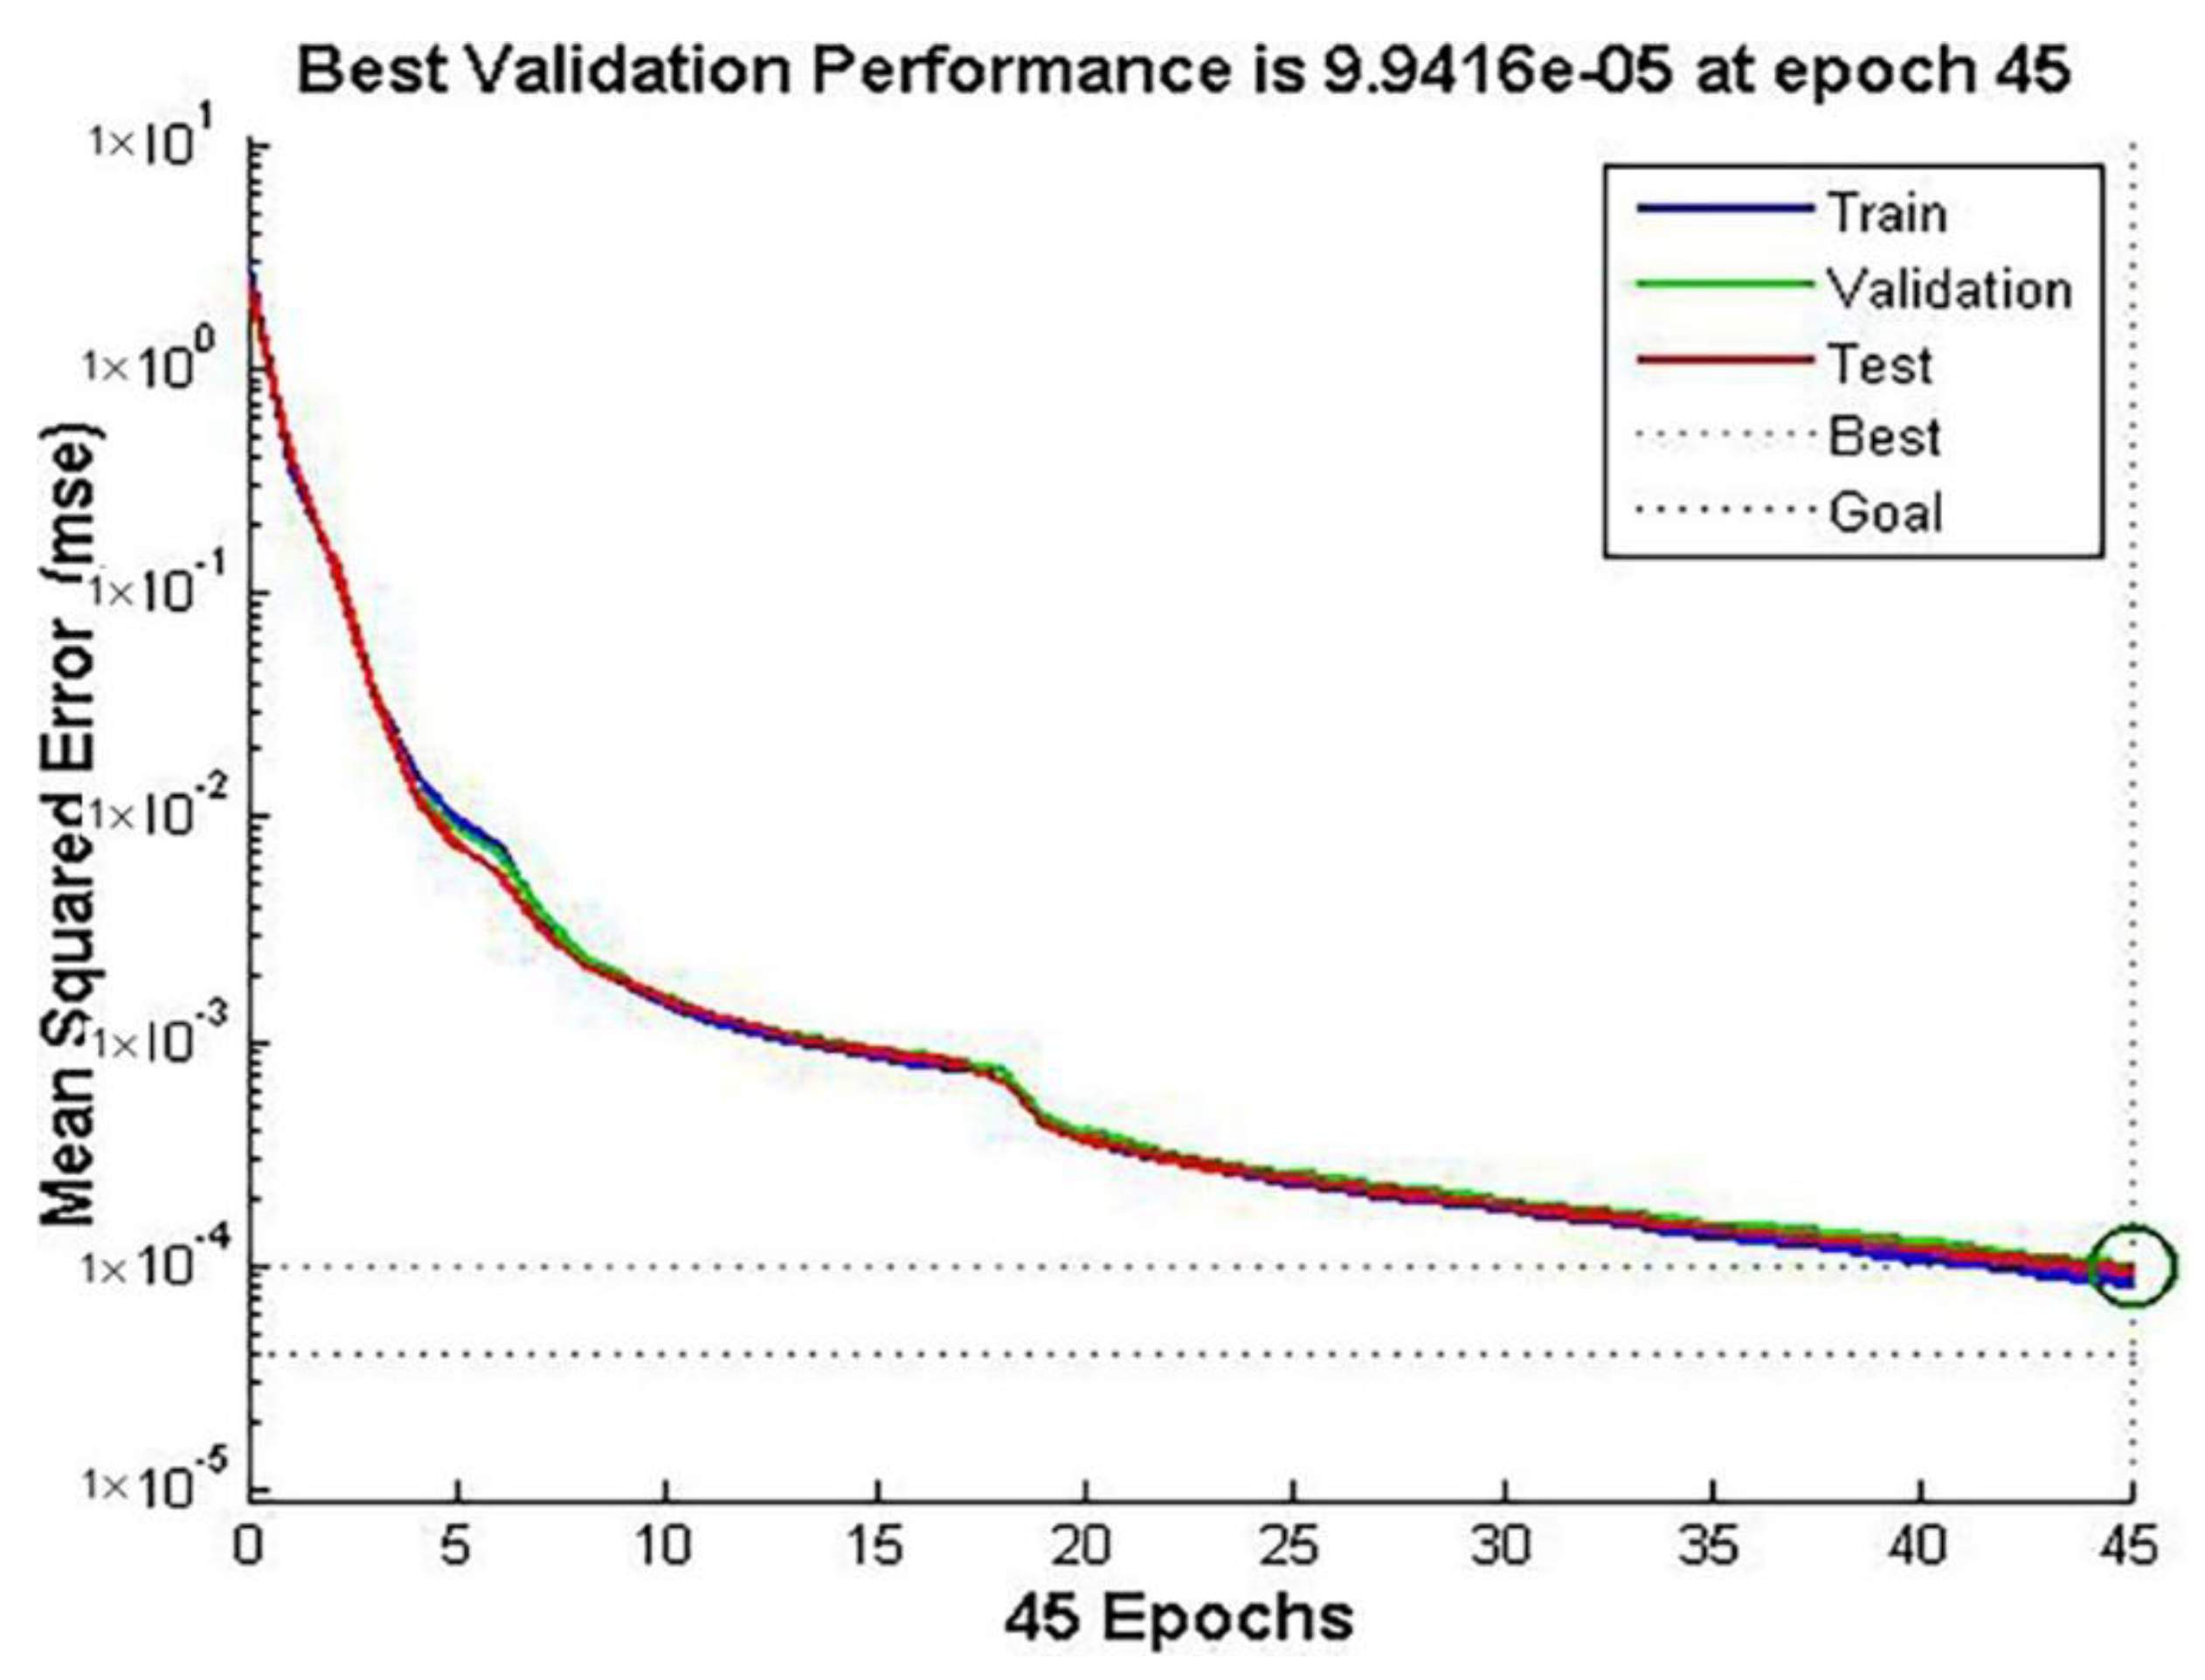
- For the WTSPP, the 45th step has the best validation performance about sustainability. Compared with this result, it only needs 63 steps to get the optimal outcome for WTPDP.
- (6)
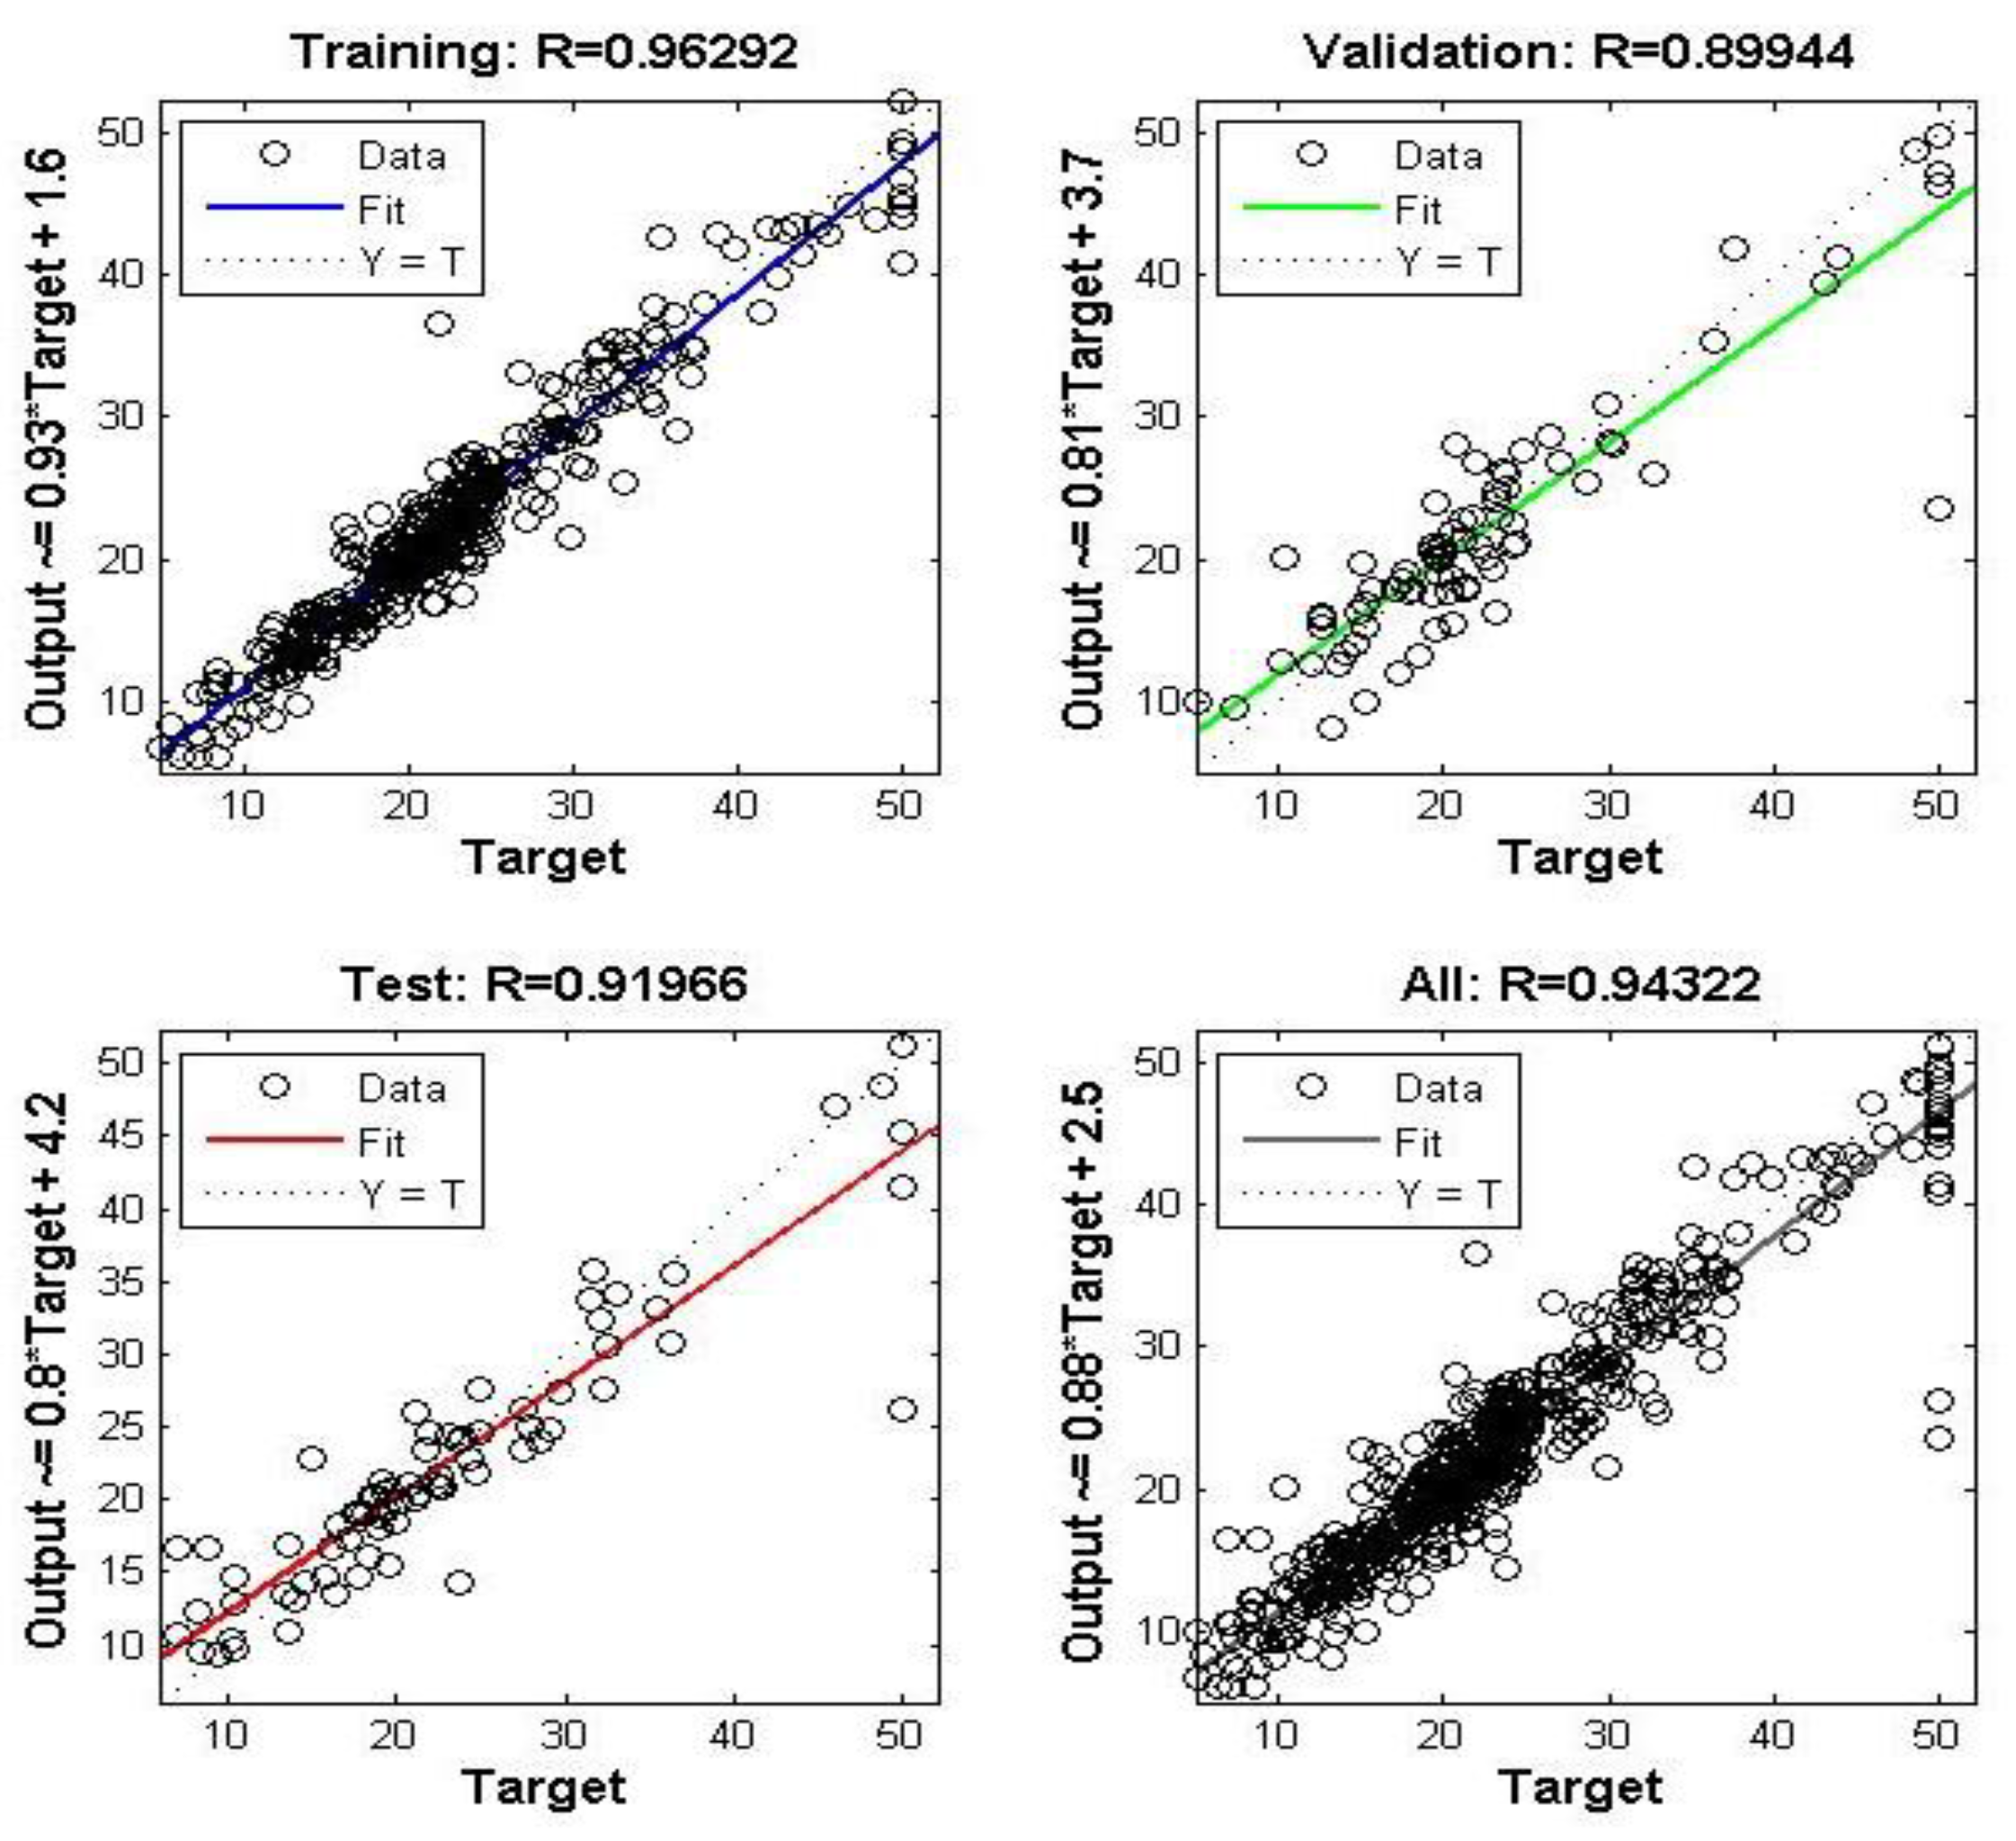
- For WTSPP, four regression parameters of are 0.99991, 0.99988, 0.9999 and 0.9999, respectively; meanwhile for WTPDP (in Figure 21), the corresponding data are 0.96292, 0.89944, 0.91966 and 0.94322, respectively.
- (7)
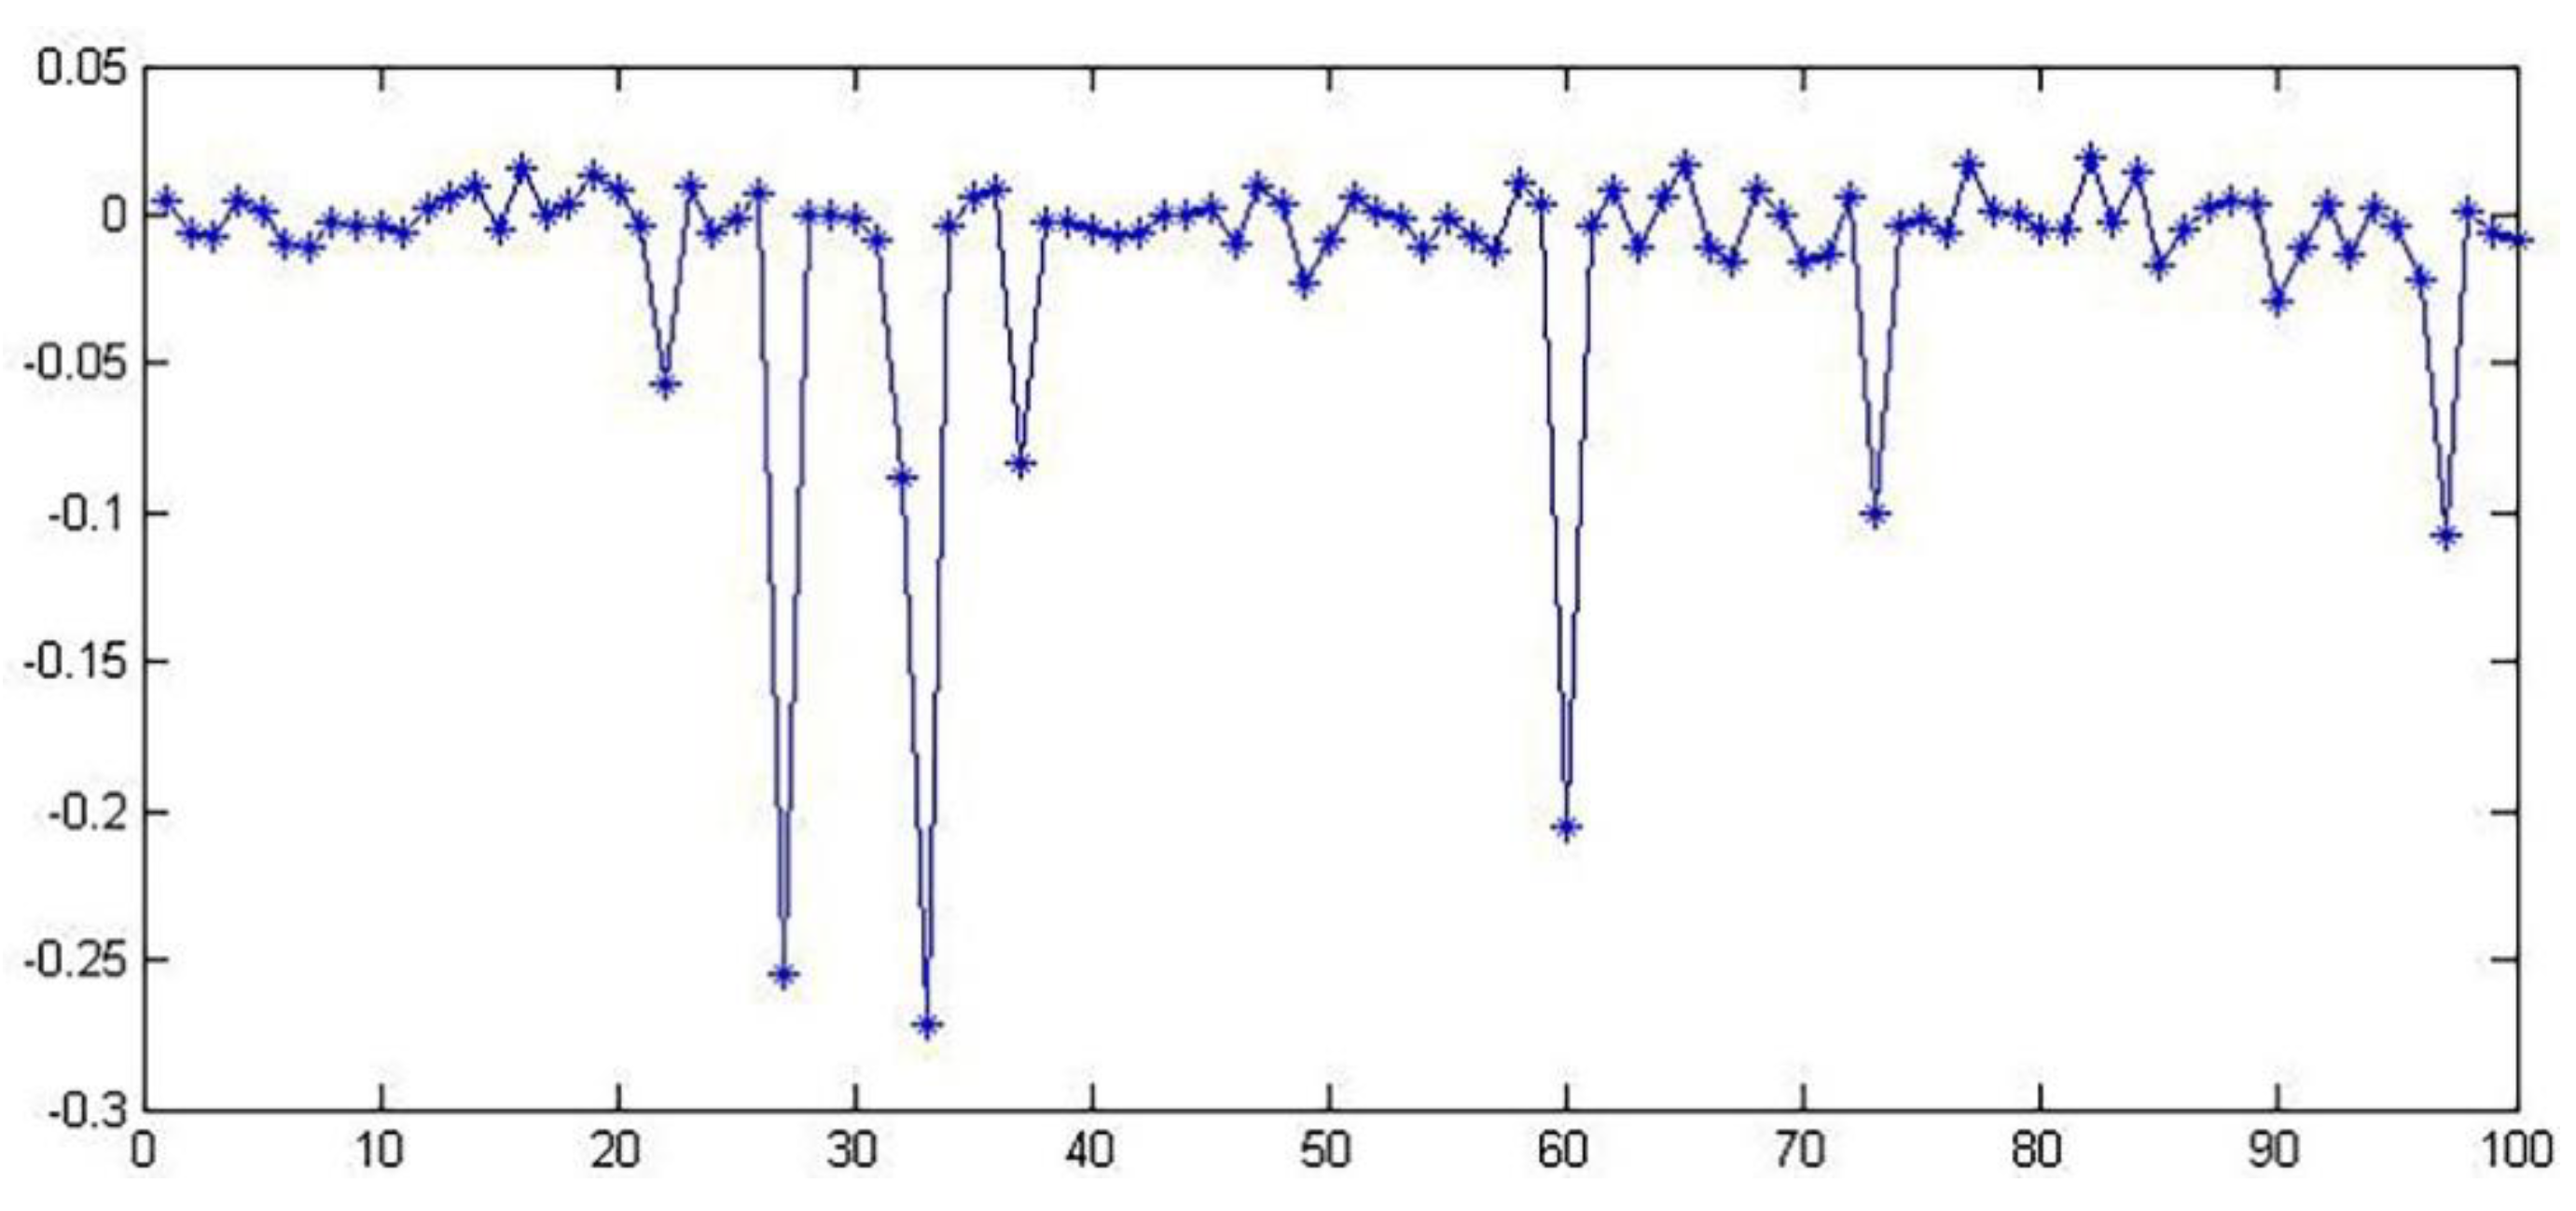
- Depending on fluctuation degrees, WTSPP is better than WTPDP. The maximum fluctuation ranges of WTSPP and WTPDP are (3%, −27%) and (28%, 61%), respectively.
- (8)
- All neural network analysis results manifest that emergy sustainability indicators (ESIs) of WTSPP and WTPDP are [0.0151, 0.011] and [0.0179, 0.0055] in view of a long-term predictive view, respectively.
Author Contributions
Funding
Conflicts of Interest
Appendix A
- 1-Sunlight energy = plant area (2 × 10⁵ m2) × avg. annual solar radiation (5.01 × 10⁹ J/m2) × albedo (0.13). UEVs of sunlight = 1.00 sej/J by definition. Sunlight emergy = 1.3 × 10¹⁴ sej.
- 2-Rain chemical potential energy = plant area (2 × 10⁵ m2) × annual rainfall (0.59 m) × evaporation rate (60.0%) × water density(1000 kg/m3) × Gibbs free energy (4.94 × 10³ kJ/kg); UEV = 2.35 × 10⁴ sej/J [43]. Rain chemical potential emergy = 3.5 × 1010 × 2.35 × 104 = 8.24 × 10¹⁵ sej.
- 3-Rain geopotential energy = plant area (2 × 10⁵ m2) × annual rainfall (0.59 m) × runoff rate (40%) × water density (1000 kg/m3) × average elevation (4 m) × gravity (9.8 m/s2); UEV = 2.79 × 10⁴ sej/J [43]. Rain geopotential emergy = 1.85 × 108 × 2.79 × 104 sej = 5.16 × 10¹³ sej.
- 4-Wind kinetic energy= plant area (2 × 10⁵ m2) × air density (1.29 kg/m3) × drag coefficient (0.001) × velocity of geostrophic wind3(27) × (3.15 × 107 s/year). UEV = 1.9 × 10³ sej/J [43]. Wind kinetic emergy = 2.2 × 1010 × 1.9 × 103sej = 4.18 × 10¹⁴ sej.
- 5-Geothermal energy = plant area (2 × 10⁵ m2) × heat flow (1.45 × 10⁶ J/(M2*year). UEV =3.44 × 10⁴ sej/J [44]. Geothermal emergy = 2.9 × 1010 × 3.44 × 104 sej = 9.98 × 10¹⁵ sej.
References
- China Environmental Statistics Annual Report. 2015. Available online: http://www.mee.gov.cn/hjzl/sthjzk/sthjtjnb/ (accessed on 15 January 2020).
- Discharge Standard of Pollutants for Municipal Wastewater Treatment Plant (National Standard GB 18918-2002). Available online: http://www.fao.org/faolex/results/details/en/c/LEX-FAOC136765/ (accessed on 23 June 2020).
- Liu, K.; Lin, B. Research on influencing factors of environmental pollution in China: A spatial econometric analysis. J. Clean. Prod. 2019, 206, 356–364. [Google Scholar] [CrossRef]
- Zhou, W.; Chen, L.; Feng, L. Effectiveness evaluation on third-party governance model for environmental pollution in China. Environ. Sci. Pollut. Res. 2019, 26, 17305–17320. [Google Scholar] [CrossRef] [PubMed]
- Pazda, M.; Kumirska, J.; Stepnowski, P.; Mulkiewicz, E. Antibiotic resistance genes identified in wastewater treatment plant Systems-A review. Sci. Total Environ. 2019, 697, 134023. [Google Scholar] [CrossRef] [PubMed]
- Nannou, C.; Ofrydopoulou, A.; Evgenidou, E.; Heath, D.; Heath, E.; Lambropoulou, D. Antiviral drugs in aquatic environment and wastewater treatment plants: A review on occurrence, fate, removal and ecotoxicity. Sci. Total Environ. 2020, 699, 134322. [Google Scholar] [CrossRef] [PubMed]
- Zheng, W.; Huyan, J.; Tian, Z.; Zhang, Y.; Wen, X. Clinical class 1 integron-integrase gene-A promising indicator to monitor the abundance and elimination of antibiotic resistance genes in an urban wastewater treatment plant. Environ. Int. 2020, 135, 105372. [Google Scholar] [CrossRef]
- Solé-Bundó, M.; Garfí, M.; Ferrer, I. Pretreatment and co-digestion of microalgae, sludge and fat oil and grease (FOG) from microalgae-based wastewater treatment plants. Bioresour. Technol. 2020, 298, 122563. [Google Scholar] [CrossRef]
- Teoh, S.K.; Li, L.Y. Feasibility of alternative sewage sludge treatment methods from a lifecycle assessment (LCA) perspective. J. Clean. Prod. 2020, 247, 119495. [Google Scholar] [CrossRef]
- Grönlund, S.E. Indicators and methods to assess sustainability of wastewater sludge management in the perspective of two systems ecology models. Ecol. Indic. 2019, 100, 45–54. [Google Scholar] [CrossRef]
- Zhang, X.; Cao, J.; Li, J.; Deng, S.; Zhang, Y.; Wu, J. Influence of sewage treatment on China’s energy consumption and economy and its performances. Renew. Sustain. Energy Rev. 2015, 49, 1009–1018. [Google Scholar] [CrossRef]
- Yang, J.; Liu, X.; Ying, L.; Chen, X.; Li, M. Correlation analysis of environmental treatment, sewage treatment and water supply efficiency in China. Sci. Total Environ. 2020, 708, 135128. [Google Scholar] [CrossRef]
- Nolte, T.M.; Chen, G.; van Schayk, C.S.; Pinto-Gil, K.; Jan Hendriks, A.; Peijnenburg, W.J.G.M.; Ragas, A.M. Ragas. Disentanglement of the chemical, physical, and biological processes aids the development of quantitative structure-biodegradation relationships for aerobic wastewater treatment. Sci. Total Environ. 2020, 708, 133863. [Google Scholar] [CrossRef] [PubMed]
- Zhang, Z.; Chen, Y. Effects of microplastics on wastewater and sewage sludge treatment and their removal: A review. Chem. Eng. J. 2020, 382, 122955. [Google Scholar] [CrossRef]
- Morera, S.; Santana, M.V.E.; Comas, J.; Rigola, M.; Corominas, L. Evaluation of different practices to estimate construction inventories for life cycle assessment of small to medium wastewater treatment plants. J. Clean. Prod. 2020, 245, 118768. [Google Scholar] [CrossRef]
- Nakatsuka, N.; Kishita, Y.; Kurafuchi, T.; Akamatsu, F. Integrating wastewater treatment and incineration plants for energy efficient urban biomass utilization: A life cycle analysis. J. Clean. Prod. 2020, 243, 118448. [Google Scholar] [CrossRef]
- Xu, Y.; Naidoo, A.R.; Zhang, X.; Meng, X.Z. Optimizing sampling strategy for Chinese National Sewage Sludge Survey (CNSSS) based on urban agglomeration, wastewater treatment process, and treatment capacity. Sci. Total Environ. 2019, 696, 133998. [Google Scholar] [CrossRef]
- Brunsch, A.F.; Florez, P.Z.; Langenhoff, A.A.M.; Laak, T.L.t.; Rijnaarts, H.H.M. Retention soil filters for the treatment of sewage treatment plant effluent and combined sewer overflow. Sci. Total Environ. 2020, 699, 134426. [Google Scholar] [CrossRef]
- Laura, F.; Tamara, A.; Müller, A.; Hiroshan, H.; Christina, D.; Serena, C. Selecting sustainable sewage sludge reuse options through a systematic assessment framework: Methodology and case study in Latin America. J. Clean. Prod. 2020, 242, 118389. [Google Scholar] [CrossRef]
- Odum, H.T. Environmental Accounting. In Emergy and Environmental Decision Making; John Wiley Sons, INC.: Hoboken, NJ, USA, 1996; Volume 370. [Google Scholar] [CrossRef]
- Zhao, H.; Zhai, X.; Guo, L.; Liu, K.; Huang, D.; Yang, Y.; Li, J.; Xie, S.; Zhang, C.; Tang, S.; et al. Assessing the efficiency and sustainability of wheat production systems in different climate zones in China using emergy analysis. J. Clean. Prod. 2019, 235, 724–732. [Google Scholar] [CrossRef]
- Zhang, X.; Zhang, R.; Wu, J.; Zhang, Y.Z.; Lin, L.; Deng, S.; Li, L.; Yang, G.; Yu, X.; Qi, H.; et al. An emergy evaluation of the sustainability of Chinese crop production system during 2000–2010. Ecol. Indic. 2016, 60, 622–633. [Google Scholar] [CrossRef]
- Pan, H.; Zhuang, M.; Geng, Y.; Wu, F.; Dong, H. Emergy-based ecological footprint analysis for a mega-city: The dynamic changes of Shanghai. J. Clean. Prod. 2019, 210, 552–562. [Google Scholar] [CrossRef]
- Chen, W.; Zhong, S.; Geng, Y.; Chen, Y.; Cui, X.; Wu, Q.; Pan, H.; Wu, R.; Sun, L.; Tian, X. Emergy based sustainability evaluation for Yunnan Province, China. J. Clean. Prod. 2017, 162, 1388–1397. [Google Scholar] [CrossRef]
- Srinivasan, R.S.; Braham, W.W.; Campbell, D.E.; Curcija, C.D. Re (De) fining Net Zero Energy: Renewable Emergy Balance in environmental building design. Build. Environ. 2012, 47, 300–315. [Google Scholar] [CrossRef]
- Luo, Z.; Zhao, J.; Yao, R.; Shu, Z. Emergy-based sustainability assessment of different energy options for green buildings. Energy Convers. Manag. 2015, 100, 97–102. [Google Scholar] [CrossRef]
- Liu, C.; Cai, W.; Dinolov, O.; Zhang, C.; Rao, W.; Jia, S.; Li, L.; Chan, F.T.S. Emergy based sustainability evaluation of remanufacturing machining Systems. Energy 2018, 150, 670–680. [Google Scholar] [CrossRef]
- Zhang, X.; Shen, J.; Wang, Y.; Qi, Y.; Liao, W.; Shui, W.; Li, L.; Qi, H.; Yu, X. An environmental sustainability assessment of China’s cement industry based on emergy. Ecol. Indic. 2017, 72, 452–458. [Google Scholar] [CrossRef]
- Yu, X.; Geng, Y.; Dong, H.; Fujita, T.; Liu, Z. Emergy-based sustainability assessment on natural resource utilization in 30 Chinese provinces. J. Clean. Prod. 2016, 133, 18–27. [Google Scholar] [CrossRef]
- Zhang, J.; Ma, L. Environmental Sustainability Assessment of a New Sewage Treatment Plant in China Based on Infrastructure Construction and Operation Phases Emergy Analysis. Water 2020, 12, 484. [Google Scholar] [CrossRef]
- Tian, X.; Geng, Y.; Ulgiati, S. An emergy and decomposition assessment of China-Japan trade: Driving forces and environmental imbalance. J. Clean. Prod. 2017, 141, 359–369. [Google Scholar] [CrossRef]
- Qi, Y.; Zhang, X.; Yang, X.; Lv, Y.; Wu, J.; Lin, L.; Xiao, Y.; Qi, H.; Yu, X.; Zhang, Y. The environmental sustainability evaluation of an urban tap water treatment plant based on emergy. Ecol. Indic. 2018, 94, 28–38. [Google Scholar] [CrossRef]
- Zhang, X.; Deng, S.; Wu, J.; Jiang, W. A sustainability analysis of a municipal sewage treatment ecosystem based on emergy. Ecol. Eng. 2010, 36, 685–696. [Google Scholar] [CrossRef]
- Shao, S.; Mu, H.; Yang, F.; Zhang, Y.; Li, J. Application of Emergy Analysis to the Sustainability Evaluation of Municipal Wastewater Treatment Plants. Sustainability 2017, 9, 8. [Google Scholar] [CrossRef]
- Yue, J.; Jiang, X.; Yuan, X.; Wang, X.; Li, B.; Liu, S. Design of a multiplexed system for domestic wastewater of Happy Farmer’s Home (HFH) and environmental evaluation using the emergy Analysis. J. Clean. Prod. 2017, 156, 729–740. [Google Scholar] [CrossRef]
- Londoño, N.A.C.; Suárez, D.G.; Velásquez, H.I.; Ruiz-Mercado, G.J. Emergy analysis for the sustainable utilization of biosolids generated in a municipal wastewater treatment plant. J. Clean. Prod. 2017, 141, 182–193. [Google Scholar] [CrossRef] [PubMed]
- Grönlund, E.; Billgren, C.; Tonderski, K.S.; Raburu, P.O. Emergy Assessment of a Wastewater Treatment Pond System in the Lake Victoria Basin. J. Environ. Account. Manag. 2017, 5, 11–26. [Google Scholar] [CrossRef]
- Vassallo, P.; Paoli, C.; Fabiano, M. Emergy required for the complete treatment of municipal Wastewater. Ecol. Eng. 2009, 35, 687–694. [Google Scholar] [CrossRef]
- Yang, L.; Kong, F.; Xi, M.; Li, Y.; Wang, S. Environmental economic value calculation and sustainability assessment for constructed rapid infiltration system based on emergy analysis. J. Clean. Prod. 2017, 167, 582–588. [Google Scholar] [CrossRef]
- Zhang, X.; Wei, Y.; Pan, H.; Xiao, H.; Wu, J.; Zhang, Y. The comparison of performances of a sewage treatment system before and after implementing the cleaner production measure. J. Clean. Prod. 2015, 91, 216–228. [Google Scholar] [CrossRef]
- Cao, C.; Feng, X. Distribution of emergy indices and its application. Energy Fuels 2007, 21, 1717–1723. [Google Scholar] [CrossRef]
- Odum, H.T. Self-Organization, Transformity, and Information. Science 1988, 242, 1132–1139. [Google Scholar] [CrossRef]
- Lee, J.M.; Braham, W.W. Building emergy analysis of Manhattan: Density parameters forhigh-density and high-rise developments. Ecol. Model. 2017, 363, 157–171. [Google Scholar] [CrossRef]
- Brown, M.T.; Bardi, E. Handbook of Emergy Evaluation: A Compendium of Data for Emergy Computation in a Series of Folios, Folio #3 Emergy of Ecosystem; Center for Environmental Policy, University of Florida: Gainesville, FL, USA, 2001. [Google Scholar]
- Chen, W.; Liu, W.; Geng, Y.; Ohnishi, S.; Sun, L.; Han, W.; Tian, X.; Zhong, S. Life cycle based emergy analysis on China’s cement production. J. Clean. Prod. 2016, 131, 272–279. [Google Scholar] [CrossRef]
- Pan, H.; Zhang, X.; Wu, J.; Zhang, Y.; Lin, L.; Yang, G.; Deng, S.; Li, L.; Yu, X.; Qi, H.; et al. Sustainability evaluation of a steel production system in China based on emergy. J. Clean. Prod. 2016, 112, 1498–1509. [Google Scholar] [CrossRef]
- Buranakarn, V. Evaluation of Recycling and Reuse of Building Materials Using the Emergy Analysis Method. 1998. Ph.D. Thesis, University of Florida, Gainesville, FL, USA, 1998. [Google Scholar]
- Cabezas, H.D.; Campbell, D.; Eason, T.; Garmestani, A.S.; Heberling, M.T.; Hopton, M.E.; Templeton, J.; White, D.; Zanowick, M. San Luis Basin Sustainability Metrics Project: A Methodology for Evaluating Regional Sustainability; Heberling, M.T., Hopton, M.E., Eds.; United States Environmental Protection Agency (US EPA): Washington, DC, USA, 2010; pp. 119–136.
- Liu, C.; Cai, W.; Jia, S.; Zhang, M.; Guo, H.; Hu, L.; Jiang, Z. Emergy-based evaluation and improvement for sustainable manufacturing systems considering resource efficiency and environment performance. Energy Convers. Manag. 2018, 177, 176–189. [Google Scholar] [CrossRef]
- Lou, B.; Ulgiati, S. Identifying the environmental support and constraints to the Chinese economic growth—An application of the Emergy Accounting method. Energy Policy 2013, 55, 217–233. [Google Scholar] [CrossRef]
- Brown, M.T.; Campbell, D.E.; de Vilbiss, C.; Ulgiati, S. The geobiosphere emergy baseline: A synthesis. Ecol. Model. 2016, 339, 92–95. [Google Scholar] [CrossRef]


| No. | Items | Inlet | Outlet | Reference |
|---|---|---|---|---|
| 1 | Chemical oxygen demand (COD) | 120 mg/L | 50 mg/L | [2] |
| 2 | Total oxygen demand (BOD) | 40 mg/L | 10 mg/L | [2] |
| 3 | Suspended solids (SS) | 130 mg/L | 10 mg/L | [2] |
| 4 | TP | 2 mg/L | 0.5 mg/L | [2] |
| 5 | TN | 30 mg/L | 15 mg/L | [2] |
| 6 | NH4+ | 25 mg/L | 5 mg/L | [2] |
| Structure | Basic Emergy Inputs | Expression |
|---|---|---|
| Entire input emergy | Renewable energy-emergy | |
| Nonrenewable resource-emergy | ||
| Nonrenewable energy-emergy | ||
| Material-emergy | ||
| Service-emergy | ||
| Entire output emergy | Waste-emergy | |
| Main product emergy | ||
| Total emergy | ~ |
| Indicators | Equation | Equation Number | Meaning |
|---|---|---|---|
| Renewable energy-emergy ratio | Equation (2) | Renewable rate | |
| Nonrenewable resource-emergy ratio | Equations (3) and (4) | Non-renewable rate of resources | |
| Nonrenewable energy-emergy ratio | Equation (3) | Non-renewable rate of energy | |
| Material-emergy ratio | Equation (4) | Non-renewable rate of material | |
| Service-emergy ratio | Equation (5) | Contribution rate of service | |
| Waste-emergy ratio | Equation (6) | Waste-emergy discharge rate | |
| Main product emergy ratio | Equation (7) | Ratio of main product emergy |
| Indicators | Equation | Meaning |
|---|---|---|
| Net emergy yield ratio (NEYR) | Production efficiency | |
| Production emergy efficiency (PEE) | Economic profitability | |
| Emergy marginal rate (EMR) | Development trend | |
| Unit emergy values (UEVs) | Entire system efficiency |
| Indicators | Equation | Meaning |
|---|---|---|
| Environmental loading ratio (ELR) | Natural environment pressure | |
| Emergy waste ratio (EWR) | Inefficiency level | |
| Emergy sustainability indicator (ESI) | Environmental friendliness |
| No. | Item | Amount | References | UEVs (sej/unit) | References | Emergy (sej) | % |
|---|---|---|---|---|---|---|---|
| Renewable emergy (See the calculation details inAppendix A) | 1.88 × 10¹⁶ | 0.49% | |||||
| 1 | Sunlight | 1.3 × 10¹⁴ J | calculated | 1 | [42] | 1.3 × 10¹⁴ | 0.00% |
| 2 | Rain-chemical | 3.5 × 10¹¹ J | calculated | 2.35 × 10⁴ | [43] | 8.24 × 10¹⁵ | 0.22% |
| 3 | Rain geopotential | 1.85 × 10⁹ J | calculated | 2.79 × 10⁴ | [43] | 5.16 × 10¹³ | 0.00% |
| 4 | Wind energy | 2.2 × 10¹¹ J | calculated | 1.9 × 10³ | [43] | 4.18 × 10¹⁴ | 0.01% |
| 5 | Geothermal energy | 2.9 × 10¹¹ J | calculated | 3.44 × 10⁴ | [44] | 9.98 × 10¹⁵ | 0.26% |
| Nonrenewable resources emergy | 2.39 × 10¹⁸ | 62.5% | |||||
| 6 | Cement | 4.16 × 10⁵ kg | collected | 1.93 × 10¹² | [45] | 8.03 × 10¹⁷ | 21.0% |
| 7 | Steel | 3.01 × 10⁵ kg | collected | 2.75 × 10¹² | [46] | 8.28 × 10¹⁷ | 21.6% |
| 8 | Gravel | 1.98 × 10⁵ kg | collected | 1.42 × 10¹² | [45] | 2.81 × 10¹⁷ | 7.35% |
| 9 | Brick | 2.73 × 10⁴ kg | collected | 2.82 × 10¹² | [47] | 7.70 × 10¹⁶ | 2.01% |
| 10 | Wood | 4.23 × 10³ kg | collected | 2.67 × 10¹² | [48] | 1.13 × 10¹⁶ | 0.30% |
| 11 | Tap water | 6.92 × 10⁴ kg | collected | 9.03 × 10¹¹ | [32] | 6.25 × 10¹⁶ | 1.63% |
| 12 | Limestone | 1.56 × 10³ kg | collected | 1.27 × 10¹² | [45] | 1.98 × 10¹⁵ | 0.05% |
| 13 | Aluminum | 1.83 × 10⁴ kg | collected | 1.61 × 10¹³ | [47] | 2.95 × 10¹⁷ | 7.71% |
| 14 | Tile | 6.43 × 10³ kg | collected | 3.89 × 10¹² | [47] | 2.50 × 10¹⁶ | 0.65% |
| 15 | Asphalt | 2.63 × 10³ kg | collected | 3.49 × 10¹² | [48] | 9.18 × 10¹⁵ | 0.24% |
| Wastewater treatment chemicals input emergy | 2.64 × 10¹⁷ | 6.90% | |||||
| 16 | Polyaluminium chloride | 7.84 × 10¹⁰ kg | collected | 3.37 × 10⁶ | [32] | 2.64 × 10¹⁷ | 6.90% |
| 17 | Cl2 liquid | 5.04 × 10⁷ kg | collected | 3.37 × 10⁶ | [32] | 1.70 × 10¹⁴ | 0.00% |
| 18 | Polyacrylamide | 3.71 × 10⁷ kg | collected | 3.37 × 10⁶ | [32] | 1.25 × 10¹⁴ | 0.00% |
| 19 | Potassium permanganate | 4.56 × 10⁷ kg | collected | 3.37 × 10⁶ | [32] | 1.54 × 10¹⁴ | 0.00% |
| Energy input emergy | 4.56 × 10¹⁷ | 11.9% | |||||
| 20 | Electricity | 1.35 × 10¹² J | collected | 2.78 × 10⁵ | [49] | 3.76 × 10¹⁷ | 9.83% |
| 21 | Coal | 7.4 × 10¹¹ J | collected | 3.98 × 10⁴ | [46] | 2.94 × 10¹⁶ | 0.77% |
| 22 | Oil | 5.62 × 10¹¹ J | collected | 9.07 × 10⁴ | [47] | 5.1 × 10¹⁶ | 1.33% |
| Service emergy | 1.93 × 10¹⁷ | 5.05% | |||||
| 23 | Labor | 3.27 × 10¹²$ | collected | 2.01 × 10⁴ | [50] | 6.57 × 10¹⁶ | 1.72% |
| 24 | Facilities maintenance | 5.02 × 10¹² $ | collected | 2.01 × 10⁴ | [50] | 1.01 × 10¹⁷ | 2.64% |
| 25 | Transportation(truck) | 1.31 × 10¹² $ | collected | 2.01 × 10⁴ | [50] | 2.63 × 10¹⁶ | 0.69% |
| Output emergy | 5.02 × 10¹⁷ | 13.1% | |||||
| 26 | Qualified water | 5.32 × 10⁴ kg | collected | 9.16 × 10¹² | [49] | 4.87 × 10¹⁷ | 12.7% |
| 27 | Exhaust gas | 7.5 × 10³ kg | collected | 7.24 × 10¹¹ | [49] | 5.43 × 10¹⁵ | 0.14% |
| 28 | Sludge | 3.76 × 10⁴ kg | collected | 2.52 × 10¹¹ | [49] | 9.48 × 10¹⁵ | 0.25% |
| Total emergy | 2.85 × 10¹⁸ | 100% | |||||
| No. | Item | Amount | References | UEVs (sej/unit) | References | Emergy (sej) | % |
|---|---|---|---|---|---|---|---|
| Renewable emergy (See the calculation details inAppendix A) | 1.88 × 10¹⁶ | 0.27% | |||||
| 1 | Sunlight | 1.3 × 10¹⁴ J | calculated | 1 | [42] | 1.3 × 10¹⁴ | 0.00% |
| 2 | Rain-chemical | 3.5 × 10¹¹ J | calculated | 2.35 × 10⁴ | [43] | 8.24 × 10¹⁵ | 0.12% |
| 3 | Rain geopotential | 1.85 × 10⁹ J | calculated | 2.79 × 10⁴ | [43] | 5.16 × 10¹³ | 0.00% |
| 4 | Wind energy | 2.2 × 10¹¹ J | calculated | 1.9 × 10³ | [43] | 4.18 × 10¹⁴ | 0.01% |
| 5 | Geothermal energy | 2.9 × 10¹¹ J | calculated | 3.44 × 10⁴ | [44] | 9.98 × 10¹⁵ | 0.14% |
| Nonrenewable resources emergy | 3.73 × 10¹⁸ | 53.7% | |||||
| 6 | Cement | 6.53 × 10⁵ kg | collected | 1.93 × 10¹² | [45] | 1.26 × 10¹⁸ | 18.2% |
| 7 | Steel | 4.51 × 10⁵ kg | collected | 2.75 × 10¹² | [46] | 1.24 × 10¹⁸ | 17.9% |
| 8 | Gravel | 3.24 × 10⁵ kg | collected | 1.42 × 10¹² | [45] | 4.60 × 10¹⁷ | 6.63% |
| 9 | Brick | 4.32 × 10⁴ kg | collected | 2.82 × 10¹² | [47] | 1.22 × 10¹⁷ | 1.76% |
| 10 | Wood | 5.79 × 10³ kg | collected | 2.67 × 10¹² | [48] | 1.55 × 10¹⁶ | 0.22% |
| 11 | Tap water | 7.01 × 10⁴ kg | collected | 9.03 × 10¹¹ | [32] | 6.33 × 10¹⁶ | 0.91% |
| 12 | Limestone | 4.22 × 10³ kg | collected | 1.27 × 10¹² | [45] | 5.36 × 10¹⁵ | 0.08% |
| 13 | Aluminum | 3.21 × 10⁴ kg | collected | 1.61 × 10¹³ | [47] | 5.17 × 10¹⁷ | 7.45% |
| 14 | Tile | 5.99 × 10³ kg | collected | 3.89 × 10¹² | [47] | 2.33 × 10¹⁶ | 0.34% |
| 15 | Asphalt | 5.42 × 10³ kg | collected | 3.49 × 10¹² | [48] | 1.89 × 10¹⁶ | 0.27% |
| Wastewater treatment chemicals input emergy | 3.38 × 10¹⁷ | 4.87% | |||||
| 16 | Polyaluminium chloride | 9.88 × 10¹⁰kg | collected | 3.37 × 10⁶ | [32] | 3.33 × 10¹⁷ | 4.80% |
| 17 | Cl2 liquid | 2.34 × 10⁸ kg | collected | 3.37 × 10⁶ | [32] | 7.89 × 10¹⁴ | 0.01% |
| 18 | Polyacrylamide | 5.89 × 10⁸ kg | collected | 3.37 × 10⁶ | [32] | 1.98 × 10¹⁵ | 0.03% |
| 19 | Potassium permanganate | 6.31 × 10⁸ kg | collected | 3.37 × 10⁶ | [32] | 2.13 × 10¹⁵ | 0.03% |
| Energy input emergy | 1.7 × 10¹⁸ | 24.4% | |||||
| 20 | Electricity | 5.72 × 10¹² J | collected | 2.78 × 10⁵ | [49] | 1.59 × 10¹⁸ | 22.9% |
| 21 | Coal | 1.22 × 10¹² J | collected | 3.98 × 10⁴ | [46] | 4.86 × 10¹⁶ | 0.70% |
| 22 | Oil | 6.33 × 10¹¹ J | collected | 9.07 × 10⁴ | [51] | 5.74 × 10¹⁶ | 0.83% |
| Service emergy | 3.15 × 10¹⁷ | 4.54% | |||||
| 23 | Labor | 6.33 × 10¹²$ | collected | 2.01 × 10⁴ | [50] | 1.27 × 10¹⁷ | 1.83% |
| 24 | Facilities maintenance | 6.81 × 10¹² $ | collected | 2.01 × 10⁴ | [50] | 1.37 × 10¹⁷ | 1.97% |
| 25 | Transportation(truck) | 2.54 × 10¹² $ | collected | 2.01 × 10⁴ | [50] | 5.11 × 10¹⁶ | 0.74% |
| Output emergy | 8.45 × 10¹⁷ | 12.2% | |||||
| 26 | Qualified water | 8.99 × 10⁴ kg | collected | 9.16 × 10¹² | [49] | 8.23 × 10¹⁷ | 11.9% |
| 27 | Exhaust gas | 9.11 × 10³ kg | collected | 7.24 × 10¹¹ | [49] | 6.60 × 10¹⁵ | 0.10% |
| 28 | Sludge | 5.85 × 10⁴ kg | collected | 2.52 × 10¹¹ | [49] | 1.47 × 10¹⁶ | 0.21% |
| Total emergy | 6.94 × 10¹⁸ | 100% | |||||
| Indicators | Equation | WTSPP | WTPDP |
|---|---|---|---|
| Basic emergy indicators | |||
| Renewable energy-emergy ratio (%R) | REm/Et | 0.33% | 0.27% |
| Nonrenewable resource-emergy ratio (%N1) | Ema-p/Et | 62.5% | 53.7% |
| Nonrenewable energy-emergy ratio (%N2) | Ema-a/Et | 11.9% | 24.4% |
| Material-emergy ratio (%M) | Ema/Et | 69.4% | 58.6% |
| Service-emergy ratio (%S) | Esm/Et | 5.05% | 4.54% |
| Waste-emergy ratio (%W) | Ewe/Et | 0.39% | 0.31% |
| Main product emergy ratio (%P) | Em-p/Et | 12.7% | 11.9% |
| Functional emergy indicators | |||
| Net emergy yield ratio (NEYR) | 2.67 | 4.49 | |
| Production emergy efficiency (PEE) | 0.13 | 0.12 | |
| Emergy marginal rate (EMR) | 0.058 | 0.083 | |
| Unit emergy values (UEVs-sej/$) | 7.7 × 10¹⁰ | 1.39 × 10¹¹ | |
| Eco-efficiency emergy indicators | |||
| Environmental loading ratio (ELR) | 176 | 323 | |
| Emergy waste ratio (EWR) | 0.004 | 0.003 | |
| Emergy sustainability indicator (ESI) | 0.015 | 0.014 | |
| 1 | 2 | 3 | 4 | 5 | |
|---|---|---|---|---|---|
| Route 1 | 1 | 1 | 1 | 1 | 1 |
| Route 2 | 1 | 0 | 1 | 1 | 1 |
| Route 3 | 1 | 1 | 1 | 0 | 1 |
| Route 4 | 1 | 0 | 1 | 0 | 1 |
| Route 5 | 1 | 0 | 0 | 0 | 1 |
| 1 | 2 | 3 | 4 | 5 | 6 | 7 | 8 | |
|---|---|---|---|---|---|---|---|---|
| Route 1 | 1 | 1 | 1 | 1 | 1 | 1 | 1 | 1 |
| Route 2 | 1 | 1 | 1 | 0 | 0 | 0 | 1 | 1 |
| Route 3 | 1 | 1 | 1 | 1 | 1 | 0 | 1 | 1 |
| Route 4 | 1 | 1 | 1 | 1 | 1 | 1 | 0 | 1 |
© 2020 by the authors. Licensee MDPI, Basel, Switzerland. This article is an open access article distributed under the terms and conditions of the Creative Commons Attribution (CC BY) license (http://creativecommons.org/licenses/by/4.0/).
Share and Cite
Zhang, J.; Ma, L.; Yan, Y. A Dynamic Comparison Sustainability Study of Standard Wastewater Treatment System in the Straw Pulp Papermaking Process and Printing & Dyeing Papermaking Process Based on the Hybrid Neural Network and Emergy Framework. Water 2020, 12, 1781. https://doi.org/10.3390/w12061781
Zhang J, Ma L, Yan Y. A Dynamic Comparison Sustainability Study of Standard Wastewater Treatment System in the Straw Pulp Papermaking Process and Printing & Dyeing Papermaking Process Based on the Hybrid Neural Network and Emergy Framework. Water. 2020; 12(6):1781. https://doi.org/10.3390/w12061781
Chicago/Turabian StyleZhang, Junxue, Lin Ma, and Yanyan Yan. 2020. "A Dynamic Comparison Sustainability Study of Standard Wastewater Treatment System in the Straw Pulp Papermaking Process and Printing & Dyeing Papermaking Process Based on the Hybrid Neural Network and Emergy Framework" Water 12, no. 6: 1781. https://doi.org/10.3390/w12061781
APA StyleZhang, J., Ma, L., & Yan, Y. (2020). A Dynamic Comparison Sustainability Study of Standard Wastewater Treatment System in the Straw Pulp Papermaking Process and Printing & Dyeing Papermaking Process Based on the Hybrid Neural Network and Emergy Framework. Water, 12(6), 1781. https://doi.org/10.3390/w12061781