Abstract
Barrier reefs dissipate most incoming wind-generated waves and, as a consequence, regulate the morphodynamics of its inbounded shorelines. The coastal protective capacity of reefs may nevertheless be compromised by climate change effects, such as reef degradation and sea-level rise. To assess the magnitude of these climate change effects, an analysis of the waves propagating across the barrier reef is carried out in Flic-en-Flac beach, Mauritius, based on scenarios of future sea levels and predicted coral reef condition. In the study, both the mean wave climate and extreme event conditions are considered. The results show that lower coral structure complexity jointly with higher water levels allow for higher waves to pass over the reef and, therefore, to reach the shoreline. In addition, modeling for cyclonic conditions showed that nearshore waves would also increase in height, which could lead to major coastal morphodynamic changes. Measures aimed at preserving the coral reef may allow the system to accommodate for the gradual climatic changes forecasted while keeping its coastal protective function.
1. Introduction
Coral reefs are important elements in tropical and subtropical shores. They are among the most diverse and productive ecosystems of the oceans since they provide a large number of goods and services such as food, habitat, biodiversity, tourism, recreation, shoreline protection, and erosion regulation [1]. In particular, coral reefs play an important role in coastal areas acting as natural breakwaters that can dissipate up to 97% incident wave energy [2] controlling the shoreline evolution in their lee [3]. In addition, taking into account that low-crested detached breakwaters generate a wave height reduction of 30%–70% [4,5,6], the wave dissipation effect of coral reefs is generally similar or even larger than conventional structures.
Barrier reefs are typically characterized by a steep slope from deep water to the reef crest, which is followed by a shallow platform between this crest and the shoreline. This particular morphology enhances wave breaking at the reef crest and protects the coastline from severe storm waves [7]. Bottom friction takes place over the reef flat and may dissipate as much energy as wave breaking [8]. The most critical factors for wave dissipation in coral reef environments are the depth of reefs, in particular at the shallowest points [2,9,10] and bottom friction, which depends on bottom roughness [8,11].
This natural protection is of critical socioeconomic importance in many countries, such as Mauritius, where coastal activities play a key role. Nevertheless, the development and the consequent reorganization of the coastal fringe have generated a strong anthropogenic pressure (e.g., tourist resorts, urbanization, occupied shorelines) that have made it prone to risks such as flooding and undermining infrastructure. In this fringe, the existing infrastructure, such as resorts and coastal roads, prevents setbacks as an adaptation measure to counteract the potential risks.
On the other hand, large storms as tropical cyclones (TC) and hurricanes may damage coral reefs [12,13,14], due to the combination of the intensity of the waves and duration [15]. The physical damage to coral reefs from TCs ranges from broken branches to the removal of parts of the reef structure [15] and it is highly patchy [16].
In addition to natural and anthropogenic impacts, these unique ecosystems are threatened by diverse processes derived from climate change, as sea-level rise (SLR) and changes in pH and water temperature. For example, coral bleaching events and ocean acidification threaten reef ecosystems reducing bottom friction [17]. Reef degradation reduces their ability to mitigate the effects of coastal hazards and modifies nearshore dynamics, increasing the vulnerability of the coast to erosion and flooding events [18,19,20].
The study of the impact of climate change on coral reefs has been focused on ocean acidification and rising water sea temperature [21,22], while less attention has been paid to the impact of SLR [23,24,25]. Increases in reef depth due to SLR diminish its potential wave dissipation and as a consequence, the beach protection service could be reduced or even eliminated [1]. For example, Wegner and Ellis [26] estimated that 0.4 m of SLR would increase transmitted wave-energy over a Caribbean coral reef by 20%–30%, enhancing shoreline erosion. Hence, the consequences derived from SLR coupled with the loss of reefs’ properties should be taken into account when considering the coastal activities that can exist. In tropical insular states such as Mauritius, where a significant share of revenue depends on foreign beach tourism, this is a major issue in coastal planning.
Coastal erosion and flooding are closely related to the wave energy reaching the shoreline. Therefore, a good description of wave patterns in the nearshore area under different scenarios is needed to assess the impacts of those changes on beaches and consequently to select the best management strategy.
Numerical modeling is a suitable tool to determine the spatial distribution of hydrodynamic conditions over the coral reef and the attached beaches. It has been applied to reproduce the nearshore wave fields in a number of studies. In this way, Hoeke et al. [9] and Filipot and Cheung [27] used the SWAN model [28] to investigate its performance over fringing reef bays, showing that it is capable of estimating the wavefield in such environments. Sheremet et al. [10] tested both phase-resolving and phase-averaged models to assess model performance in steep slopes characteristic of reef environments. Van Dongeren et al. [29] and Lashley et al. [30] used the XBeach model [31] to investigate wave hydrodynamics on a fringing reef, obtaining a good skill to predict all key processes in such systems. McCabe et al. [32], Fang et al. [33] and Shimizono et al. [34] used Boussinesq-type models to analyze the wave transformation over fringing reef profiles. Buckley et al. [35] compared SWAN, XBeach, and SWASH [36] models to assess their ability to predict wave heights on a reef profile, finding that all of them are capable of predicting it with reasonable accuracy. They also found that phase-averaged models require a lower grid resolution and are significantly less computationally demanding. Pearson et al. [37] also used the XBeach model to assess wave-driven flooding hazards on coral-reef coasts.
These wave models have also been used in a few studies to evaluate the potential effects of SLR on wave propagation over coral reefs. For example, Storlazzi et al. [24] modeled the impact of SLR on a fringing coral reef hydrodynamics, finding that greater water depths over the reef would reduce bottom friction, resulting in higher waves that could propagate over the reef without breaking. Quataert et al. [19] used the XBeach model to examine how climate change may affect coral reef characteristics, altering wave-driven coastal run-up.
Within this context, the aim of this paper is to quantify the impact of changing hydrodynamic conditions induced by climate change at a coral reef located on the island of Mauritius. The study focusses on the amount of wave energy that reaches the beach attached to the reef. Such impacts are analyzed considering three factors of change induced by climate change: SLR, wave climate, and health state of the reef; the latter having a primary role in dissipating wave energy by bottom friction. The analysis is realized considering the climate projections presented in the Fifth Assessment Report (AR5) climate projections of the Intergovernmental Panel on Climate Change (IPCC) [38]. The study is focused on the Flic-en-Flac beach, located in Mauritius. The analysis is performed for mean and extreme wave regimes taking into account present and future reef quality conditions. The paper does not intend to assess the impact of waves in the coral reef itself, as done by other authors [12,13,14,15,16], but to quantify how different conditions associated with climate change modify the wave energy passing over the reef and reaching the beach. This is very important for coastal managers to design the necessary adaptation measures to protect the beach.
Based on these previous studies the SWAN model was selected to carry out this study because it solves the wave action balance equation. Therefore, it reproduces the main physical processes taking place in this specific area: nearshore wave propagation, bottom friction, and depth induced breaking. In addition, since it is a phase-averaged model, it requires a coarser grid resolution and a considerably lower computational cost.
2. Materials and Methods
2.1. Study Area
Flic-en-Flac beach, located on the west coast of the island of Mauritius (Figure 1), is one of the most visited beaches in Mauritius and it is of socio-economic relevance for the country. Over the last years, the beach has experienced events of recurring erosion and it has been classified as a beach of high management priority in terms of erosion risks [39]. It extends approximately 5 km from north to south in a slightly convex shape. The morphology of Flic-en-Flac represents a typical sandy beach in Mauritius; such that it is bounded by a lagoon extending a few hundred meters and surrounded by a barrier reef. The contour of the shoreline mirrors the contour of the barrier reef, which lays about 250–400 m apart. A shallow lagoon is comprised between the barrier reef and the shoreline, as seen in Figure 1.
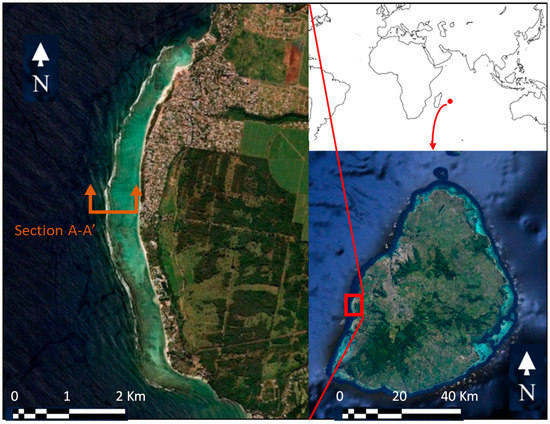
Figure 1.
Location and map of the study area: Flic-en-Flac lagoon.
The volcanic origins of the Island, formed from the eruption of a hot spot located under the oceanic shelf, explain the steep bathymetry on the west of the barrier reef [40]. Around 12 km from shore, depths of around 4000 m are observed and at 2.5 km depths are around 500 m. The reef flat is typically found to be 0.3 m below local mean sea water level [41,42] and stretches between 40 and 180 m cross-shore. The buttress zone extends from the reef flat to a range of depths typically around 5 to 20 m below sea water level. The depths of the lagoon vary around 0.5 and 2 m. A typical cross-section of the study area from west to east is shown in Figure S1 (supplementary material).
The fore reef and reef flat were noted to have a poor coral cover, with a patchy structure and an estimated live coral on the fore reef to be between 5 and 50% [43]. On average about half of these corals are of the ‘massive coral species’, and less than 25% are of the branching coral type. The bottom surface of the lagoon is colonized with variable disposition and concentration of patchy branching corals and seagrass. The seabed present at the majority of the lagoon is comprised of sand veneer laying over calcareous substrate from past reef growth.
The coral degradation over the last decades has a clear anthropogenic origin [43]. The major causes are the physical coral damage from fisheries, recreational, intentional coral removal for commercial and touristic use of the lagoon, coral clearing for bathing improvement, effluent discharge including fertilizers, siltation and increased freshwater input into the lagoon due to coastal wetlands filling [39,41]. The southwest of Mauritius is exposed to waves driven from the low-pressure systems south of Africa which travel from west to east. Unobstructed by land, the fetch over which the storms blow results in waves of high peak period and wave height. Swell reaching the island from these storms comes from south to southwesterly directions. Other swells susceptible to impacting the Flic-en-Flac coast originate from episodic extreme swell events generated during summer cyclonic storms. Waves from these episodic events generally have a northerly direction, but may also arrive from the easterly or westerly sectors, depending on the cyclone’s trajectory.
The tide on the island is of relatively small amplitude (micro-tidal) and is mainly semi-diurnal. The average neap range and spring range are 0.3 m and 0.5 m, respectively. The range from the lowest to highest astronomical tide is 0.8 m [39].
2.2. Modeling Approach and Input Parameters
As indicated in the Introduction, the SWAN model [28] is chosen to compute the wave dissipation over the Flic-en-Flac barrier reef by propagating waves from offshore locations, over the barrier reef, and into the lagoon. This code has successfully been used for modeling wave dissipation in fringing reef environments [9,27,44]. The numerical wave height outputs from the SWAN model allow assessing the effects of varying SLR and coral complexity conditions from different scenarios. Comparison of the wave height evolution over energy dissipating seabed features indicates their relative effects in the different scenario conditions selected. The required input parameters in SWAN for this work have been: (i) the wave parameters; (ii) the water level; (iii) the friction factor of the coral reef seabed; and (iv) the bathymetry of the area of study.
There is no available recorded data in this area for obtaining the wave climate. Because of this, the mean and extreme wave regimes have been derived from the 39 years (1979–2017) publicly available Era-Interim data set [45]. Era-Interim is a global atmospheric reanalysis product created by the European Centre for Medium-Range Weather Forecast (ECMWF) [46] that provides information on wave fields (among many other variables) at six-hourly intervals. Since the available data include a directional average and mean wave height, the waves of interest have been frequently found to be overshadowed by the yearlong trade wind-generated waves [47]. To overcome this limitation, the coordinate of extraction for the mean wave climate analysis has been chosen at 56.25° E and 22.5° S (node 1), while for the extreme wave climate, the trade wind effects have little influence on the data of interest and the most accurate data is therefore closer to the island, at 57° E and 20.25° S (node 2). Figure S2 (supplementary material) shows the wave rose diagrams for both node positions.
The mean wave climate has been built by choosing the mean of the wave height bins (1 m interval), the wave period bins (2 s interval) and directional bins (11.25° interval), which occur at a frequency greater than 0.02% (64 cases in total). Furthermore, conditions that occur less than 2 h per year have not been considered for the model due to the expected very low impact. Waves of mean direction smaller than 163° have also been discarded, due to the limited effect that these conditions would have on the study area. A weighted output is generated by multiplying the model outputs of each wave condition by its frequency of occurrence. The cumulative frequency of occurrence for all the conditions modeled in the analysis amounts to 45.39% of the total waves recorded in the wave climate data. Table S1 (supplementary material) presents the 64 considered combinations of significant wave height (Hs), peak period (Tp), and wave directions representative of a mean year.
The extreme regime has been derived by fitting a Weibull probability distribution function to a subset of extremes obtained using the peak over threshold method with Hs threshold value of 4 m, which extracts approximately the 5% of the highest waves, close to the values suggested by Sterl and Caires [48].
The modeling approaches for the two distinct wave climates are shown in Figure 2. A nesting strategy has been followed for the mean wave conditions whereas a single grid approach has been used for the extreme regime (Figure 3). The largest model domains’ (Domain 1) boundaries range from 20.2° S to 21.6° S and 55.4° E to 57.4° E. The southernmost boundary has been chosen to include Reunion Island, to ensure that the refraction and diffraction of southwesterly waves are included. A coarse resolution of the computational and bathymetric grid of 0.005° by 0.005° has been used, in the longitudinal and latitudinal directions respectively. The second computational grid (Domain 2) has been reduced to 0.00075 by 0.00075° length cells, and includes the southwest portion of the Mauritian coast, to account for wave transformation when the waves are approaching the nearshore area. The rectangular boundary coordinates are 20.22° S to 20.52° S and 57.23° E to 57.38° E. The third and most refined grid has cell sizes of 0.00016° in the longitudinal direction and 0.0002 ° in the latitudinal direction. Such spatial resolution roughly equates to 18 m × 22 m. Domain 3 extends between 20.265° S to 20.325° S and 57.340° E to 57.38° E.
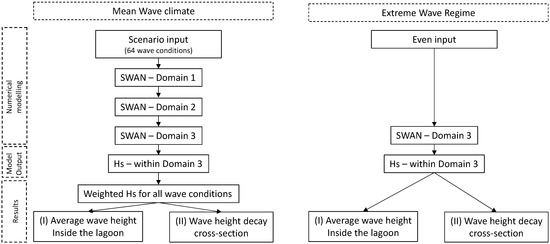
Figure 2.
Flowchart of the modelling process and results produced.
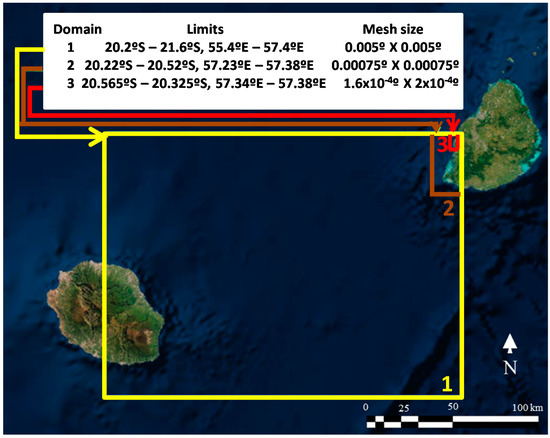
Figure 3.
Computational boundaries and mesh size of the three nested domains used in SWAN model. The yellow one is the coarsest, whereas the red one is the finest.
Added to the existing threats are further increases in the local water temperature and water acidity as presented in the IPCC AR5. Comparison of climate model projections between year intervals of 1986 to 2005 and 2081 to 2100 [38], indicates that coral bleaching events will increase, in frequency and magnitude. If the death rate of coral in Flic-en-Flac persists over the next decades at the same rate than the last 50 years, a smooth coral pavement is expected to replace the remaining live coral. This assumption will be used in the modeling step. This is a key factor since reef roughness and the associated bottom friction are important parameters that govern nearshore hydrodynamics, wave energy dissipation, wave run-up, wave setup, and coastal flooding [49]).
The friction factor of the seabed has been estimated from measurements performed on other reef sites, of variable coral characteristics. High variability exists due to differences in the type, density, structural complexity, and coral distribution of each site. Shepard et al. [50], based on a study carried out in the Seychelles, estimated a friction factor of 0.1 for a smooth coral pavement and 0.2 for a healthy coral reef. Quataert et al. [19] and Lowe et al. [51] reported friction coefficients of 0.3 from field data from reefs in the Marshall Islands and Hawaii respectively. Osorio-Cano et al. [17] claim that friction factors are within the range of 0.2–0.3 for healthy coral reefs. Nevertheless, some studies report higher friction coefficients in reefs of higher complexity such as 0.6 and 0.8 at the Ningaloo reef [29] and 1.8 at the structurally complex forereef at Palmyra Atoll [52]. Estimates have been made by assuming that alive coral reef has higher structural complexity and, in turn, higher friction factor than a dead coral. A friction factor similar to smooth coral pavement measured in the Seychelles by Sheppard et al. [50] has been assigned to the predicted degraded coral seafloors in the future (dead coral). This unhealthy coral reef in the future is considered by assuming that due to climate change there will be an increase in water ocean temperature and acidification. Hence, most of the coral would perish. A dead coral presents less complexity and does not grow, being eroded by the waves and, therefore, becoming smoother. For live coral (present situation), due to its patchy nature in this area, a limited value of the friction factor (0.25) has been chosen, in the range indicated by [17,19,50,51]. In the lagoon, the presence of sand reduces the friction; then, and the coefficient should be smaller. The selected friction factors are indicated in Table 1.

Table 1.
Friction coefficients assumed in the numerical modeling (adimensional units).
The water levels considered include one for present level and three water level projections taken from the IPCC AR5 [35] corresponding to levels predicted under the representative concentration pathways (RCP) RCP4.5 and RCP8.5. As a reference basis to the future levels, the year interval of 1986 to 2005 has been considered to correspond to the current levels, and assumed to be at local mean sea level (LMSL).
Different sea levels have been tested to evaluate the magnitude and variability in the wave dissipation based on the different SLR predictions provided in the IPCC AR5 [38]. One sea water level percentile has been taken from the RCP4.5 predictions, and two from the RCP8.5 predictive models. The three levels include: the regional mean water level value of the prediction range for the RCP4.5 and RCP8.5, as well as the upper 5% occurrence of the global predicted water level using the RCP8.5 scenario, as presented in Table 2.

Table 2.
Regional mean sea level change considered in the numerical modelling (bold letter). In brackets, the 95% confidence interval. Based on Wong et al. [53].
Since the joint probability of tide and wave conditions is unknown, to keep consistency in the SWAN model results, the runs have been performed in a stationary mode at the LMSL for all the cases corresponding to the mean climate scenarios. This assumption has been considered as feasible because this area is a semi-diurnal microtidal environment with a tidal range of 0.8 m. In the same way, for extreme events, due to the lack of correlation between tides and storms, they should be treated independently. In order to consider the worst-case scenario, the highest astronomical tide has been chosen for the extreme wave climate.
The default Jonswap (γ = 3.3) spectra have been used as input for the incoming southwesterly swell. The depth induced wave breaking parameters have been based on findings from laboratory experiments and field observations by Filipot & Cheung [27] with breaker index γ = 0.94 and energy dissipation constant B = 1.09. Since the winds in the domain are predominantly from E to ESE, wave generation has been considered negligible, as well as whitecapping, since it is closely related to the wind [54]. The direction has been discretized into 36 bins spaced 10°. The mean tide level has been used for all scenarios to allow for a common basis of comparison.
Concerning the wave height, the IPCC [38] reports a likely increase between 1%–5% of the wind velocities in the austral winter inducing, as a consequence, a certain increase of wave heights in that region. In addition, using altimeter data collected between 1992 and 2012, Gupta et al. [55] identify a steady increase in mean wind speed and Hs in the South Indian Ocean. For this reason, in this study, an Hs increase of 5% has been considered in scenario 6 of the mean climate analysis.
Finally, the model’s bathymetric inputs have been obtained by digitizing with ArcMAP10.5 the bathymetric information of navigational charts (Navionics) and specific bathymetric maps of the Flic-en-Flac lagoon provided by the Mauritius Oceanographic Institute (MOI).
2.3. Defined Scenarios and Events for Analysis
The mean wave climate has been modeled under 7 different scenarios (Table 3) and the extreme wave climate for 12 different events (Table 4) to compare the effects of changing conditions, notably under conditions of dead coral, and no growth over the current reef height. In the case of mean wave climate, each analyzed scenario required 64 simulations; one for each combination of significant wave height (Hs), peak period (Tp), and wave direction (see Table S1); while for extreme climate, each event only implied one simulation.

Table 3.
Mean wave climate scenarios.

Table 4.
Extreme wave scenarios (RP = Return period, Hs = significant wave height, Tp = peak period, SLR = sea level rise).
The scenario used for reference has as input the current water levels at LMSL and a friction factor associated with the current coral state (relatively healthy but patchy). Scenario 1 to 3 have been chosen to represent future conditions with dead coral, and no growth over the current reef height for SLR corresponding to the three predicted sea level increases, presented in Table 1. Scenario 4 replicates the input parameters of the reference scenario, except for using a lower friction factor, to evaluate the effect of the lower friction associated with dead coral. Scenario 5 input only differs from scenario 1 in its friction coefficients, to also evaluate effects of changing friction coefficient, but at a different water level. To compare the effect of the potential increase in the mean significant wave height in the south Indian Ocean belt [38,55], the Hs of Scenario 6 is increased by 5% while all other input conditions match that of Scenario 2.
The events defined in the extreme wave climate combine four sets of different return period wave conditions (i.e., 5, 25, 50, and 100 years), modeled for the present reef and water level conditions and for two future conditions (RCP4.5 and RCP 8.5), as presented in Table 4. Twelve extreme events have been chosen for two reasons: (i) to provide a comparison basis between the magnitude of the effects caused by events of increasing storminess and (ii) cover both present and future conditions of sea level and friction associated with the coral reef condition.
3. Results
3.1. Mean Wave Climate Scenarios
Figure 4 and Figure S3 (supplementary material) feature color maps of the Flic-en-Flac lagoon representing the average Hs inside the lagoon for all scenarios, calculated as exposed in Section 2.2. In these figures, large variations in the values of Hs can be observed for the different scenarios, highlighting the influence of the different parameters: in particular sea level and reef conditions, in the wave height entering the lagoon.
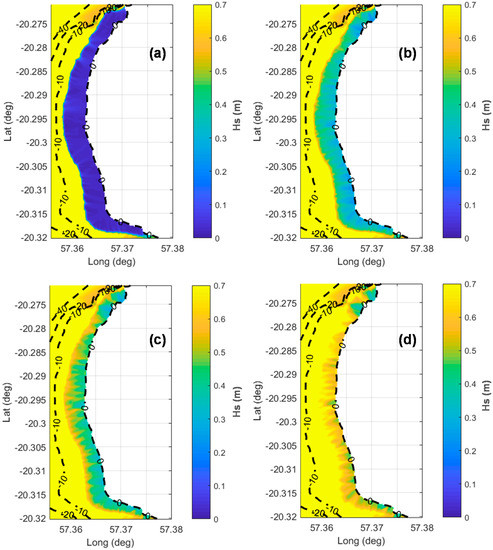
Figure 4.
Map of significant wave heights (Hs) for mean wave climate. The colored areas are the wave fields whereas the discontinuous black lines are the isobaths. Units in meters. (a): Reference scenario. (b): Scenario 1. (c): Scenario 2. (d): Scenario 3.
For the reference scenario (Figure 4a) and mean wave climate, the average wave heights within the lagoon are very small (< 0.1 m), denoting that, under present conditions, almost all the wave energy is dissipated on the reef and wave is mainly damped. Conversely, assuming an SLR of 0.52 m (RCP4.5) and dead coral (scenario 1), wave heights in the lagoon range between 0.25 and 0.45 m (Figure 4b). At the same dead coral condition, a slightly greater SLR corresponding to mean projection for RCP8.5 (0.68 m, scenario 2) increases wave heights in the lagoon to values between 0.3 and 0.6 m (Figure 4c). If the SLR considered is the upper limit of RCP8.5 (0.98 m, scenario 3), wave heights in the lagoon are greater, ranging between 0.5 and 0.8 m (Figure 4d).
In the same way, without SLR but with a dead reef condition (Scenario 4), the average wave pattern within the lagoon is similar to the one under present conditions (< 0.15 m), although slightly greater. If the reef condition preserves its present roughness but with an SLR of 0.52 m (Scenario 5), the wave heights vary between 0.2 and 0.4 m. Finally, for the RCP4.5 scenario, dead coral and an increase of 5% in wave heights based on wave future projections, the average Hs within the lagoon ranges from 0.35 to 0.7 m (Figure S3).
3.2. Extreme Wave Scenarios
The color maps in Figure 5 and Figure 6 and Figure S4 (supplementary material) represent the wave heights inside the lagoon of each of the output of the extreme event runs. In the case of present conditions (SLR = 0 m, coral reef with current state), larger return periods lead to greater wave heights within the lagoon, as shown in Figure 5.
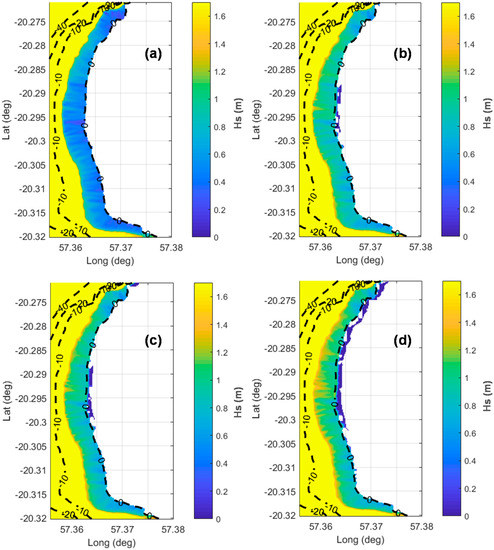
Figure 5.
Map of significant wave heights (Hs) for extreme wave climate under present conditions. The colored areas are the wave fields, whereas the discontinuous black lines are the isobaths. Units in meters. (a): Event Ev1. (b): Event Ev2. (c): Event Ev3. (d): Event Ev4.
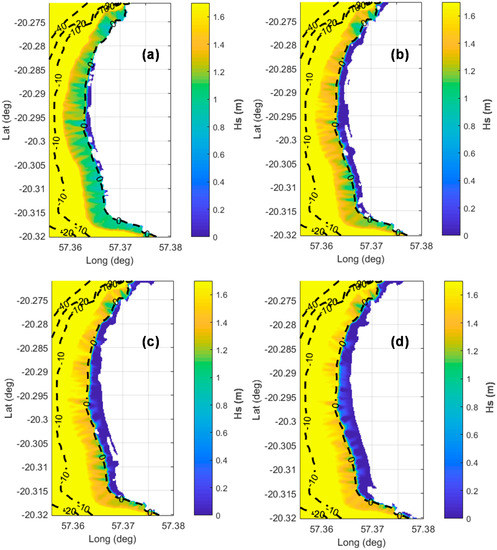
Figure 6.
Map of significant wave heights (Hs) for extreme wave climate under RCP8.5 scenario. The colored areas are the wave fields, whereas the discontinuous black lines are the isobaths. Units in meters. (a): Event Ev9. (b): Event Ev10. (c): Event Ev11. (d): Event Ev12.
For return periods (RP) of 5 years, Hs varies between 0.45 m and 0.70 m (Figure 5a). For greater return periods, the wave heights within the lagoon increase significantly, with values between 0.6 and 1.2 m for a return period of 25 years (Figure 5b). This last wave pattern is similar to that for RP = 50 years (Figure 5c). Under exceptional storms (RP = 100 years) waves in the lagoon range between 0.7 and 1.4 m (Figure 5d).
For a RCP4.5 scenario, assuming an SLR = 0.52 m and dead coral reefs, the obtained results are somewhat different (Figure S4). In this case, for RP = 5 years, Hs within the lagoon has values between 0.75 and 1.4 m. As the return period increases, waves within the lagoon are higher. Thus, for RP = 25 years wave heights range between 1.1 and 1.6 m, for RP = 50 years between 1.2 and 1.7 m and for RP = 100 years between 1.2 and 1.9 m. Notice that in the two last cases, the isostatic sea level rises significantly along all the beach, flooding large areas of the dry beach.
The last scenario simulated is RCP8.5, with SLR = 0.68 m and dead coral reef and the corresponding results are shown in Figure 6. The events analyzed for this scenario give values of Hs within the lagoon slightly greater than those of a RCP4.5 scenario (about 10%). For RP = 5 years, the values of Hs range between 0.8 and 1.5 m (Figure 6a), for RP = 25 years between 1.15 and 1.7 m (Figure 6b), for RP = 50 years between 1.3 and 1.85 m and for RP = 100 years between 1.4 and 2.1 m. Notice that in this scenario, all events flood the dry beach. In the case of RP = 5 years, only the central stretch of the beach has the impact of wave run-up. In all other events, the flooding occurs along the entire beach, being the flooded surface larger as the return period increases.
4. Discussion
The wave heights inside the lagoon have been averaged to a single value, then allowing quantitative comparison among scenarios, presented as a bar chart in Figure 7. Given an offshore average wave height of 1.45 m for all scenarios except Scenario 6, wave decay can be estimated by computing the ratio between the average Hs inside the lagoon and the average deep water waves. Results of the wave decay, calculated for the reference scenario approximate to 98%. With the only difference in their propagated wave heights, Scenario 2 and Scenario 6 were found to dissipate 87% and 88% of the incoming wave energy, respectively.
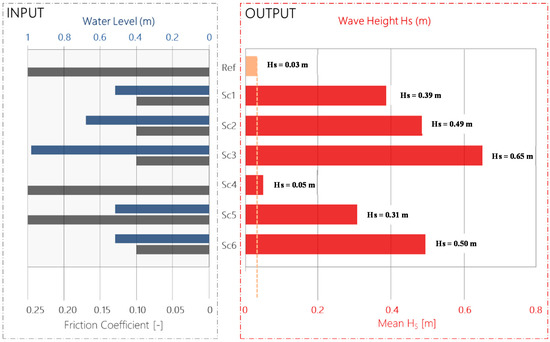
Figure 7.
Bar chart of average significant wave height inside the lagoon for all scenarios. Left: input parameters, friction coefficient (gray), and sea level (blue). The reef health status is indicated by the friction coefficient (see Table 1). Right: output parameter, wave height (red).
Modeled wave heights propagate over the reef and give insight to the energy dissipation processes. The main processes can be interpreted by observing the plotted wave heights along a perpendicular cross-section to the reef (section A-A’ as drawn in Figure 1), as represented in Figure 8.
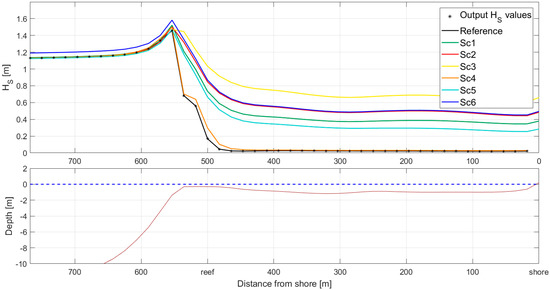
Figure 8.
Spatial distribution of Hs across A-A’ section (Figure 1) for all scenarios. The reference scenario is the solid black line, whereas the coloured lines represent the Hs propagation for all scenarios. Units in m. The bottom graph shows the water depth to illustrate the influence of the reef in the wave height.
The increases in wave height when reaching the reef, denote wave shoaling. Depth induced breaking occurs on the reef crest and, on the reef flat, bottom friction dissipates the wave energy further. Finally, there is a slight increase of wave height close to the shoreline, when waves propagate over a short slope.
Under the future scenarios 1 to 3 (Figure 8), the wave heights increase significantly in the lagoon, relative to the Reference case. As expected, the higher the SLR, the higher the waves within the lagoon and across the reef. At LMSL, the waves are nearly fully dissipated, while for the highest sea-level increase of 0.98 m, there is only a 55% reduction of incoming wave height. For Sc1 and Sc2 cases, the wave height outputs inside the lagoon show an increase of 2 orders of magnitude relative to the reference scenario (see Figure 7). Under scenario 5 conditions, in which only the sea level is changed relative to the reference conditions, a 10-fold increase in wave heights within the lagoon is modeled. The increased water levels induce less energy dissipated, mainly caused by lower depth induced breaking.
In Figure 8, a shift in the location of Hs peaks is found closer to the shoreline for Sc3, compared with the reference case. This indicates that wave breaking happens closer to the reef flat. Hence, changes in water levels induce changes in the localization of wave altering processes.
The contribution to wave height decay, due to the friction coefficient variations may be estimated by comparing the Hs between the Reference Scenario and Sc4 and between Scenarios 1 and 5. Based on the average wave heights presented in Figure 7, it has been found that models with a friction coefficient referring the current reef state, reduce the wave height between 21% (Sc5 relative to Sc1) and 35% (Reference to Sc4); when compared to scenarios with a friction coefficient associated with a smooth coral pavement.
Scenario 2 and Scenario 6 may be compared to evaluate the effect of a 5% offshore wave height increase at the outer SWAN model boundary. Their wavefields are also presented at cross-section A-A’, as shown in Figure 8. The average wave heights in the lagoon for Scenario 6 are 1.6% higher than the ones of Scenario 1.
The mean wave climate analysis shows that waves propagated over the reef are larger inside the lagoon under the following constraints: (i) high water levels, (ii) high waves, and (iii) lower bottom friction coefficients. Similarly, for the extreme wave climate analysis, higher waves are modeled under coupled SLR scenarios and decreased bottom friction.
In the case of mean wave climate, depth induced breaking is the main process for most of the energy decay at the reef crest. As water levels increase, depth induced breaking and friction-induced decay dissipate less energy. These results are in accordance with the ones obtained by Pascolo et al. [56]. Bottom friction energy dissipation on the fore reef does not contribute significantly to defining the wave height within the lagoon since the water depths at the shallowest point of the reef controls the waves propagating across the flat [57]. The reef flat and crest are the areas where bottom friction affects wave decay the most, once depth-induced breaking takes place due to the shallower depths [58]. The greater the bottom roughness and the more the coral cover complexity present on the flat, the higher energy dissipation will be expected [49,59]. However, such locations do not typically sustain a complex 3D bathymetry due to the turbulence of the environment.
The forecasted effects of reduced bottom friction on energy dissipation are not as significant as the ones from the SLR. The time scale for which coral complexity could be compromised is, nevertheless, much faster and unpredictable; for instance, in case of coral loss due to bleaching. Under increased frequency and intensity of bleaching events [60], large scale coral mortality could lead to less friction and larger wave height, which may bring other undesirable consequences. Thus, for example, in the Seychelles, an important amount of coastal erosion has been attributed to the loss of coral complexity, within less than a decade after the 1998 coral bleaching event. The bleaching event caused coral decay and coral rounding, and since that episode, considerably more energy was estimated to reach the shores [50].
In addition to SLR and reduction of friction due to coral reef mortality, climate change also may entail changes in wave patterns. In this way, model simulations carried out with an increase of wave height input (+ 5%) resulted in an average wave height increase of 1.6% inside the lagoon, when modeled for Scenarios 2 and 6. These results suggest that whether the projected increase in the southern storm continues to intensify [55], the local wave condition in the Flic-en-flac lagoon may be affected, but to a lesser degree than those changes derived from SLR or bottom friction. The increased wave height is also under considerable uncertainty since the IPCC associates this prediction with a medium level of confidence [38].
Another observed effect is that the turbulence caused by wave breaking varies across the reef with time and space, notably when subjected to changing tides and wave conditions. Neglecting the tidal effects, a shift in the location of the wave breaking is observed to be closer to the reef flat when SLR occurs. This may alter the hydrodynamics of the area and could affect the ecosystem, increasing bioerosion [61] and sediment suspension in the lagoon.
One of the main constrains of this study is that water levels over the reef have a direct and significant effect on the waves entering the lagoon. Since the projected sea levels from the IPCC have a wide range of uncertainty, the results between the different scenarios do as well.
Results for extreme climatic events under future cases (Event 5–12) are compared to results from the modeled present conditions (Event 1–4) to evaluate the effects of changing sea levels and bottom friction. To compare the effects of changing return periods, events 1 to 4, 5 to 8, and 9 to 12 are compared between each other. As expected, higher waves are noted to propagate into the lagoon for events of higher return period and for events of higher SLR and lower friction coefficients (Figure 9).
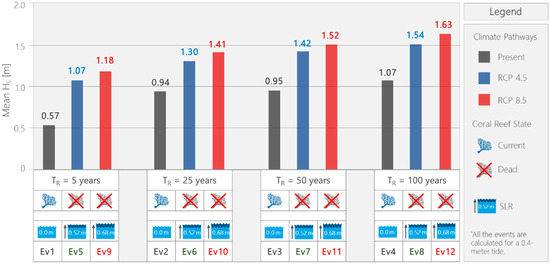
Figure 9.
Values of average significant wave height (Hs) within the lagoon for the extreme wave climate events indicating the main differences among them. TR is the return period and SLR is the sea level rise.
Similarly, the larger the cyclonic conditions, the higher the waves inside the lagoon, for present and future SLR projections. Some of the relative cases can be observed in Figure 10 depicting the Hs field across the reef for events 1 to 4. The magnitude of the increase in wave heights inside the lagoon between 5-year and 100-year return period events ranges from 38% (Ev12 with respect to Ev9) to 88% (Ev4 with respect to Ev1).
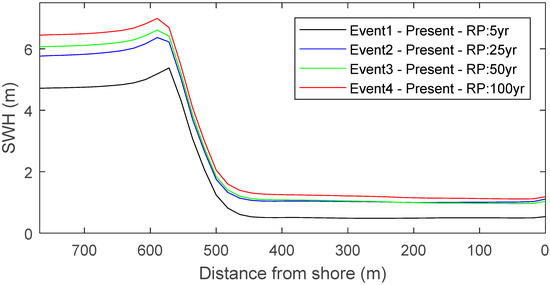
Figure 10.
Spatial distribution of Hs across the reef at section A-A’ for the events under present conditions. The reference scenario is the solid black line, whereas the colored lines represent the Hs propagation for all scenarios.
For each of the extreme wave conditions associated with a return period (5, 25, 50 and 100 years) the increase between the present and future event simulation ranges from 38% to 88% under RCP4.5 SLR scenarios, and from 50% to 107% under RCP8.5 SLR scenarios, as presented in Table 5.

Table 5.
Increase in percentage of average significant wave height (Hs) in the lagoon under extreme events for future scenarios relative to present conditions. RP is the return period.
For different sea levels and friction coefficients, values of Hs along the transect A-A’ are shown in Figure 11 for RP = 5 years. An SLR of 0.52 m (RCP4.5) and a change of reef condition results in an increase of 88% in the average Hs within the lagoon. A greater SLR of 0.68 m (RCP8.5) with also dead coral reef entails an increase of the average Hs within the lagoon of 107% with respect to present conditions.
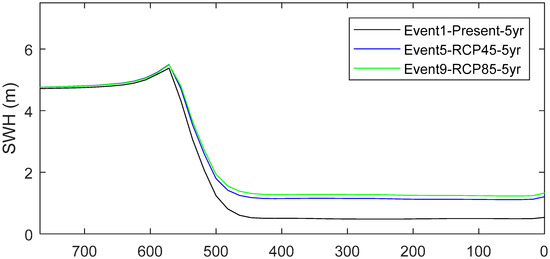
Figure 11.
Evolution of Hs across the reef at section A-A’ for 5-year return period events and different projected SLR scenarios.
Extreme wave climate results showed larger waves inside the lagoon for projected future sea levels when compared to current ones. The increases relative to present were noted to be around 40 to 50% and between 50 and 60%, under RCP4.5 and RCP8.5 SLR conditions respectively, when considering return periods of 25, 50, 100 years. Cyclonic events have had disastrous coastal repercussions, notably after cyclone Carol in 1960, when in Flic-en-Flac, the embankment underwent 5 m of cross-shore erosion [62]. This suggests that the coastline would be at high risk of much larger erosion events than previously experienced. Many cyclonic climatic factors contribute to the extent of coastal damage from a cyclone including storm surge, rainfall, winds, and wave setup. Nonetheless, for any given cyclonic event, if deteriorating reefs and sustained SLR take place, then significantly greater coastal damages are to be expected.
Although the SWAN model could not be validated due to the lack of recorded data in the area, the modeled wave height decay by the barrier reef for the reference scenario (between 84% and 89%) matches the range indicated in literature. In Baird [39] study, a wave height decay of 90% was measured across a reef on the east coast of Mauritius. Péquignet, et al. [63] measured 97% wave height decay in Guam, Ferrario et al. [2] suggested that 97% of the wave energy is dissipated by reef crests on average and Costa et al. [64] found that reefs attenuate up to 99.9% of wave energy with a mean of 88%. This suggests that the model results are reasonable and in the range found by other authors.
The overall results of this paper suggest that more energy would propagate over the Flic-en-Flac reef, under the IPCC projected conditions of 2081–2100, compared to present conditions. The consequences of hydrodynamic changes may affect coastal defenses, fisheries by causing habitat and diversity losses, recreation, changes in the shoreline, erosion, and increased hazard risks [2]. Time-varying calibrated models from field data, used to simulate the effects of SLR and coral reef deterioration on lagoon hydrodynamics would help for best planning and management for the near and long-term future conditions.
The most fundamental measure to mitigate the increased Hs of waves across the lagoon as a consequence of climate change is to maintain the reef’s health in the best possible condition. Healthy reefs will ensure wave energy dissipation through high bottom friction. Additionally, live coral may be able to keep pace with the SLR rate, and in turn, continue to cushion the energy entering the lagoon through depth induced breaking.
The main anthropogenic impacts that affect coral reef health include increased eutrophication and sedimentation, pollution due to the lack of adequate sewage treatment system, unsustainable tourism (walking on the reefs, diving, boat trips, anchoring), overfishing or destructive fishing practices, coral mining [1,65], sediment and nutrient run-off due to changes in terrestrial ecosystems [66,67], traffic of vessels with associated stranding and shedding of substances at the sea, introduction of invasive species that compete for food and habitat [68], solid wastes such as plastic and fishing gear that can destroy coral reefs by abrasion, suffocation or fragmentation of habitat and species [69]. Therefore, in a first phase, a reduction of the local stressors would be required. The main anthropogenic stressors to be addressed in Flic-en-Flac would include destructive fishing practices [1,66], recreational damage, effluent discharge, siltation [66,67], and freshwater input [39].
In a second phase, coral reef restoration should be considered. Coral restoration projects under the building with nature framework are being increasingly considered at coastal planning. That may be a supported alternative to ensure the coral reefs continue dissipating the incoming waves in Flic-en-Flac. Ferrario et al. [2] found that the cost of restoring reefs is lower than building a low crested breakwater, despite the former would provide equivalent coastal protection. There are reports of successful coral nursery farms in Florida [70] and re-attachment of naturally fragmented branched-corals in the Mexican Pacific [71]. In addition, in coral reef areas completely degraded, techniques based on transplant methods [72,73] have also been successfully used for their restoration. Since energy dissipation processes vary across the barrier reef, it is essential to plan the layout of restoration works according to the dissipation process of greater interest.
Consequently, to preserve ecosystem services by coral reefs (in particular coastal protection), it is mandatory to adequate human activities to the resilience and carrying capacity limits of each system [74]. The coastal zone requires immediate action regarding environmental degradation factors, reducing stressors, and including the definition of more restrictive environmental protection areas [1]. Besides activity restrictions and using restoration techniques to mitigate the coral coverage loss [71], we recommend the application of other management actions, such as activity restrictions, the increase in public awareness, and educational workshops addressed to stakeholders and local communities. For sustainable tourism in areas with coral reefs, Cowburn et al. [75] recommend the development of reef management plans which include coastal erosion and beach management, waste control and management, logistics, and social responsibility. Only a determined action that integrates all these factors could help to preserve the Flic-en-Flac coral reef and maintain the beach it protects.
5. Conclusions
In this work, the impact of climate change on the incoming wave height reaching a beach protected by a coral reef has been analyzed through numerical modeling. The three input variables observed to have an effect on the wave height in the lagoon surrounding Flic-en-Flac beach are: (i) water levels; (ii) friction coefficients and (iii) incoming wave heights. The modeled wave height outputs were noted to be of different magnitudes for each of the listed input variables. For changing SLR from present to future conditions, the average wave heights within the lagoon were found to vary in the scale of orders of magnitude. Changes between present and future coral roughness induce an increase of wave height in the range of 21 to 35%, while present and future wave height inputs show a 1.6% variation in average wave heights in the lagoon. Although the SLR will have the most significant effect on Hs when addressing future projections, changes in the friction and wave heights are forecasted to evolve differently over time and will therefore have significance over different time scales.
To prevent an increase in wave energy reaching Flic-en-Flac beach it is necessary to maintain the reef’s health. This would ensure wave energy dissipation through high bottom friction and it would allow the coral reef growth to keep pace with the SLR rate, necessary for equivalent wave height dissipation through depth induced breaking. This requires a series of actions including the reduction of local anthropogenic impacts, coral restoration, and management strategies that include activity restrictions and increase of public awareness.
Supplementary Materials
The following are available online at https://www.mdpi.com/2073-4441/12/6/1681/s1 Figure S1 Cross-shore section of the reef representing the typical depths of the nearshore in Flic-en-Flac; Figure S2 Mean wave roses at node 1 (left) and node 2 (right) based on 39 years of Era Interim data; Figure S3 Map of significant wave heights (Hs) for mean wave climate; Figure S4 Map of significant wave heights (Hs) for extreme wave climate under RCP4.5 scenario; Table S1 List of the wave conditions (including wave height, period and direction) considered in the mean climate analysis. Significant wave heights.
Author Contributions
Conceptualization, V.G. and J.P.S.; methodology, V.G. and J.P.S.; software, C.l.H.d.L., J.L.-Y., and M.G.-L.; validation, C.l.H.d.L. and M.G.-L.; formal analysis, C.l.H.d.L., V.G., and J.P.S.; investigation, C.l.H.d.L., V.G., J.P.S., and M.G.-L.; resources, C.l.H.d.L., J.L.-Y., and M.G.-L.; data curation, C.l.H.d.L. J.L.-Y., and M.G.-L.; writing—original draft preparation, C.l.H.d.L., V.G., and J.P.S.; writing—review and editing, V.G. and J.P.S.; visualization, C.l.H.d.L., and J.P.S.; supervision, V.G. and J.P.S.; project administration, V.G. and J.P.S.; funding acquisition, V.G. and J.P.S. All authors have read and agreed to the published version of the manuscript.
Funding
This research was funded by the Spanish Ministry of Economy and Competitiveness, through the project COBALTO (Ref.CTM2017-88036-R). The support of the Secretaria d’Universitats i Recerca del Dpt. d’Economia i Coneixement de la Generalitat de Catalunya (Ref 2014SGR1253) is also acknowledged.
Acknowledgments
The authors are grateful to the European Commission for the support to the CoMEM master program during which a portion of this work was carried out. Additionally, the authors would like to thank the organizations, institutions and companies who have shared some valuable information. All the staff at the MOI for corresponding and sharing wave data and bathymetric maps related to the study site, the MMCS for sharing valuable information about the study area and Baird & Associates for sharing some of their report appendices.
Conflicts of Interest
The authors declare no conflict of interest.
References
- Elliff, C.; Kikuchi, R.K.P. Ecosystem services provided by coral reefs in a Southwestern Atlantic Archipelago. Ocean. Coast. Manag. 2017, 136, 49–55. [Google Scholar] [CrossRef]
- Ferrario, F.; Beck, M.W.; Storlazzi, C.D.; Micheli, F.; Shepard, C.C.; Airoldi, L. The effectiveness of coral reefs for coastal hazard risk reduction and adaptation. Nat. Commun. 2014, 5, 3794. [Google Scholar] [CrossRef] [PubMed]
- Nemes, D.D.; Criado-Sudau, F.F.; Gallo, M. Beach Morphodynamic Response to a Submerged Reef. Water 2019, 11, 340. [Google Scholar] [CrossRef]
- Calabrese, M.; Vicinanza, D.; Buccino, M. 2D Wave setup behind submerged breakwaters. Ocean. Eng. 2008, 35, 1015–1028. [Google Scholar] [CrossRef]
- Sierra, J.P.; González-Marco, D.; Ridge, M.M.; Gironella, X.; Oliveira, T.C.; Cáceres, I.; Mösso, C. Numerical model for wave overtopping and transmission through permeable coastal structures. Environ. Model. Softw. 2010, 25, 1897–1904. [Google Scholar] [CrossRef]
- Sierra, J.P.; Dowding, D.D.; Persetto, V.; Oliveira, T.A.C.; Gironella, X.; Mösso, C.; Mestres, M. Wave reflection, transmission and spectral changes at permeable low-crested structures. J. Coast. Res. 2011, SI 64, 593–597. [Google Scholar]
- Vetter, O.; Becker, J.M.; Merrifield, M.A.; Pequignet, A.-C.; Aucan, J.; Boc, S.J.; Pollock, C.E. Wave setup over a Pacific Island fringing reef. J. Geophys. Res. Space Phys. 2010, 115, 12066. [Google Scholar] [CrossRef]
- Lowe, R.; Koseff, J.R.; Monismith, S.G. Oscillatory flow through submerged canopies: 1. Velocity structure. J. Geophys. Res. Space Phys. 2005, 110, 10016. [Google Scholar] [CrossRef]
- Hoeke, R.; Storlazzi, C.; Ridd, P. Hydrodynamics of a bathymetrically complex fringing coral reef embayment: Wave climate, in situ observations, and wave prediction. J. Geophys. Res. Space Phys. 2011, 116, 04018. [Google Scholar] [CrossRef]
- Sheremet, A.; Kaihatu, J.; Su, S.-F.; Smith, E.; Smith, J. Modeling of nonlinear wave propagation over fringing reefs. Coast. Eng. 2011, 58, 1125–1137. [Google Scholar] [CrossRef]
- Lowe, R.; Falter, J.L.; Koseff, J.R.; Monismith, S.G.; Atkinson, M.J. Spectral wave flow attenuation within submerged canopies: Implications for wave energy dissipation. J. Geophys. Res. Space Phys. 2007, 112, 05018. [Google Scholar] [CrossRef]
- Gardner, T.A.; Côté, I.M.; Gill, J.A.; Grant, A.; Watkinson, A.R. Hurricanes and Caribbean coral reefs: Impacts, recovery patterns, and role in long-term decline. Ecology 2005, 86, 174–184. [Google Scholar] [CrossRef]
- Beeden, R.; Maynard, J.; Puotinen, M.; Marshall, P.; Dryden, J.; Goldberg, J.; Williams, G. Impacts and Recovery from Severe Tropical Cyclone Yasi on the Great Barrier Reef. PLoS ONE 2015, 10, e0121272. [Google Scholar] [CrossRef] [PubMed]
- Hughes, T.P.; Kerry, J.T.; Connolly, S.R.; Baird, A.; Eakin, C.M.; Heron, S.F.; Hoey, A.S.; Hoogenboom, M.O.; Jacobson, M.; Liu, G.; et al. Ecological memory modifies the cumulative impact of recurrent climate extremes. Nat. Clim. Chang. 2018, 9, 40–43. [Google Scholar] [CrossRef]
- Puotinen, M.; Maynard, J.A.; Beeden, R.; Radford, B.; Williams, G.J. A robust operational model for predicting where tropical cyclone waves damage coral reefs. Sci. Rep. 2016, 6, 26009. [Google Scholar] [CrossRef]
- Harmelin-Vivien, M.L. The effects of storms and cyclones on coral reefs: A review. J. Coast. Res. 1994, 12, 211–231. [Google Scholar]
- Osorio-Cano, J.D.; Alcérreca-Huerta, J.C.; Mariño-Tapia, I.; Osorio, A.F.; Acevedo-Ramírez, C.; Enriquez, C.; Costa, M.; Pereira, P.; Mendoza, E.; Escudero, M.; et al. Effects of Roughness Loss on Reef Hydrodynamics and Coastal Protection: Approaches in Latin America. Chesap. Sci. 2019, 42, 1742–1760. [Google Scholar] [CrossRef]
- Baldock, T.; Golshani, A.; Callaghan, D.; Saunders, M.; Mumby, P.J. Impact of sea-level rise and coral mortality on the wave dynamics and wave forces on barrier reefs. Mar. Pollut. Bull. 2014, 83, 155–164. [Google Scholar] [CrossRef]
- Quataert, E.; Storlazzi, C.; Van Rooijen, A.; Cheriton, O.M.; Van Dongeren, A.; Van Dongeren, A. The influence of coral reefs and climate change on wave-driven flooding of tropical coastlines. Geophys. Res. Lett. 2015, 42, 6407–6415. [Google Scholar] [CrossRef]
- Franklin, G.L.; Torres-Freyermuth, A.; Medellín, G.; Allende-Arandia, M.E.; Appendini, C.M. The role of the reef–dune system in coastal protection in Puerto Morelos (Mexico). Nat. Hazards Earth Syst. Sci. 2018, 18, 1247–1260. [Google Scholar] [CrossRef]
- Baker, A.C.; Glynn, P.W.; Riegl, B. Climate change and coral reef bleaching: An ecological assessment of long-term impacts, recovery trends and future outlook. Estuar. Coast. Shelf Sci. 2008, 80, 435–471. [Google Scholar] [CrossRef]
- Jury, C.P.; Thomas, F.; Atkinson, M.J.; Toonen, R.J. Buffer Capacity, Ecosystem Feedbacks, and Seawater Chemistry under Global Change. Water 2013, 5, 1303–1325. [Google Scholar] [CrossRef]
- Ogston, A.S.; Field, M. Predictions of Turbidity Due to Enhanced Sediment Resuspension Resulting from Sea-Level Rise on a Fringing Coral Reef: Evidence from Molokai, Hawaii. J. Coast. Res. 2010, 26, 1027–1037. [Google Scholar] [CrossRef]
- Storlazzi, C.; Elias, E.; Field, M.E.; Presto, M.K. Numerical modeling of the impact of sea-level rise on fringing coral reef hydrodynamics and sediment transport. Coral Reefs 2011, 30, 83–96. [Google Scholar] [CrossRef]
- Grady, A.E.; Moore, L.J.; Storlazzi, C.; Elias, E.; Reidenbach, M.A. The influence of sea level rise and changes in fringing reef morphology on gradients in alongshore sediment transport. Geophys. Res. Lett. 2013, 40, 3096–3101. [Google Scholar] [CrossRef]
- Wegner, C.; Ellis, J. The Influence of Sea-Level Rise on Wave-Energy Dissipation and Wave-Driven Currents at Buck Island Reef National Monument. J. Coast. Res. 2017, 331, 56–66. [Google Scholar] [CrossRef]
- Filipot, J.-F.; Cheung, K.F. Spectral wave modeling in fringing reef environments. Coast. Eng. 2012, 67, 67–79. [Google Scholar] [CrossRef]
- Booij, N.; Ris, R.C.; Holthuijsen, L. A third-generation wave model for coastal regions: 1. Model description and validation. J. Geophys. Res. Space Phys. 1999, 104, 7649–7666. [Google Scholar] [CrossRef]
- Van Dongeren, A.; Lowe, R.; Pomeroy, A.; Trang, D.M.; Roelvink, D.; Symonds, G.; Ranasinghe, R. Numerical modeling of low-frequency wave dynamics over a fringing coral reef. Coast. Eng. 2013, 73, 178–190. [Google Scholar] [CrossRef]
- Lashley, C.H.; Roelvink, D.; Van Dongeren, A.; Buckley, M.L.; Lowe, R.J. Nonhydrostatic and surfbeat model predictions of extreme wave run-up in fringing reef environments. Coast. Eng. 2018, 137, 11–27. [Google Scholar] [CrossRef]
- Roelvink, D.; Reniers, A.J.; Van Dongeren, A.; Vries, J.V.T.D.; McCall, R.; Lescinski, J.; Van Dongeren, A. Modelling storm impacts on beaches, dunes and barrier islands. Coast. Eng. 2009, 56, 1133–1152. [Google Scholar] [CrossRef]
- McCabe, M.V.; Stansby, P.K.; Apsley, D.D. Random wave runup and overtopping a step seawall: Shallow-water and Boussinesq modelling with generalized breaking and wave impact algorithms validated against laboratory and field measurements. Coast. Eng. 2013, 74, 33–49. [Google Scholar] [CrossRef]
- Fang, K.-Z.; Yin, J.-W.; Liu, Z.-B.; Sun, J.-W.; Zou, Z.-L. Revisiting study on Boussinesq modeling of wave transformation over various reef profiles. Water Sci. Eng. 2014, 7, 306–318. [Google Scholar]
- Shimozono, T.; Tajima, Y.; Kennedy, A.; Nobuoka, H.; Sasaki, J.; Sato, S. Combined infragravity wave and sea-swell runup over fringing reefs by super typhoon Haiyan. J. Geophys. Res. Ocean. 2015, 120, 4463–4486. [Google Scholar] [CrossRef]
- Buckley, M.L.; Lowe, R.; Hansen, J.E. Evaluation of nearshore wave models in steep reef environments. Ocean. Dyn. 2014, 64, 847–862. [Google Scholar] [CrossRef]
- Zijlema, M.; Stelling, G.; Smit, P. SWASH: An operational public domain code for simulating wave fields and rapidily varied flows in coastal waters. Coast. Eng. 2011, 58, 992–1012. [Google Scholar] [CrossRef]
- Pearson, S.G.; Storlazzi, C.; Van Dongeren, A.; Tissier, M.; Reniers, A.J. A Bayesian-Based System to Assess Wave-Driven Flooding Hazards on Coral Reef-Lined Coasts. J. Geophys. Res. Ocean. 2017, 122, 10099–10117. [Google Scholar] [CrossRef]
- Church, J.A.; Clark, P.U.; Cazenave, A.; Gregory, J.M.; Jevrejeva, S.; Levermann, A.; Merrifield, M.A.; Milne, G.A.; Nerem, R.S. Sea level change. In Climate Change 2013: The Physical Science Basis. In Contribution of Working Group I to the Fifth Assessment Report of the Intergovernmental Panel on Climate Change; Stocker, T.F., Qin, D., Plattner, G.-K., Tignor, M., Allen, S.K., Boschung, J., Nauels, A., Xia, Y., Bex, V., Midgley, P.M., Eds.; Cambridge University Press: Cambridge, UK; New York, NY, USA, 2013. [Google Scholar]
- Baird, W.F. Study on Coastal Erosion in Mauritius; Report prepared for the Ministry of Environment: Port Louis, Mauritius, 2003. [Google Scholar]
- Camoin, G.F.; Colonna, M.; Montaggioni, L.F.; Casanova, J.; Faure, G.; Thomassin, B.A. Holocene sea level changes and reef development in the southwestern Indian Ocean. Coral Reefs 1997, 16, 247–259. [Google Scholar] [CrossRef]
- Daby, D. Effects of seagrass bed removal for tourism purposes in a Mauritian bay. Environ. Pollut. 2003, 125, 313–324. [Google Scholar] [CrossRef]
- Onaka, S.; Hashimoto, H.; Soogun, S.N.B.; Jheengut, A. Coastal Erosion and Demonstration Project as Coastal Adaptation Measures in Mauritius. In Handbook of Coastal Disaster Mitigation for Engineers and Planners; Elsevier BV: Amsterdam, The Netherlands, 2015; pp. 561–577. [Google Scholar]
- MMCS. Etude de Faisabilité pour la Mise en Place D’une ou Plusieurs Aires Marine Protégées sur la Côte Sud-Ouest de Maurice (Cartographie des Habitats et de la Valeur Patrimoniale); Report of the Mauritius Conservation Society: Port Louis, Mauritius, 2010. [Google Scholar]
- Callaghan, D.P.; Mumby, P.J.; Mason, M.S. Near-reef and nearshore tropical cyclone wave climate in the Great Barrier Reef with and without reef structure. Coast. Eng. 2020, 157, 103652. [Google Scholar] [CrossRef]
- Dee, D.P.; Uppala, S.M.; Simmons, A.J.; Berrisford, P.; Poli, P.; Kobayashi, S.; Andrae, U.; Balmaseda, M.A.; Balsamo, G.; Bauer, P.; et al. The ERA-Interim reanalysis: Configuration and performance of the data assimilation system. Q. J. R. Meteor. Soc. 2011, 137, 553–597. [Google Scholar] [CrossRef]
- ECMWF. Available online: https://www.ecmwf.int/en/forecasts/datasets (accessed on 15 January 2018).
- Naseef, T.M.; Kumar, V.S. Variations in return value estimate of ocean surface waves—A study based on measured buoy data and ERA-Interim reanalysis data. Nat. Hazards Earth Syst. Sci. 2017, 17, 1763–1778. [Google Scholar] [CrossRef]
- Sterl, A.; Caires, S. Climatology, variability and extrema of ocean waves: The Web-based KNMI/ERA-40 wave atlas. Int. J. Clim. 2005, 25, 963–977. [Google Scholar] [CrossRef]
- Rogers, J.S.; Monismith, S.G.; Koweek, D.A.; Dunbar, R.B. Wave dynamics of a P acific A toll with high frictional effects. J. Geophys. Res. Ocean. 2016, 121, 350–367. [Google Scholar] [CrossRef]
- Sheppard, C.; Dixon, D.J.; Gourlay, M.; Sheppard, A.; Payet, R. Coral mortality increases wave energy reaching shores protected by reef flats: Examples from the Seychelles. Estuar. Coast. Shelf Sci. 2005, 64, 223–234. [Google Scholar] [CrossRef]
- Lowe, R.; Falter, J.L.; Bandet, M.D.; Pawlak, G.; Atkinson, M.J.; Monismith, S.G.; Koseff, J.R. Spectral wave dissipation over a barrier reef. J. Geophys. Res. Space Phys. 2005, 110, 04001. [Google Scholar] [CrossRef]
- Monismith, S.G.; Rogers, J.S.; Koweek, D.A.; Dunbar, R.B. Frictional wave dissipation on a remarkably rough reef. Geophys. Res. Lett. 2015, 42, 4063–4071. [Google Scholar] [CrossRef]
- Wong, P.P.; Losada, I.J.; Gattuso, J.-P.; Hinkel, J.; Khattabi, A.; McInnes, K.; Sato, Y.; Sallenger, A. Coastal systems and low-lying areas. In Climate Change 2014: Impacts, Adaptation, and Vulnerability. Part A: Global and Sectoral Aspects. Contribution of Working Group II to the Fifth Assessment Report of the Intergovernmental Panel on Climate Change; Cambridge University Press: Cambridge, UK; New York, NY, USA, 2013; pp. 361–409. [Google Scholar]
- Holthuijsen, L.H. Waves in Oceanic and Coastal Waters by Leo H. Holthuijsen; Cambridge University Press (CUP): Cambridge, UK, 2007. [Google Scholar]
- Gupta, N.; Bhaskaran, P.K.; Dash, M.K. Recent trends in wind-wave climate for the Indian Ocean. Curr. Sci. 2015, 108, 2191–2201. [Google Scholar]
- Pascolo, S.; Petti, M.; Bosa, S. On the Wave Bottom Shear Stress in Shallow Depths: The Role of Wave Period and Bed Roughness. Water 2018, 10, 1348. [Google Scholar] [CrossRef]
- Beck, M.W.; Losada, I.J.; Menéndez, P.; Reguero, B.G.; Díaz-Simal, P.; Fernández, P.M. The global flood protection savings provided by coral reefs. Nat. Commun. 2018, 9, 2186. [Google Scholar] [CrossRef]
- Pascolo, S.; Petti, M.; Bosa, S. Wave–Current Interaction: A 2DH Model for Turbulent Jet and Bottom-Friction Dissipation. Water 2018, 10, 392. [Google Scholar] [CrossRef]
- Lentz, S.; Churchill, J.H.; Davis, K.A.; Farrar, J.T. Surface gravity wave transformation across a platform coral reef in the R ed S ea. J. Geophys. Res. Ocean. 2016, 121, 693–705. [Google Scholar] [CrossRef]
- Wild, C.; Hoegh-Guldberg, O.; Naumann, M.; Colombo-Pallotta, M.F.; Ateweberhan, M.; Fitt, W.; Iglesias-Prieto, R.; Palmer, C.; Bythell, J.; Ortiz, J.-C.; et al. Climate change impedes scleractinian corals as primary reef ecosystem engineers. Mar. Freshw. Res. 2011, 62, 205–215. [Google Scholar] [CrossRef]
- Pandolfi, J.M.; Connolly, S.R.; Marshall, D.J.; Cohen, A.L. Projecting Coral Reef Futures under Global Warming and Ocean Acidification. Sciences 2011, 333, 418–422. [Google Scholar] [CrossRef]
- McIntire, W.G.; Walker, H.J. Tropical cyclones and coastal morphology in mauritius1. Ann. Assoc. Am. Geogr. 1964, 54, 582–596. [Google Scholar] [CrossRef]
- Péquignet, A.-C.; Becker, J.M.; Merrifield, M.A.; Boc, S.J. The dissipation of wind wave energy across a fringing reef at Ipan, Guam. Coral Reefs 2011, 30, 71–82. [Google Scholar] [CrossRef]
- Costa, M.; Araújo, M.; Araújo, T.C.; Siegle, E. Influence of reef geometry on wave attenuation on a Brazilian coral reef. Geomorphoogy 2016, 253, 318–327. [Google Scholar] [CrossRef]
- Hilmi, N.; Safa, A.; Sumalia, U.R.; Cinar, E.M. Coral reefs management and decision making tools. Ocean. Coast. Manag. 2017, 146, 60–66. [Google Scholar] [CrossRef]
- Loiola, M.; Oliveira, M.D.; Kikuchi, R.K.P. Tolerance of Brazilian brain coral Mussismilia braziliensis to sediment and organic matter inputs. Mar. Pollut. Bull. 2013, 77, 55–62. [Google Scholar] [CrossRef]
- Roberts, M.; Hanley, N.; Williams, S.; Cresswell, W. Terrestrial degradation impacts on coastal reef health: Evidence from the Caribbean. Ocean Coast. Manag. 2017, 149, 52–68. [Google Scholar] [CrossRef]
- Brandão, C.D.S.; Malta, A.; Schiavetti, A. Temporal assessment of the management effectiveness of reef environments: The role of marine protected areas in Brazil. Ocean. Coast. Manag. 2017, 142, 111–121. [Google Scholar] [CrossRef]
- Chiappone, M.; Dienes, H.; Swanson, D.W.; Miller, S.L. Impacts of lost fishing gear on coral reef sessile invertebrates in the Florida Keys National Marine Sanctuary. Boil. Conserv. 2005, 121, 221–230. [Google Scholar] [CrossRef]
- Jenkins, M. The Coral Nursery with pollution, climate change and other threats ravaging Caribbean corals, a massive conservancy project is hand-planting nursery-grown replacements and setting the stage for a coral reef revival. Nat. Conserv. 2010, 60, 30. [Google Scholar]
- Langarica, J.D.J.A.T.; Cupul-Magaña, A.; Rodríguez-Troncoso, A.P.; Cupul-Magaña, A. Restoration of a degraded coral reef using a natural remediation process: A case study from a Central Mexican Pacific National Park. Ocean. Coast. Manag. 2014, 96, 12–19. [Google Scholar] [CrossRef]
- Lirman, D.; Thyberg, T.; Herlan, J.; Hill, C.; Young-Lahiff, C.; Schopmeyer, S.; Huntington, B.; Santos, R.; Drury, C. Propagation of the threatened staghorn coral Acropora cerviconis: Methods to minimize the impacts of fragment collection and maximize production. Coral Reefs 2010, 29, 729–735. [Google Scholar] [CrossRef]
- Young, C.; Schopmeyer, S.; Lirman, D. A Review of Reef Restoration and Coral Propagation Using the Threatened Genus Acropora in the Caribbean and Western Atlantic. Bull. Mar. Sci. 2012, 88, 1075–1098. [Google Scholar] [CrossRef]
- Elliff, C.; Silva, I.R. Coral reefs as the first line of defense: Shoreline protection in face of climate change. Mar. Environ. Res. 2017, 127, 148–154. [Google Scholar] [CrossRef]
- Cowburn, B.; Moritz, C.; Birrell, C.; Grimsditch, G.; Abdulla, A. Can luxury and environmental sustainability co-exist? Assessing the environmental impact of resort tourism on coral reefs in the Maldives. Ocean. Coast. Manag. 2018, 158, 120–127. [Google Scholar] [CrossRef]
© 2020 by the authors. Licensee MDPI, Basel, Switzerland. This article is an open access article distributed under the terms and conditions of the Creative Commons Attribution (CC BY) license (http://creativecommons.org/licenses/by/4.0/).