Abstract
To assist river restoration efforts we need to slow the rate of river degradation. This study provides a detailed explanation of the hydraulic complexity loss when a meandering river is straightened in order to motivate the protection of river channel curvature. We used computational fluid dynamics (CFD) modeling to document the difference in flow dynamics in nine simulations with channel curvature (C) degrading from a well-established tight meander bend (C = 0.77) to a straight channel without curvature (C = 0). To control for covariates and slow the rate of loss to hydraulic complexity, each of the nine-channel realizations had equivalent bedform topography. The analyzed hydraulic variables included the flow surface elevation, streamwise and transverse unit discharge, flow velocity at streamwise, transverse, and vertical directions, bed shear stress, stream function, and the vertical hyporheic flux rates at the channel bed. The loss of hydraulic complexity occurred gradually when initially straightening the channel from C = 0.77 to C = 0.33 (i.e., the radius of the channel is three-times the channel width), and additional straightening incurred rapid losses to hydraulic complexity. Other studies have shown hydraulic complexity provides important riverine habitat and is positively correlated with biodiversity. This study demonstrates how hydraulic complexity can be gradually and then rapidly lost when unwinding a river, and hopefully will serve as a cautionary tale.
1. Introduction
River meanders are a common landform in alluvial systems, characterized by sinuous patterns of planform curvature of channel banks and bedform topography within those banks. Classic bedform features include point bars on the inner bank and pools along the outer bank centered at the meander bend apex, and riffles upstream and downstream of the bend [1,2,3]. The meander planform curvature generates a centrifugal force on river water and creates non-uniform depths and velocities, which shapes the bedform topography in alluvial rivers. As one travels streamwise downriver, the rising and falling of bedform topography generates drag and steering on river flows, creating a complex feedbacks between topography and flow [4]. The hydraulic features of meanders include streamwise velocity separating from the inner bank about the apex and attaching to the outer bank, a superelevated water surface forming along the outer bank, eddies forming downstream of the point bar, and helical corkscrew patterns of cross-channel flow. This hydraulic complexity is known to control the pressure distributions along the riverbed and therefore induce patterns of surface water downwelling into the streambed balanced by groundwater upwelling into the channel, a mixing process important for species and water quality called hyporheic exchange [5].
In a natural alluvial system, the meander bend planform will evolve through a repeating cycle of straight to curved channels with coordinated bedform adjustments. Initially, straight channels the viscosity of water and roughness of channel banks leads to depositional bars opposite erosional pools, which then experience meander elongation and a decreasing radius of curvature. Ultimately, the evolution culminates in a meander neck cutoff, at which point an oxbow lake may occupy the abandoned meander bend and the upstream and downstream sections of channel are joined by a straight channel, with a radius of curvature reset to infinity [6,7]. This repeating cycle of meander evolution is at different stages, initiation to completion, along the streamwise path of a river. Flows within meander bends generate hydraulic complexity [8,9,10]. The hydraulic complexity at a meander bend further influences river ecosystems. Gualtieri et al. [11,12] demonstrated how hydraulic complexity metrics succinctly represent flow patterns and structures utilized by riverine biota, and greater complexity is correlated with more habitat types and greater biologic diversity. Common hydraulic complexity metrics include river velocity and depth gradients, which are known to support species life cycles, such as spawning, feeding, and resting [11]. The importance of hydraulic complexity to riverine species richness [13] is in keeping with other ecological systems, where a positive correlation exists between biodiversity and habitat heterogeneity [14].
Riverine meander evolution has too often been cut short by river straightening, and as communities realized the associated loss of ecosystem services they are eager to restore these meanders as well as reduce their future loss [15]. River meanders have been removed to repurpose the floodplain for development or provide local flood water relief (while exacerbating flood levels downstream). However, human modification of rivers too often leads to unintended consequences on river flows, sediment transport, riverbank stability, and aquatic suitability, making river meander loss a significant public and private concern. A successful river management target is a self-sustaining system with dynamic equilibrium for hydrological, geomorphological, and ecological processes [16]. In an analysis of how to meander bend curvature affects hydraulics and hence ecosystems, it is best to keep constant variables of flow stage, i.e., depth, and bedform topography within the channel banks. Bankfull stage, when water is at the threshold of leaving the channel, is a standard depth for such analysis.
The goal of this research is to quantify the extent that hydraulic complexity degrades when a highly evolved meander bend at the bankfull stage is straightened, while maintaining equivalent bedform topography associated with a highly sinuous meander. The research is approached from the perspective of valuing river flow hydrodynamics and surface water–groundwater exchange patterns associated with high sinuosity meanders, and views the straightening of the channel as a departure from, and the restoration of the sinuosity as a return to, a target value. In order to examine the independent adjustment of planform curvature and bedform topography, we used computational fluid dynamics (CFD) models to simulate flow dynamics in the channel water column and at or in the channel bed, including hyporheic fluxes across the channel bed [17,18,19,20,21]. The desired outcome of this study is the knowledge to help river managers and engineers better understand the hydraulic complexity associated with their river meanders and to guide their channel designs which increasingly rely upon river steering structures to create curvature or bedform.
2. Methods
To systematically change planform curvature while keeping equivalent bedform topography, we used a commercial CFD model (Flow3D®) as a virtual river system that coupled the surface water flow and groundwater movement in one domain. We describe the range of the channel curvature with variable C, defined as the ratio of the channel width, B to the centerline radius of channel curvature, R. A straight channel has a C = 0, while a high sinuosity meander bend might have a C > 0.5. Nine experiments with gradually changed curvature from a tight bend to a straight channel were simulated by maintaining equivalent cross-section profiles. The output of these simulations were then used to investigate the hydraulic complexity response to the channel curvature changes. Note that the purpose of this study is to investigate the flow responses to meander curvature changes solely, not to bedform topography. There was no sediment transport and associated self-adjusted river bedform evolution included in the experiment setup.
CFD Model
The CFD model used finite-element methods to solve the velocity and pressure variables using the fully 3D transient conservation of mass and momentum equations. Flow depth was controlled by the pressure boundary conditions at both upstream and downstream boundaries. Flow surface was treated as a free surface boundary by applying the volume-of-fluid (VOF) technique [22] which computed fluid volume fraction as one variable in each grid cell. The mass continuity was represented as
The momentum conservation was represented as
In these equations, VF is the fraction volume open to flow, ρ is the fluid density, c is a constant (approximately the sound speed), p is pressure, t is time, Ai is the area fractions for flow in the i(x, y, z) direction, and ui(u, v, w) denote the velocities in i directions, fi is the viscous acceleration terms. R and ξ are transformation coefficients depend on the choice of the coordinate system is in use. When Cartesian coordinates (x, y, z) are used, ξ = 0 and R = 1. When cylindrical coordinates (r, θ, z) are used, y derivatives in the equation will be converted to azimuthal derivatives:
which is accomplished by using the equivalent form:
where R = rm/r, y = rmθ, and rm is a fixed channel radius. In the meantime, ξ = 1. Readers are referred to the FLOW-3D users manual (https://www.flow3d.com) for more information.
Turbulence was simulated using the filtered Large Eddy Simulation (LES) model. The LES model solved the instantaneous flow fluctuations at the grid-scale and estimated the sub-grid turbulence variables using eddy viscosity terms, which provided better near boundary turbulence predictions than the classic two-equation k − ϵ models [17,23]. The sediment bed was treated as a homogenous porous media with uniform porosity. To allow for the coupled surface water–groundwater mixing, a porous riverbed was simulated within the same domain by applying a drag coefficient (DRG) on the momentum equations, determined using the Kozeny–Carman relation based on the sediment propoerties such as grain size and porosity:
where ν is the kinematic viscosity of water, n is the sediment porosity. Note that DRG only applies to the porous media to slow down the flow velocity and mimic the Darcy flow behavior. For the surface flow part, DRG was not activated.
The CFD model simulated river flows were verified in our previous study [21] using Ecole Polytechnique Federale de Lausanne (EPFL) curved flume experiment observations reported by Blanckaert [24]. This flume had a width B = 1.3 m, a 9 m long straight inflow channel with a slope of 0.002, a 193° meander bend with centerline radius of curvature R = 1.7 m, which results in a C = 0.77, and a straight outflow channel. Flow discharge was 89 L/s, with a mean flow depth H = 0.14 m, Reynolds number Re = 68 × 103, and Froude number Fr = 0.41. A flume substrate particle diameter of 1.6 mm to 2.2 mm (d50 = 2 mm) was used to obtain an equilibrium bed, which was defined as with sediment inflow equaling outflow [24]. Bedform topography of the bend was mapped using acoustic limnimeter to a 450 × 50 grid and made digitally available to the authors. Identical flume geometry settings and boundary conditions were imported into the CFD model for river flow simulations. The computational domain was constructed based on a cylindrical coordination system with 130 grids along the radial or transverse axis n (x in Cartesian coordinate), from 0 m to 1.3 m, 300 grids along the azimuthal or streamwise axis s (y in Cartesian coordinate), from 0° to 193°, and 50 grids along the vertical axis z, from −0.3 m to 0.2 m. Bedform roughness was represented using a recommended roughness height of 0.037 m for this very experiment [25]. The goodness of fit (R2) between observed and simulated velocity profiles were greater than 0.75 at most cross-sections, indicating the CFD model captured the major flow dynamic patterns in both streamwise and transverse directions and was adequately simulated the meander bend 3D river flows. The readers are referred to Figure 2 in Zhou and Endreny [21] for detailed model verification processes.
Given that the EPFL flume experiment did not include hyporheic exchange processes, we verified the capability of estimating hyporheic exchange rates for the CFD model using a 30 cm wide, 700 cm long, 50 cm deep Armfield® S series recirculating flume filled with 0.3 m depth sediment. The sediment bed had an average depth of 30 cm featuring a pool-riffle sequence with a wavelength of 0.5 m. Dye was released at multiple points along the surface of the sediment bed and was tracked through the transparent wall of the flume. The hyporheic flow vectors simulated by the CFD model agreed well with observations. We also successfully modeled and verified the penetration front movements with the results observed in Elliott and Brooks [26] Run9 experiment. Both model verification campaigns suggest that the CFD model adequately captured the hyporheic flow directions and velocity, as well as the depth of the active hyporheic zone in the bedform. The readers are referred to Figures 2, 4 and 6 in Zhou and Endreny [27] for more details about the hyporheic process verifications. After being verified by the observations, the CFD models have the potential to explore the flow behavior under different boundary conditions [28].
3. Hydraulic Complexity Variables
Nine planform curvatures with C = 0.77 (EPFL flume), 0.5, 0.4, 0.33, 0.25, 0.14, 0.08, 0.05, and 0 (straight channel) were simulated in this study (Figure 1). Each experiment used the equivalent C = 0.77 bedform topography by stretching the 3D bedform topography around the channel centerline to maintain uniform cross-section profiles between curvatures. Each CFD simulation used the same cylindrical computational gridding and numerical methods established for the C = 0.77 simulation.
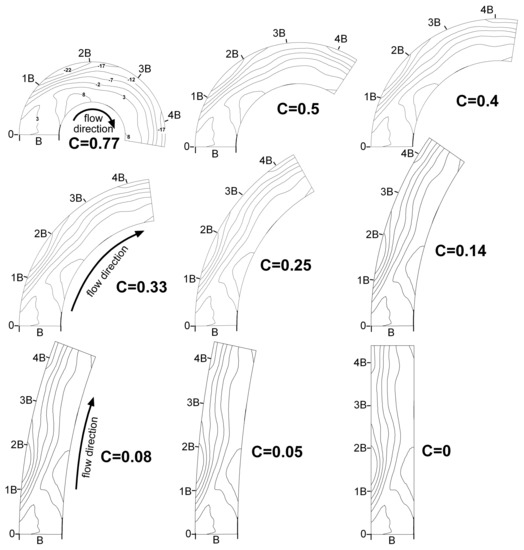
Figure 1.
Geometries and bed topography settings of the nine computational fluid dynamics (CFD) simulations with channel curvature (C) changed from 0.77 to 0.
Meander bend hydraulic complexity for these simulations were characterized using CFD output variables based on the flow surface elevation and flow velocity, with vs, vn, and vz velocity vectors representing flow in the s (streamwise), n (transverse), and z (vertical) directions, respectively. The hydraulic complexity variables were normalized when possible, and included (1) normalized flow surface elevation (h/H), where h is the local flow surface elevation, H is the average flow surface elevation; (2) normalized depth averaged streamwise and transverse unit discharge (qs/UH and qn/UH)., where qs and qn are the unit discharges at s and n directions, equal to <vs> × h and <vn> × h; U is the bulk velocity; “< >” denotes depth averaging; (3) normalized depth averaged streamwise velocity at bankfull depth (<vs>/U); (4) bed shear stresses distrubution, represented by the bed friction coefficient, , where u* is the shear velocity at the boundary, , ub is velocity magnitude at the bottom grid, u+ is dimensionless velocity for a hydraulically rough wall computed with the modified wall function [29], where zb is the grid size and ks is the roughness height which was 6 mm; (5) vertical hyporheic flow, represented by the vertical flux 2 cm below the water-sediment interface (vzbed/U); (6) secondary circulation represented by depth averaged normalized vertical velocity (<vx>/U) for the size; and normalized transverse stream function, ψ/UBH for the direction and strength (positive values indicate clockwise circulation when facing upstream). The ψ/UBH was computed as
in which the ni and zi represent the cross-sectional and vertical coordinates.
The CFD simulated output of the river flows and associated hydraulic complexity for all nine channel curvatures with C = 0.77 topographic bedform was projected into a straight channel (C = 0) to facilitate inter-comparison. Distance along the streamwise axis s is reported relative to channel width B as s/B. Each hydraulic complexity variable is initially presented as the simulated values at the C = 0.77, C = 0.33, and C = 0 planform curvature to illustrate spatial patterns for each variable.
4. Results
4.1. Flow Surface Elevation
The normalized flow surface elevation (h/H) patterns were very sensitive to planform curvature (Figure 2), with large differences in the inlet section (<1.5 s/B longitudinal position) emerging between C = 0.77 and C = 0.33, and between C = 0.33 and C = 0. Similarities between the C = 0.33 and C = 0 did exist, and included a semicircle of maximum flow surface values over the pool (left bank centered at 1.5 s/B) and a minimum flow surface value along the right bank over the point bar apex. These areas of similarity in h/H were regulated by bedform topography, but curvature and superelevation effects suppressed bedform topographic control for C > 0.33. At the tighter curvature of C = 0.77 the centrifugal forces elevated the water surface to h/H ≥ 1.08 and the zone of maximum values stretched from the inlet to 2 s/B and pinched into a narrower lateral extent, while the water surface at the opposite bank dropped to h/H ≤ 0.92 from 0 to 1.4 s/B, followed by other zones of lowered surface values (h/H < 1) at 2 s/B and from 3 s/B to 4 s/B. The complete absence of planform curvature in the C = 0 system did not prohibit bedform topography from creating a backwater effect behind the point bar, noted by the zone of maximum h/H along the right bank from 0 s/B to 1 s/B.
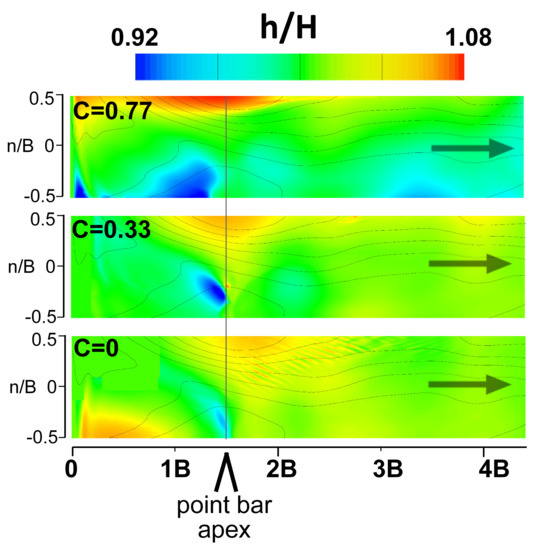
Figure 2.
Flow surface elevation (h) normalized by H at C = 0.77, C = 0.33, and C = 0 conditions. n denotes the lateral coordination with n = 0 at channel center and B denotes the channel width.
The impact of planform curvature was illustrated with transverse plots of h/H at 1.5 s/B, the point bar apex (Figure 3). Considering the normalized flow surface elevation as a function of normalized transverse distance, (h/H) = Fh(n/B), the second order derivative of the function Fh″ (n/B) was used to identify the convexity of the flow surface curves with positive and negative values indicating convex and concave surfaces, respectively. We find that C = 0.33 was the divide that separated the h/H patterns into two types. In tight meander bend with C > 0.33 the transverse pattern of h/H was convex, and for mildly curved channels with C < 0.33 it had a concave pattern. At a curvature of C = 0.33 the h/H profile Fh″(n/B) was close to zero and the h/H profile was flat. The mechanism might be that the centrifugal effects piled up the water in high curvature channels and created convex h/H superelevation transverse profiles at the meander apex, while open meanders the bedform topography created backwater effects and concave h/H transverse profiles.
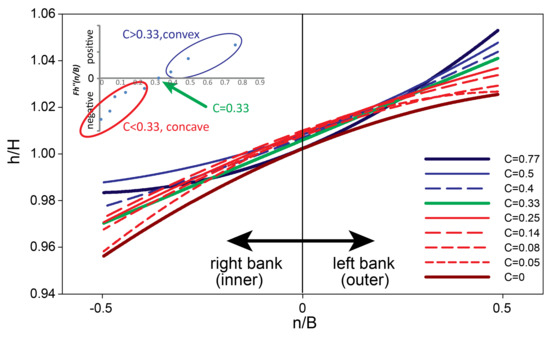
Figure 3.
Normalized flow surface profiles for the nine simulations at the point bar apex 1.5 s/B. The insert plot shows the second order derivative of normalized flow surface elevation in the transverse direction, Fh″(n/B), which gives the convexity or concavity of the surface profile curves.
4.2. Streamwise and Transverse Unit Discharge
The unit discharge, which represents a mass redistribution of water within the channel, was less sensitive to channel curvature. The unit discharge in the streamwise (qs/UH) (Figure 4) direction had relatively stable spatial patterns of maximum and minimum values with changing curvature. This suggests their spatial patterns were regulated by bed topography and the larger conveyance regions opened by pools and smaller conveyance regions constrained by point bars. This topographic control was illustrated by comparing streamwise unit discharge for C = 0.77, 0.33, and 0 at the left bank pool and the right bank point bar conveying. Nearly 90% of the downstream mass was conveyed along the left half (i.e., the pool side) of the channel for all curvatures, while along the right bank at station 2 s/B there was upstream mass transport, indicating the existence of backwater eddy and flow separation for all curvatures. The maximum streamwise unit discharge occurred at about 1.5 s/B, right above the deepest part of the pool. Differences in streamwise unit discharge patterns between C = 0.77 and C = 0 emerged along the left bank stations 2.5 s/B to 3.5 s/B, where mass transport increased by 50% as curvature increased. In this post-apex section of the meander bend there was greater sensitivity of streamwise mass flux to curvature.
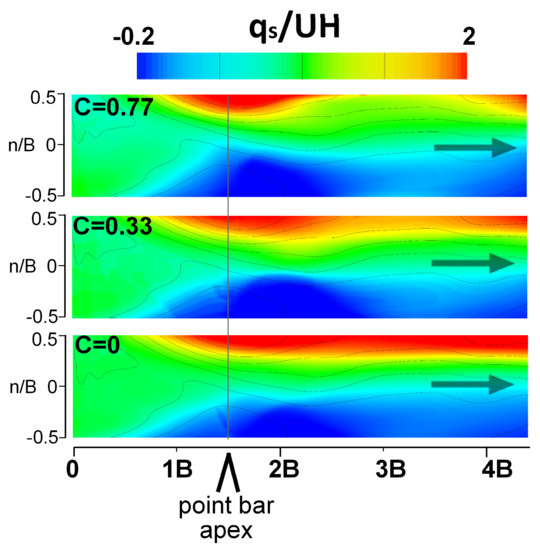
Figure 4.
Streamwise unit discharge qs/UH for channel curvature C = 0.77, 0.33, and 0 conditions.
The distribution of transverse unit discharge, qn/UH, were also largely insensitive to curvature, where C = 0.77, 0.33, and 0 each experienced a pronounced transport to the outer bank (positive values) upstream of the apex and transport to the inner bank further downstream (Figure 5). The impact of bed topography was noted in the damped oscillation patterns of qn/UH with the maximum leftward mass transport at 1 s/B, just upstream of the point bar, and rightward transport at about 2.3 s/B, downstream of the pool. As curvature increased, the single ovate shaped hot-spot of outer-bank directed mass transport that extended beyond the apex for C = 0.77, became split at the tip for C = 0.33, and then reduced to a smaller region for C = 0 (Figure 5). A parallel set of changes occurred in inner-bank-ward mass transport, where the initiation of this inner bank transport region moved further downstream as curvature reduced from C = 0.77 to C = 0. The differences in mass transport between the C = 0.33 and C = 0 simulations were only about 5% based on transversely averaging (< qn/UH >) (Figure 6). The inset of Figure 6 shows the likelihood (here we use coefficient of determination, R2) of < qn/UH > between each curvature and the straight channel condition (C = 0, R2 = 1). The lower the R2, the transverse unit discharge is more complex than in the straight channel.
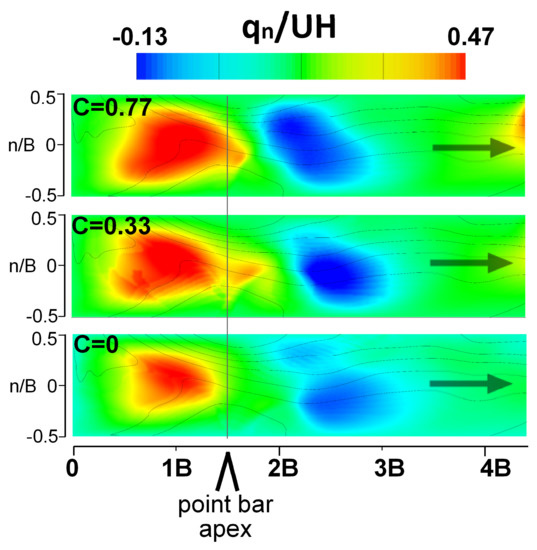
Figure 5.
Transverse unit discharge qn/UH for channel curvature C = 0.77, 0.33, and 0 conditions.
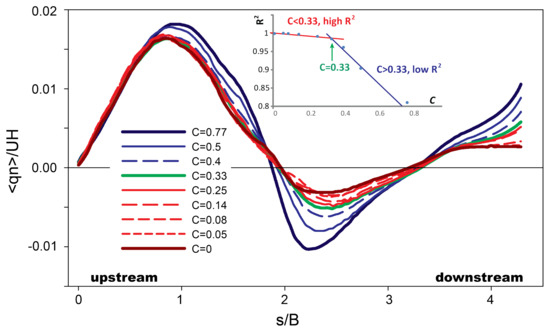
Figure 6.
Transverse unit discharge averaged over the transverse direction. The inset shows the R2 of transverse unit discharge < qn/UH > between each curvature, C, and the straight channel condition (C = 0, R2 = 1); a lower R2 suggests greater hydraulic complexity for transverse unit discharge.
The distribution of transverse unit discharge, qn/UH, were also largely insensitive to curvature, where C = 0.77, 0.33, and 0 each experienced a pronounced transport to the outer bank (positive values) upstream of the apex and transport to the inner bank further downstream (Figure 5). The impact of bed topography was noted in the damped oscillation patterns of qn/UH with the maximum leftward mass transport at 1 s/B, just upstream of the point bar, and rightward transport at about 2.3 s/B, downstream of the pool. As curvature increased the single ovate shaped hot-spot of outer-bank directed mass transport that extended beyond the apex for C = 0.77, became split at the tip for C = 0.33, and then reduced to a smaller region for C = 0 (Figure 5). A parallel set of changes occurred in inner-bank-ward mass transport, where the initiation of this inner bank transport region moved further downstream as curvature reduced from C = 0.77 to C = 0. The differences in mass transport between the C = 0.33 and C = 0 simulations were only about 5% based on transversely averaging (< qn/UH >) (Figure 6). The inset of Figure 6 shows the likelihood (here we use coefficient of determination, R2) of < qn/UH > between each curvature and the straight channel condition (C = 0, R2 = 1). The lower the R2, the transverse unit discharge is more complex than in the straight channel.
The results showed that the R2 was greater than 0.8 in all channels and greater than 0.98 in C < 0.33 channels. With increasing channel curvature, the R2 remained constant until it started to drop rapidly from 0.95 at C = 0.33 to 0.8 at C = 0.77.This analysis suggested that the transverse unit discharge is generally insensitive to curvature, especially in moderately curved channels (C < 0.33).
4.3. Streamwise Velocity Distribution
The streamwise velocity distributions, quantified by the first moment of depth-averaged streamwise velocity <vs>/U, had spatially varying sensitivity to curvature, which was most pronounced at the channel inlet (Figure 7). In the inlet the maximum was along the right bank in C = 0.77 but was along the left bank in C = 0. These differences in streamwise velocity are explained by curvature and its role in transverse velocity gradients. In C = 0.77 the shorter streamwise distance along the inner bank caused an increase in <vs>/U from the inner bank to the outer bank [30]. Curvature also caused differences in magnitude of <vs>/U between the C = 0.77 and C = 0 channels from 2.5 s/B to 4 s/B, with the maximum <vs>/U increased and concentrated near the outer bank area.
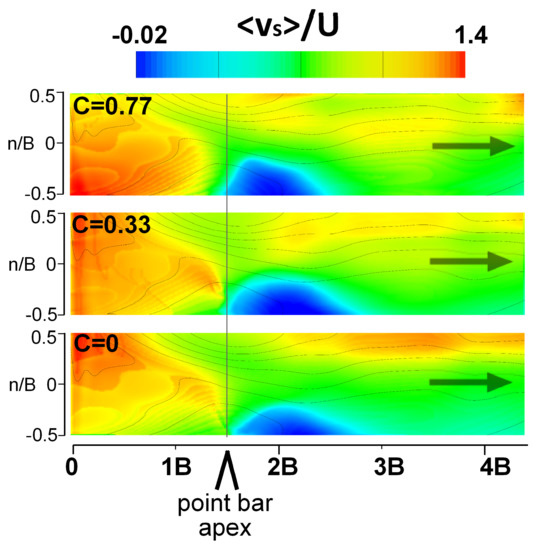
Figure 7.
Normalized depth averaged streamwise velocity <vs>/U for channel curvature C = 0.77, 0.33, and 0 conditions.
The first moment of depth averaged streamwise velocity <vs>/U, which is the center of gravity of the streamwise flow distribution, has an exact transverse location denoted by n/B, where n = 0 at the channel center and n/B = 0.5 at the left bank (Figure 8). For all planform curvatures the first moment of <vs>/U oscillated, originating near n/B = 0 at the channel inlet, approaching the left bank distance n/B > 0.2 at s/B = 1.5, and then returning toward the channel center n/B = 0.1 at s/B = 2. This oscillation was explained by flow separation upstream of the point bar, the subsequent relocation of maximum streamwise velocities near the outer bank, and the return of those maximum velocities toward the channel center at the meander outlet. Sensitivity to curvature was observed from 2 s/B to 4 s/B, where the amplitude of oscillation in the first moment of <vs>/U diminished with decreasing curvature; oscillating by 0.35 n/B for C = 0.77 and oscillating by 0.15 n/B for C = 0. For high curvature channels (C > 0.33) with tight meanders, flow entered the meander bend along the right half of channel due to a curvature induced potential vortex, while in moderately curved C < 0.33 channels flow entered the meander along the left half of the channel due to a point bar backwater effect. At channel location 2 s/B the maximum leftward amplitude was n/B = 0.4 from the channel center for the C = 0.77 simulation and n/B = 0.25 from the center for the C < 0.33 simulations. The coefficient of determination for the first moment of <vs>/U between C = 0 and other simulations resulted in R2 > 0.95 for C < 0.33 channels, but ranged from 0.6 to 0.88 for the C > 0.33 channels (the insert in Figure 8). As the meander bend tightened and C approached 1.3 the R2 varied greatly with curvature, while in channels with C < 0.33 the R2 was relatively insensitive to changes in curvature, suggesting bedform topography was a stronger influence than planform curvature on the streamwise velocity distribution.
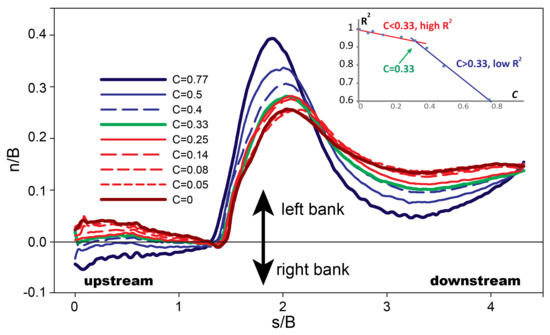
Figure 8.
The first moment of normalized depth averaged streamwise velocity <vs>/U, which represents center of gravity of the streamwise flow distribution, along the channel. The inset shows the R2 of the first moment of <vs>/U between each curvature and the straight channel condition (C = 0, R2 = 1); a lower R2 suggests greater hydraulic complexity for the first moment of depth averaged streamwise velocity.
4.4. Bed Shear Distribution
The bed shear distribution, Cf, is determined in part by near-bed velocities (Figure 9). Along the right bank side at the channel inlet, the bed shear was evidently controlled by the bed topography, with maximum values for all planform curvatures extending up to the point bar. At the point bar cross-section the bed shear was controlled by bedform topography over the point bar, with a minimum Cf values for C ≤ 0.33 curvatures, suggesting conditions for sediment deposition. However, opposite the point bar the bed shear was controlled by planform curvature, with maximum Cf values in the C = 0.77 simulation and minimum Cf values in the C = 0 simulation. These maximum Cf values in the C = 0.77 were over the pool area from 1 s/B to 2.5 s/B, where sediment erosion was most active. Note that the artificial strips observed in bed shear Cf distribution are caused by the structured meshing approach used to represent the bedform topography. This factor could be reduced/smoothed if a finer mesh is applied.
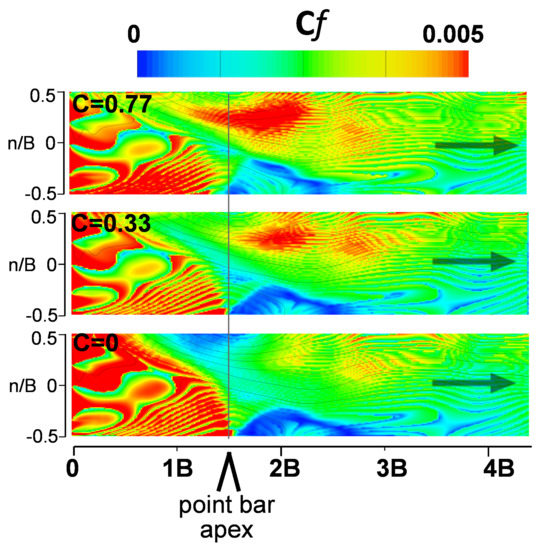
Figure 9.
Distribution of river channel bed shear Cf for channel curvature C = 0.77, 0.33, and 0 conditions.
4.5. Vertical Hyporheic Exchange
The vertical hyporheic exchange patterns were sensitive to planform curvature, but more than half of the bed was controlled by bedform topography (Figure 10). Since the magnitude of vertical flux was very small (about three orders of magnitude lower) compared with the bulk velocity (U), here we only analyzed the direction of the hyporheic flux direction (i.e., upwelling, downwelling, or neutral), among the simulations. In C = 0.77 the upwelling area occupied a dominant amount of cross-sectional bed area from the inlet to 2 s/B, followed by another large swath of upwelling between 2.5–3.5 s/B, while the downwelling area occupied about 20% of the total area and was primarily located to the left bank from 0.5 s/B to the outlet due to the strong downward flow along the pool area. By contrast, the largest patch of upwelling in the C = 0 simulation extended from the inlet to the point bar, with another patch connected to the left bank centered at 3 s/B. Bedform topographic controls on hyporheic flux were identified by similar patterns of flux direction for C = 0.77, 0.33, and 0 and were located in the pool opposite the point bar, on the lee side of the point bar at 2 s/B, and in a patch attached to the left bank at 2.5 s/B.
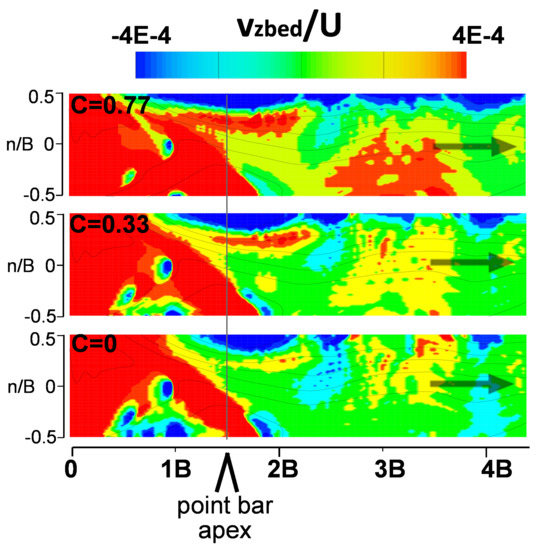
Figure 10.
Normalized vertical hyporheic flux vzbed/U at 2 mm below sediment surface for channel curvature C = 0.77, 0.33, and 0 conditions. Positive indicates upwelling of groundwater into the river channel.
4.6. Secondary Circulation Patterns
Vertical velocity distributions and transverse stream functions are highly related to the secondary circulation patterns. The normalized depth-averaged vertical velocity distribution had areas sensitive to planform curvature and other areas more sensitive to bedform topographic control (Figure 11). All three curvatures had strong negative vertical velocities at the left bank from 0.5 s/B to 1.5 s/B, with flow downwelling into the pool, and all curvatures had positive vertical velocities centered at 2.5 s/B where the rise in bed caused upwelling currents. However, only the tight meanders (C > 0.33) had maximum vertical velocities in the pool, initiating at 1.5 s/B, while the straighter channels had a small region of maximum vertical velocities over the right bank point bar apex. Only in the C > 0.33 channels was the presence of a strong secondary circulation cell present, with maximum and downwelling and upwelling collocated over the pool.
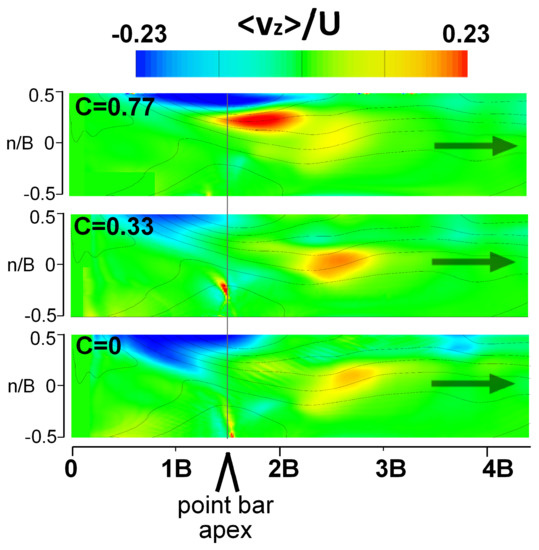
Figure 11.
Normalized vertical velocity <vz>/U for channel curvature C = 0.77, 0.33, and 0 conditions, with positive values upward flows, negative values downward flows.
The transverse stream function distributions (ψ/UBH) at the meander apex revealed the presence of flow cells rotating around the streamwise axis for the three curvatures (C = 0.77, 0.33, and 0). A cross-sectional view of the stream function and transverse flow cell vectors for 1.8 s/B (Figure 12) showed a clockwise (looking upstream) secondary circulation present in all curvatures, centered in the pool. A patch of negative stream function values was also present for all curvatures, located against the top half of the outer bank. The intensity of rotation increased with decreasing curvature, where C = 0.77 had maximum stream function values of 0.3 and C = 0 had maximum values of 0.1. The centroid of the rotation lifted higher into the water column with increasing curvature, and the lateral extent of rotation was reduced with decreasing curvature. This was seen by the stronger C = 0.77 circulation cell tightly centered in the pool z and n domain, while the weaker C = 0 circulation cell was lower in the water column and stretched into the point bar bench and outer bank. The pattern and strength of vertical and rotational flow patterns were strongly influenced by curvature and its centrifugal effects. For mild curvatures of C < 0.33 there were similarities in the pattern and strength of the secondary circulation, indicating the strong influence of bedform topography in these more open curvature channels.
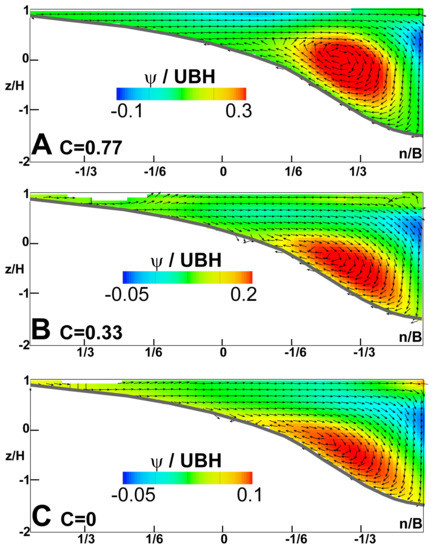
Figure 12.
Transverse stream function distribution ψ/UBH reveals the secondary circulation of transverse flow cells rotating at the meander apex 1.5 s/B for channel curvature C = 0.77 (A), C = 0.33 (B), and C = 0 (C), with positive values representing clockwise rotation direction when facing upstream, and negative values representing counter-clockwise rotation when facing upstream.
5. Discussion and Conclusions
This study has quantified how straightening a previously sinuous river channel impacts the spatial variation in water depth, velocity, and their products which create hydraulic complexity. As a river meander is straightened, the loss to hydraulic complexity is initially gradual and then is abrupt when the river curvature decreased below a threshold of C = 0.33, i.e., the radius of the channel is three times of the channel width. Leopold and Wolman [2] also identified a planform curvature of approximately C = 0.33 as a threshold below which the river meanders no longer support the process of flow separation and the associated hydraulics of wake zones and eddies.
River management can refer to these findings as a guide to hydraulic patterns about meander bends at different river curvature. Such a guide could direct data collection to document and confirm spatial patterns of depth, velocity, and the hydraulic complexity metrics. In cases where river meanders were straightened and bedform topography were degraded, river managers might use this study to consider at least two approaches to restoration. If floodplain encroachment prohibits restoration of full curvature, managers might try restoration of the bedform topography associated with full curvature. Such bedform manipulation can be supported with boulders, submerged logs, vegetation, and other techniques (discussed below). Without constraints of floodplain encroachment, managers might be able to restore channel curvature along with its bedform topography. Given the sudden loss to hydraulic complexity when curvature drops below the threshold of C = 0.33, rivers should be managed to maintain a range of meander curvatures that exist above this threshold in order to support the morphodynamic and associated biotic functions of rivers. While this is the first study to systematically document how the loss of curvature leads to progressive and then rapid loss of hydraulic complexity, other studies have documented the links between curvature and river functions.
The morphodynamic connections to river curvature include the generation of transverse, or secondary circulation patterns [31,32], which establish feedback loops between the dynamics of sediment transport and morphology of bed topography [33,34]. Our experiments documented how the loss of secondary circulation cells was associated with changes patterns of maximum velocities in three directions and a loss of vortices others have shown useful for biota. Liao et al. [35] used high-speed video to show how fish benefit from the rich 3D flows common to high curvature meanders, using vortices to decrease energy expenditure as they migrate up-river.
As these findings are referred to for guidance in managing river meanders, it is important to reiterate this study used a fixed-bed experimental design, while most natural rivers will have mobile-beds where the substrate can move in larger flows. The fixed-bed condition allowed for establishing bed topography associated with high curvature meanders, even in lower curvature conditions. To achieve this in the field, river restoration uses fixed, in-channel forms such as boulders to steer the river water and achieve multiple goals of reducing channel bank erosion and enhancing hydraulic complexity and ecosystem services such as habitat and hyporheic exchange [36,37]. In most alluvial rivers sediment ultimately deposits and scours around these forms, in complex ways that extend beyond the reach of this study. To make progress in this complex environment of river research, we controlled the covariate of the bedform to understand the role of curvature. To further address the issues of mobile bed dynamics, we recommend follow on research to provide detailed estimates of equilibrium bed scour and deposition caused by different channel curvatures. Another limitation is that the bed topography is defined as equivalent across the experiments. However, the decreasing of the channel curvature also related to bedform changes with a shrinking outer bank and extending inner bank, which may also contribute to the flow pattern changes.
In conclusion, this study detailed where river flow about a meander bend loses hydraulic complexity when the river is straightened. This has implications for protecting and restoring river curvature to manage river ecosystem services. Below is a summary of changes to river flow complexity when a river meander is modified from high curvature to straightened:
- The loss of large magnitude bed shear stresses in the pool at the meander apex and establishment of a larger zone of near-zero bed shear about the point bar (Figure 9), and the related loss of large swaths of upwelling flow of groundwater into the channel at the apex along the outer bank and downstream of the apex along the inner half of the channel (Figure 10).
Author Contributions
T.Z. and T.E. have equally contributed to the conceptualization, methodology, analysis, and writing. All authors have read and agreed to the published version of the manuscript.
Funding
This research was funded by NSF grant number EAR 09-11547.
Acknowledgments
The authors thank the data sharing provided by K. Blanckaert of Ecole Polytechnique Federale Lausanne (EPFL) as well as experiment support by B. Han of Ball State University.
Conflicts of Interest
The authors declare no conflict of interest.
References
- Langbein, W.; Leopold, L. River Meanders—Theory of Minimum Variance (Geological Survey Professional Paper 422-H); U.S. Government Printing Office: Washington, DC, USA, 1966.
- Leopold, L.B.; Wolman, M.G. River meanders. Bull. Geol. Soc. Am. 1960, 71, 769–793. [Google Scholar] [CrossRef]
- Wohl, E. Rivers in the Landscape; John Wiley & Sons: Hoboken, NJ, USA, 2020. [Google Scholar]
- Dietrich, W.E.; Smith, J.D. Influence of the point bar on flow through curved channels. Water Resour. Res. 1983, 19, 1173–1192. [Google Scholar] [CrossRef]
- Harvey, J.W.; Bencala, K. The effects of streambed topography on surface-subsurface water exchange in mountains catchments. Water Resour. Res. 1993, 29, 89–98. [Google Scholar] [CrossRef]
- Bridge, J.S. Rivers and Floodplains: Forms, Processes, and Sedimentary Record; John Wiley & Sons: Hoboken, NJ, USA, 2009. [Google Scholar]
- Schumm, S.A. Patterns of alluvial rivers. Annu. Rev. Earth Planet. Sci. 1985, 13, 5–27. [Google Scholar] [CrossRef]
- Vermeulen, B.; Hoitink, A.J.F.; Labeur, R.J. Flow structure caused by a local cross-sectional area increase and curvature in a sharp river bend. J. Geophys. Res. Earth Surf. 2015, 120, 1771–1783. [Google Scholar] [CrossRef]
- Konsoer, K.M.; Rhoads, B.L.; Best, J.L.; Langendoen, E.J.; Abad, J.D.; Parsons, D.R.; Garcia, M.H. Three-dimensional flow structure and bed morphology in large elongate meander loops with different outer bank roughness characteristics. Water Resour. Res. 2016, 52, 9621–9641. [Google Scholar] [CrossRef]
- Li, B.D.; Zhang, X.H.; Tang, H.S.; Tsubaki, R. Influence of deflection angles on flow behaviours in openchannel bends. J. Mt. Sci. 2018, 15, 2292–2306. [Google Scholar] [CrossRef]
- Gualtieri, C.; Abdi, R.; Ianniruberto, M.; Filizola, N.; Endreny, T.A. A 3D analysis of spatial habitat metrics about the confluence of Negro and Solimões rivers, Brazil. Ecohydrology 2020, 13, e2166. [Google Scholar] [CrossRef]
- Gualtieri, C.; Ianniruberto, M.; Filizola, N.; Santos, R.; Endreny, T. Hydraulic complexity at a large river confluence in the Amazon basin. Ecohydrology 2017, 10, e1863. [Google Scholar] [CrossRef]
- Kozarek, J.; Hession, W.; Dolloff, C.; Diplas, P. Hydraulic complexity metrics for evaluating in-stream brook trout habitat. J. Hydraul. Eng. 2010, 136, 1067–1076. [Google Scholar] [CrossRef]
- McCoy, E.D.; Bell, S.S.; Mushinsky, H.R. Habitat structure: Synthesis and perspectives. In Habitat Structure; Springer: Berlin, Germany, 1991; pp. 427–430. [Google Scholar]
- Re-Engineering Britain’s Rivers. The Economist. 6 March 2020. Available online: https://www.latestnigeriannews.com/news/8279579/reengineering-britains-rivers.html (accessed on 12 April 2020).
- Palmer, M.A.; Bernhardt, E.; Allan, J.; Lake, P.S.; Alexander, G.; Brooks, S.; Carr, J.; Clayton, S.; Dahm, C.; Follstad Shah, J.; et al. Standards for ecologically successful river restoration. J. Appl. Ecol. 2005, 42, 208–217. [Google Scholar] [CrossRef]
- Abad, J.D.; Rhoads, B.L.; Güneralp, İ.; García, M.H. Flow structure at different stages in a meander-bend with bendway weirs. J. Hydraul. Eng. 2008, 134, 1052–1063. [Google Scholar] [CrossRef]
- Blanckaert, K.; Schnauder, I.; Sukhodolov, A.; van Balen, W.; Uijttewaal, W. Meandering: Field Experiments, Laboratory Experiments and Numerical Modeling. Technical Report. 2009. Available online: https://infoscience.epfl.ch/record/146621/files/2009-695-Blanckaert_et_al-Meandering_field_experiments_laboratory_experiments_and_numerical.pdf (accessed on 12 April 2020).
- Constantinescu, G.; Koken, M.; Zeng, J. The structure of turbulent flow in an open channel bend of strong curvature with deformed bed: Insight provided by detached eddy simulation. Water Resour. Res. 2011, 47. [Google Scholar] [CrossRef]
- Sawyer, A.H.; Bayani Cardenas, M.; Buttles, J. Hyporheic exchange due to channel-spanning logs. Water Resour. Res. 2011, 47. [Google Scholar] [CrossRef]
- Zhou, T.; Endreny, T. Meander hydrodynamics initiated by river restoration deflectors. Hydrol. Process. 2012, 26, 3378–3392. [Google Scholar] [CrossRef]
- Hirt, C.W.; Nichols, B.D. Volume of fluid (VOF) method for the dynamics of free boundaries. J. Comput. Phys. 1981, 39, 201–225. [Google Scholar] [CrossRef]
- Van Balen, W.; Uijttewaal, W.; Blanckaert, K. Large-eddy simulation of a curved open-channel flow over topography. Phys. Fluids 2010, 22, 075108. [Google Scholar] [CrossRef]
- Blanckaert, K. Topographic steering, flow recirculation, velocity redistribution, and bed topography in sharp meander bends. Water Resour. Res. 2010, 46. [Google Scholar] [CrossRef]
- Zeng, J.; Constantinescu, G.; Blanckaert, K.; Weber, L. Flow and bathymetry in sharp open-channel bends: Experiments and predictions. Water Resour. Res. 2008, 44. [Google Scholar] [CrossRef]
- Elliott, A.H.; Brooks, N.H. Transfer of nonsorbing solutes to a streambed with bed forms: Laboratory experiments. Water Resour. Res. 1997, 33, 137–151. [Google Scholar] [CrossRef]
- Zhou, T.; Endreny, T.A. Reshaping of the hyporheic zone beneath river restoration structures: Flume and hydrodynamic experiments. Water Resour. Res. 2013, 49, 5009–5020. [Google Scholar] [CrossRef]
- Lane, S.; Bradbrook, K.; Richards, K.; Biron, P.; Roy, A. The application of computational fluid dynamics to natural river channels: Three-dimensional versus two-dimensional approaches. Geomorphology 1999, 29, 1–20. [Google Scholar] [CrossRef]
- Vardy, A. Fluid Principles; McGraw-Hill International Series in Civil Engineering; McGraw-Hill: London, UK, 1990. [Google Scholar]
- Rozovskii, I.L. Flow of Water in Bends of Open Channels; Academy of Sciences of the Ukrainian SSR: Kiev, Ukraine, 1957. [Google Scholar]
- Blanckaert, K.; De Vriend, H.J. Secondary flow in sharp open-channel bends. J. Fluid Mech. 2004, 498, 353–380. [Google Scholar] [CrossRef]
- Johannesson, H.; Parker, G. Linear theory of river meanders. River Meand. 1989, 12, 181–213. [Google Scholar] [CrossRef]
- Camporeale, C.; Perona, P.; Porporato, A.; Ridolfi, L. Hierarchy of models for meandering rivers and related morphodynamic processes. Rev. Geophys. 2007, 45. [Google Scholar] [CrossRef]
- He, L. Distribution of primary and secondary currents in sine-generated bends. Water SA 2018, 44, 118–129. [Google Scholar] [CrossRef]
- Liao, J.C.; Beal, D.N.; Lauder, G.V.; Triantafyllou, M.S. Fish exploiting vortices decrease muscle activity. Science 2003, 302, 1566–1569. [Google Scholar] [CrossRef]
- Crispell, J.K.; Endreny, T.A. Hyporheic exchange flow around constructed in-channel structures and implications for restoration design. Hydrol. Process. 2009, 1168, 1158–1168. [Google Scholar] [CrossRef]
- Hester, E.T.; Gooseff, M.N. Moving Beyond the Banks: Hyporheic Restoration Is Fundamental to Restoring Ecological Services and Functions of Streams. Environ. Sci. Technol. 2010, 44, 1521–1525. [Google Scholar] [CrossRef]
© 2020 by the authors. Licensee MDPI, Basel, Switzerland. This article is an open access article distributed under the terms and conditions of the Creative Commons Attribution (CC BY) license (http://creativecommons.org/licenses/by/4.0/).