Abiotic Transient Nitrite Occurrences from Nitrate Reduction through Goethite-Mediated Fe(III)/Fe(II) Cycle with Labile Organic Materials and Ammonia


Abstract
1. Introduction
2. Materials and Methods
2.1. Labile Reduced Materials
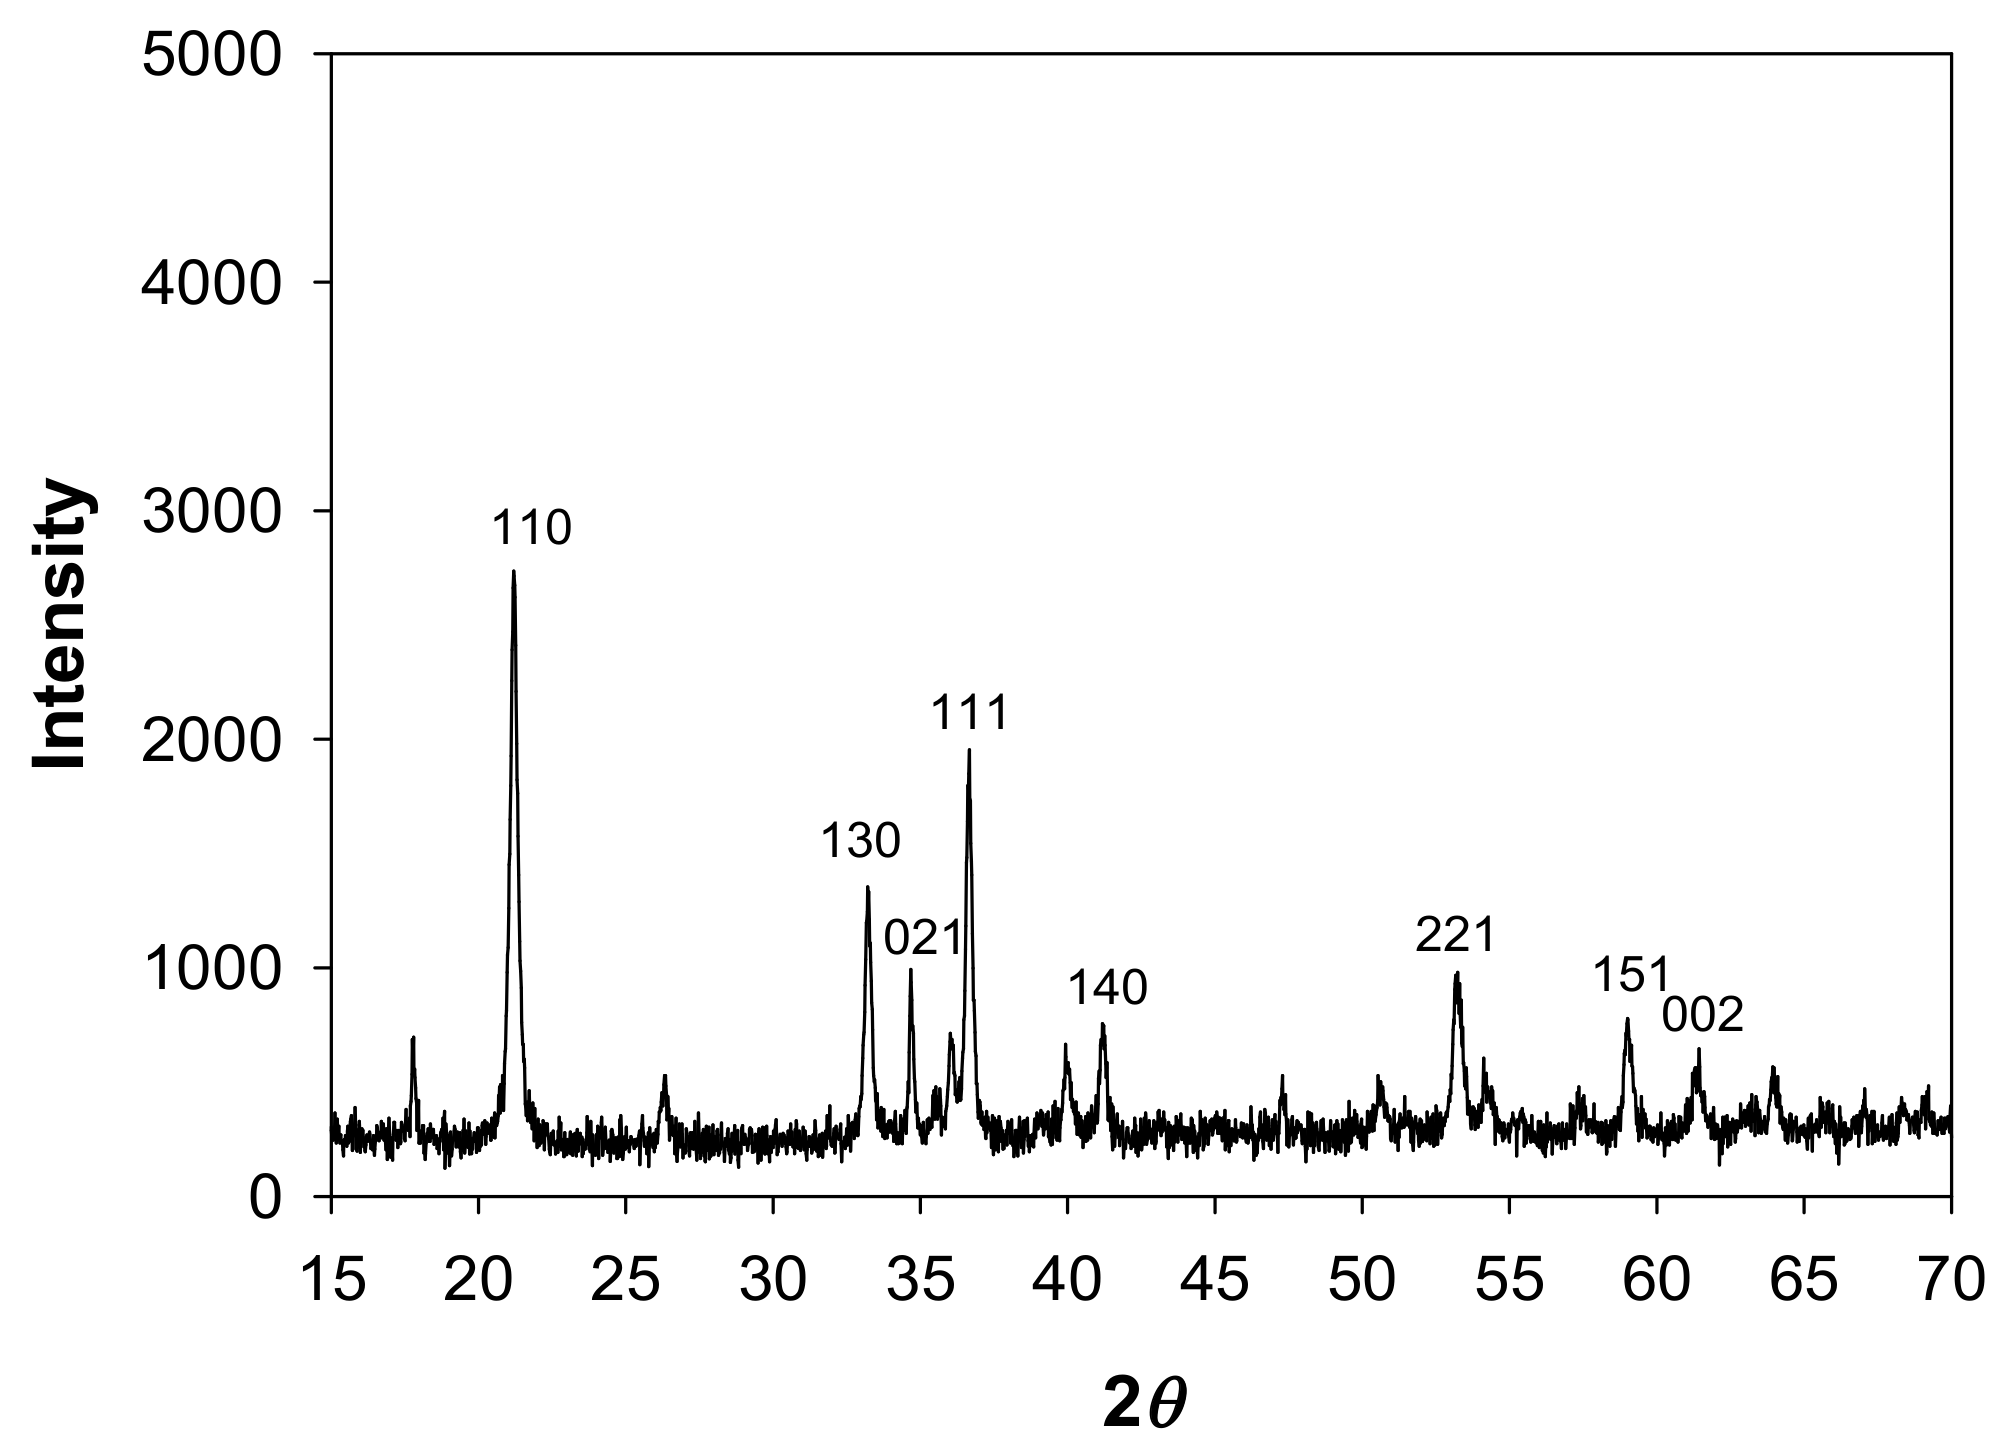
2.2. Synthesis of Goethite
2.3. Fe(III)/Fe(II) Cycling Experiment
2.3.1. Effect of pH and Reduced Material
2.3.2. The Fate of Fe2+, NO2− and Goethite at pH Values of 4 and 7
2.4. Analytic Methods
3. Results
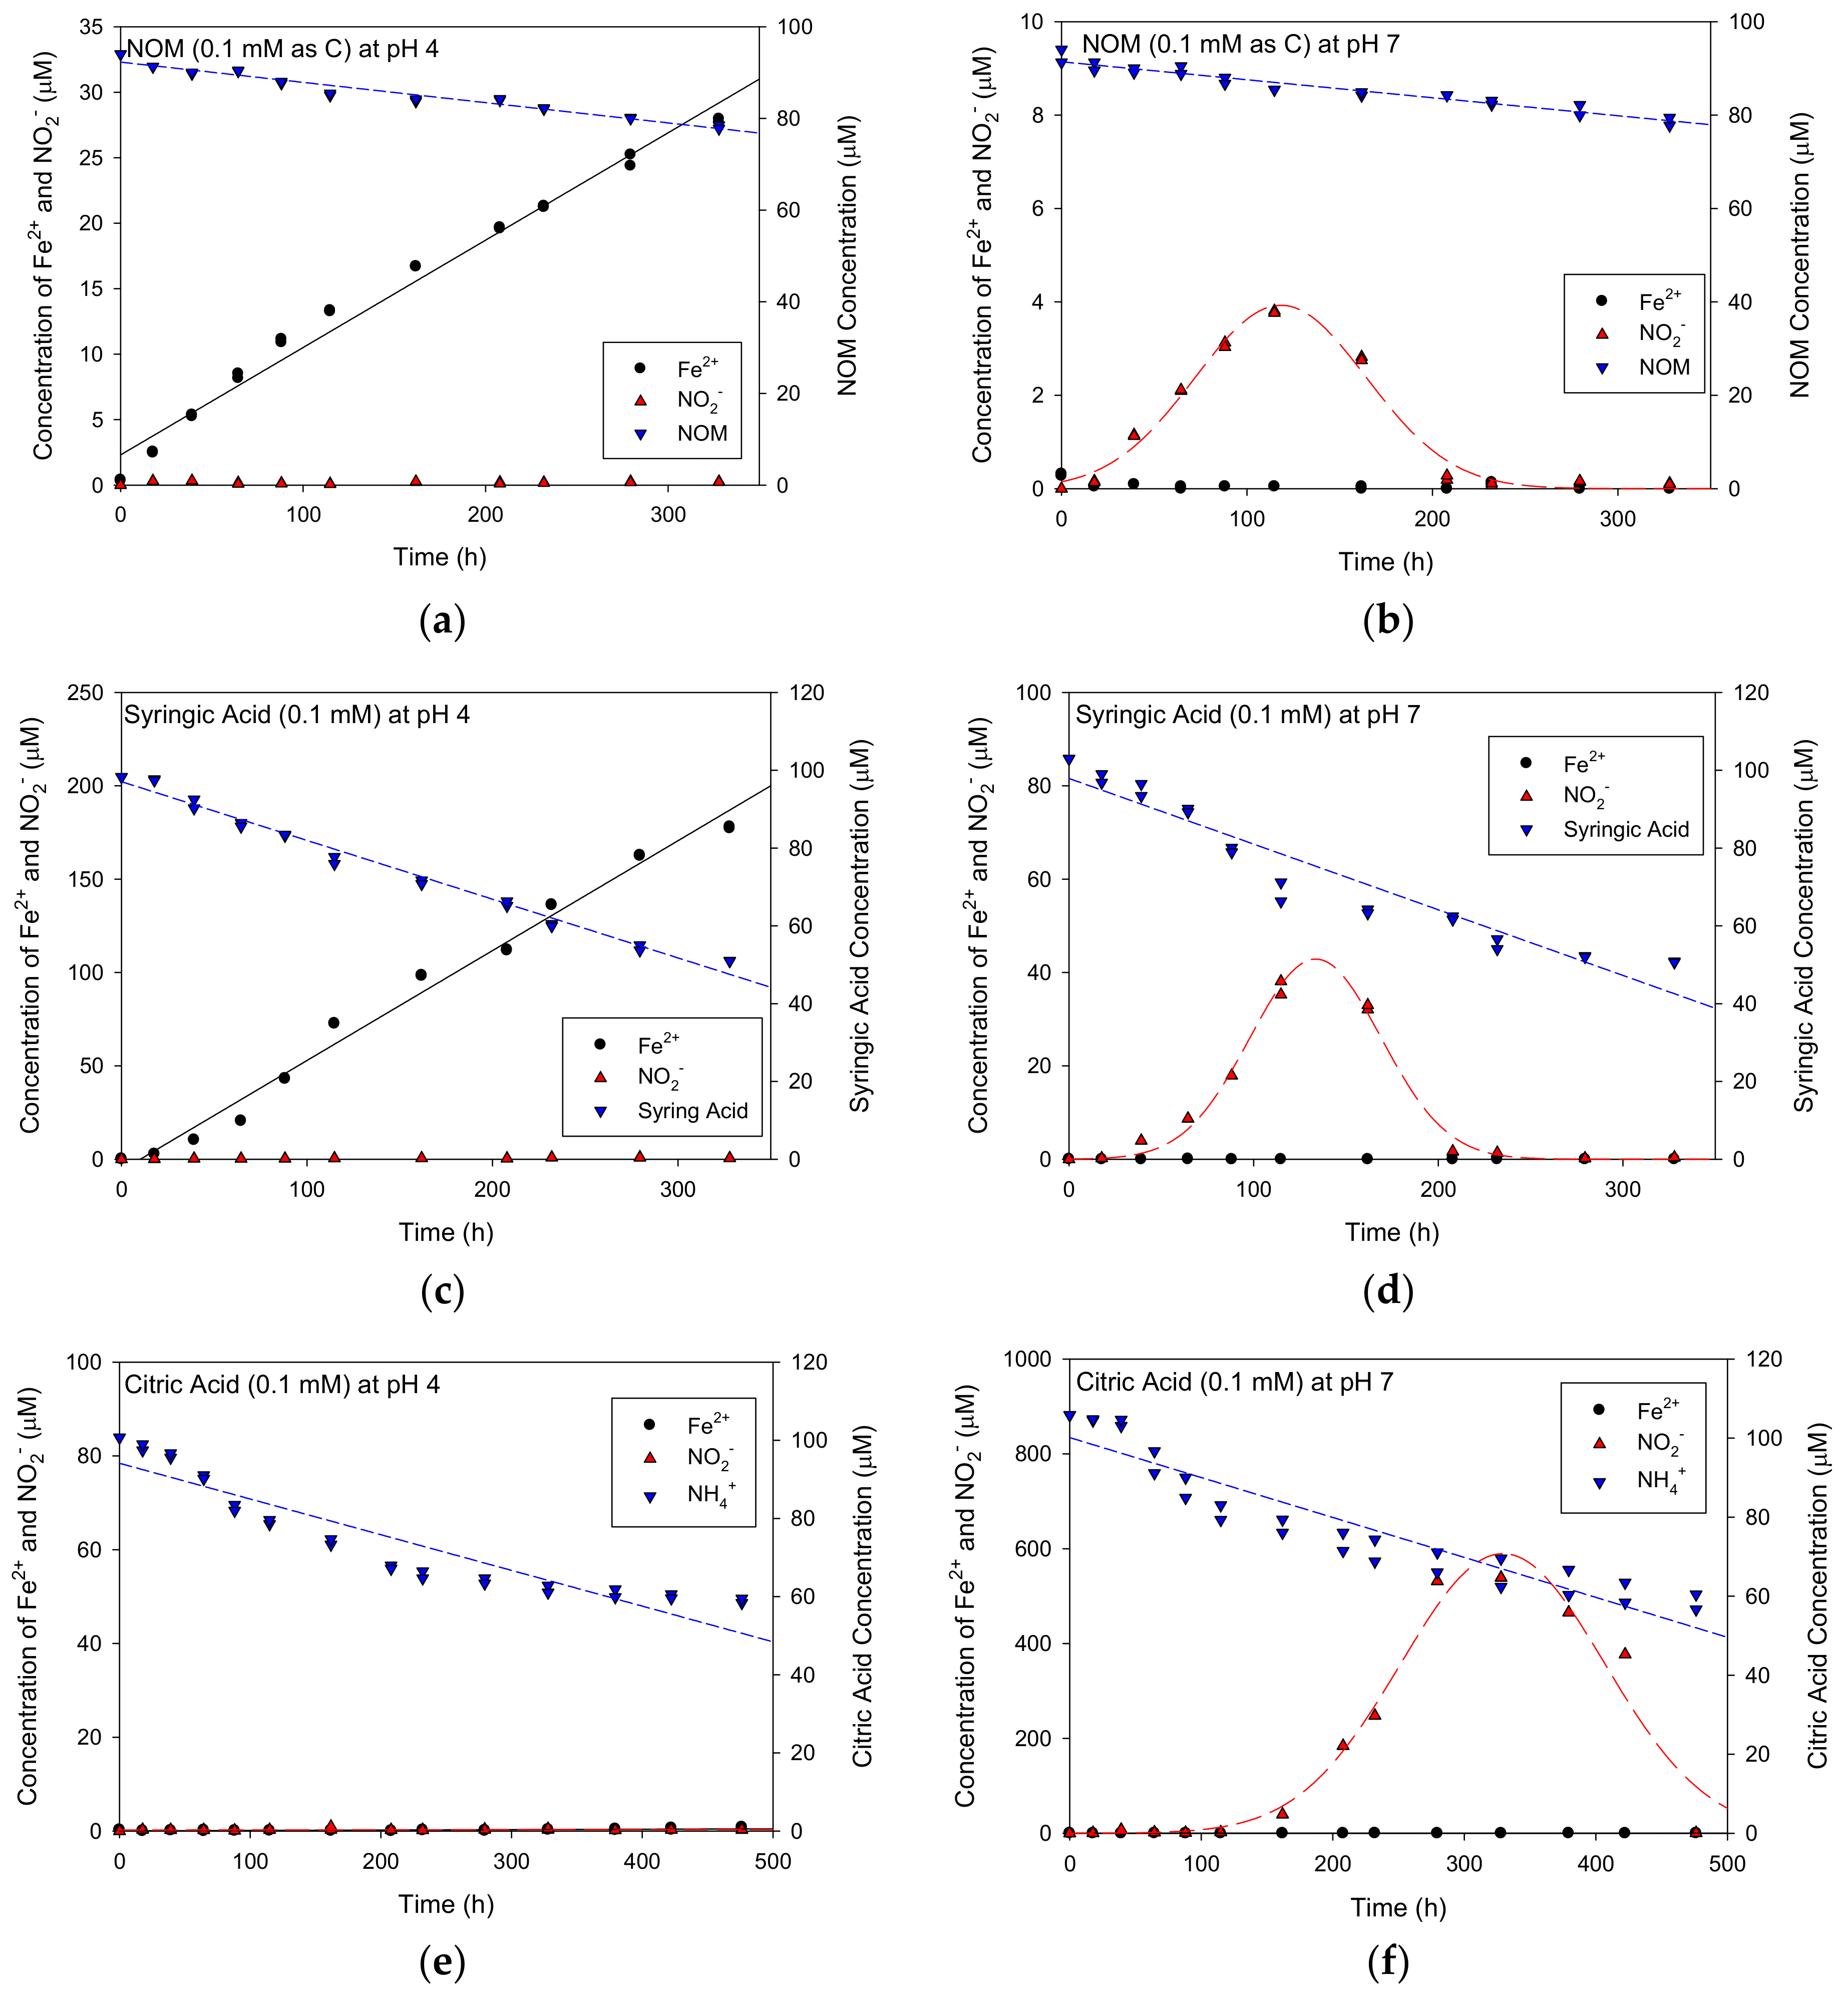
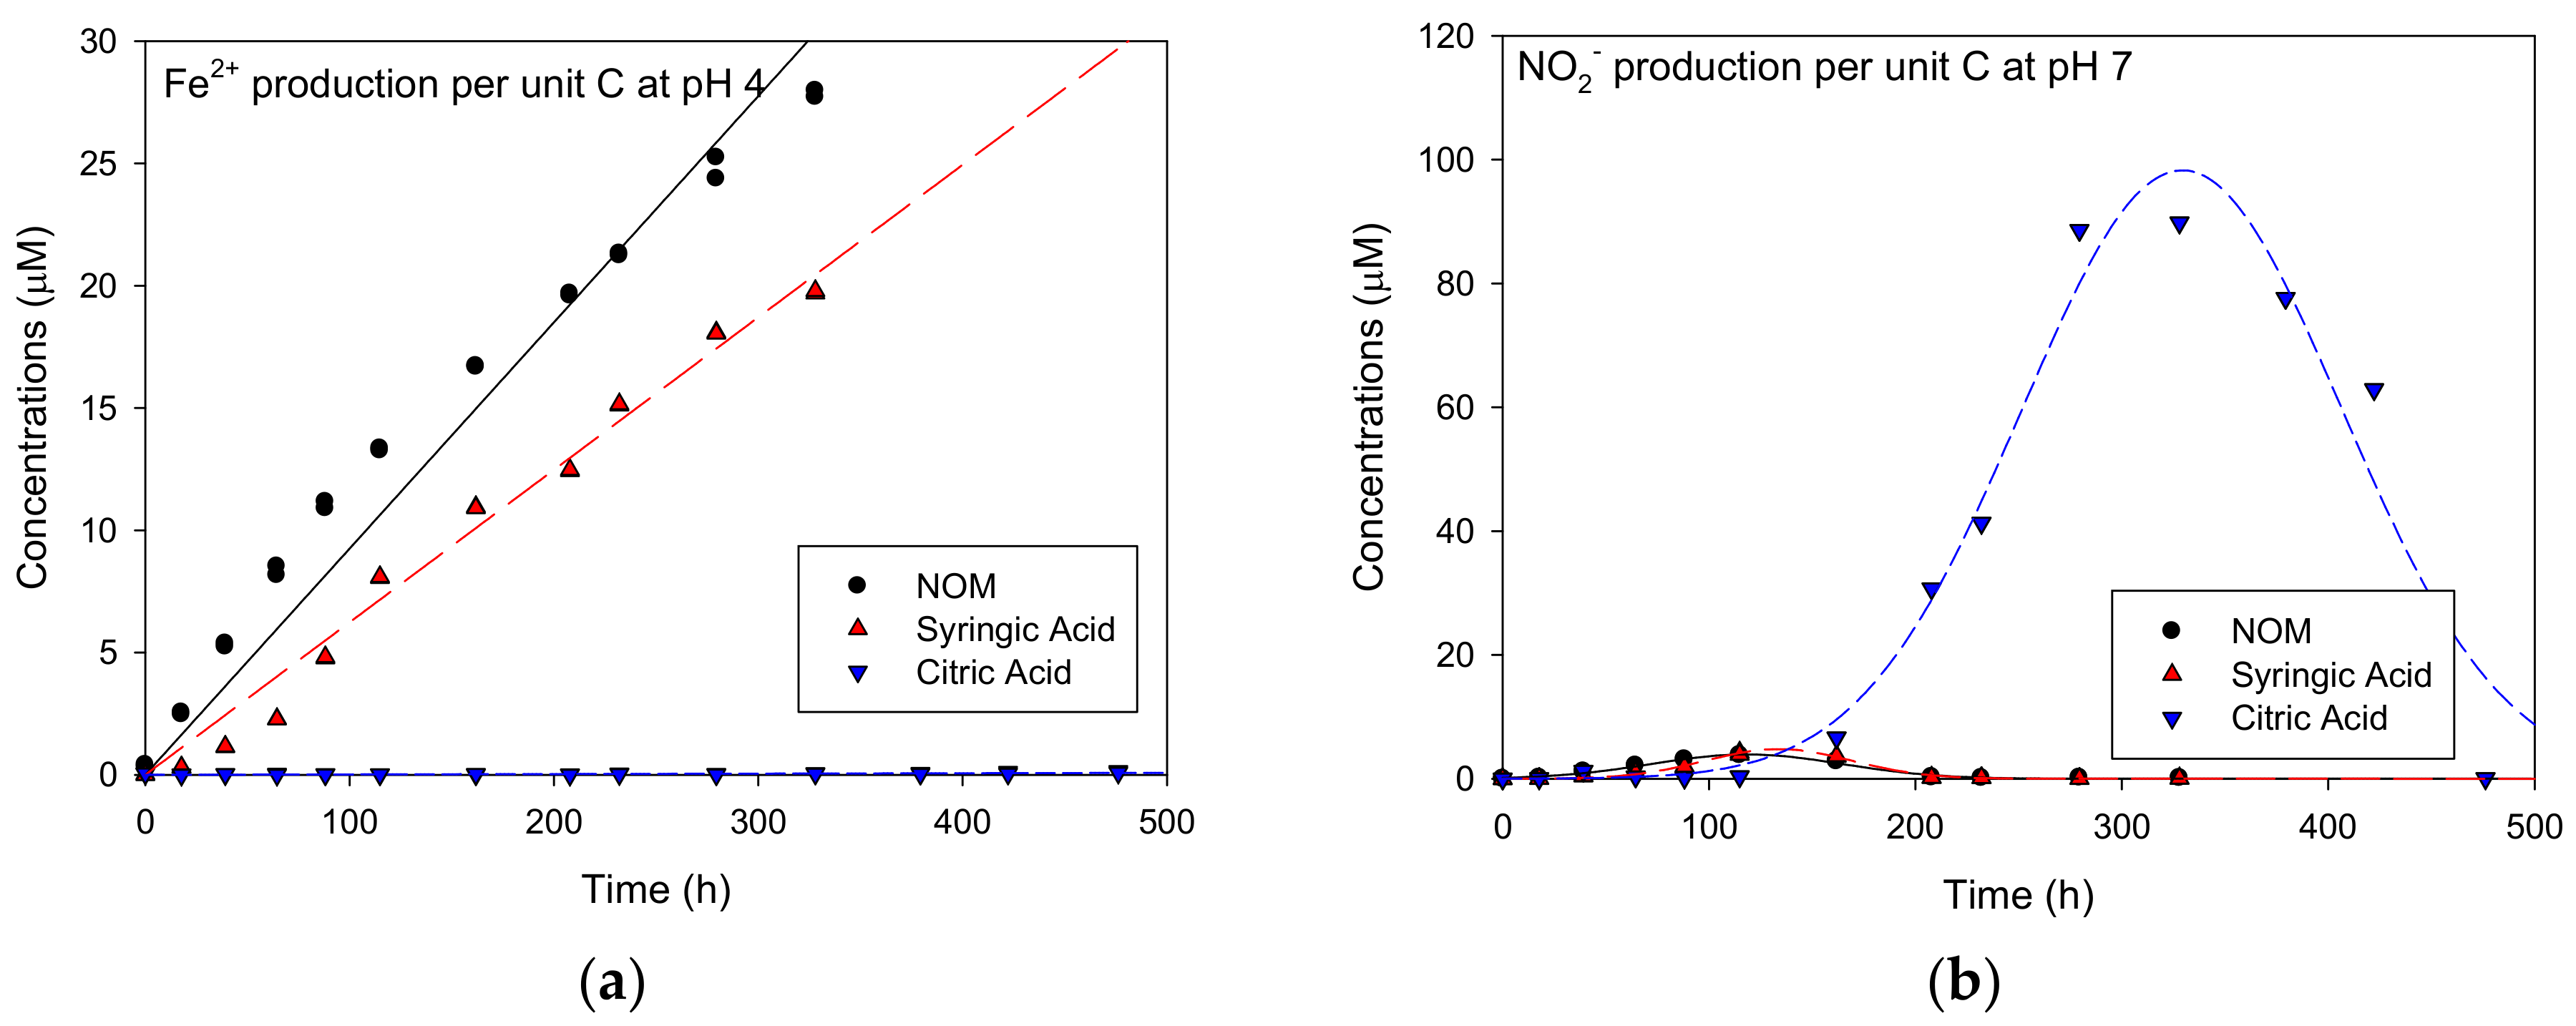
3.1. Effect of Labile Organic Materials on Nitrite and Ferrous Production
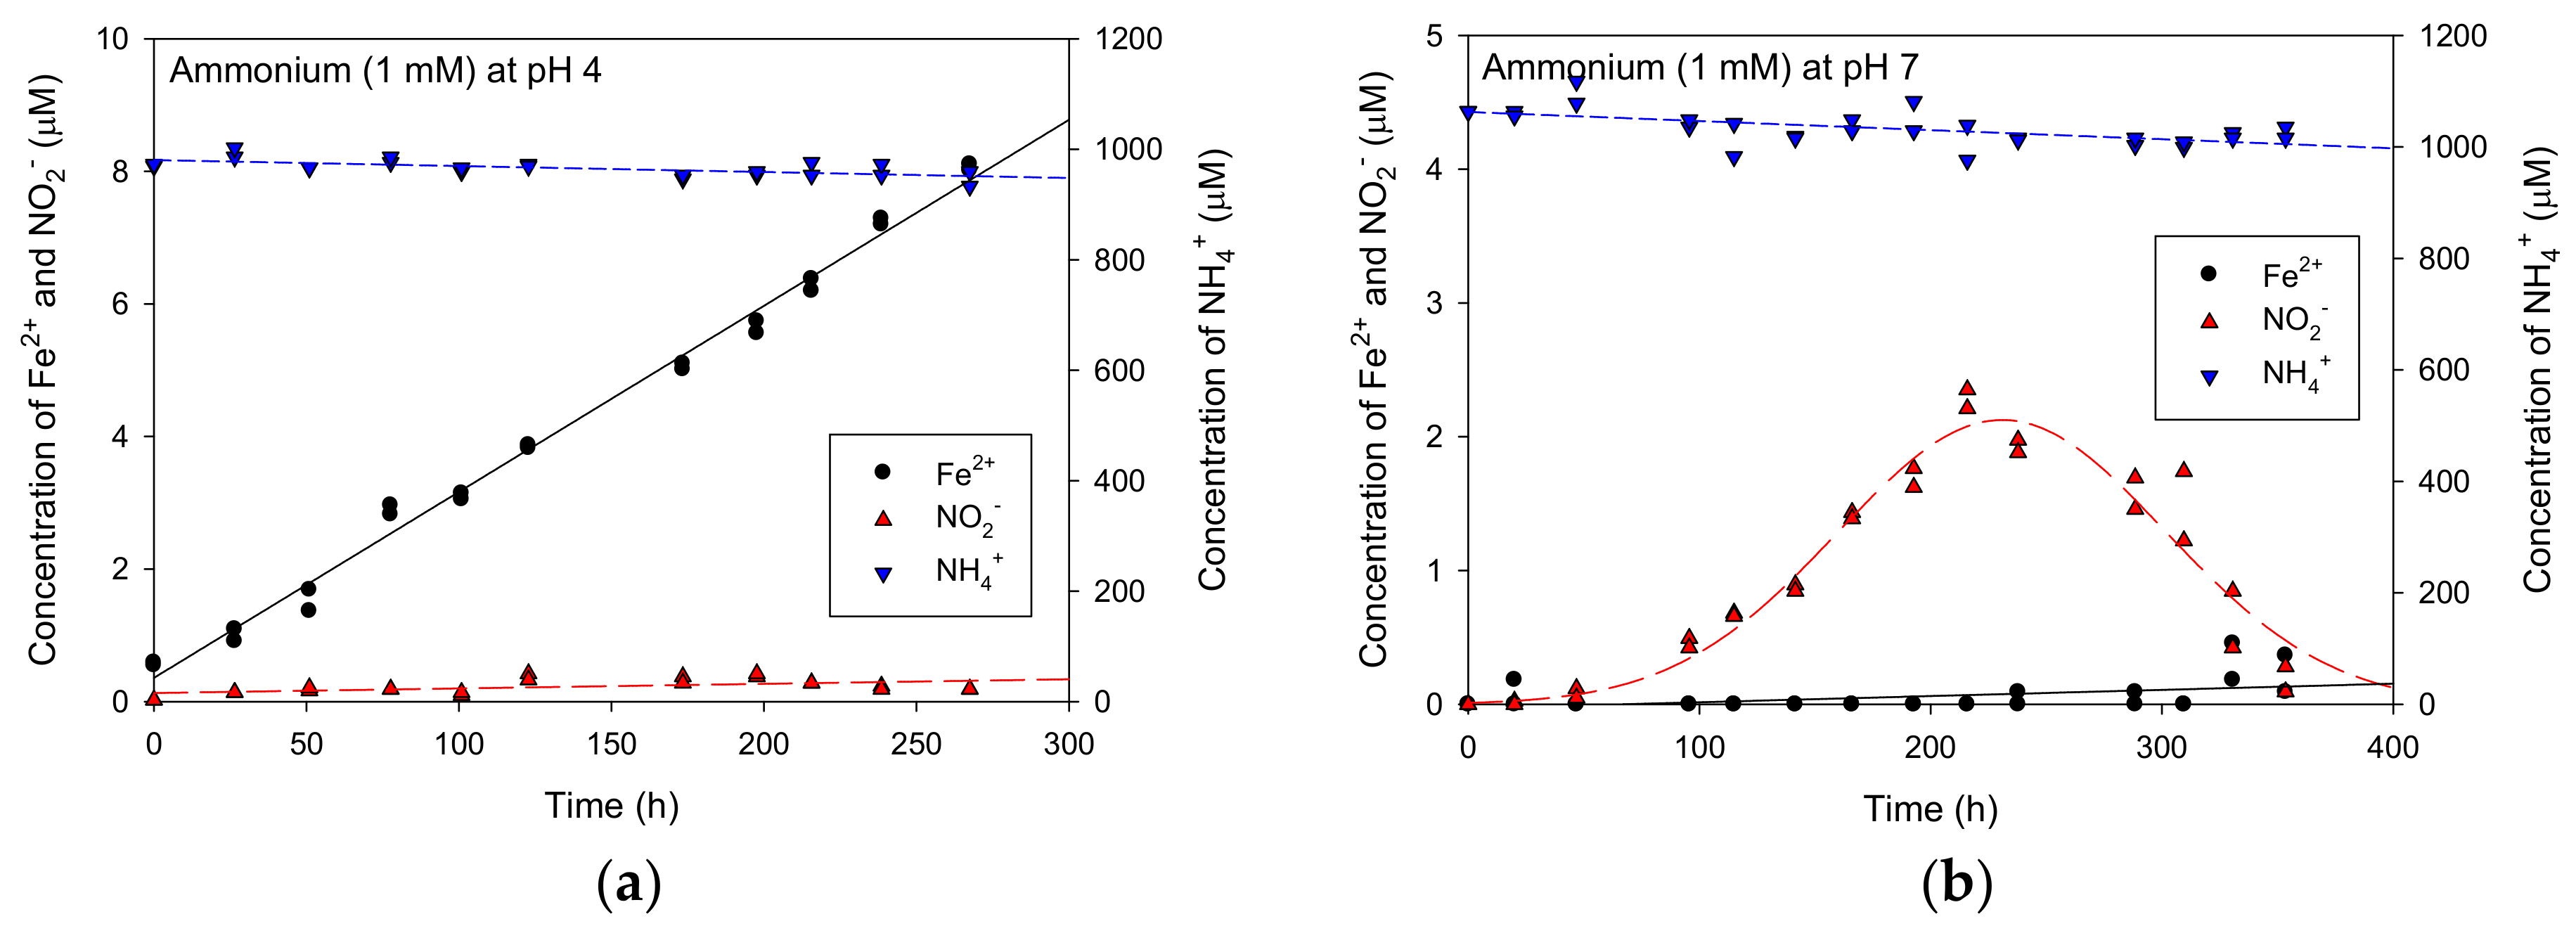
3.2. Possibility of Ammonium Used as a Reduced Material for Nitrite and Ferrous Production
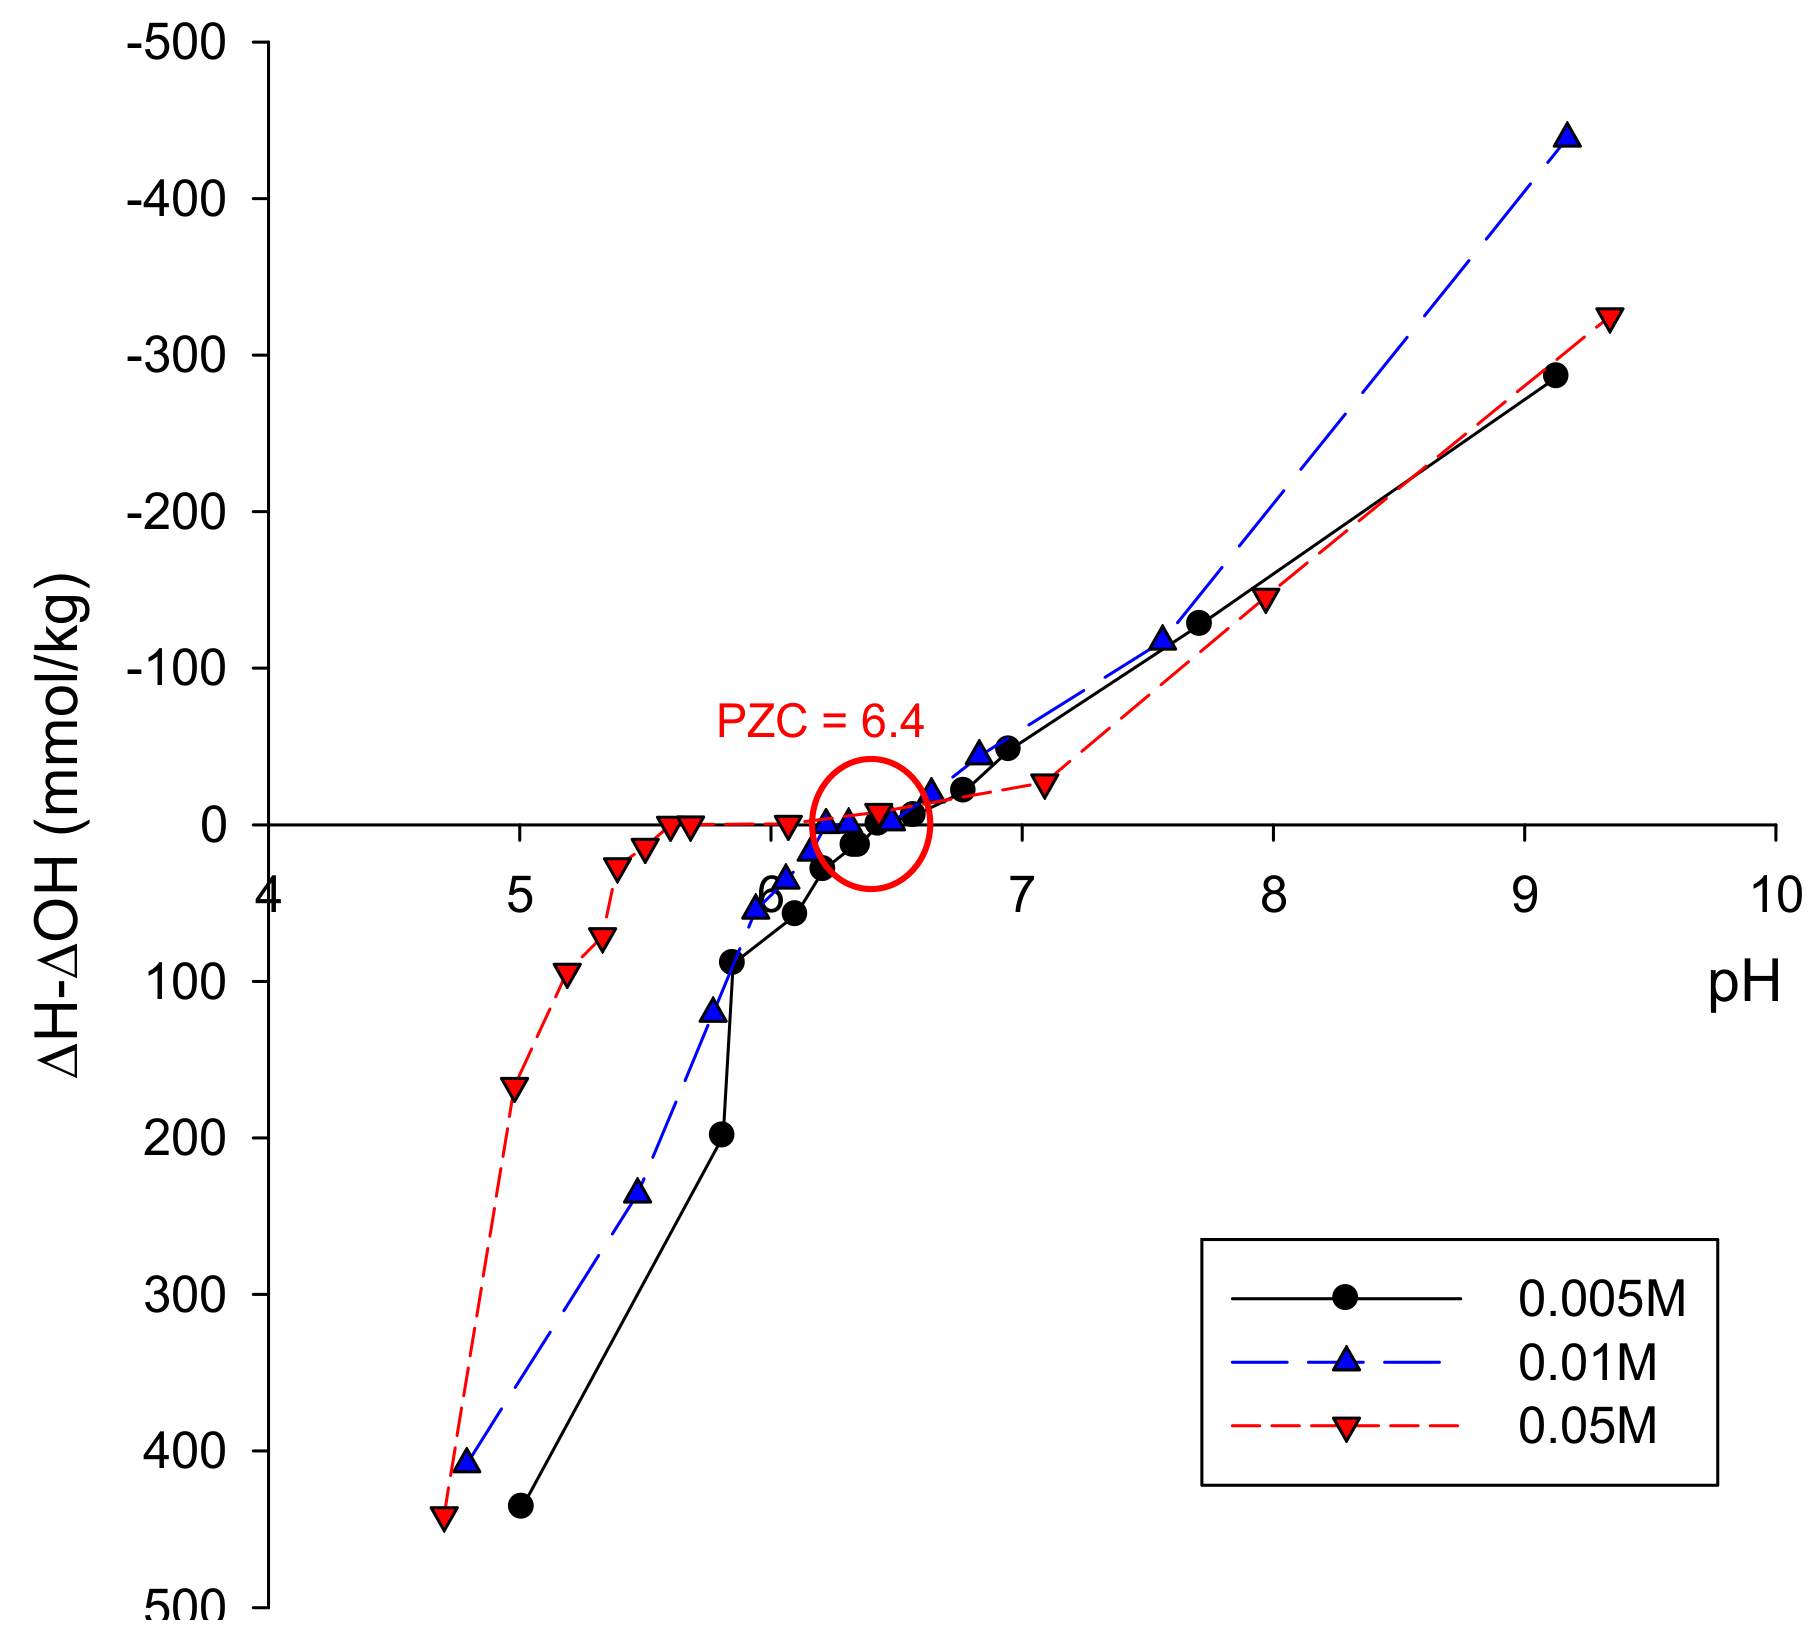
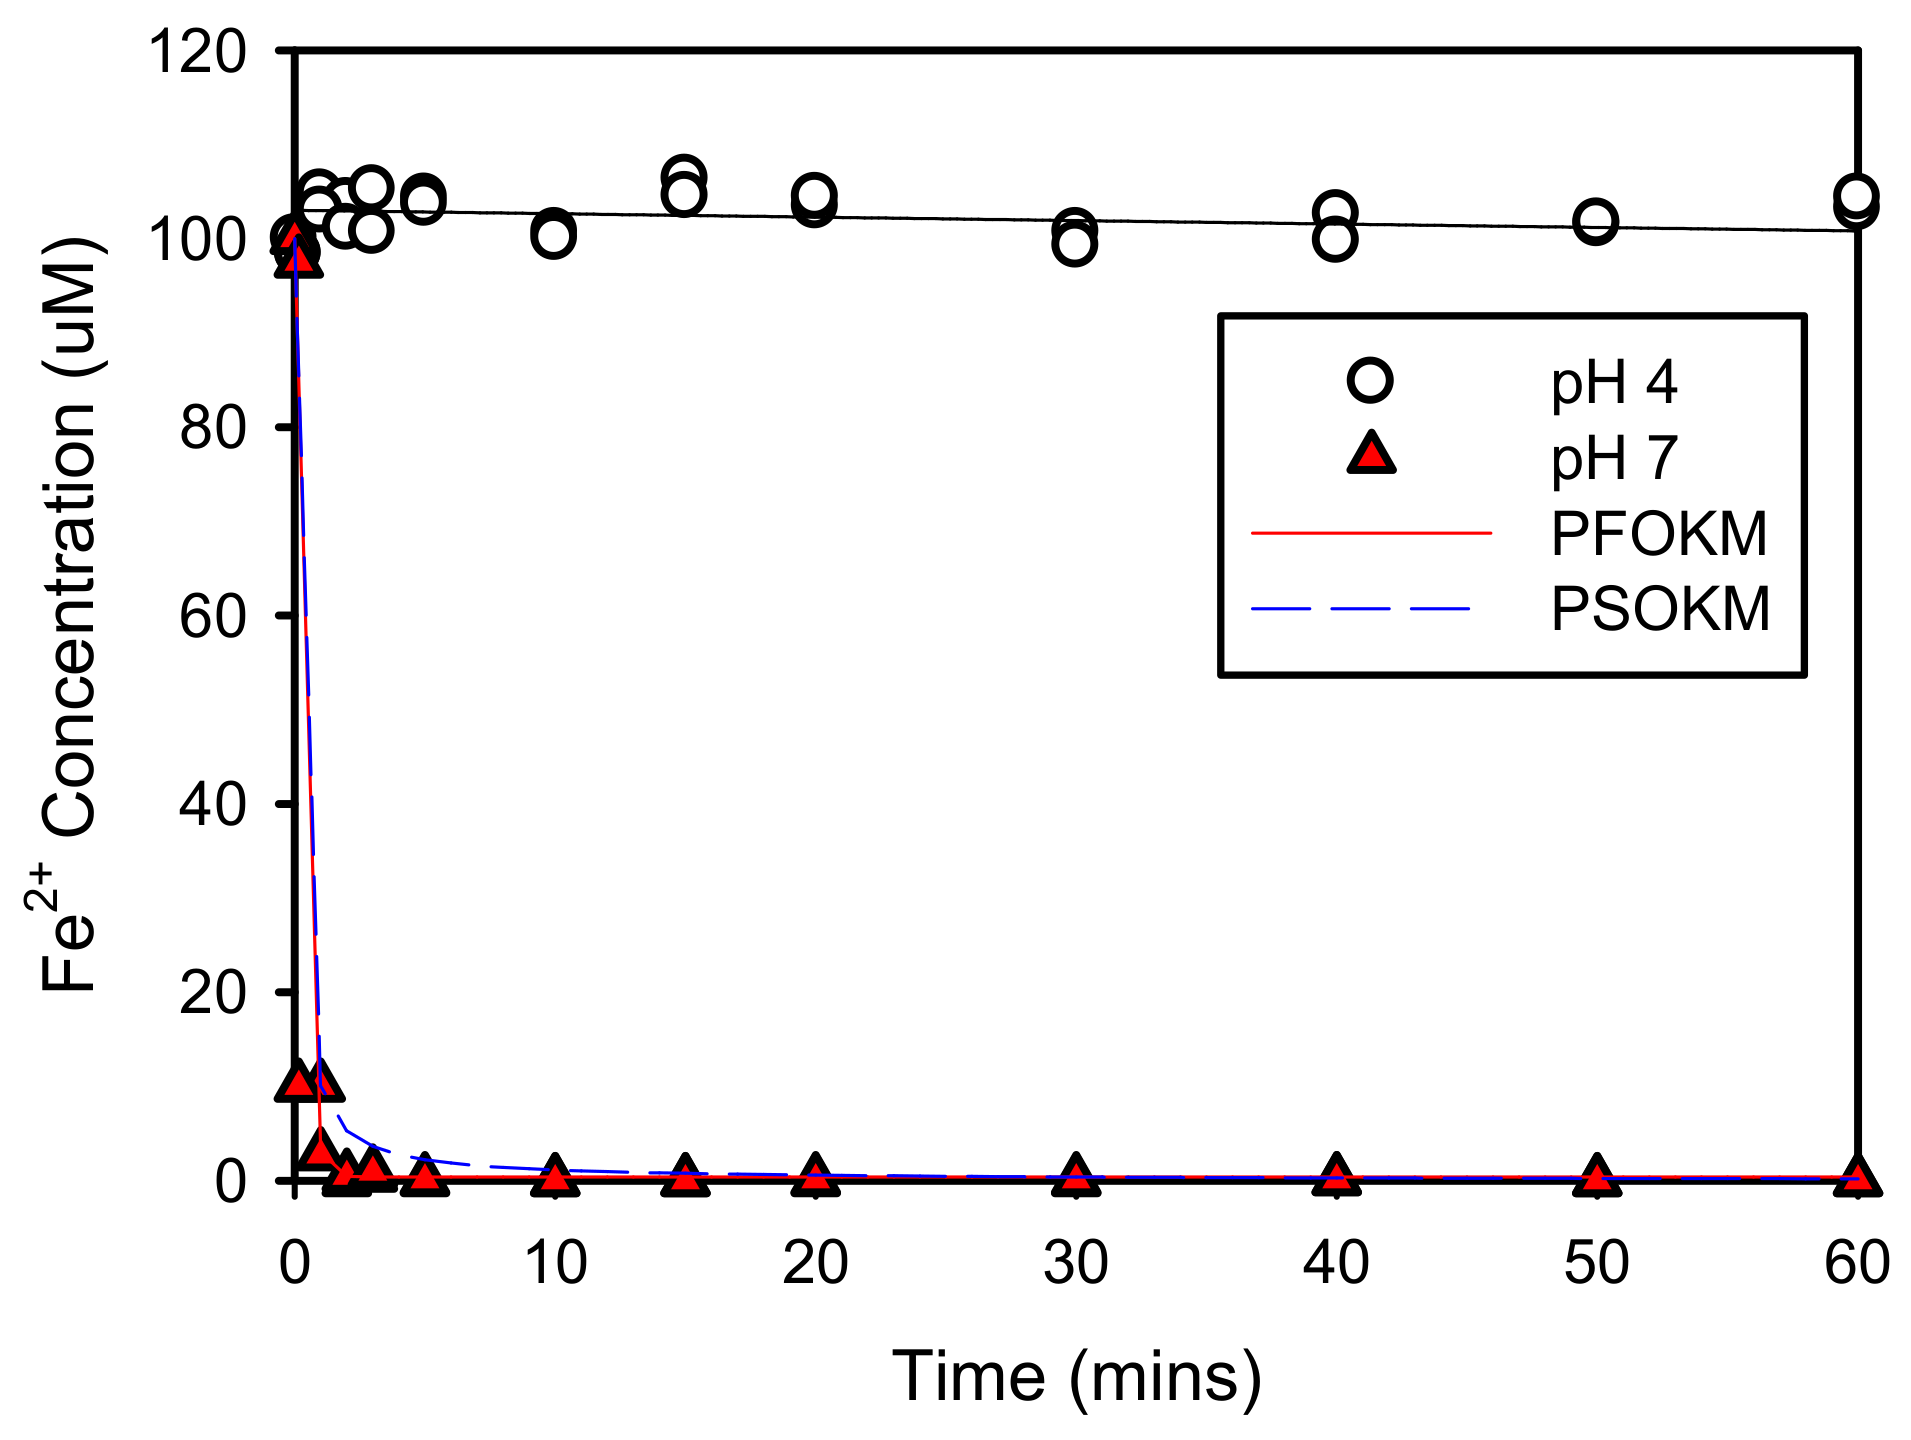
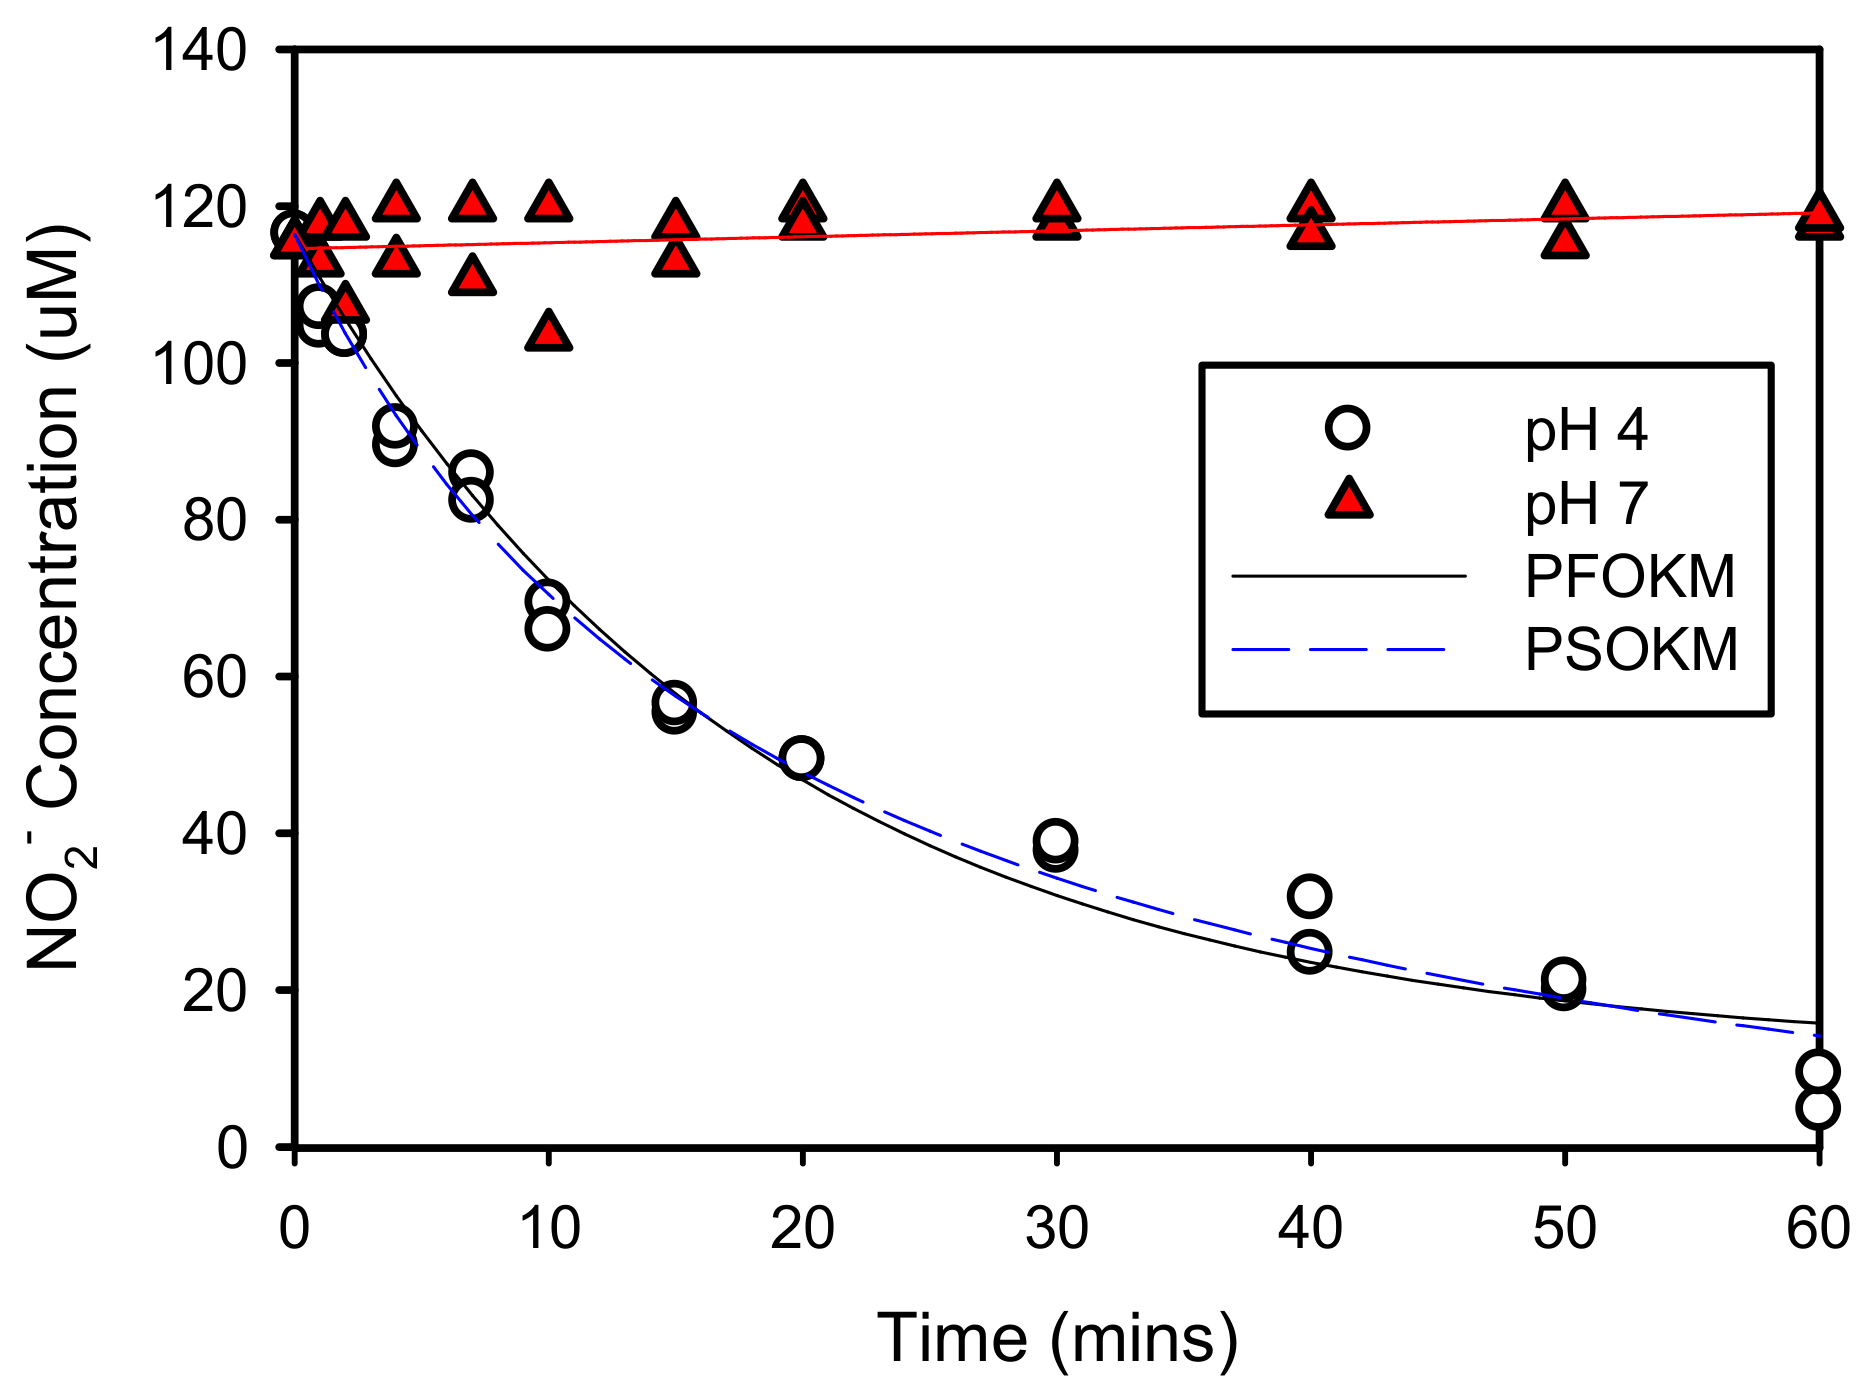
3.3. Effect of pH on Fe2+ and NO2− Adsorption onto Goethite
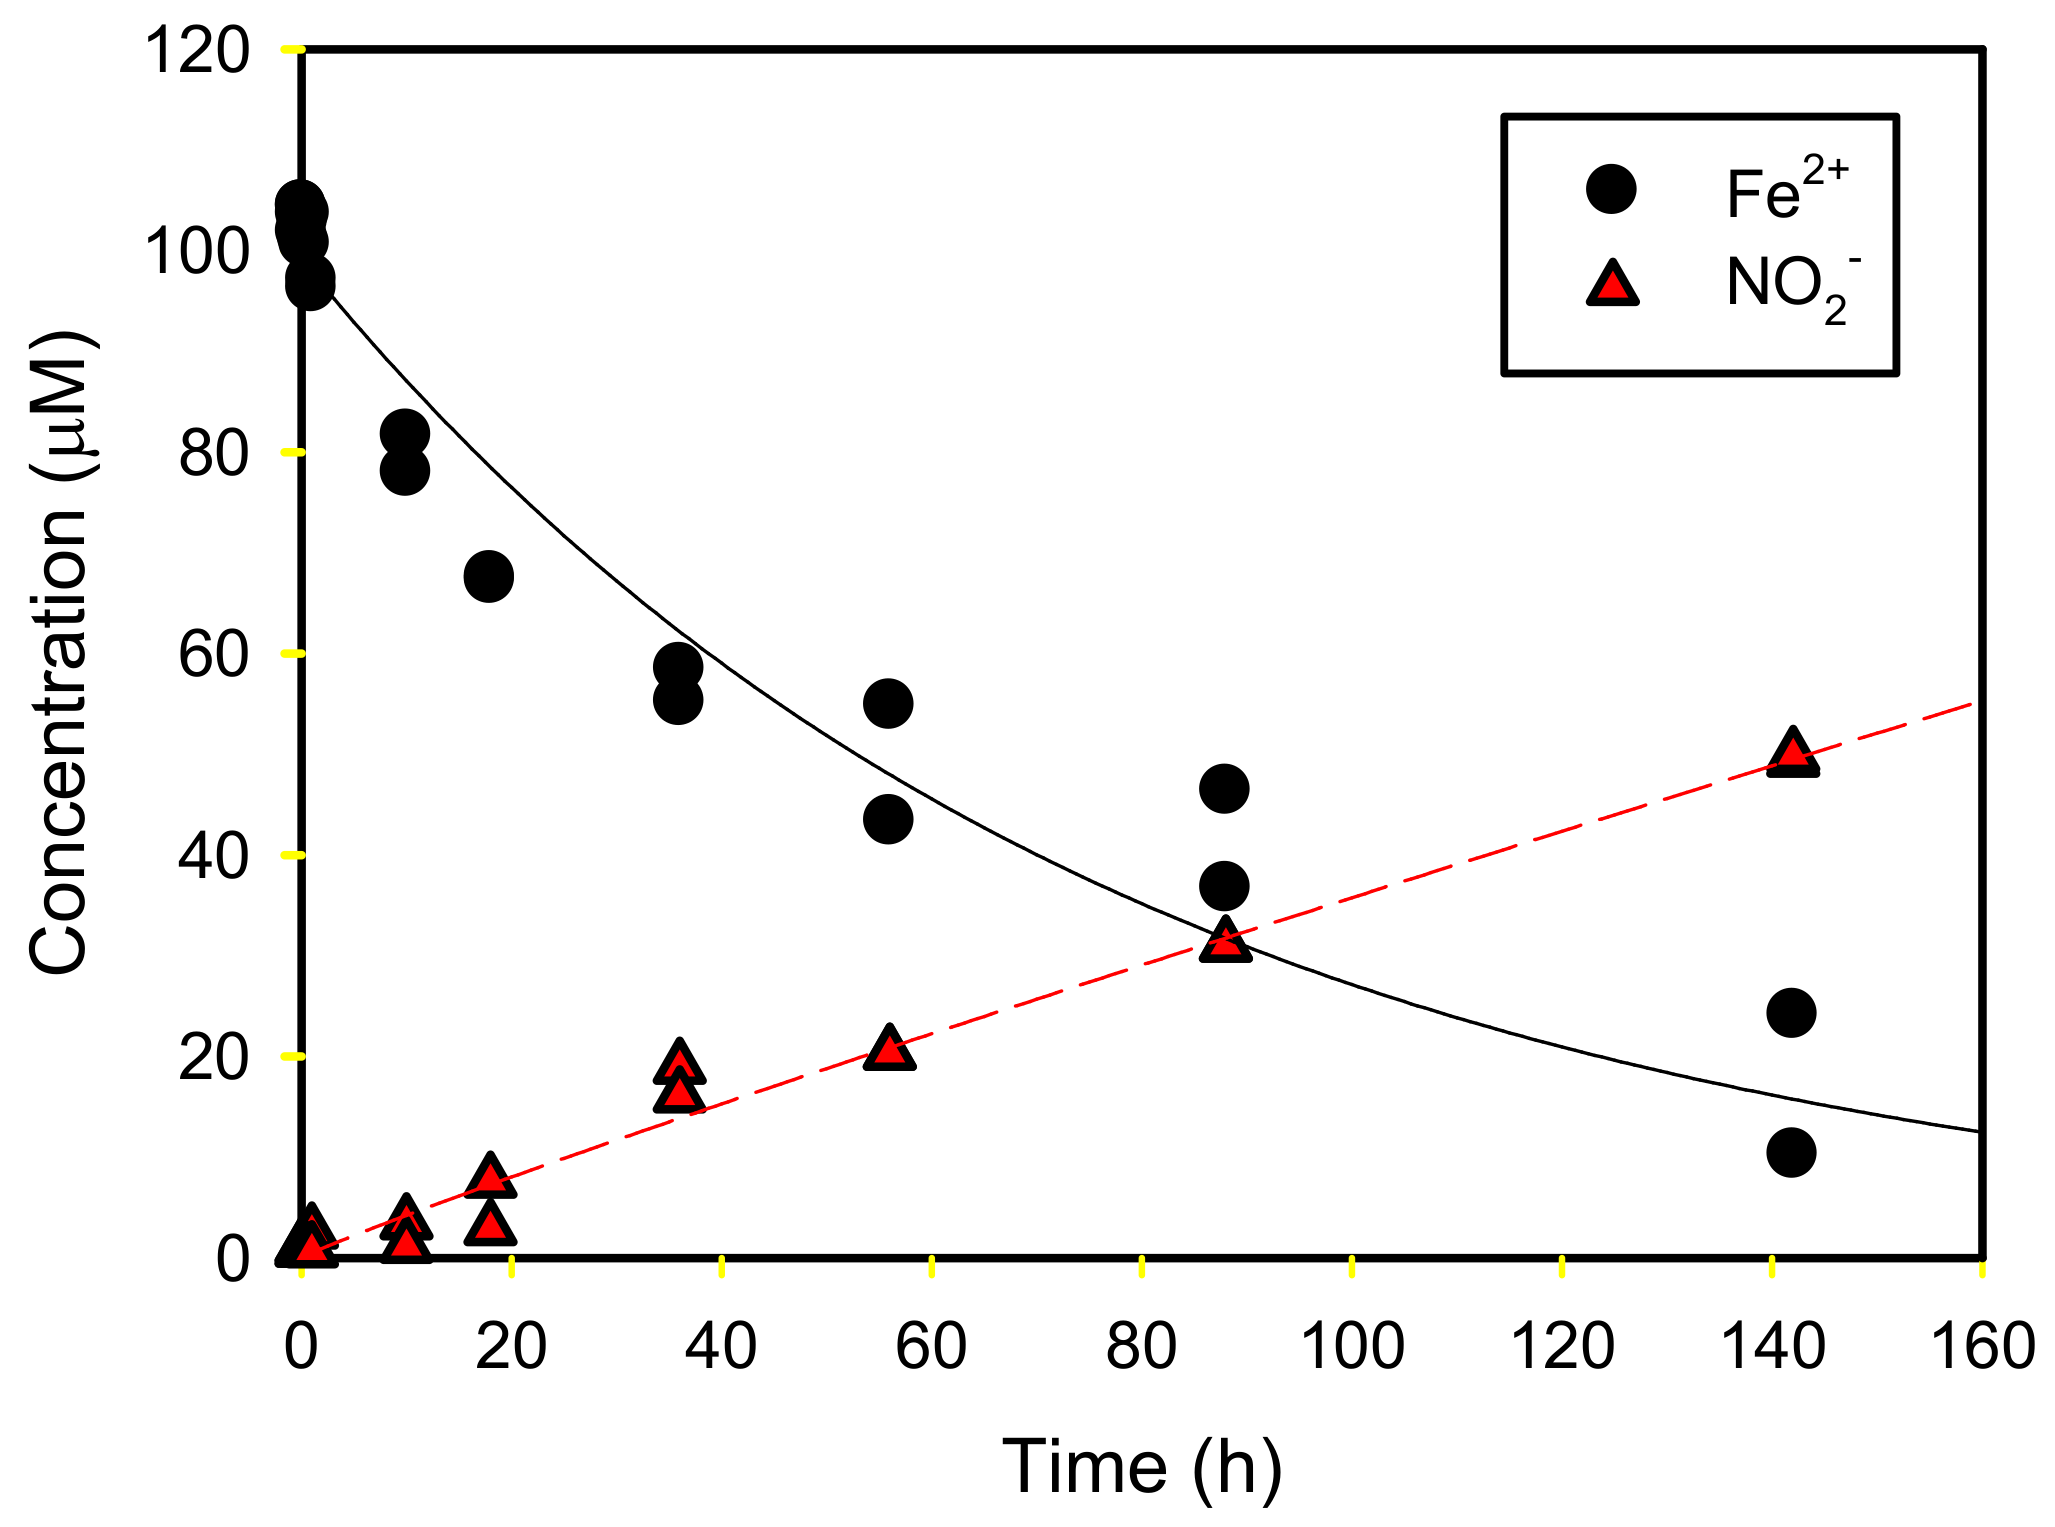
3.4. The Reaction of Fe2+ and NO3− to Produce NO2−
4. Discussion
5. Conclusions
Author Contributions
Funding
Acknowledgments
Conflicts of Interest
References
- Umezawa, Y.; Hosono, T.; Onodera, S.; Siringan, F.; Buapeng, S.; Delinom, R.; Yoshimizu, C.; Tayasu, I.; Nagata, T.; Taniguchi, M. Sources of nitrate and ammonium contamination in groundwater under developing Asian megacities. Sci. Total Environ. 2008, 404, 361–376. [Google Scholar] [CrossRef] [PubMed]
- Zhu, B.; Wang, T.; You, X.; Gao, M.R. Nutrient release from weathering of purplish rocks in the Sichuan Basin, China. Pedosphere 2008, 18, 257–264. [Google Scholar] [CrossRef]
- Nieder, R.; Benbi, D.K.; Scherer, H.W. Fixation and defixation of ammonium in soils: A review. Biol. Fertil. Soil 2011, 47, 1–14. [Google Scholar] [CrossRef]
- Buss, S.R.; Herbert, A.W.; Morgan, P.; Thornton, S.F.; Smith, J.W.N. A review of ammonium attenuation in soil and groundwater. Q. J. Eng. Geol. Hydroge. 2004, 37, 347–359. [Google Scholar] [CrossRef]
- Clement, J.C.; Shrestha, J.; Ehrenfeld, J.G.; Jaffe, P.R. Ammonium oxidation coupled to dissimilatory reduction of iron under anaerobic conditions in wetland soils. Soil Biol. Biochem. 2005, 37, 2323–2328. [Google Scholar] [CrossRef]
- Neubauer, S.C.; Emerson, D.; Megonigal, J.P. Life at the energetic edge: Kinetics of circumneutral iron oxidation by lithotrophic iron oxidizing bacteria isolated from the wetland-plant rhizosphere. Appl. Environ. Microbiol. 2002, 68, 3988–3995. [Google Scholar] [CrossRef] [PubMed]
- Doane, T.A. The abiotic nitrogen cycle. ACS Earth Space Chem. 2017, 1, 411–421. [Google Scholar] [CrossRef]
- Davidson, E.A.; Chorover, J.; Dail, D.B. A mechanism of abiotic immobilization of nitrate in forest ecosystems: The ferrous wheel hypothesis. Glob. Chang. Biol. 2003, 9, 228–236. [Google Scholar] [CrossRef]
- Zhu-Barker, X.; Cavazos, A.R.; Ostrom, N.E.; Horwath, W.R.; Glass, J.B. The importance of abiotic reactions for nitrous oxide production. Biogeochemistry 2015, 126, 251–267. [Google Scholar] [CrossRef]
- Davidson, E.A.; Dail, D.B.; Chorover, J. Iron interference in the quantification of nitrate in soil extracts and its effect on hypothesized abiotic immobilization of nitrate. Biogeochemistry 2008, 90, 65–73. [Google Scholar] [CrossRef]
- Giles, M.; Morley, N.; Baggs, E.M.; Daniell, T.J. Soil nitrate reducing processes-drivers, mechanisms for spatial variation, and significance for nitrous oxide production. Front. Microbiol. 2012, 3, 407. [Google Scholar] [CrossRef] [PubMed]
- Lovley, D.R.; Phillips, E.J.P. Organic matter mineralization with reduction of ferric iron in anaerobic sediments. Appl. Environ. Microbiol. 1986, 51, 683–689. [Google Scholar] [CrossRef] [PubMed]
- Stehfest, E.; Bouwman, L. N2O and NO emission from agricultural fields and soils under natural vegetation: Summarizing available measurement data and modelling of global annual emissions. Nutr. Cycl. Agroecosyst. 2006, 74, 207–228. [Google Scholar] [CrossRef]
- McCauley, A.; Jones, C.; Olson-Rutz, K. Soil pH and organic matter. In Nutrient Management; Montana State University: Bozeman, MT, USA, 2017; p. 4449-8. [Google Scholar]
- Atkinson, R.J.; Posner, A.M.; Quirk, J.P. Crystal nucleation and growth in hydrolysing iron(III) chloride solutions. Clays Clay Mineral. 1977, 25, 49–56. [Google Scholar] [CrossRef]
- Gupta, H.; Kumar, R.; Park, H.S.; Jeon, B.H. Photocatalytic efficiency of iron oxide nanoparticles for the degradation of priority pollutant anthracene. Geosyst. Eng. 2016, 20, 21–27. [Google Scholar] [CrossRef]
- Sparks, D.L.; Page, A.I.; Helmke, P.A.; Loeppert, R.H.; Soltanpour, P.N.; Tabatabai, M.A.; Johnston, C.T.; Sumner, M.E. Methods of Soil Analysis Part 3 Chemical Methods, 1st ed.; Soil Science Society of America, Inc., American Society of Agronomy, Inc.: Madison, WI, USA, 1996; pp. 1244–1248. [Google Scholar]
- Shinn, M.B. Colorimetric method for determination of nitrite. Ind. Eng. Chem. Anal. Ed. 1941, 13, 33–35. [Google Scholar] [CrossRef]
- Stookey, L.L. Ferrozine-a new spectrophotometric reagent for iron. Anal. Chem. 1970, 42, 779–781. [Google Scholar] [CrossRef]
- Perez-Guzman, L.; Bogner, K.R.; Lower, B.H. Earth’s ferrous wheel. Nat. Edu. Knowl. 2010, 3, 32. [Google Scholar]
- Ho, Y.; McKay, G. Pseudo-second order model for sorption processes. Process. Biochem. 1999, 34, 451–465. [Google Scholar] [CrossRef]
- Gosset, T.; Trancart, J.L.; Thevenot, D.R. Batch metal removal by peat. Kinetics and thermodynamics. Water Res. 1986, 20, 21–26. [Google Scholar] [CrossRef]


| dreported (Å) [16] | dobserved (Å) (This Study) |
|---|---|
| 4.17 | 4.19 |
| 2.69 | 2.69 |
| 2.58 | 2.58 |
| 2.44 | 2.45 |
| 2.19 | 2.19 |
| 1.92 | - |
| 1.71 | 1.72 |
| 1.57 | 1.56 |
| 1.51 | 1.51 |
| Parameter | Fe2+ | NO2− | ||
|---|---|---|---|---|
| PFOKM | PSOKM | PFOKM | PSOKM | |
| C0 (μmol/L) | 100 | 100 | 116.4 | 116.4 |
| qe (μmol/kg) | 19,920 ± 551.4 | 20,000 ± 717.1 | 20,900 ± 630.7 | 23,280 ± 793.0 |
| Ce (μmol/L) | 0.395 | 0.000 | 11.90 | 0.025 |
| Removal Efficiency (%) | 99.6 | 100.0 | 89.8 | 100.0 |
| k1 (1/d) or k2 (kg/μmol/d) | 3.636 ± 0.976 | 1.94 × 10⁻⁴ ±7.33 × 10⁻⁵ | 0.0548 ± 0.0042 | 3.17 × 10⁻⁶ ±5.16 × 10⁻⁷ |
| R2 | 0.8491 | 0.8147 | 0.9823 | 0.9773 |
| Sum of square errors | 0.3879 | 0.4765 | 0.0381 | 0.0487 |
| Parameter | Fe2+ | NO2− |
|---|---|---|
| Equation | C = C0 e−kt | C = C0 (1 − e−kt) |
| C0 | 99.11 ± 2.03 | 207.20 ± 115.18 |
| k | 0.013 ± 0.001 | 0.0019 ± 0.0012 |
| R2 | 0.9477 | 0.9862 |
| Sum of square errors | 6.946 | 1.904 |
© 2020 by the authors. Licensee MDPI, Basel, Switzerland. This article is an open access article distributed under the terms and conditions of the Creative Commons Attribution (CC BY) license (http://creativecommons.org/licenses/by/4.0/).
Share and Cite
Choi, H.; Oh, S. Abiotic Transient Nitrite Occurrences from Nitrate Reduction through Goethite-Mediated Fe(III)/Fe(II) Cycle with Labile Organic Materials and Ammonia. Water 2020, 12, 1202. https://doi.org/10.3390/w12041202
Choi H, Oh S. Abiotic Transient Nitrite Occurrences from Nitrate Reduction through Goethite-Mediated Fe(III)/Fe(II) Cycle with Labile Organic Materials and Ammonia. Water. 2020; 12(4):1202. https://doi.org/10.3390/w12041202
Chicago/Turabian StyleChoi, Hyeoksun, and Sanghwa Oh. 2020. "Abiotic Transient Nitrite Occurrences from Nitrate Reduction through Goethite-Mediated Fe(III)/Fe(II) Cycle with Labile Organic Materials and Ammonia" Water 12, no. 4: 1202. https://doi.org/10.3390/w12041202
APA StyleChoi, H., & Oh, S. (2020). Abiotic Transient Nitrite Occurrences from Nitrate Reduction through Goethite-Mediated Fe(III)/Fe(II) Cycle with Labile Organic Materials and Ammonia. Water, 12(4), 1202. https://doi.org/10.3390/w12041202