Abstract
Along the middle reaches of the Dnieper River in central Ukraine, braided riverbeds with many islands have developed in alluvial valleys. In the 1970s, six dams were commissioned, and respective monitoring infrastructure was installed. Riverbanks and valley floors composed of unconsolidated material have much lower bank strengths and are susceptible to fluvial erosion and bank collapse, particularly during the release of high flow volumes from hydropower dams. The regulation of the Dnieper River along a cascade of storage reservoirs caused significant changes in its active river channel and hydrological regime. In order to estimate channel stability downstream of the Kaniv reservoir, we conducted an analysis of the hydraulic conditions in terms of changes in flow velocity and propagation of waves caused by intervention water discharges from the Kaniv Hydroelectric Power Plant (HPP). In this paper, we assess the hydromorphological parameters of the studied river reach as well as the characteristics of the related erosion and deposition zones. Therefore, a monitoring framework for channel processes (MCP) downstream of the Kaniv HPP was installed. The analysis of the intervention discharge parameters was conducted based on measurements from July 2015. Channel stability was expressed by the following factors: Lohtin’s number (L), Makkaveev’s (Kc) factor of stability, and a complex index of stability (Mx) by Grishanin. This study shows that the velocity of artificial wave propagation may reach a speed of up to 74.4 km·h−1. The wave propagates for a distance of approx. 45 km within 65 min at a mean velocity of 37.4 km·h−1. The L, Kc, and Mx indicators used in this work showed that when water discharge increased (e.g., during typical peak-capacity operation), the channel becomes unstable and sediments are subject to erosion processes. The riverbed stability indicators clearly illustrate that an increase in parameter values is not dependent on the distance to the dam. The results are valuable for sustainable sediment management at catchment scale and hence, directly applicable in water management.
1. Introduction
The morphology of river channels depends on many factors considered as dynamic in time and space. According to Montogomery & Buffington [1], river channel development predominantly depends on the following factors: debris supply (its volume, frequency, and size), river’s transport capacity (frequency and flow volume) and—directly and indirectly—vegetation and land use (e.g., impact on the stability of banks). According to Church [2], water flows set the scale of the channel and the sediment regime leads to a distinctive character of the river morphology. Riverbank and bed mobility are natural and its rate allows to distinguish stable rivers from unstable rivers [3]. Unnaturally high rates of bank and bed mobility have multiple causes, ranging from small-scale—local occurrences, such as unrestricted livestock access to the water or all-terrain vehicle traffic, to large-scale, regional factors like Lohtin’s number (L) [4], Makkaveev’s (Kc) [5] stability factor or the complex stability index (Mx) [6]. To explain the concept of dynamic equilibrium [7] Lane’s equilibrium [8] is widely used. Lane’s balance relation considers changes in the following five variables: water discharge, slope of water surface on the longitudinal profile, bed load material, and mean diameter d50, as well as median size of bed material. If one or more of these variables change, the river will react, causing the other variables to change to restore the balance. Dust and Wohl [9] expanded the original Lane’s equilibrium. Additionally, they take into account measured cross-sectional, planform, and bedform geometries as extra degrees of freedom. The latter allows for the visualization of complex river responses that commonly involve adjustments to cross-sectional, planform, and/or bedform geometry. One of the most recent definitions of channel stability was presented by Rosgen [10] stating that: ‘it is the ability of a stream, over time, in the present climate, to transport the sediment and flows produced by its watershed in such a manner that the stream maintains its dimension, pattern and profile without either aggrading nor degrading’. This definition summarizes many of the key points presented in the literature. According to Schumm [11], the best qualitative guide to river stability is a comparison of the morphology of numerous reaches, and the determination of whether or not there has been a change in the position and morphology of the channel during the last few centuries. A quantitative assessment of riverbank and riverbed stability can be rapidly performed using specific indices. The controlling factors described by Leopold et al. [12] include width, depth, velocity, slope, discharge, sediment size, sediment concentration, and channel roughness. Rosgen [13] additionally introduced a Bank Erosion Hazard Index (BEHI). Another approach to river stability assessment, based on the comparison of channel geometry features and bed sediment characteristics, is represented by Lothin’s numer (L) [4] and the factor of stability (Kc) [5]. Channel stability may be also expressed by the complex index of stability (Mx) by Grishanin [6]. The validity of Grishanin’s conceptual considerations for cohesive riverbeds was discussed by Sukhodolov et al. [14] and tested by Nikora & Nikora [15]. Different variants of the Grishanin’s model are widely used in hydrology and geomorphology to anticipate the intensity of channel deformations [16,17]. Very interesting results of trough stability tests were performed by Paige & Hickin [18]. Their analysis carried out of bed-wave translation through the sequential cross-sections showed that the bed-elevation change at a given cross-section of the river channel is not only the result of the changing discharge but that it also depends on fluctuating upstream sediment supply. Therefore, it is evident that the impact of very frequent, abrupt changes in water flows caused by the operation of a HPP may affect riverbed morphology and related dynamics.
Regardless of the size of a river, its hydromorphological character, and the climate zone the river is located in, the construction of a dam is regarded as one of the strongest possible interferences in a fluvial system. The commissioning of a single dam results in long-distance changes of river load conditions and short-distance alteration of its hydrological conditions [19,20,21]. The formation of the river cascade (several dams) causes large-scale environmental changes in their vicinity and in the entire basins of rivers with a regulated runoff [22].
Transformations of the hydrological regime below the dams has been documented by several authors such as Wiliams & Wolman [23]; Richter et al. [24], Vörösmarty et al. [25], Peeg et al. [26], Nilsson & Berggren [27], Suen [28], Gao et al. [29], Eng et al. [30], Fantin-Cruz et al. [31]; Zhang et al. [32], Obodovskyi [33], Habel [34], Malihot et al. [35], and Hecht et al. [36]. As a consequence of damming a river, a reservoir is formed. In the backwater of the reservoir, the flow of water decreases to a value considered critical for bed load transport. The shortage in clastic load transport is consequently replenished below the dam in form of bed erosion and, frequently, lateral erosion [19,23,37,38,39,40,41,42,43]. Just downstream of the erosion zone, an accumulation reach tends to emerge, which usually displays features of a braided channel [44,45]. Bed erosion below dams is most notable in the direct vicinity of the structure itself. The zone of intensive bed erosion below dams occurs at a certain reach and moves at various rates as time goes on. The movement rate of the erosion front is closely connected to the dynamics of reservoir discharges, topography, and the geological structure [20,23,38,44,46,47].
The objective of this article is the assessment of the Middle Dnieper riverbed stability in its present-day condition considering retrospective changes. Moreover, the study provides valuable information to evaluate and predict further riverbed deformations and their evolution. Therefore, we used the following indicators: Lohtin’s number (L), Makkaveev’s (KC) factor of stability, and the Grishanin washing out indicator (Mx). Moreover, we used hydraulic data from the national monitoring framework for channel processes (MCP: monitoring of channel processes) to determine wave characteristics caused by the peak-capacity water discharge from the Kaniv HPP.
2. Materials and Methods
2.1. Study Area
The investigated Dnieper River reach is located between the Kaniv dam and the Sokyrna village gauging station situated near Cherkassy town. As illustrated in Figure 1, this is the Kremenchuk Reservoir’s backwater zone. The Dnieper River is the fourth-longest river in Europe and flows through the territory of the Russian Federation, Belarus, and Ukraine. The Dnieper River is 2290 km long and drains an area of approximately 505.000 km2. The Dnieper River cascade consists of six dams built in the years 1958 to 1973 (Kiev, Kaniv, Kremenchuk, Dnieprodzerzhynsk, Dniepropetrovsk, and Kakhovka), transforming the river into a series of reservoirs spread over a distance of 855 km [48].
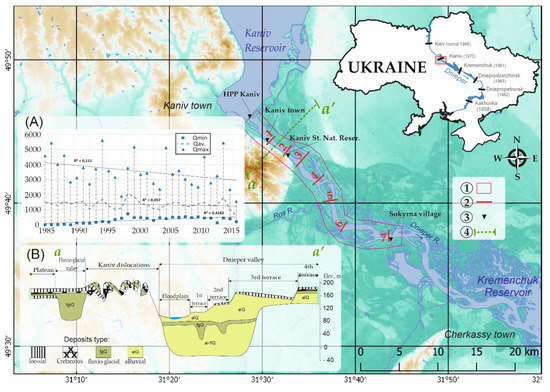
Figure 1.
Map of the study area with the location of investigation sites on the Middle Dnieper river. (A) hydrograph of Dnieper flows (in m3·s−1) at Kaniv town gauging station for the period 1985–2015 [55]; (B) geological and geomorphological profile of the river valley. 1—study area; 2—cross-channel profiles, 3—hydrological gauging stations, 4—geological cross-section below Kaniv dam a-a’ [52].
The Kaniv dam commissioned in 1973 is 18 m high, approx. 5 km long, and the reservoir has a capacity of 2.6 km3 with surface area of 675 km2. It is classified as a very large dam [49]. The Kaniv HPP, together with the entire Dnieper cascade, generates over 3.7 million kW and an average annual production of approx. 10 billion kWh [50]. Every year, a volume of approx. 17–18 km3 of water is extracted from the Dnieper. Thereof, 50% is used in the industrial and energy sectors and 30% in agriculture. The Dnieper cascade supplies water to 53 irrigation complexes and four nuclear power plants in the Ukraine territory [51].
Approx. 55–57% of the Dnieper annual discharge volume is supplied in spring (March to May), 12% in winter, 17–21% in summer (June to August), and 12–14% in autumn (September to November). The average water discharge of the Dnieper is 210 m3·s−1 at the Belarus border (above Biarezina R.), 1380 m3·s−1 in Kiev, 1402 m3·s−1 in Kaniv (Figure 1), and 1670 m3·s−1 at the estuary. The highest flow rate occurs in spring with 7000 m3·s−1, which is the average rate at Kiev. During the historical flood in March–April 1931, the flow rate at Kiev amounted to 23,100 m3·s−1 [50]. In winter, the Dnieper River freezes. On average, the ice cover in Kiev occurs in December and thaws in March [52].
Generally, the Kaniv Reservoir stabilizes the flow regime of the Dnieper downstream. Consequently, the low water levels of summer and winter months increased remarkably. The changes also affect extreme water flows, resulting in reduced maximum annual flows (Figure 1A). However, the operation of the dam (and HPP in particular) can result in large hourly fluctuations of water levels downstream, which might not be visible on the daily flow hydrographs. Analogous changes in the flow regime also take place below the other cascade reservoirs [53]. The flow velocity of the Dnieper River prior to the regulation ranged between 0.6 to 0.8 m·s−1, decreasing to 0.3–0.02 m·s−1 after the construction of the dam [54].
According to observed daily discharge data provided by the Ukrainian Hydrometeorological Center [55], the operational regime of the Kaniv dam changed two times. In the first period, lasting from 1973 to 1990, the HPP was activated during the highest demand for electricity (hydropeaking regime/peak—capacity operation). This manner of operation caused an instantaneous flow increase, reaching even 6000 m3·s−1, in contrast to the usual flows of approx. 3000 m3·s−1. The second period, characterized by a different operational regime of the dam, lasted from 1990 to date. The HPP functions under the so-called run-of-river operation with an assumed environmental flow of 960 m3·s−1, and with intervention flows only during the highest demand for electricity. However, instantaneous flow increases between 960 m3·s−1 up to 7680 m3·s−1 (Figure 2) were observed.
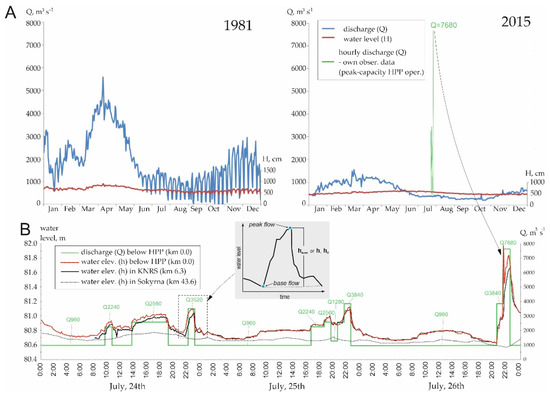
Figure 2.
Examples of the Dnieper River daily hydrographs at Kaniv gauging station (A) under different operating regimes (1981—hydropeaking regime, 2015—run-of-river and peak-capacity type regime) [55] as well as (B) the hydrograph of water elevation and discharge during HPP peak-capacity operation in June 2015.
The average annual sediment discharge ranges from 0.03 to 0.18 kg·m−1·s−1 with a total sediment yield of 2.1 million tons per year [56]. Suspended sediment concentration (SSC) at the outlet after constructing the Kiev reservoir decreased from 31.6 to 23.0 mg·L−1 [52]. The river valley below the Kaniv dam is about 8–19 km wide and the river consists of several channels separated by vegetated islands. The active river channel is 200–1200 m wide. The river valley cross-section at Kaniv shows four distinct river terraces [52]. As far as the geological structure is concerned, this part of the Middle Dnieper area corresponds to the north-eastern branch of the Ukrainian shield running towards the Dnieper-Donets line [57]. The sedimentary complex constituting the upper structural part of the area under consideration is composed of rocks of all geologic periods from Permian to Anthropocene age [52]. The Kaniv region is characterized by certain particularities in its geological dislocated structure. The Neogene deposits are represented by a thick (up to 60 m and thicker) strata of alluvial and/or fluvio-glacial deposits (Figure 1B), forming the terrace levels of different ages in the Dnieper valley [58].
2.2. Field Investigations
Fieldwork campaigns were carried out in June 2003 and July 2015 and focused mainly on hydrological observations, sediment sampling (five samples for each cross-section), morphometric measurements of the channel, and a detailed geomorphological mapping. Monitoring was additionally supplemented with seven control cross-sections originally prepared during the field campaign conducted in 2003 (Figure 1). The measurement locations are distributed along the reach and are characterized by seven cross-section profiles (Table 1). The study sections were subdivided in the following zones: (i) a potential intensive erosion zone related to cross profile no. 1; (ii) a potential erosion and accumulation zone related to cross profiles no. 2–5, and (iii) a deposition zone related to cross profiles no. 6 and 7 (see Figure 3C). The subdivision into characteristic zones below the artificial reservoirs follows the approaches proposed by Wiliams & Wolman [23], Kondolf [38], and Babiński & Habel [42], who investigated morphological processes below dams.

Table 1.
Morphometric characteristics of seven cross-sections of the Dnieper channel downstream of the Kaniv HPP.
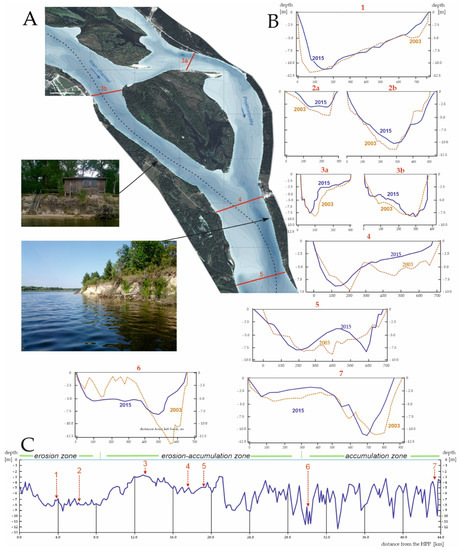
Figure 3.
Section of the bathymetric map of the Dnieper River in July 2015 (main channel and lateral inter-island channel) below Kaniv HPP (A), selected bathymetric cross profiles in 2003 and July 2015 (B) and longitudinal profile of thalweg depths (C). Notations: cross-section location 1–7 as in Table 1.
During fieldwork, hydraulic characteristics were measured. Particular attention we paidto the assessment of water flow velocity during water discharges from the dam (hydropeaking work of HPP). An important part of the evaluation of the channel process dynamics downstream of the Kaniv HPP was based on the established hydrological observation network. The hydrological observations also comprise of an experiment aimed at determining and describing water level fluctuation and artificial wave propagation. Observations were carried out for a period of 72 h at hourly intervals across three profiles located at a 43.6 km-long reach of the Dnieper downstream of the Kaniv HPP (Figure 1). These observations were conducted from 24 July 2015 to 26 July 2015 (Figure 2). The first location (Kaniv HPP station—profile 1, Figure 1) belongs to the national monitoring network and records automatically. The data was provided by the Ukrainian Hydrometeorological Center [55]. At the second Kaniv Natural State Reserve station (KNSR—profile 2, Figure 1) and at the third stations of Sokyrna village (profile 7, Figure 1), we installed vertical control benchmarks with water level loggers of type HOBO MX2000. During each artificial water discharge, we measured water flow velocity with an ADC (OTT GmbH) current meter. The location of these field measurement stations in 2015 was identical with the locations of a previously existing measuring network described by Obodovskiy [49] and Obodovskiy et al. [59].
Channel depth and geodetic measurements were performed using a motorboat equipped with the following devices: single-beam echo sounder (SBES) Teledyne ODOM ECHOTRAC E2, tachymeter and geodetic receiver GPS GNSS Trimble 5800. The morphological analyses were conducted on a digital terrain model (DTM) of the bathymetry based on the collected depth data and geodetic surveys in the field. We used an open-source Geographic Information System software QGIS 2.16.3. for the integration of archival and to date morphological data. The study material was supplemented with bottom sediment samples collected from the shallow parts of the channel, near sandbars, using a Van Veen Grab sampler. Lastly, measurements were performed using GPS and the GNSS positioning systems to indicate water surface elevation on the longitudinal profile between Kaniv HPP and Sokyrna village gauging stations (43.6 km distance).
2.3. River Channel Stability
The reference data for validation and comparisons were own measurements carried out in 2003. In 1997, Obodovskiy [49] established a monitoring system of the channel processes (MCP). Installations were made at the educational hydrological station at the Kaniv State Natural Reserve 6.3 km below the dam and on the Prokhorovsky channel (lateral inter-island channel) (Figure 3A). The study consists of non-systematic observations concerning crucial morphometric channel indicators, allowing an assessment of the riverbed transformation dynamics. MCP comprise of seven cross-sections to: (i) monitor channel incision or aggradation, (ii) define changes in the sediment granulometric composition, and (iii) document changes in the artificial wave propagation during the hydropeaking regime of HPP operations. Collected hydrometric data in 2003 and 2015 were analyzed based on the following indicators and formulas:
The velocity at which artificial waves propagate (spread) within the study reach was estimated by means of the ratio between the distance the wave is travelling (l) and the respective time (t)—Vaver. = l/t; and via Lagrange’s formula [60]:
where Vwave is the speed at which the front of the wave moves down the stream that in turn is characterized by the velocity Vaver.; g stands for the gravity acceleration expressed in m·s−2; haver. is the hydraulic mean channel depth, in meters.
The main factors determining the character of the wave propagation include changes in: (i) water discharge at the hydro-electric power facility (the Kaniv HPP), (ii) the velocity and energy grade line of the flow, (iii) local hydromorphological features, as well as (iv) sedimentation characteristics of the “flow-channel” system. These features are generally presented in form of a diametrical cross-section of the channel, which shows the character of changes in the overall roughness, sloping of the water level, the grain size of bed material, and channel type, as well as the quantitative and qualitative channel capacity (i.e., old side channels, accumulation forms, which limit the impact of the HPP). This study presents a general methodology applied to calculate and investigate the movement of the water masses. To assess the wave propagation rate, a coefficient of the wave’s height transformation was used:
where h is the relative height of the wave in the cross section; h0 is the height of the wave near the origin (Kaniv HPP). Figure 2B presents the propagation of several waves and the respective changes in their height parameters.
The study also accounted for the comparison of values pertaining to stream characteristics and bottom sediment characteristics, as recommended by Lohtin [4], Makkaveev [5], and Grishanin [6]. Estimations of sediment granulometric composition was performed using the sieve method [61,62]. The obtained data allowed drawing of integral curves of individual grain size fractions to each sample. Moreover, we determined the weighted diameter of sediments for each sample:
where di is the average diameter of the particles in the i- fraction, pi –percentage of the i fraction in the sand sample. Moreover, the degree of sediment inhomogeneity (sorting) was estimated using the following formula [63]:
where d60 is the diameter corresponding to 60% of the particle-size distribution that is finer than this diameter and d10 which is the diameter corresponding to the 10% of particle-size distribution that is finer than this diameter. The coefficient of inhomogeneity shows poorly sorted sediments with n > 1. The closer this ratio gets to 1, the better the samples are sorted.
According to Shields [64], the level of sediment sorting affects the conditions under which grain movement may commence. It is assumed that the better the sediment is sorted, the lower is the energetic diversity of the flow regime in which the sediment is formed. In other words, with lower rates of sedimentation, and thus higher selective velocity of currents, the sample is better sorted. Channel stability is generally estimated using models that take into account the relationship between factors considered favorable for, and interfering with washout, as they have proven to be theoretically sound.
Channel stability is expressed by the following factors: Lohtin’s number (L) [4], Makkaveev’s (KC) stability factor [5], and the washing out indicator (Mx) by Grishanin [6]. The chosen variants of the indicators are widely used in hydrology and geomorphology to forecast the intensity of channel deformations. The indices determine ranges of values within which a channel is considered unstable, rather stable, or stable. Lohtin’s number represents the relation between the average sizes of particles Dm (in mm) composing a channel bed and the value of hydraulic gradient S (in m·km−1) [4]:
The factor of stability presented by Makkaveev [5] consists of a modified variant of Lohtin’s number. Lohtin’s index was supplemented with additional factors in order to characterize channel washout such as the mean hydraulic depth of river (H). The gradient is replaced with a dimensionless value of slope (S):
The washing out indicator (Mx) by Grishanin [6] is interpreted as a value for a quasi-uniform open-channel flow that represents the relation between the geometrical H/W and a dynamic similarity function:
where Mx—the Grishanins’ dimensionless riverbed stability coefficient; H—mean riverbed hydraulic depth in river cross -section; W—riverbed width in river cross-section; g—acceleration due to gravity, m·s−2 and Q—bank full discharge, m3·s−1.
3. Results and Discussion
3.1. Monitoring of Channel Processes (MCP)
The results of the geodetic and bathymetric measurements were used to generate the elevation model of the Dnieper river downstream of the Kaniv HPP (Figure 3). The analysis of the seven cross-sectional profiles concentrates only on the main channel of the Dnieper river. The analysis revealed that the main channel decreased in the channel cross-sectional area, as well as in its width and depth (Table 1). However, it should be mentioned that the old channel (Prokhorovsky Channel) only contributed to a limited extent to the conduction of the water masses due to silting processes in the channel reach [59,65]. Similar results were observed for the Entella River [66] and for the Po River [67]. All of the above-mentioned changes indicate a decrease in the capacity of the main channel within the study area. It also shows that the number and area of the lateral inter-island channels decreases. The results reflect the siltation of side channels, a process also observed below dams by Smith et al. [68] in the Saskatchewan River and by Słowik et al. [47] in the Drava River. In the period 2003 to 2015, a 20% decrease in the main channel cross-section area was found, which is particularly notable in the accumulative zones (hydrological cross-section no. 6 and 7—Table 1). The reduction in the channel width oscillated around 10% with an even greater decrease in depth of up to 16%. Arguably, this trend is a consequence of both natural and anthropogenic factors. The main influence involves the original hydrological regime and specific hydraulic conditions of the flow in the area, which, on the one hand, depend on the discharge regime of the Kaniv HPP and, on the other hand, are influenced by the Kremenchuk Reservoir located downstream. It is worth noting that the influence zone of the reservoir extends to the reach downstream of the Kaniv HPP dam. Nevertheless, the analysis of data collected for the study indicates a gradual reduction in the intensity of riverbed morphology changes, which is caused by the steady decrease of the river’s hydraulic gradient as well as increasing maximum depths directly downstream of the dam. Interestingly, this coincides with a decrease in the intensity of direct anthropogenic impacts, i.e., dredging works, hydropeaking HPP operations, and more intensive ship traffic. In consequence, the amount of dredging work required to clear the channel significantly decreased, which progressively led to a considerable accumulation of sediment and a decrease in the active area of the channel. A significant drop in morphometric indicators (in terms of decreasing the average hydraulic depth and maximum depths) is particularly visible at the river reach between cross-sections no. 3 and no. 5 (Figure 3B). However, there is increased activity in the bank zone.
3.2. Water Masses Propagation
The analysis of the parameters describing the waves caused by intervention water discharges from the HPP conducted in July 2015 provided data on water level fluctuation, as well as on changes in wave propagation in the downstream segment. The results of these investigations are presented in the diagrams indicating water level fluctuations in relation to water discharge observed at the HPP (Figure 2). It is worth noting that the hydrological stations are located in three specific zones: (i) potential erosion—at the Kaniv HPP, (ii) potential erosion and accumulation—at the Kaniv State Natural Reserve (KSNR), and (iii) potential accumulation—at the Sokyrna village hydrological station.
The dam’s (operational) influence on the water regime decreases along with the longitudinal profile of the river [69]. The analysis of the diagrams presented above show that the highest fluctuation of water levels can be observed in the erosion zone, where the maximum amplitude may reach 130 cm (the Kaniv HPP). In the erosion and accumulation zone, this index is slightly lower and in the KSNR, it reaches 100 cm. Water level fluctuation in the accumulation zone is considerably smaller and ranges from 12 to 15 cm at the Sokyrna village gauging station. Thus, we observe a clear regularity in downstream decrease in daily amplitudes of water level fluctuations resulting from wave propagation at the Kaniv HPP.
General results of wave propagation are presented in Table 2, illustrating a comparison between the peak and the base of the propagation wave. Every increase in water level in the channel entails a surge in water flow velocity and an increase in channel cross-section area in the trough zone below the dam. Despite a clear increase in water level, artificial waves pour on the side arms of the river and promote the flattening of the waves, already below cross-section no. 2. In a natural way, retention capacity increases (multichannel river course). Similar relationships were observed in the Vistula, below the Włocławek dam [70]. Taking this into account, on July 24 and 25, 2015, when mean water flows amounted to 2500 m3·s−1 and the channel cross-section area was at 4990 m2, the mean water velocity during these conditions amounted to 0.51 m·s−1. The computed value of the wave propagation rate (Equation (2)), for instance at a discharge of 2500 m3·s−1 in the KSNR station, amounts to kh1 = 0.93, whereas at water discharge total of 7680 m3·s−1, the value is kh2 = 0.82. When applying this coefficient to the data obtained at Sokyrna village station, we obtain a kh1 of 0.33 and a kh2 of 0.14. All the above-mentioned results indicate that the transformation of the propagation wave height is inversely proportional to the distance from the water disturbance. A comparative analysis of the results from 2003 and 2015 indicates certain changes in wave propagation. First of all, they are correlated with changes introduced to the water management regulations corresponding to the Dnieper river reservoirs. This involves a decrease in the amplitudes of water level oscillation downstream of the Kaniv HPP. The latter led to a minor general decrease in wave propagation velocity and a slight decrease in the degree of wave height transformation. This is caused by a general progressive decrease in maximum characteristic flows Qmax (Figure 1). All these factors also influence the channel processes and reveal a general reduction in process intensity.
Table 2.
Artificial wave propagation rate during peak flow and base flow of the Dnieper river below the Kaniv dam estimated for two selected reaches. Data obtained on July 24–26, 2015.
3.3. Channel Stability
The characteristics of the rivers’ hydrological regime, the hydrological structure of the stream, and the granulometric component of sediments are closely related with channel stability [8,71]. The changes result mainly from human disturbance, particularly sediment extraction, construction of dams, and channelization [72,73]. Hydraulic conditions, which are related to changes in the velocity of flow and the velocity of wave propagation caused by the Kaniv HPP operation, appear to have the highest impact within the first 10 km of the river segment downstream of the dam. The lowest velocity of the water masses in this respect is attributed to the potential accumulation zone 30–46 km below the dam. The characteristic particle size of riverbed sediments is shown in Table 3 and Figure 4A. The d50 value and mean grain diameter are considerably different and appear to be not correlated to the distance from the Kaniv HPP. Sediment sorting (n) is more heterogeneous at the reach located directly below the dam (cross-section profile no. 1), which may indicate a higher stream power within the reach. This type of relationship has also been documented in other studies, e.g., Lopez et al. [74].
Table 3.
Characteristic sediment particle size composition for the monitored cross profiles of the Dnieper river downstream of the Kaniv HPP for sediments sampled in 2015.
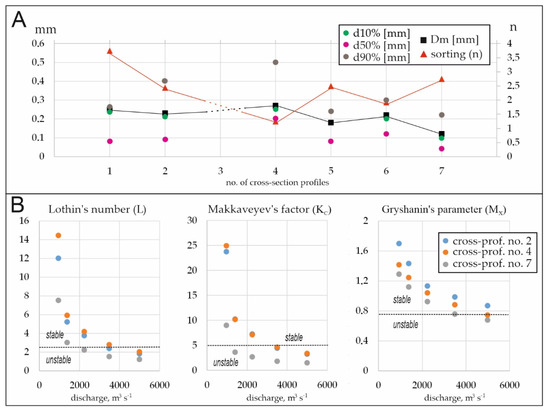
Figure 4.
Characteristic sediment particle size composition (A) and morphological indicators of stability (B) of the Dnieper channel for monitored cross-profiles.
Taking into account the above illustrated results and the derived indicators, we assessed the Dnieper channel stability. This analysis utilized indicators employed in previous studies thus, allowing us to determine and compare how the stability of the river channel changed over long time periods. The indicators were taken from the studies of Lohtin [4], Makkaveev [5], and Gryshanin [6]. The results of the calculations are presented in Table 4 and Figure 4B. The decrease in the indicator values suggests a general higher instability.
Table 4.
Morphological indicators * of the Dnieper channel stability downstream of the Kaniv HPP during different water discharge conditions and related hydraulic gradients.
Table 4 and Figure 4B show the morphological indicators and the thresholds assigned to them, revealing that during low water discharges (approx. 1000 m3·s−1), the investigated riverbed segment is not deformed and sediment accumulation appears to be undisturbed (values L, Kc and Mx). When water discharge reaches 3500 m3·s−1, the channel becomes unstable (coefficients L and Kc) and sediments are washed out (indicator Mx). According to Grishanin, the riverbed becomes stable when Mx > 0.75, while for Mx > 1.05, generally silting and sedimentation processes prevail. These criteria have been tested by other researchers, and all of them confirmed their reliability [15,17]. When water discharge is equal to or higher than average water consumption (5000 m3·s−1), the channel becomes very unstable (L and Kc) and erosion processes gain intensity (see Mx value on the cross-sections no. 2, 4, and 7: 0.867, 0.744, and 0.677, respectively). The riverbed stability indicators Kc, L, and Mx illustrate that the stability of the study section is varying and the decrease or increase of parameter values is not dependent on the distance to the dam. The reason for the negative impact mitigation is the presence of side canals and islands, generally increasing water retention. For example, during a 3500 m3·s−1 flow, the river bed on cross-sections no. 2 and no. 4 are still relatively stable (L 2.38 and 2.77; Kc 4.4 and 4.63, Mx 0.985 and 0.879), since erosion is already occurring in cross-section no. 7 (L 1.5, Kc 1.81, and Mx 0.757). The instability at cross-section no. 7 appears when the flow is higher than 2250 m³·s−1, and for profile no. 4 when flows are higher than 5000 m3·s−1. It is hard to predict how intensive erosion processes might be at flows higher than 5000 m3·s−1, e.g., during the maximum flow of July 26, 2015 (7680 m3·s−1), where water surface flow velocity at the cross-profile reached 2.5 m·s−1.
4. Conclusions
Based on the obtained results, the following conclusions can be drawn:
- Thick deposits of alluvial sediments (‘unlimited’ thickness) composing the riverbed allow for unrestricted vertical and horizontal development.
- The operations of the Kaniv HPP cause frequent changes in water levels and flows (peak-capacity regime), resulting in intervention water discharges and flow fluctuation in the range of 500–7680 m3·s−1. We observed water level fluctuation of max. 1.3 m over a distance of more than 40 km (e.g., 25 July, 2015). Despite the change in the HPP regime in 1990 from hydropeaking to run-of-river operation, large fluctuations in flows (water discharges carried out in the evening) are still observed. However, these fluctuations are reported in the daily data time series (collecting 7.00 a.m. by the Ukrainian Hydrometeorogical Center service, peak-capacity operations are conducted in the afternoon and in the evening).
- A new coefficient pertaining to the wave height transformation (kh) was developed and employed in the assessment of the wave’s propagation rate.
- The velocity of artificial wave propagation at the study river section may reach up to 74.4 km·h−1 (20 m·s−1) near Kaniv town. The wave reaches Sokyrna village (a distance of approx. 45 km) within 65 min at a velocity of 37.4 km·h−1.
- The Dnieper river has a large number of islands, and numerous lateral and inactive channels that represent good conditions for the propagation of artificial waves (lower value kh coefficient), as compared to river sections with a single channel (higher value kh coefficient).
- There is a tendency towards the reduction in bottom sediment grain size with distance from the dam. Samples collected in 2003 indicate that the overall fractional composition of sediments have changed, and their inhomogeneity has increased. This is a direct result of the reduction in maximum annual flows and the channels’ tendency to adapt to the new conditions.
- The channel morphology stability indicators used in this work, including Lohtin’s number (L), Makkaveev’s (Kc) factor of stability, and the washing out indicator (Mx) by Grishanin allowed to identify dependencies in channel stability below the Kaniv HPP. During low water discharges (approx. 1000 m3·s−1), the investigated riverbed segment does not deformed and sediment accumulation appears to be unobstructed (values L, Kc, and Mx). When water discharge increases (e.g., during typical peak-capacity operation 2250–3500 m3·s−1, sometimes up to 6000–7600 m3·s−1), the channel becomes unstable and sediments are subject to erosion processes. The riverbed stability indicators Kc, L, and Mx indicate that the stability of the study section varies and the decrease or increase in parameter values is not dependent on the distance to the dam. For example, cross-sections closer to the dam can still be relatively stable during high flow, when erosion occurs in distant cross-sections. The indices employed in this work are commonly used in hydrological and geomorphological studies, particularly in post-USSR countries, and allow for a prognosis of the intensity of channel deformation.
- The nature of channel deformations within the study reach is a consequence of the intervention regime of the HPP operations and of additional phenomena triggered by the subsequent reservoir located downstream. Furthermore, due to cascade flow regulations, the study river reach shows reverse (directed) channel deformations, such as the formation of the so-called inner deltas, in the backwaters of the further downstream reservoir. At the same time, the unsteady conditions of the HPP provoke a complex discontinuous channel regime that results in changes compared to a natural hydrological regime.
- A thorough analysis of the aspects presented above provides information about current tendencies in the dynamics of the river processes in the investigated section of the Dnieper River. The analysis helps to understand channel deformation dynamics and their triggering elements induced by significant anthropogenic modifications. Moreover, the study yields valuable information to assess and predict further deformations and their evolution. Our research may contribute to the development of new water management guidelines for the Dnieper cascade and help to increase the economic and ecological efficiency of HPP.
Author Contributions
Conceptualization, M.H.; funding acquisition, M.H.; investigation, O.O., M.H., D.S., Z.R., and M.M.; methodology, O.O., M.H., and Z.R.; project administration, M.H.; supervision, M.M. and Z.B.; validation, D.S., M.H., and M.M.; visualization, M.H. and D.S.; writing—original draft, M.H., Z.R., and D.S.; writing—review & editing, M.H., D.S., and M.M. All authors have read and agreed to the published version of the manuscript.
Funding
This research was funded by the FLUMEN project as part of the 7th Framework Programme ‘Fluvial Processes and Sediment Dynamics of Slope Channel Systems: Impacts of Socio-economic and Climate Change on River System Characteristics and Related Services’ (Proposal No.: 318969).
Conflicts of Interest
The authors declare no conflict of interest.
References
- Montgomery, D.R.; Buffington, J.M. Channel-reach morphology in mountain drainage basins. Geol. Soc. Am. Bull. 1997, 109, 596–611. [Google Scholar] [CrossRef]
- Church, M. Channel Stability: Morphodynamics and the Morphology of Rivers. In Rivers—Physical, Fluvial and Environmental Processes; GeoPlanet: Earth and Planetary Sciences; Rowiński, P., Radecki-Pawlik, A., Eds.; Springer: Cham, Switzerland, 2015. [Google Scholar]
- Knighton, D. Fluvial Forms and Processes: A New Perspective; Taylor & Francis: New York, NY, USA, 1998; p. 377. [Google Scholar]
- Lokhtin, V.M. O mehanizmah rechnogo rusla (River channel processes), Ministry of Internal Waterways, Sankt-Peterburg, USSR. 1948, pp. 15–16. Available online: https://scholar.google.com/scholar_lookup?title=River%20Channel%20Processes&publication_year=1897&author=V.M.%20Lokhtin (accessed on 11 April 2020).
- Makkaveev, N.I. Ruslo reki i eroziya v ee basseine (The River Channel and Erosion in its Basin), Izd-vo AN SSSR; Moscow, USSR. 1955, pp. 138–145. Available online: http://makkaveev-lab.narod.ru/Makk55.htm (accessed on 11 April 2020).
- Grishanin, K.V. Ustoychivost’ rusel rek i kanalov (Stability of channels in rivers and canals); Hydrometeoizdat: Leningrad, Russia, 1974; p. 144. Available online: https://b-ok.cc/book/5232236/1b12e1 (accessed on 11 April 2020).
- Schumm, S.A. Effect of Sediment Characteristics on Erosion and Deposition in Ephemeral-Stream Channels; Professional Paper; U.S. Government Printing Office: Washington, DC, USA, 1961. [CrossRef]
- Lane, E.W. The importance of fluvial morphology in hydraulic engineering. Proc. Am. Soc. Civ. Eng. 1955, 81, 745. [Google Scholar]
- Dust, D.; Wohl, E. Conceptual model for complex river responses using an expanded Lane’s relation. Geomorphology 2011, 139–140, 109–121. [Google Scholar] [CrossRef]
- Rosgen, D.L. Applied River Morphology; Wildland Hydrology: Pagoda Springs, CO, USA, 1996; p. 7. [Google Scholar]
- Schumm, S.A. Geomorphic thresholds: The concept and its applications. Trans. Inst. Br. Geogr. 1979, 4, 485–515. [Google Scholar] [CrossRef]
- Leopold, L.B.; Wolman, M.G.; Miller, J.P. Fluvial Processes in Geomorphology; WH Freeman and Company: San Francisco, CA, USA, 1964. [Google Scholar]
- Rosgen, D.L. A Stream Channel Stability Assessment Methodology. A Practical Method of Computing Streambank Erosion Rate. In Proceedings of the 7th Federal Interagency Sedimentation Conference, Reno, NV, USA, 25–29 March 2001. [Google Scholar]
- Sukhodolov, A.N.; Nikora, V.I.; Katolikov, V.M. Flow dynamics in alluvial channels: The legacy of Kirill V. Grishanin. J. Hydraul. Res. 2011, 49, 285–292. [Google Scholar] [CrossRef]
- Nikora, N.F.; Nikora, V.I. Self-regulation effects in open-channel flows: Application to vegetated channels. In Proceedings of the 33rd IAHR Congress, Vancouver, BC, Canada, 9–14 August 2009. [Google Scholar]
- Kaganov, Y.I. Hydrologic and morphometric model of a mountain river. Hydrotech. Constr. 1994, 28, 45–48. [Google Scholar] [CrossRef][Green Version]
- Vaikasas, S.; Ždankus, N. Analysis of Lithuanian river channels bed stability (Referring to Grishanin Number). Water Manag. Eng. 2005, 2, 107–112. [Google Scholar]
- Paige, A.D.; Hickin, E.J. Annual bed-elevation regime in the alluvial channel of Squamish River, Southwestern British Columbia, Canada. Earth Surf. Process. Landf. 2000, 25, 991–1009. [Google Scholar] [CrossRef]
- Babiński, Z. Fluvial Processes of Lower Fragment of the Vistula River; IGiPZ PAN Warszawa: Warszawa, Poland, 1992; p. 237 , in Polish.
- Brandt, S.A. Classification of geomorphological effects downstream of dams. Catena 2000, 40, 375–401. [Google Scholar] [CrossRef]
- Gierszewski, P.; Habel, M.; Szmańda, J.; Luc, M. Evaluating effects of dam operation on flow regimes and riverbed adaptation to those changes. Sci. Total Environ. 2020, 136202. [Google Scholar] [CrossRef]
- Szatten, D.; Habel, M.; Pellegrini, L.; Maerker, M. Assessment of Siltation Processes of the Koronowski Reservoir in the Northern Polish Lowland Based on Bathymetry and Empirical Formulas. Water 2018, 10, 1681. [Google Scholar] [CrossRef]
- Williams, G.P.; Wolman, M.G. Downstream Effects of Dams on Alluvial Rivers; United States Geological Survey Professional Paper 1286; US Government Printing Office: Washington, DC, USA, 1984. [Google Scholar]
- Richter, B.D.; Baumgartner, J.V.; Powell, J.; Braun, D.P. A method for assessing hydrologic alteration within ecosystems. Conserv. Biol. 1996, 10, 1163–1174. [Google Scholar] [CrossRef]
- Vörösmarty, C.J.; Sharma, K.P.; Fekete, B.M.; Copeland, A.H.; Holden, J.; Marble, J.; Lough, J.A. The storage and aging of continental runoff in large reservoir systems of the world. Ambio 1997, 26, 210–219. [Google Scholar]
- Pegg, M.A.; Pierce, C.L.; Roy, A. Hydrological alteration along the Missouri River Basin: A time series approach. Aquat. Sci. 2003, 65, 63–72. [Google Scholar] [CrossRef]
- Nilsson, C.; Berggren, K. Alterations of Riparian Ecosystems Caused by River Regulation: Dam operations have caused global-scale ecological changes in riparian ecosystems. How to protect river environments and human needs of rivers remains one of the most important questions of our time. BioScience 2000, 50, 783–792. [Google Scholar] [CrossRef]
- Suen, J.P. Determining the ecological flow regime for existing reservoir operation. Water Resour. Manag. 2011, 25, 817–835. [Google Scholar] [CrossRef]
- Gao, B.; Yang, D.; Zhao, T.; Yang, H. Changes in the eco-flow metrics of the upper Yangtze River from 1961 to 2008. J. Hydrol. 2012, 448–449, 30–38. [Google Scholar] [CrossRef]
- Eng, K.; Wolock, D.M.; Carlisle, D.M. River flow changes related to land and water management practices across the conterminous United States. Sci. Total Environ. 2013, 463, 414–422. [Google Scholar] [CrossRef]
- Fantin-Cruza, I.; Pedrollob, O.; Girardc, P.; Zeilhoferd, P.; Hamiltone, S.K. Effects of a diversion hydropower facility on the hydrological regime of the Correntes River, a tributary to the Pantanal floodplain, Brazil. J. Hydrol. 2015, 531, 810–820. [Google Scholar] [CrossRef]
- Zhang, Q.; Gu, X.; Singh, V.P.; Xu, C.Y.; Kong, D.; Xiao, M.; Chen, X. Homogenization of precipitation and flow regimes across China: Changing properties, causes and implications. J. Hydrol. 2015, 530, 462–475. [Google Scholar] [CrossRef]
- Obodovskyi, O.G. Ruslovi protsesy (Riverbed processes); Taras Shevchenko National University of Kiev: Kiev, Ukraine, 2017; p. 495. Available online: http://www.library.univ.kiev.ua/ukr/elcat/new/detail.php3?doc_id=1852053 (accessed on 11 April 2020).
- Habel, M. Effects of flow regulation and river channelization on sandbar bird nesting availability at the Lower Vistula River. Ecol. Quest. 2018, 29, 1–18. [Google Scholar] [CrossRef]
- Mailhot, A.; Talbot, G.; Ricard, S.; Turcotte, R.; Guinard, K. Assessing the potential impacts of dam operation on daily flow at ungauged river reaches. J. Hydrol. 2018, 18, 156–167. [Google Scholar] [CrossRef]
- Hecht, J.S.; Lacombe, G.; Arias, M.E.; Dang, T.C.; Piman, T. Hydropower dams of the Mekong River basin: A review of their hydrological impacts. J. Hydrol. 2019, 568, 285–300. [Google Scholar] [CrossRef]
- Andrews, E.D. Downstream effects of Flaming Gorge Reservoir on the Green River, Colorado and Utah. GSA Bull. 1986, 97, 1012–1023. [Google Scholar] [CrossRef]
- Kondolf, M. Hungry water: Effects of dams and gravel mining on river channel. Environ. Manag. 1997, 21, 4. [Google Scholar] [CrossRef] [PubMed]
- Grams, P.E.; Schmidt, J.C.; Topping, D.J. The rate and pattern of bed incision and bank adjustment on the Colorado River in Glen Canyon downstream from Glen Canyon Dam, 1956–2000. GSA Bull. 2007, 119, 556–575. [Google Scholar] [CrossRef]
- Schmidt, J.C.; Wilcock, P.R. Metrics for assessing the downstream effects of dams. Water Resour. Res. 2008, 44, W04404. [Google Scholar] [CrossRef]
- Draut, A.E.; Logan, J.B.; Mastin, M.C. Channel evolution on the dammed Elwha River. Washington, USA. Geomorphology 2011, 127, 71–87. [Google Scholar] [CrossRef]
- Babiński, Z.; Habel, M. Impact of a single dam on sediment transport continuity in large lowland rivers, Terheiden. In River Sedimentation; Wieprecht, S., Haun, S., Weber, K., Noack, M., Terheiden, K., Eds.; Taylor & Francis Group: London, UK, 2017. [Google Scholar]
- Guo, C.; Jin, Z.; Guo, L.; Lu, J.; Ren, S.; Zhou, Y. On the cumulative dam impact in the upper Changjiang River: Streamflow and sediment load changes. Catena 2020, 184, 104250. [Google Scholar] [CrossRef]
- Babiński, Z.; Habel, M.; Chalov, S.R. Prediction of the Vistula Channel development between Wloclawek and Toruń: Evaluation with regard to the new geological survey. Quaest. Geogr. 2014, 33, 5–15. [Google Scholar] [CrossRef][Green Version]
- Szatten, D.; Babiński, Z.; Habel, M. Reducing of Water Turbidity by Hydrotechnical Structures on the Example of the Wloclawek Reservoir. J. Ecol. Eng. 2018, 19, 197–205. [Google Scholar] [CrossRef]
- Wang, Y.; Rhoads, B.L.; Wang, D.; Wu, J.; Zhang, X. Impacts of large dams on the complexity of suspended sediment dynamics in the Yangtze River. J. Hydrol. 2018, 558, 184–195. [Google Scholar] [CrossRef]
- Słowik, M.; Dezső, J.; Marciniak, A.; Tóth, G.; Kovács, J. Evolution of river planforms downstream of dams: Effect of dam construction or earlier human-induced changes? Earth Surf. Process. Landf. 2018, 43, 2045–2063. [Google Scholar] [CrossRef]
- Starodubtsev, V.; Fedorenko, O. Evaluation of the Effect of Dnipro River Reservoirs on Coastal Landscapes. In Equidosimetry—Ecological Standardization and Equidosimetry for Radioecology and Environmental Ecology; NATO Security through Science Series (Series C: Environmental Security); Bréchignac, F., Desmet, G., Eds.; Springer: Dordrecht, The Netherlands, 2005. [Google Scholar]
- Obodovskyi, O.G. Deyaki aspekty doslidzhen ruslovykh protsesiv u nyzhnikh byefakh (na prykladi Dniprovsʹkykh hidrovuzliv) (Some aspects of studies of channel processes below dams, for example Dnieper hydroelectric power plants). Hidrolohiya hidrokhimiya i hidro ekolohiya 2002, 4, 106–111. [Google Scholar]
- Osadchyy, V.; Nabyvanets, I.; Linnik, P.; Osadcha, N.; Nabyvanets, Y. Processes Determining Surface Water Chemistry; Springer Book: Cham, Switzerland, 2016; p. 291. [Google Scholar]
- Shevchuk, V.Y.; Bilyavsky, G.O.; Navrotsky, V.M.; Mazurkevich, O.O. Preserving the Dnipro River: Harmony, History, and Rehabilitation; Mosaic Press/IDRC: Ottawa, Canada, 2005; ISBN 1-55250-138-9. [Google Scholar]
- Grubrin, Y.L.; Palienko, E.T. Recent Geomorphological Processes of the Middle Dnieper Area; Ukrainian Academy of Science: Kiev, Ukraine, 1976. [Google Scholar]
- Dubnyak, S.; Timchenko, V. Ecological role of hydrodynamic processes in the Dnieper reservoirs. Ecol. Eng. 2000, 16, 181–188. [Google Scholar] [CrossRef]
- Timchenko, V.M. Water exchange processes as an energy flux forming factor in the Dnieper reservoir ecosystem (Vodoobmennye protsessy kak factor formirovaniya potokov energii v ekosistemakh dneprovskikh vodokhranilisch). J. Hydrobiol. 2010, 46, 105–120. [Google Scholar] [CrossRef]
- Ukrainian Hydrometeorological Center—Information Server On-line. Available online: https://meteo.gov.ua/en/33345/services/ (accessed on 20 June 2019).
- Milliman, J.D.; Meade, R.H. World-wide delivery of river sediment to the oceans. J. Geol. 1983, 91, 1–21. [Google Scholar] [CrossRef]
- Gozhik, P.; Komar, M.; Łanczont, M.; Fedorowicz, S.; Bogucki, A.; Mroczek, P.; Prylypko, S.; Kusiak, J. Paleoenvironmental history of the Middle Dnieper Area from the Dnieper to Weichselian Glaciation: A case study of the Maksymivka loess profile. Quat. Int. 2014, 334–335, 94–111. [Google Scholar] [CrossRef]
- Bondarchuk, V.G. Geomorfolohiya URSR (Geomorphology of the Ukrainian Soviet Socialist Republic); Taras Shevchenko National University of Kiev: Kiev, Ukraine, 1949; pp. 13–15. Available online: http://www.geokniga.org/bookfiles/geokniga-bondarchukvggeomorfologiyaursrgeologichniyrozvitokrel.pdf (accessed on 11 April 2020).
- Obodovskyi, O.G.; Grebin, V.V.; Onischuk, V.V.; Pogorilchuk, N.M.; Rozlach, Z.V. Monitorynh ruslovykh protsesiv u nyzhnomu byefi Kanivskoyi HES (Monitoring of river bed processes below the hydroelectric power station). Hidrolohiya hidrokhimiya i hidro ekolohiya 2004, 5, 47–60. [Google Scholar]
- Lagrange, J.L. Mécanique analytique, nouvelle édition (Analytical mechanics, new edition); Courcier: Paris, France, 1811; p. 134. Available online: https://books.google.pl/books?hl=pl&lr=&id=gmY_AAAAcAAJ&oi=fnd&pg=PR18&dq=Lagrange,+J.L.+M%C3%A9canique+analytique,+nouvelle+%C3%A9dition&ots=pel7kbLXaz&sig=THnRz0ra2QpOOVpt_97huMx0rSc&redir_esc=y#v=onepage&q&f=false (accessed on 11 April 2020).
- Krumbein, W.C. Size Frequency Distribution of Sediments. J. Sediment. Petrol. 1934, 4, 65–77. [Google Scholar] [CrossRef]
- Folk, R.L.; Ward, W.C. Brazos River Bar A Study of Significante of Grain Size Parameters. J. Sedimentol. Petrol. 1957, 27, 3–26. [Google Scholar] [CrossRef]
- Hazen, A. The Filtration of Public Water-Supplies; Wiley and Sons: New York, NY, USA, 1895. [Google Scholar]
- Shields, A. Anwendung der Aehnlichkeits mechanik und der Turbulenz forschung auf die Geschiebebewegung (Application of Similarity Mechanics and Turbulence Research on Shear Flow); Mitteilungen der Preußischen Versuchsanstalt für Wasserbau. 26; Preußische Versuchsanstalt für Wasserbau: Berlin, Germany, 1936. [Google Scholar]
- Obodovskyi, O.G.; Grebin, V.V. Osoblyvosti hidrolohichnoho rezhymu i ruslovykh protsesiv u nyzhnʹomu byefi Kanivs’koyi HES (Peculiarities of hydrological regime and channel processes in the lower channel of the Kaniv HPP). Hidrolohiya hidrokhimiya i hidro ekolohiya 1998, 44, 40–45. [Google Scholar]
- Roccati, A.; Faccini, F.; Luino, F.; De Graff, J.; Torconi, L. Morphological changes and human impact in the Entella River floodplain (Northern Italy) from the 17th century. Catena 2019, 182. [Google Scholar] [CrossRef]
- Pellegrini, L.; Maraga, F.; Turitto, O.; Audisio, C.; Duci, G. Evoluzione morfologica di alvei fluviali mobili nel settore occidentale del bacino padano. Il Quat. 2008, 21, 251–266. [Google Scholar]
- Smith, N.D.; Morozovab, G.S.; Pérez-Arluceac, M.; Giblingd, M.R. Dam-induced and natural channel changes in the Saskatchewan River below the E.B. Campbell Dam, Canada. Geomorphology 2016, 269, 186–202. [Google Scholar] [CrossRef]
- Phillips, J.D. Geomorphic responses to changes in instream flows: The flow-channel fitness model. River Res. Appl. 2013, 29, 1175–1194. [Google Scholar] [CrossRef]
- Habel, M. Dynamics of the Vistula River Channel Deformations Downstream of Włocławek eeservoir; Kazimierz Wielki University Press: Bydgoszcz, Poland, 2013; p. 138. [Google Scholar]
- Schuman, S.A. The Fluvial System; John Willey and Sons: New York, NY, USA, 1977; p. 338. [Google Scholar]
- Surian, N.; Rinaldi, M. Morphological response to river engineering and management in alluvial channels in Italy. Geomorphology 2003, 50, 307–326. [Google Scholar] [CrossRef]
- Kuo, C.W.; Chen, C.F.; Chen, S.C.; Yang, T.C.; Chen, C.W. Channel Planform Dynamics Monitoring and Channel Stability Assessment in Two Sediment-Rich Rivers in Taiwan. Water 2017, 9, 84. [Google Scholar] [CrossRef]
- López, P.; López-Tarazón, J.; Casas-Ruize, J.P.; Pompeo, M.; Ordoñeza, J.; Muñoza, I. Sediment size distribution and composition in a reservoir affected by severe water level fluctuations. Sci. Total Environ. 2016, 540, 158–167. [Google Scholar] [CrossRef]
© 2020 by the authors. Licensee MDPI, Basel, Switzerland. This article is an open access article distributed under the terms and conditions of the Creative Commons Attribution (CC BY) license (http://creativecommons.org/licenses/by/4.0/).