The Downscaling Study for Typhoon-Induced Coastal Inundation


Abstract
1. Introduction
2. Methodologies
2.1. Prediction and Analysis System
2.2. A Case Study: Typhoon ‘CHABA’ (1618)
2.3. Numerical Model Description
3. Results and Discussion
4. Conclusions and Future Works
Author Contributions
Funding
Conflicts of Interest
References
- Sun, Y.; Chen, C.; Beardsley, R.C.; Xu, Q. Impact of current-wave interaction on storm surge simulation: A case study for Hurricane Bob. J. Geophys. Res. Ocean. 2013, 118, 2685–2701. [Google Scholar] [CrossRef]
- Beardsley, R.C.; Chen, C.; Xu, Q. Coastal flooding in Scituate (MA): A FVCOM study of the 27 December 2010 nor’easter. J. Geophys. Res. Ocean. 2013, 118, 6030–6045. [Google Scholar] [CrossRef]
- Yoon, J.J.; Shim, J.S. Estimation of storm surge inundation and hazard mapping for the southern coast of Korea. In Proceedings of the 12th International Coastal Symposium, Plymouth, England, 1 January 2013. [Google Scholar] [CrossRef]
- Nakamura, R.; Shibayama, T.; Esteban, M. Future typhoon and storm surges under different global warming scenarios: Case study of typhoon Haiyan. Nat. Hazards 2016, 82, 1645–1681. [Google Scholar] [CrossRef]
- Mao, M.; Xia, M. Dynamics of wave–current–surge interactions in Lake Michigan: A model comparison. Ocean Model. 2017, 110, 1–20. [Google Scholar] [CrossRef]
- Wolf, J. Coastal flooding: Impacts of coupled wave-surge-tide models. Nat. Hazards 2009, 49, 241–260. [Google Scholar] [CrossRef]
- Booij, N.; Holthuijsen, L.H.; Ris, R.C. The SWAN wave model for shallow water. In Proceedings of the 25th International Conference on Coastal Engineering, Orlando, FL, USA, 2–6 September 1996; pp. 668–676. [Google Scholar] [CrossRef]
- Yuk, J.-H.; Park, J.; Joh, M. Modelling of storm-induced seawater flooding in the Suyeong River area, South Korea: A case study due to the storm surge and waves during Typhoon Sanba. J. Coast. Res. 2018, 85, 746–750. [Google Scholar] [CrossRef]
- Ku, H.; Maeng, J.; Lee, H. Estimation of coastal inundation area by typhoon-induced surges. In Proceedings of the 2018 OCEANS-MTS/IEEE Kobe Techno-Oceans, Kobe, Japan, 28–31 May 2018; p. 8559192. [Google Scholar] [CrossRef]
- Climate Change: Global Sea Level. Available online: https://www.climate.gov/news-features/understanding-climate/climate-change-global-sea-level (accessed on 23 March 2020).
- Song, D.; Guo, L.; Duan, Z.; Xiang, L. Impact of major typhoons in 2016 on sea surface features in the Northwestern Pacific. Water 2018, 10, 1326. [Google Scholar] [CrossRef]
- Wang, Y.H.; Lee, I.H.; Wang, D.P. Typhoon induced extreme coastal surge: A case study at Northeast Taiwan in 1994. J. Coast. Res. 2005, 213, 548–552. [Google Scholar] [CrossRef]
- Hallermeier, R.J.; Rhodes, P.E. Generic Treatment of Dune Erosion for 100-Year Event. In Proceedings of the 21st International Conference on Coastal Engineering, Costa del Sol-Malaga, Spain, 20–25 June 1988; ASCE: Costa del Sol-Malaga, Spain, 1988. [Google Scholar] [CrossRef]
- Vasseur, B.; Hequette, A. Storm surges and erosion of coastal dunes between 1957 and 1988 near Dunkerque (France), southwestern North Sea. Geol. Soc. 2000, 175, 99–107. [Google Scholar] [CrossRef]
- Morton, R.; Factors, A. Controlling storm impacts on coastal barriers and beaches: A preliminary basis for near real-time forecasting. J. Coast. Res. 2002, 18, 486–501. [Google Scholar]
- Gencarelli, R.; Tomasicchio, G.R.; Kobayashi, N.; Johnson, B.D. Beach profile evolution and dune erosion due to the impact of Hurricane Isabel. Coast. Eng. 2008, 1697–1709. [Google Scholar] [CrossRef]
- O’Shea, M.; Murphy, J. Predicting and monitoring the evolution of a coastal barrier dune system postbreaching. J. Coast. Res. 2013, 29, 38–50. [Google Scholar] [CrossRef]
- Hatzikyriakou, A.; Lin, N. Simulating storm surge waves for structural vulnerability estimation and flood hazard mapping. Nat. Hazards 2017, 89, 939–962. [Google Scholar] [CrossRef]
- Schambach, L.; Grilli, A.R.; Grilli, S.T.; Hashemi, M.R.; King, J.W. Assessing the impact of extreme storms on barrier beaches along the Atlantic coastline: Application to the southern Rhode Island coast. Coast. Eng. 2018, 133, 26–42. [Google Scholar] [CrossRef]
- National Assessment of Hurricane-Induced Coastal Erosion Hazards: Gulf of Mexico. Available online: https://olga.er.usgs.gov/data/NACCH/GOM_erosion_hazards_metadata.html (accessed on 27 February 2020).
- Pries, A.J. Hurricane Impacts on Coastal Dunes and Spatial Distribution of Santa Rosa Beach Mice (Peromyscus Polionotus Leucocephalus) in Dune Habitats; Master’s Thesis, University of Florida, Gainesville, FL, USA, May 2006. [Google Scholar]
- Gaeta, M.G.; Bonaldo, D.; Samaras, A.G.; Carniel, S.; Archetti, R. Coupled wave-2D hydrodynamics modeling at the Reno river mouth (Italy) under climate change scenarios. Water 2018, 10, 1380. [Google Scholar] [CrossRef]
- Postacchini, M.; Lalli, F.; Memmola, F.; Bruschi, A.; Bellafiore, D.; Lisi, I.; Zitti, G.; Brocchini, M. A model chain approach for coastal inundation: Application to the bay of Alghero. Estuar. Coast. Shelf Sci. 2019, 219, 56–70. [Google Scholar] [CrossRef]
- Aoki, K.; Isobe, A. Application of finite volume coastal ocean model to hindcasting the wind-induced sea-level variation in Fukuoka bay. J. Oceanogr. 2007, 63, 333–339. [Google Scholar] [CrossRef]
- Chen, C.; Qi, J.; Li, C.; Beardsley, R.C.; Lin, H.; Walker, R.; Gates, K. Complexity of the flooding/drying process in an estuarine tidal creek salt-marsh system: An application of FVCOM. J. Geophys. Res. 2008, 113, C07052. [Google Scholar] [CrossRef]
- Weisberg, R.H.; Zheng, L. Hurricane storm surge simulations comparing three-dimensional with two-dimensional formulations based on an Ivan-like storm over the Tampa Bay, Florida region. J. Geophys. Res. 2008, 113, C12001. [Google Scholar] [CrossRef]
- Westerink, J.J.; Luettich, R.A.; Feyen, J.C.; Atkinson, J.H.; Dawson, C.; Roberts, H.J.; Powell, M.D.; Dunion, J.P.; Kubatko, E.J.; Pourtaheri, H. A basin-to channel-scale unstructured grid hurricane storm surge model applied to Southern Louisiana. Mon. Weather Rev. 2008, 136, 833–864. [Google Scholar] [CrossRef]
- Qi, J.; Chen, C.; Beardsley, R.C.; Perrie, W.; Cowles, G.W.; Lai, Z. An unstructured-grid finite-volume surface wave model (FVCOM-SWAVE): Implementation, validations and applications. Ocean Model. 2009, 28, 153–166. [Google Scholar] [CrossRef]
- Dukhovskoy, D.S.; Morey, S.L. Simulation of the hurricane dennis storm surge and considerations for vertical resolution. Nat. Hazards 2011, 58, 511–540. [Google Scholar] [CrossRef]
- Feng, X.; Yin, B.; Yang, D. Development of an unstructured-grid wave-current coupled model and its application. Ocean Model. 2016, 104, 213–225. [Google Scholar] [CrossRef]
- Qi, J.; Chen, C.; Beardsley, R.C. FVCOM one-way and two-way nesting using ESMF: Development and validation. Ocean Model. 2018, 124, 94–110. [Google Scholar] [CrossRef]
- Hasselmann, K.; Barnett, T.P.; Bouws, E.; Carlson, H.; Cartwright, D.E.; Enke, K.; Ewing, J.A.; Gienapp, H.; Hasselmann, D.E.; Kruseman, P.; et al. Measurements of Wind-wave Growth and Swell Decay During the Joint North Sea Wave Project (JONSWAP); Deutches Hydrographisches Institute: Hamburg, Germany, 1973; Available online: http://resolver.tudelft.nl/uuid:f204e188-13b9-49d8-a6dc-4fb7c20562fc (accessed on 20 March 2020).
- Gill, A.E. Atmosphere-ocean Dynamics; Academic Press Inc.: New York, NY, USA, 1982; Volume 30. [Google Scholar]
- Zidan, A.R.; Rageh, O.S.; Sarhan, T.E.; Esmail, M. Effect of breakwaters on wave energy dissipation (Case study: Ras El-bar Beach, Egypt). Int. Water Technol. J. 2012, 2, 268–283. [Google Scholar]
- Ferreira, C.M.; Irish, J.L.; Olivera, F. Uncertainty in Hurricane Surge Simulation due to Land Cover Specification. J. Geophys. Res. Ocean. 2014, 119, 1812–1827. [Google Scholar] [CrossRef]
- Wamsley, T.; Cialone, M.; Smith, J.M.; Ebersole, B.A.; Grzegorzewski, A.S. The potential of wetlands in reducing storm surge. Ocean Eng. 2010, 37, 59–68. [Google Scholar] [CrossRef]
- Kodaira, T.; Thompson, K.R.; Bernier, N.B. The Effect of Density Stratification on the Prediction of Global Storm Surge. Ocean Dyn. 2016, 66, 1733–1743. [Google Scholar] [CrossRef]


| Items | AD1 | AD2 | |
|---|---|---|---|
| Model | WRF 3.7.1 | ||
| Initial and boundary | NCEP/FNL (0.25-degree) | ||
| Horizontal resolution | 9 km | 3 km | |
| Vertical level | 41 | 41 | |
| Numerical grid | 600 × 600 | 1099 × 1321 | |
| Physical specs. | Microphysics | WDM6 | |
| Cumulus | Kain-Fritsch | - | |
| PBL | YSU PBL | ||
| Radiation | RRTMG(LW) | RRTMG(SW) | |
| Land surface | NOAH LSM | ||
| ● AD (Atmosphere Domain) | |||
| Items | OD1-S (Surge Modeling) |
|---|---|
| Model | FVCOM 3.2.1 |
| Atmospheric condition | AD2 of WRF modeling (3 km) |
| Open boundary | Tidal Model Driver (TMD) |
| Dimension | 2D |
| Number of cells | 602,807 |
| Horizontal mixing | Smagorinsky’s parameterization |
| ● OD (Ocean Domain) | |
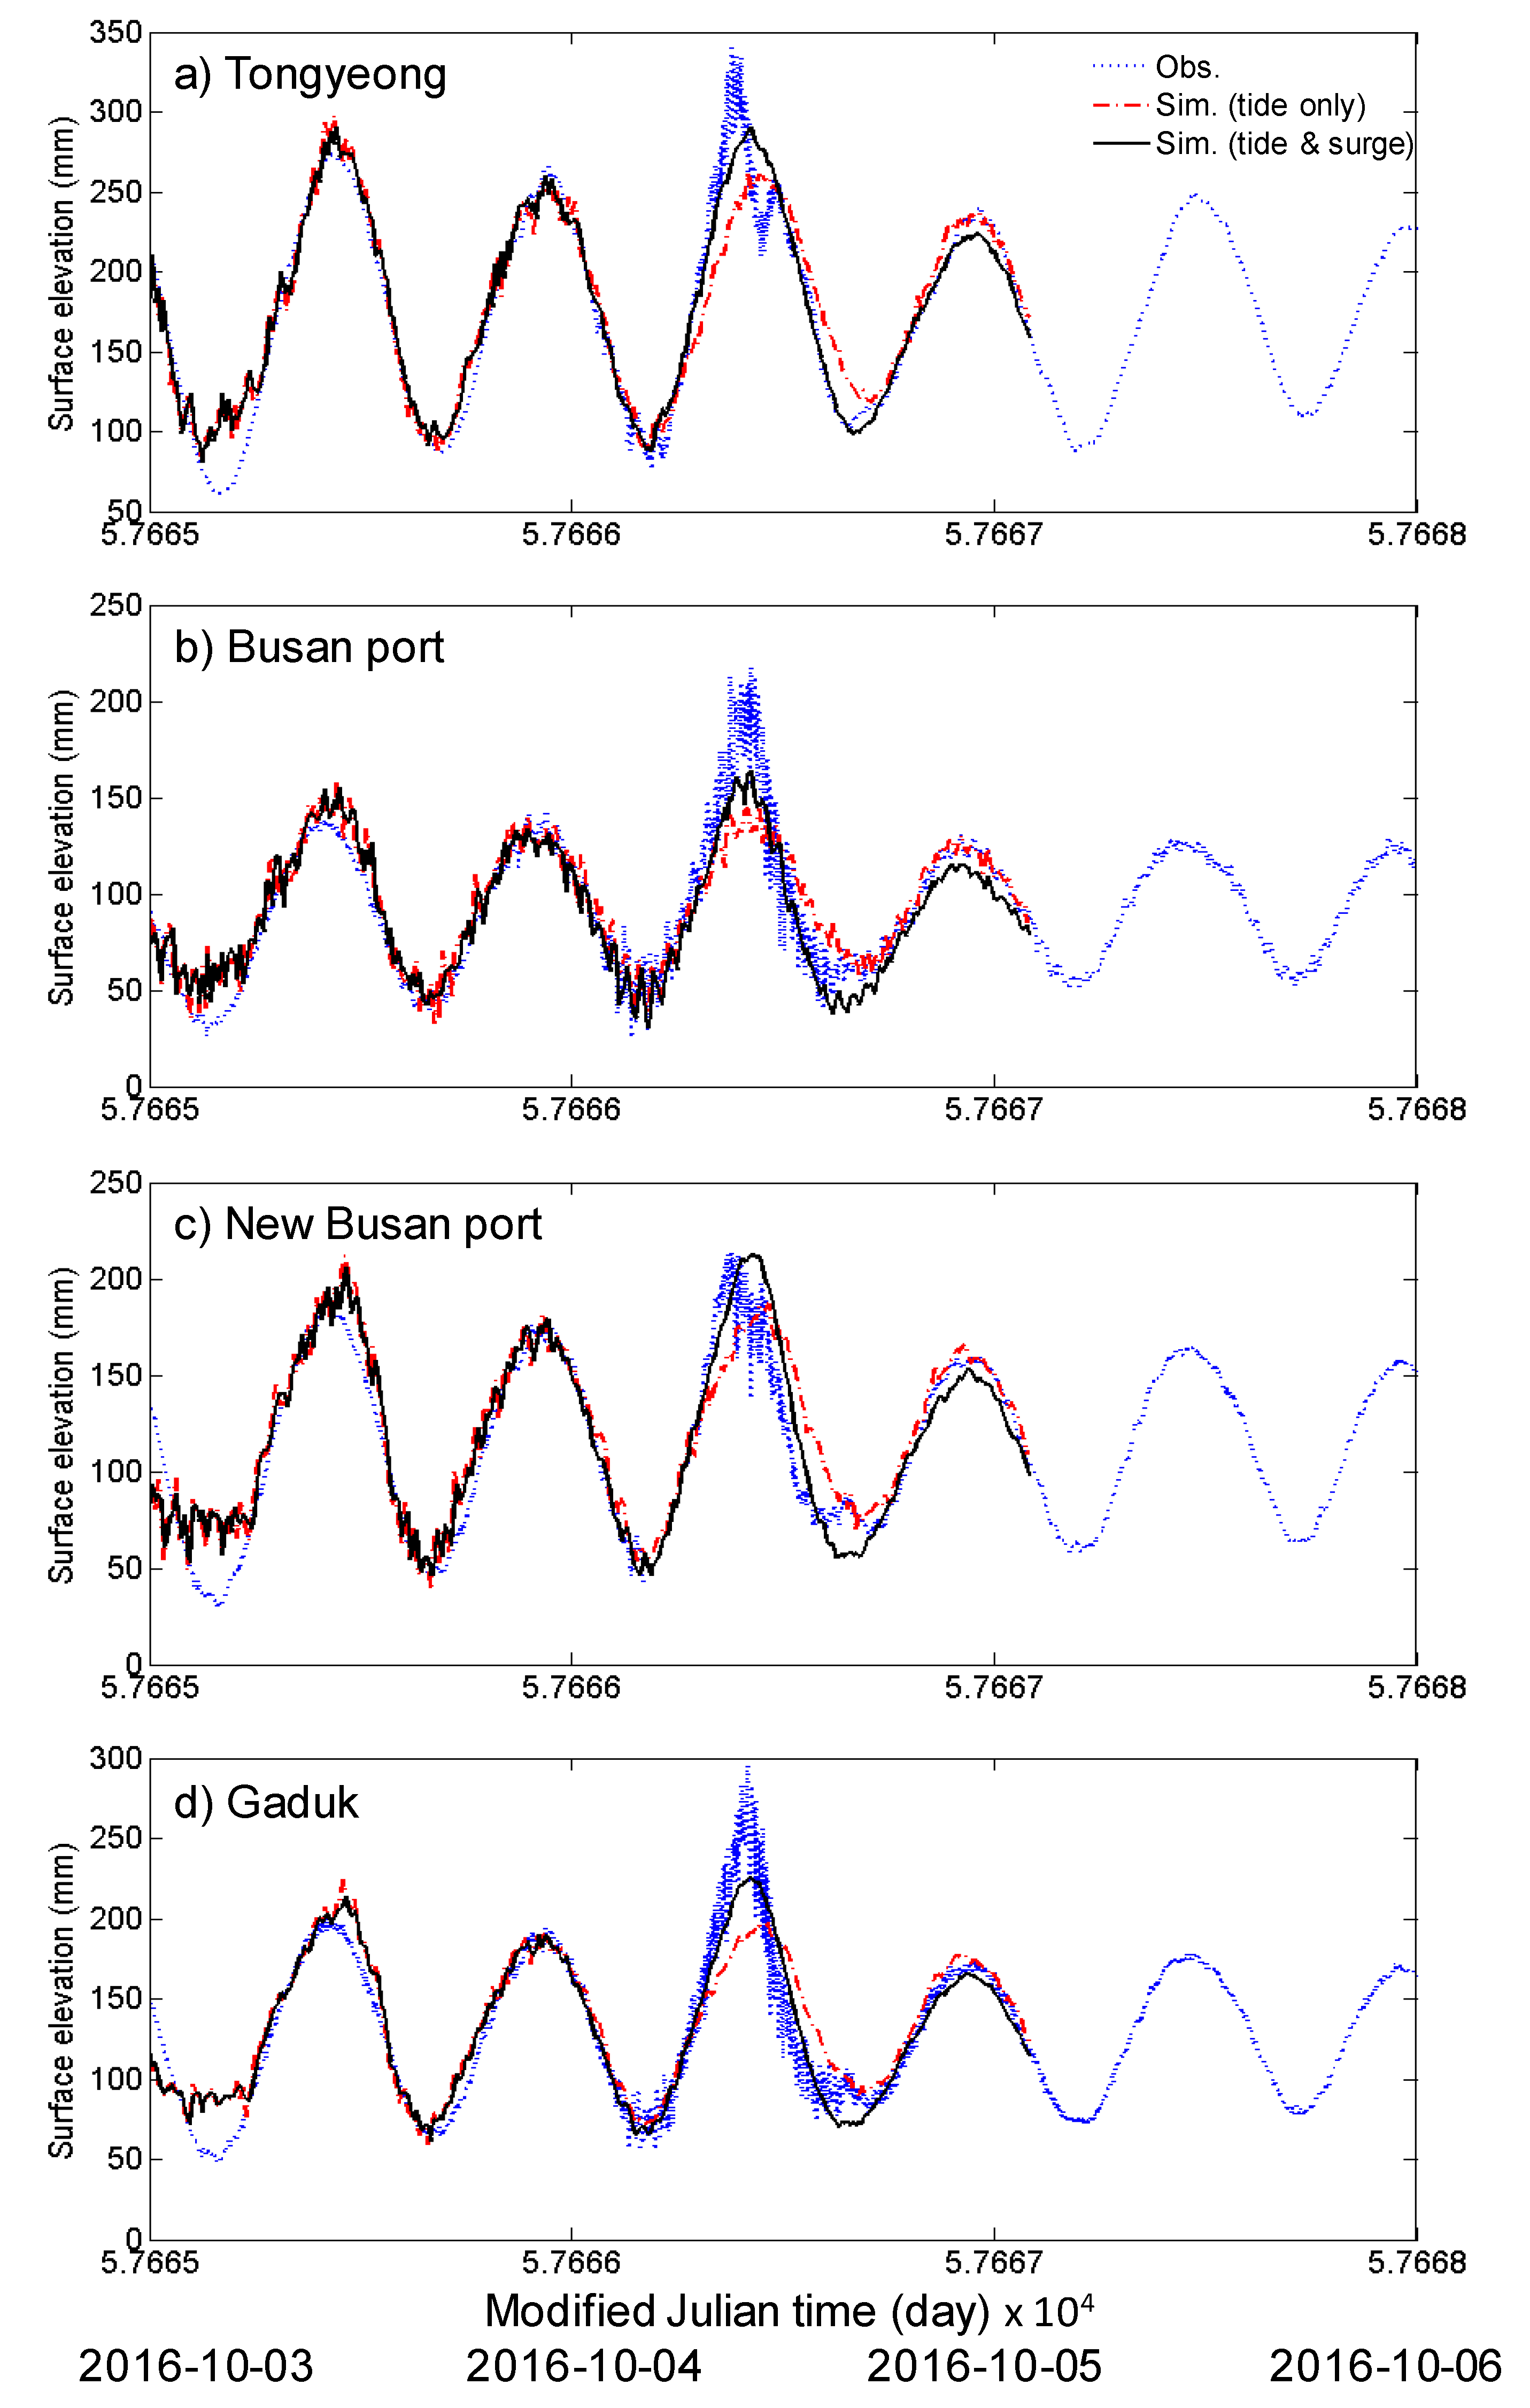
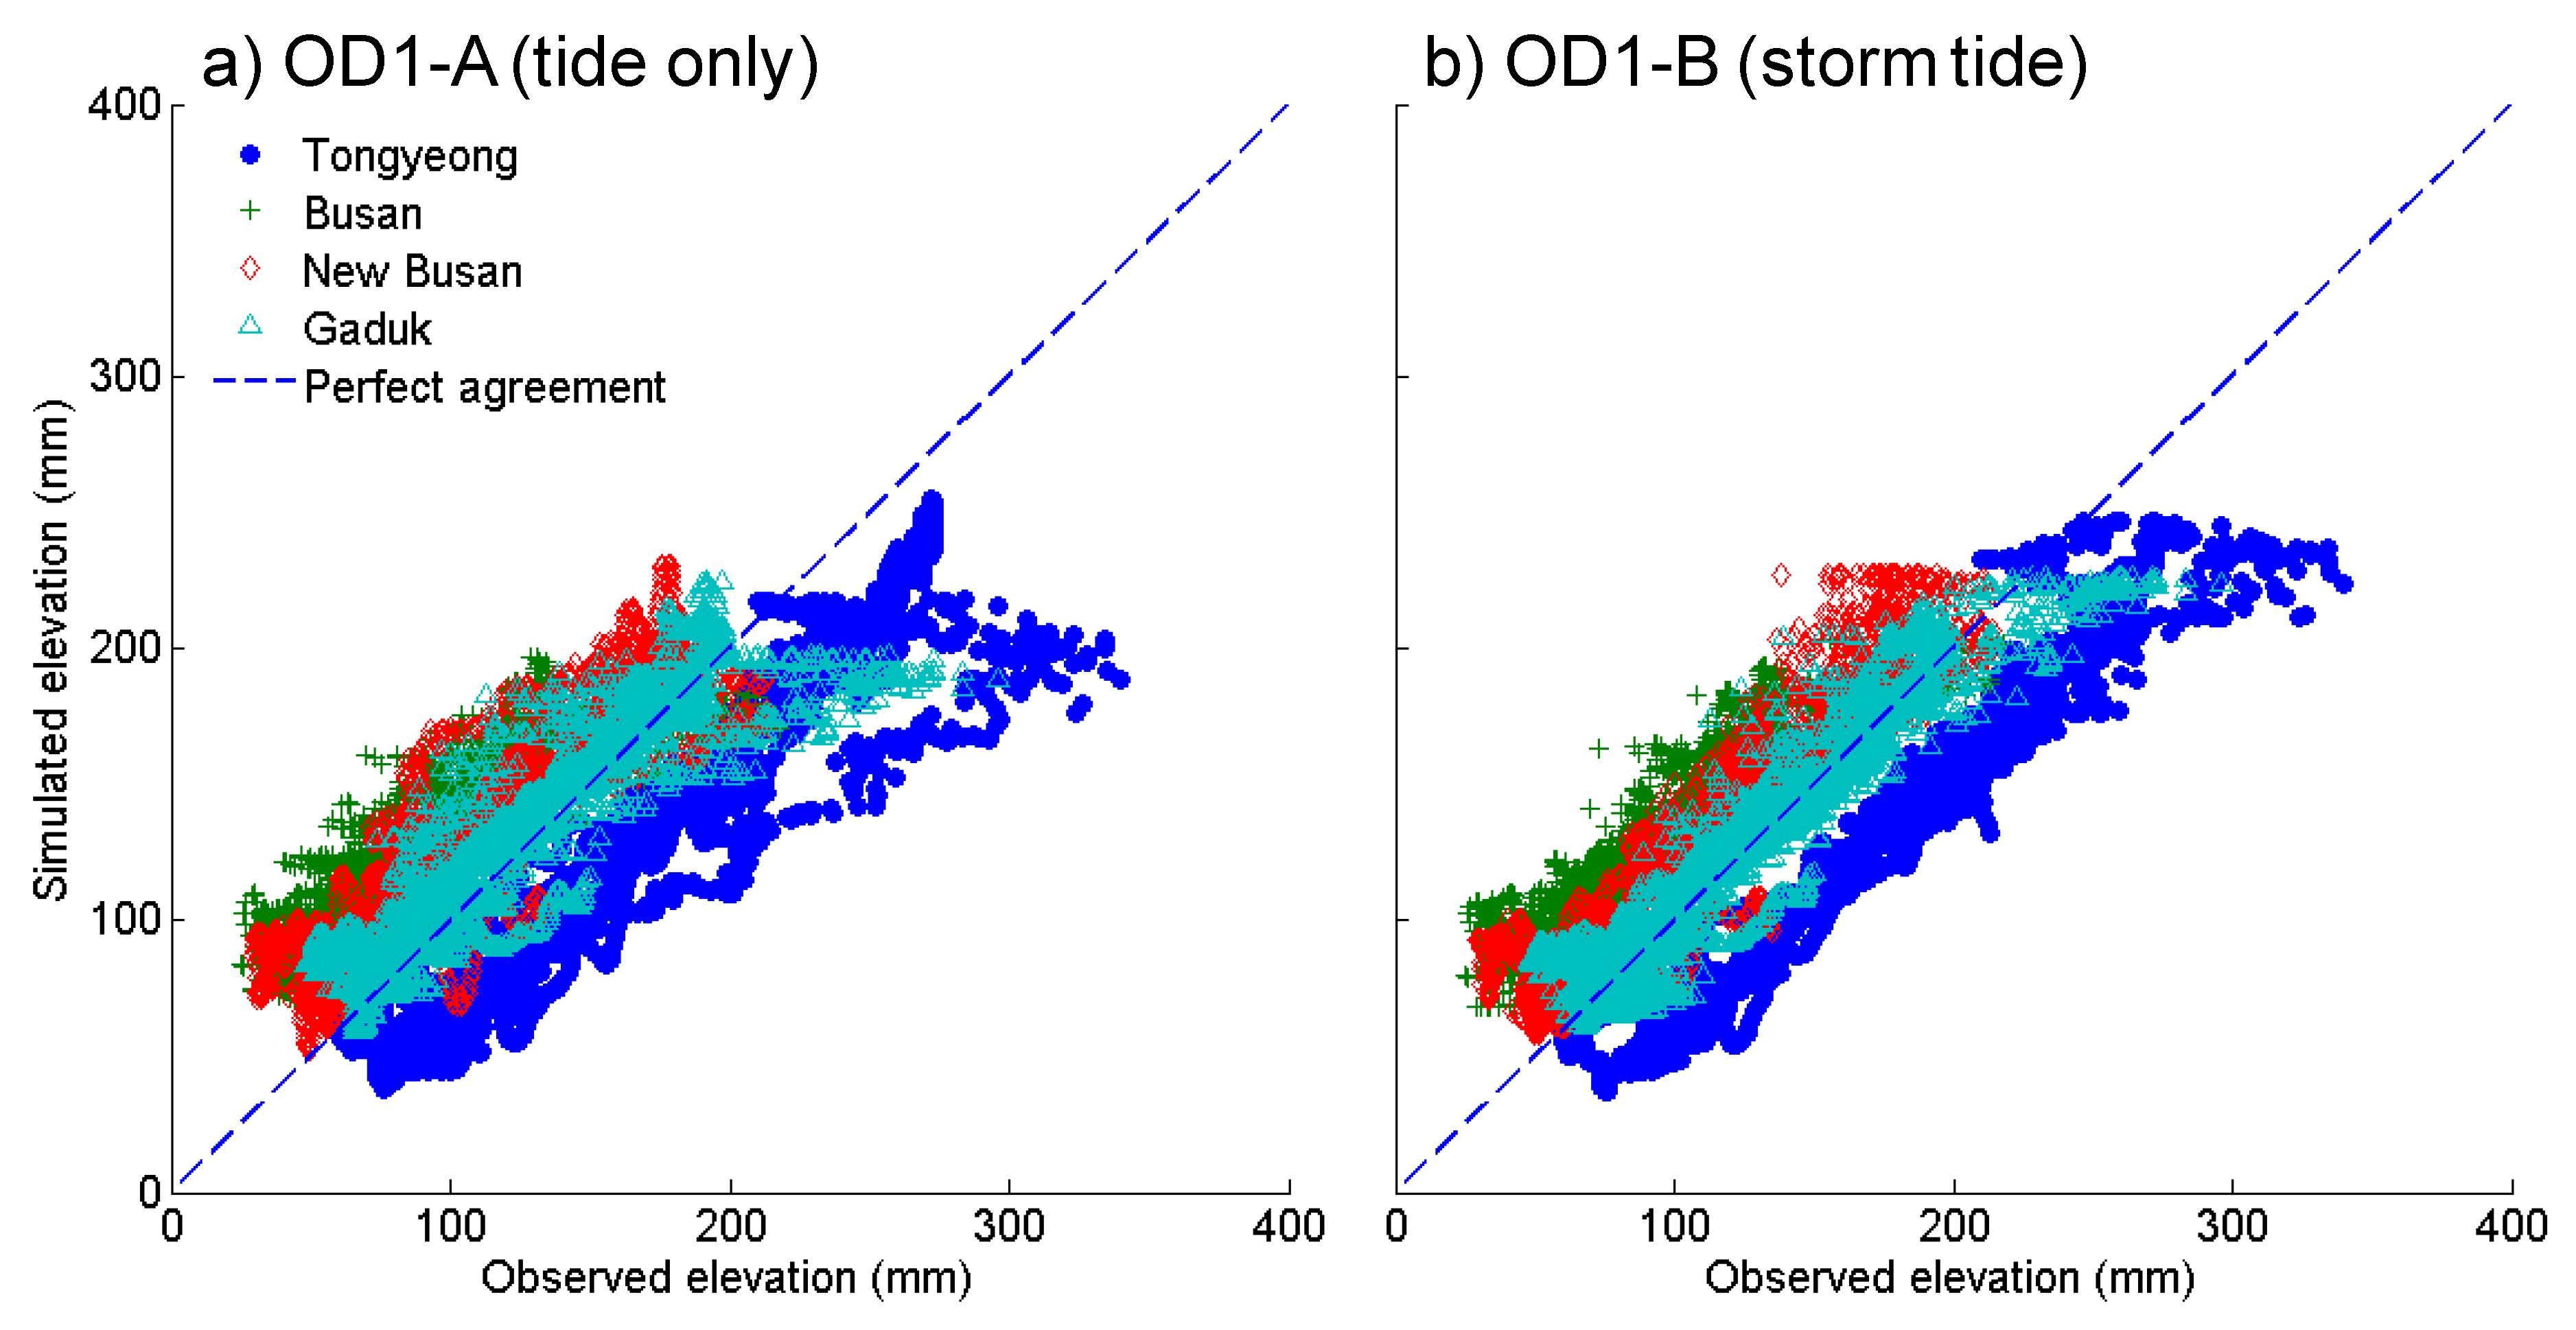
| Stations | OD1-A (Tide only) | OD1-B (Storm Tide) |
|---|---|---|
| Tongyeong | 44.20 | 43.54 |
| Busan port | 44.05 | 38.66 |
| New Busan port | 29.06 | 25.12 |
| Gaduk | 20.86 | 15.25 |
© 2020 by the authors. Licensee MDPI, Basel, Switzerland. This article is an open access article distributed under the terms and conditions of the Creative Commons Attribution (CC BY) license (http://creativecommons.org/licenses/by/4.0/).
Share and Cite
Jang, D.; Joo, W.; Jeong, C.-H.; Kim, W.; Park, S.W.; Song, Y. The Downscaling Study for Typhoon-Induced Coastal Inundation. Water 2020, 12, 1103. https://doi.org/10.3390/w12041103
Jang D, Joo W, Jeong C-H, Kim W, Park SW, Song Y. The Downscaling Study for Typhoon-Induced Coastal Inundation. Water. 2020; 12(4):1103. https://doi.org/10.3390/w12041103
Chicago/Turabian StyleJang, Dongmin, Wonkyun Joo, Chang-Hoo Jeong, Wonsu Kim, Sung Won Park, and Yoojin Song. 2020. "The Downscaling Study for Typhoon-Induced Coastal Inundation" Water 12, no. 4: 1103. https://doi.org/10.3390/w12041103
APA StyleJang, D., Joo, W., Jeong, C.-H., Kim, W., Park, S. W., & Song, Y. (2020). The Downscaling Study for Typhoon-Induced Coastal Inundation. Water, 12(4), 1103. https://doi.org/10.3390/w12041103