Abstract
This paper proposes the bi-objective optimization for the installation of pumps operating as turbines (PATs) in systems of transmission mains, which typically operate at steady flow conditions to cater to tanks in the service of water distribution networks. The methodology aims to find optimal solutions in the trade-off between installation costs and generated hydropower, which are to be minimized and maximized, respectively. While the bi-objective optimization is carried out by means of a genetic algorithm, an inner optimization sub-algorithm provides for the regulation of PAT settings. The applications concerned a real Italian case study, made up of nine systems of transmission mains. The methodology proved able to thoroughly explore the trade-off between the two objective functions, offering solutions able to recover hydropower up to 83 KW. In each system considered, the optimal solutions obtained were postprocessed in terms of long-life net profit. Due to the large geodesic elevation variations available in the case study, this analysis showed that, in all systems, the optimal solution with the highest value of generated hydropower was the most profitable under usual economic scenarios, with payback periods always lower than 3 years.
1. Introduction
The contribution of the water industry is not negligible in the total demand of energy in the world [1]. Within this contribution, a major role is played by the extraction and treatment of source water [1], mainly due to the operation of pumping stations. To reduce this component of energy demand, water utilities are more and more often implementing practices to reduce wastes of water in distribution networks [2]. On the other hand, attempts have recently been made to recover energy from water networks and thus to compensate part of the intensive energy consumption associated with water supply. Energy recover can be accomplished by installing devices such as hydro-turbines [3,4,5,6,7] or pumps operating in reverse mode, also called pumps as turbines (PATs) [8,9,10,11,12], within pressurized pipes. Though featuring lower efficiencies than hydro-turbines, PATs feature much lower costs, thus offering themselves as a very cost-effective solution for energy recovery from water distribution networks.
The analysis of the scientific and grey literature concerning the use of hydro-turbines and PATs for energy recovery shows that research efforts have been made mainly in three different directions. The first direction is concerned with the analysis of the performance of the pump operating in reverse-mode, in terms of head-discharge and efficiency-discharge relationships. In fact, although acknowledging the possibility of using their devices in turbine mode, manufacturers of pumps do not usually provide the performance relationships. Therefore, several works in recent years were dedicated to analyzing, experimentally (e.g., [13,14]) or numerically through computational fluid dynamics (e.g., [15,16]), how the head-discharge and efficiency-discharge relationships of pumps relate to the relationships of the same devices operated in reverse mode, as well as to setting up procedures to derive the latter from the former (e.g., [17,18]).
The second research direction concerns the modeling, operation, and regulation of energy recovery devices in pressurized water networks in an attempt to both generate hydropower and reduce service pressure. In fact, the hydraulic regulation uses a bypass line and control valves to regulate flow, such that the PAT operates at or near the best efficiency point (BEP) [10]. Furthermore, the electric regulation of the PAT may be implemented by connecting the PAT to an inverter [11,12] to adjust the impeller rotational speed as a function of inflow and available head drop. Real time control algorithms can be applied to dynamically adjust the settings of PAT, control valves, and inverter under time varying operational conditions [19,20].
The third main research direction, to which the present paper belongs, concerns the optimization of sites and settings of energy recovery devices in pressurized pipes. In this context, energy production can also be optimized in combination with service pressure to help mitigating leakage in pressurized water networks. In this context, Giugni et al. [21] showed the application of a genetic algorithm to optimize location and settings. These authors considered the following two simplifying assumptions:
- the number of energy recovery devices is a surrogate for their cost;
- these devices have unitary efficiency (that is, their performance curves are neglected).
Additionally, the subsequent works by Corcoran et al. [22], Coelho and Andrade-Campos [23], and Fernández García and McNabola [24] use the number of devices as a surrogate for their total cost in the optimization phase, although removing the simplifying assumption of unitary efficiency made in [21]. Notably, Corcoran et al. [22] compared the effectiveness of three different kinds of algorithms, namely nonlinear programming, mixed integer nonlinear programming, and evolutionary optimization, in the maximization of produced hydropower. Coelho and Andrade-Campos [23] proposed a two-step optimization, which was carried out in a decoupled way. The first step concerned identification of site locations, which was performed using an optimization algorithm tailored to identifying the best locations of pressure reducing valves. A second manual step followed, aiming to identify the turbine models that could be installed at each site. Finally, a financial analysis was carried out to look at installation cost and at income associated with the sale of produced hydropower. Fernández García and Mc Nabola [24] proposed a nonlinear programming algorithm based on the sequential addition of energy recovery devices along the water paths present in a water distribution network. Device installation was iterated until there was no more significant power to be recovered from the network. A financial analysis was also carried out by the two authors to evaluate installation cost, annual income associated with PAT operation, and investment payback period. Unlike the works in [21,22,23,24], the works of Fecarotta and McNabola [25] and Tricarico et al. [26] proposed considering the installation cost in the context of the optimization, rather than the number of energy recovery devices. In fact, Fecarotta and McNabola [25] proposed an objective function combining installation costs and annual net income associated with device operation to be used inside a nonlinear mixed integer programming algorithm. The more recent work by Tricarico et al. [26] used a similar objective function into the context of a multi-objective optimization, leading to the identification of optimal sites for energy recovery devices. However, the device settings were not optimized in the methodology proposed in [26].
In this paper, a new multi-objective optimization algorithm is proposed for the installation of energy recovery devices in pressurized water networks, with the main focus on the installation of PATs in systems of transmission mains. As compared to work in [26], the novel algorithm enables optimization of both installation sites and settings. The algorithm is applied with two objective functions, namely the total installation cost of the devices and the generated hydropower, to be minimized and maximized, respectively. The Pareto fronts obtained with the algorithm lend themselves to being postprocessed in various economic scenarios to help decision makers in the choice of the ultimate solution.
In the following sections, first the methodology is described, followed by the applications to a real case study.
2. Methodology
2.1. PAT Installation
The methodology presented in this paper can be applied to systems of transmission mains that connect water sources to tanks feeding water distribution networks (Figure 1a). These systems are typically branched and operate under steady flow conditions over the whole day. While water distribution tanks are fed by transmission mains with a daily constant water discharge, their storage enables balancing the peaks of network consumption. In existing systems of transmission mains, the maximum water discharges depend only on the available heads at sources and tanks. In some cases, the values are larger than required or limited by source water availability. Therefore, the desired water discharges are enforced by valve regulation, which dissipates energy surpluses.
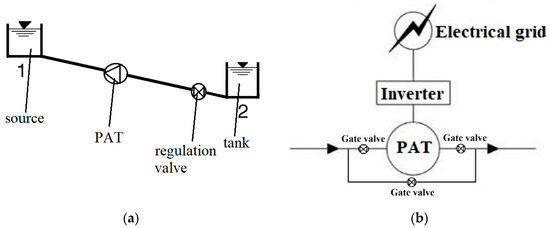
Figure 1.
Example of transmission main (a). Layout of pump as turbine (PAT) installation, adapted from [11] (b).
The redundant energy can be recovered through installation of rotary machines for electric power generation. The choice of number, sites, and models of machines represents an optimization problem aimed at minimizing installation costs and at maximizing the produced hydropower, under the hydraulic constraint of desired water discharges at mains, of fixed heads at source and tank nodes, and of desired heads at internal nodes. It is worth noting that the optimal solutions may not use the whole surplus of energy. In this case, the remaining surplus is dissipated through regulation valves.
In this work, the layout shown in Figure 1 was considered for PAT installation at the generic system main. The PAT was installed in-line with the system main inside a vault. Actually, the asynchronous PAT motor was connected to an inverter, which was in turn connected to the electrical grid (Figure 1b). The presence of the inverter enabled modification of the speed setting of the PAT and, therefore, the maximization of its production of hydropower for each daily value of water discharge in the main. Along each main of the system, a regulation valve was assumed to be present outside the vault to regulate flows as a function of fixed head values at system tanks and of desired head values at inner system nodes. Indeed, while the PAT was regulated to maximize the produced hydropower, some residual head surplus could be dissipated in the regulation valve. At a generic value of the PAT rotation speed, let Q (m3/s) be the water discharge in the PAT. As a result of the PAT curves of performance, the PAT produces a head drop YPAT (m) and features a certain efficiency η (-), based on its performance curves. The hydropower PPAT (KW) generated by the PAT is
where ρ = 1000 kg/m3 is water density, and g = 9.81 m/s2 is the gravity acceleration.
Finally, let Yv (m) be the head drop across the regulation valve assumed present along the main line outside of the PAT vault, and let J (-) be the energy friction slope in the main, evaluated by means of the Strickler formula. The friction-related head loss in the main is equal to J L, where L (m) is the length of the main.
2.2. Optimization Algorithm
The multi-objective genetic algorithm NSGAII [27] was used in this work to search for solutions in the trade-off between two objective functions, namely the total installation cost Cinst,tot (€) of the PATs (to be minimized) and the total hydropower PPAT,tot (KW) generated (to be maximized) in each system of transmission mains. While the presence of the inverter enables PAT operation to adjust to yearly variable values of the daily constant water discharge, a yearly average value of the water discharge was considered in the optimizations of the present work.
The first objective function Cinst,tot is calculated as the sum of the installation costs of the PAT at the various mains, i.e.,
where Cinst,i (€) is the cost of the PAT installed in the i-th of the nm mains. In the case of no PAT installation suggested by the optimizer at the generic main, Cinst,i = 0.
Indeed, the total installation cost should include other issues such as the costs associated with the approaching of the electrical grid to the PAT site in the case when the grid is not available at close sites.
The second objective function PPAT,tot is calculated as the sum of the hydropower contributions at each main, i.e.,
where PPAT,i is the hydropower generated in the i-th of the nm mains. In the case of no PAT installation suggested by the optimizer at the generic main, PPAT,i = 0.
Inside NSGAII, each individual is encoded in a set of nm genes, i.e., decisional variables. Specifically, the i-th of the nm genes represents the ID of the PAT installed in the i-th of the nm system mains.
For each solution (set of PATs installed in the mains) proposed by NSGAII, an inner optimization is performed through an embedded single objective genetic algorithm (sub-algorithm) to search for the PAT revolution speeds that might maximize the total hydropower generation in the system. Starting from the curves H(Q) and P(Q) provided by the manufacturer, the corresponding curves H(Q) and P(Q) curves for the PAT were estimated using the methodology proposed in [13]. In this methodology, first the BEP of a PAT is estimated starting from the BEP of the pump operated in direct mode. Then, the performance of the PAT in terms of H(Q) and P(Q) away from the BEP is obtained through polynomial equations.
For each solution proposed by NSGAII and for each set of PAT speeds proposed by the sub-algorithm, a hydraulic simulator based on the global gradient algorithm [28] is used to search for feasible values of Yv (i.e, Yv ≥ 0) for the regulation valves present at the system mains, while respecting the minimum desired heads at the inner nodes and the fixed heads at the system tanks.
The flowchart of instructions carried out for each individual in NSGAII is shown in Figure 2. First, the PATs are located in the system based on individual genes. Then, the total cost Cinst,tot of the PATs installed in the system, which is the first objective function of the optimization, is calculated. Then, a sub-algorithm is applied to the PATs for estimating PAT speeds. Then, the total power PPAT,tot generated by the system is calculated, with a penalization applied to infeasible solutions (i.e., solutions with negative value(s) of Yv).
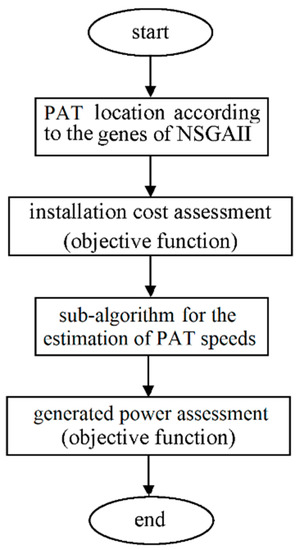
Figure 2.
Flow chart of the instructions to carry out for each individual of NSGAII.
2.3. Economic Postprocessing
The optimization described in the previous subsection produces a Pareto front of optimal solutions, each of which features its own distribution of PATs in the system mains, in the trade-off between Cinst,tot and PPAT,tot. For the choice of the ultimate solution in the Pareto front, an economic criterion can be applied. In this context, the net profit Cp (€) of each solution can be calculated as follows:
where Csale (€) is the gross profit associated with the sale of hydropower, converted into value at the initial time. This variable can be evaluated as
where c (€/KW h), T (years), and r (-) are the unit selling price of the electrical energy produced, the useful life of the PAT, and the discount rate for price conversion, respectively. In Equation (5), the numerical value 8760 is the number of hours in a year. Cadd (€) represents potential additional costs associated with the PAT (e.g., maintenance costs). Finally, the solution with the highest Cp value in the Pareto front can be selected as the ultimate solution.
Another meaningful postprocessing variable is the payback period, i.e., the amount of time Tb (years) it takes to recover the cost of the investment. While authors in [23,24] used a simplified calculation of Tb, which did not consider the decrease in the net present value as a function of the selling year, Tb was calculated here iteratively, by searching for the lowest value of T for which Cp is larger than 0 in Equation (4).
3. Applications
3.1. Case Study
The described methodology was applied to the system of networks operated by Azienda Consorziale Servizi Etnei (ACOSET), the major water distribution manager in Catania, Italy. The system was already analyzed in [3] and is characterized by transmission mains that cater to twenty urban centers situated at the foot of the volcano Etna. The main sources for these mains are the Ciapparazzo extraction tunnel, the Maniace source, and numerous ACOSET and private wells (Figure 3).
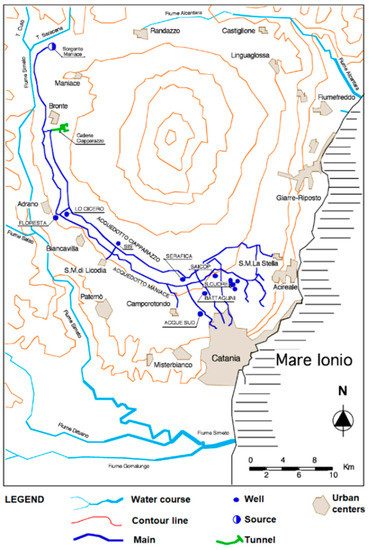
Figure 3.
Planview of the water mains; adapted from Pezzinga and Tosto [3].
For the calculations in this paper, nine separate systems of water transmission mains (features reported in Table 1) were considered, in which no PATs are currently present, namely, the systems feeding Ciapparazzo, Adrano, Gravina, Mascalucia, S. Gregorio, S. M. La Stella, Maniace, Camporotondo, and S. Giovanni Galermo. As an example, the qualitative elevation layout of the Ciapparazzo system is shown in Figure 4.

Table 1.
Features of the systems of transmission mains.
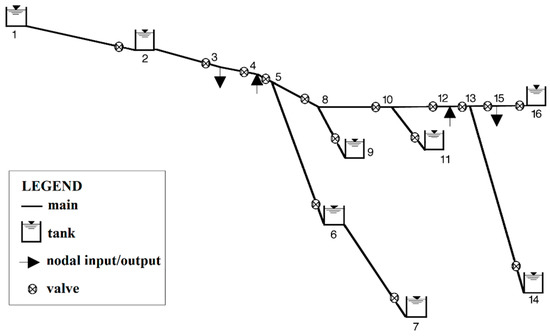
Figure 4.
Qualitative elevation layout of the system of transmission mains of Ciapparazzo. The numbers indicate the nodes in Table 1, which also reports the geometrical data of the system.
Due to the high geodesic gradients, the considered systems of transmission mains always show a surplus of energy that is currently dissipated through already installed regulation valves (see Figure 4 as an example). As a virtuous alternative option to the full dissipation of the available surplus of energy, the installation of PATs in this system is proposed in this work.
For the pumps to be installed as turbines in the systems, the 84 pumps of the NM4 series in the catalogue of the manufacturer Calpeda were considered. In their normal operation as pumps, they operate at 1450 rpm in the 50-Hz electrical grid. In their operation as PATs, the device revolution speed was assumed to be variable within the range 1450 to 3000 rpm. Furthermore, the electrical grid was assumed to be available at all sites, thus incurring no extra installation costs.
The cost of the electro-mechanical equipment for the generic PAT was obtained starting from the Calpeda price list and by applying some steps of increase, including the replacement of the asynchronous motor, the installation of an inverter, and a standard amount of +10% for additional hydraulic and electric equipment (e.g., gates and by-pass pipe, and electric wiring and meter). As for the replacement of the asynchronous motor, this must be done because of the different performance curves of the PAT from the same device used in direct mode [29]. Since the cost of the electro-mechanical equipment typical adds up to about 40% of the total installation cost [30], the latter was obtained by multiplying the former by 100/40 = 2.5.
3.2. Results
3.2.1. Optimization
The methodology described above yielded the Pareto fronts shown in the graphs in Figure 5. As expected, each front reports increasing values of the produced hydropower PPAT,tot as Cinst,tot grows. Overall, the maximum values of PPAT,tot, at the right end of the Pareto fronts, ranged from about 6 KW to 83 KW in the systems of Camporotondo and Ciapparazzo, respectively. As expected, the larger maximum values of PPAT,tot were associated with larger geodesic height variations and larger water discharges available in the system.
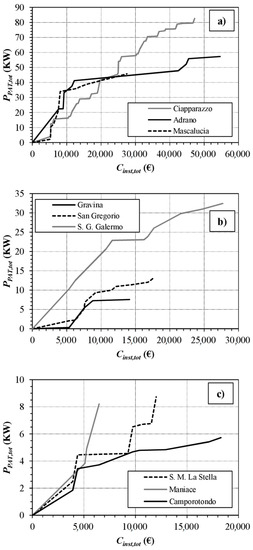
Figure 5.
Pareto front of optimal solutions in the trade-off between Cinst,tot and PPAT,tot in the systems of (a) Ciapparazzo, Adrano, Mascalucia, (b) Gravina, S. Gregorio, S. G. Galermo, (c) S. M. La Stella, Manciace, and Camporotondo.
The analysis of the results revealed irregularities in the growth of PPAT,tot as a function of Cinst,tot, with changes in slope in the Pareto front for all systems. To shed light on this aspect, the Pareto front in the system of Camporotondo, made up of nine solutions (see Table 2), was taken as an example. The first solution was made up of no PAT in the system. As Cinst,tot grew, the optimizer first suggested installing only one PAT in main three, which was the last main of the system with the lowest water discharge. For a larger value of Cinst,tot = 6468 €, the installation of the PAT at main two was proposed. When the cost further increased, combinations of two PATs, involving first mains one and three and then mains two and three, were proposed. Finally, the two most expensive solutions featured PATs installed at all sites. Globally, the only PAT model suggested for main one was NM4 40/16C, which was operated at different speeds in the various solutions. The same consideration could be made for main two, in which the only PAT model installed was the NM4 32/20A. Various PAT models, operated at different speeds, were proposed, instead, for main three. For growing values of Cinst,tot, the change in the PAT model and PAT speed, as well as the introduction of the PAT in new sites, was responsible for slope changes in the Pareto front PPAT,tot(Cinst,tot).
Table 2.
Solutions in the Pareto front for the system of Camporotondo. Features in terms of PATs installed in the system, PAT speeds, installation cost Cinst,tot, and hydropower PPAT,tot.
The solutions obtained in the various systems for the highest values of Cinst,tot (and therefore of PPAT,tot) are presented in Table 3, which reports the features in terms of installed PAT models and adopted speed settings, hydraulic variables, and produced hydropower. As an example of these solutions, the system of S. M. La Stella is shown in Figure 6, also including the qualitative pattern of the head grade line along the system mains. This pattern points out that the head decreased due to friction losses in the mains as well as to local head dissipations at the two PATs and at the two regulation valves.
Table 3.
Solutions obtained in the various systems for the highest values of Cinst,tot.
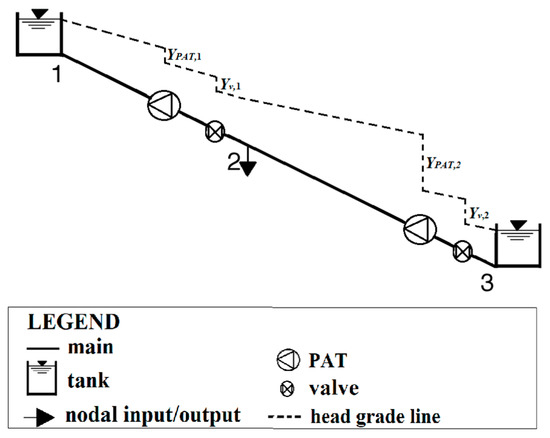
Figure 6.
Layout of the system of transmission mains of S. M. La Stella. Qualitative pattern for the head grade line for the solution with Cinst,tot = 12,021 € and PPAT,tot = 8.74 KW. See Table 3 for numerical values.
3.2.2. Economic Postprocessing
The Pareto fronts of optimal solutions shown in Figure 5 were postprocessed to obtain curves of net profit Cp as a function of the total installation cost Cinst,tot (see Figure 7). In these calculations, a useful life T = 20 years was considered for the PAT. Cadd in Equation (4) was assumed to include the annual maintenance costs, which were set at 3% of Cinst,tot and converted into present value at year 0. As an example, the Pareto front for the system of Camporotondo (reported in Figure 5c) was postprocessed by considering four alternative scenarios.
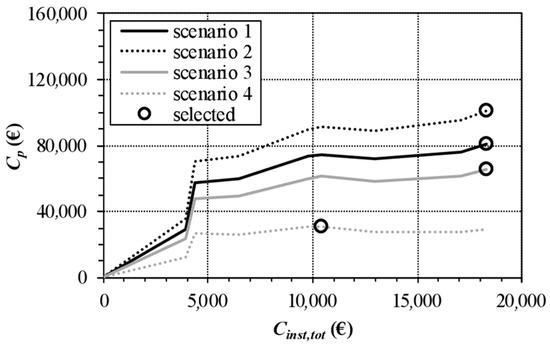
Figure 7.
Curves of total net profit Cp as a function of Cinst,tot, obtained in scenarios 1–4, by postprocessing the Pareto front in Figure 5c for the system of Camporotondo.
The main features of the four scenarios are:
- scenario 1, with c = 0.1561 €/KW h, r = 0.04;
- scenario 2, with c = 0.1561 €/KW h, r = 0.02;
- scenario 3, with c = 0.1561 €/KW h, r = 0.06;
- scenario 4, with c = 0.08 €/KW h, r = 0.04.
In scenario 1, the values of c and r represent currently typical conditions in Italy for the sale of hydropower and for the discount rate for cost conversion, respectively. Scenario 2 differs from scenario 1 in the lower value of r, thus resulting in higher present worth values for sold hydropower and for maintenance costs. Compared to scenario 1, scenario 3 has a larger value of r, resulting in lower present worth values for sold hydropower and for maintenance costs. Finally, scenario 4 differs from scenario 1 because of its lower value of c.
Overall, Figure 7 shows that, in scenario 1, Cp tends to grow, over almost the whole range of Cinst,tot values, up to a value of about 81,000 €. Therefore, the most profitable solution in terms of Cp is that featuring the highest value of Cinst,tot = 18,293 € (solution 9 in Table 2). In comparison with scenario 1, due to the different values of r, the pattern of Cp(Cinst,tot) in scenarios 2 and 3 is slightly higher and lower, respectively. In both scenarios, the superiority of solution 9 persists because of its large generated hydropower. In fact, for all the considered values of r, the sale of hydropower pays back the large investment and maintenance costs associated with solution 9. Under scenario 4, Cp rapidly grows up to a quite stable value around 28,000 €, and the maximum of Cp is at 30,964 €, obtained for Cinst,tot = 10,388 € (solution 6 in Table 2). In this case, due to the low value of c, the large investment and maintenance costs of solution 9 are less paid back in the long run, in comparison with other solutions.
Overall, the economic postprocessing in the system of Camporotondo shows that the most expensive solution in terms of Cinst,tot yielded by the optimization tends to be the most profitable solution unless the economic scenario used for the postprocessing differs largely from the typical ones in terms of c.
Scenario 1 for the economic postprocessing was applied for all the considered systems. In all systems, the most profitable solution was the right end solution in the Pareto front in Figure 5, thus confirming that the largest optimal investment is well paid back by the sale of electrical energy. Overall, the net profit values Cp ranged from about 8.1 × 10⁴ € to about 1.5 × 10⁶ €, for the systems of Camporotondo and Ciapparazzo, respectively. Higher values of net profit were associated with larger values of the produced hydropower PPAT,tot. The payback period Tb was lower than 2 years in all cases except for the system of Camporotondo, for which Tb = 3 years. Overall, these values of Tb were even lower than those observed in [24], due to the more favorable conditions of geodesic elevation variations in the present case study.
4. Discussion and Conclusions
In this paper, the bi-objective genetic optimization was proposed for tackling the problem of optimal installation of PATs in existing systems of transmission mains. The proposed methodology is able to search for optimal locations and speed settings of PATs in each system in the trade-off between the total installation cost and the produced hydropower, to be minimized and maximized, respectively. The applications concerned various topologically simple systems of transmission mains managed by ACOSET in Italy, while including in the analysis the estimated installation costs and the expected reverse-mode performance of the pumps produced by a manufacturer.
The application of the bi-objective optimization enabled Pareto fronts of optimal PAT installation solutions in the trade-off between installation costs and hydropower produced to be obtained. Even if the optimization of PAT locations and settings was performed in this case on yearly average water discharges at the mains, the presence of the inverter in the installation enables adjustment of the operation of each PAT to variable values of the daily water discharge in the year. The analysis of these Pareto fronts revealed that, as the cost grows, the power produced grows irregularly. In fact, as the installation cost varies in the generic system, optimal solutions are found with variable numbers, models, and speeds of PATs. Based on this result, it is expected that algorithms based on the sequential addition of PATs and keeping PAT speeds unchanged during the iterations, such as that proposed in [24], may lead to sub-optimal solutions. However, it must be remarked that the application of the bi-objective optimization took computational time with order of magnitude of hours/days for the simple case systems considered in this work. Therefore, computational times would become prohibitive for more topologically complex systems.
Starting from the trade-off between installation costs and generated hydropower, which is explored in a single optimization on each system, a quick economic postprocessing enables analysis of how optimal solutions perform in terms of long-cycle net profit and payback periods in various economic scenarios, thus supporting decision makers in the choice of the ultimate design solution. This marks a significative improvement compared to the single objective optimization, in which one optimization must be carried out for each considered economic scenario.
The following conclusions can be drawn from this work:
- the installation of PATs confirms itself as a valuable solution for energy recovery from pressurized water networks;
- in the case-study considered, made up of transmission mains featuring high geodesic elevation variations, the payback period for the installation investment ranges from 1 to 3 years, lower than those previously remarked in the scientific literature;
- in the case-study considered, the most profitable solutions at all systems in typical economic scenarios are those associated with the maximum hydropower recovered, which ranges from about 6 KW to 83 KW.
Future work will be dedicated to making the methodology feasibly applicable to more topologically complex systems under time varying operating conditions.
Author Contributions
Conceptualization, E.C. and G.P.; methodology, E.C. and G.G.; writing—original draft preparation, E.C. and G.G.; writing—review and editing, A.C., C.C., and G.P. All authors have read and agreed to the published version of the manuscript.
Funding
This research received no external funding.
Conflicts of Interest
The authors declare no conflict of interest.
References
- IEA (International Energy Agency). Water Energy Nexus: Excerpt from the World Energy Outlook. 2016. Available online: https://www.iea.org/publications/freepublications/publication/WorldEnergyOutlook2016ExcerptWaterEnergyNexus.pdf (accessed on 22 May 2019).
- Xu, Q.; Chen, Q.; Ma, J.; Blanckaert, K.; Wan, Z. Water saving and energy reduction through pressure management in urban water distribution networks. Water Resour. Manag. 2014, 28, 3715–3726. [Google Scholar] [CrossRef]
- Pezzinga, G.; Tosto, G. Adeguamento energetico di reti di adduzione idrica in pressione. L’Acqua 2001, 1, 27–34. (In Italian) [Google Scholar]
- Sammartano, V.; Sinagra, M.; Filianoti, P.; Tucciarelli, T. A Banki-Michell turbine for in-line water supply systems. J. Hydraul. Res. 2017, 55, 686–694. [Google Scholar] [CrossRef]
- Samora, I.; Manso, P.; Franca, M.; Schleiss, A.; Ramos, H. Energy recovery using micro-hydropower technology in water supply systems: The case study of the city of Fribourg. Water 2016, 8, 344. [Google Scholar] [CrossRef]
- Sinagra, M.; Sammartano, V.; Morreale, G.; Tucciarelli, T. A new device for pressure control and energy recovery in water distribution networks. Water 2017, 9, 309. [Google Scholar] [CrossRef]
- Bonthuys, G.J.; van Dijk, M.; Cavazzini, G. Water distribution system energy recovery and leakage reduction optimisation through hydro turbines. J. Water Resour. Plan. Manag. 2016, 142, 04015045. [Google Scholar]
- Ramos, H.; Borga, A. Pumps as turbines: An unconventional solution to energy production. Urban Water 1999, 1, 261–263. [Google Scholar] [CrossRef]
- Agarwal, T. Review of pump as turbine (PAT) for microhydropower. Int. J. Emerg. Technol. Adv. Eng. 2012, 2, 163–169. [Google Scholar]
- Carravetta, A.; Del Giudice, G.; Fecarotta, O.; Ramos, H. Energy production in water distribution networks: A PAT design strategy. Water Resour. Manag. 2012, 26, 3947–3959. [Google Scholar] [CrossRef]
- Carravetta, A.; Del Giudice, G.; Fecarotta, O.; Ramos, H. PAT design strategy for energy recovery in water distribution networks by electrical regulation. Energies 2013, 6, 411–424. [Google Scholar] [CrossRef]
- Alberizzi, J.C.; Renzi, M.; Nigro, A.; Rossi, M. Study of a Pump-as-Turbine (PaT) speed control for a Water Distribution Network (WDN) in South-Tyrol subjected to high variable water flow rates. Energy Procedia 2018, 148, 226–233. [Google Scholar] [CrossRef]
- Derakhshan, S.; Nourbakhsh, A. Experimental study of characteristic curves of centrifugal pumps working as turbines in different specific speeds. Exp. Therm. Fluid Sci. 2008, 32, 800–807. [Google Scholar] [CrossRef]
- Pugliese, F.; De Paola, F.; Fontana, N.; Giugni, M.; Marini, G. Performance of vertical-axis pumps as turbines. J. Hydraul. Res. 2018, 56, 482–493. [Google Scholar] [CrossRef]
- Nautiyal, H.; Kumar, V.; Thakur, A. CFD Analysis on Pumps working as Turbines. Hydro Nepal 2010, 6, 35–37. [Google Scholar] [CrossRef]
- Fecarotta, O.; Carravetta, A.; Ramos, H. CFD and comparisons for a pump as turbine: Mesh reliability and performance concerns. Int. J. Energy Environ. 2011, 2, 39–48. [Google Scholar]
- Marchiori, I.N.; Lima, G.M.; Brentan, B.M.; Junior, E.L. Effectiveness of methods for selecting pumps as turbines to operate in water distribution networks. Water Supply 2018, 19, 417–423. [Google Scholar] [CrossRef]
- Novara, D.; McNabola, A. A model for the extrapolation of the characteristic curves of pumps as turbines from a datum best efficiency point. Energy Convers. Manag. 2018, 174, 1–7. [Google Scholar] [CrossRef]
- Fontana, N.; Giugni, M.; Glielmo, L.; Marini, G. Real time control of a prototype for pressure regulation and energy production in water distribution networks. J. Water Resour. Plan. Manag. 2016, 142, 04016015. [Google Scholar] [CrossRef]
- Fontana, N.; Giugni, M.; Glielmo, L.; Marini, G.; Zollo, R. Hydraulic and Electric Regulation of a Prototype for Real-Time Control of Pressure and Hydropower Generation in a Water Distribution Network. J. Water Resour. Plan. Manag. 2018, 144, 04018072. [Google Scholar] [CrossRef]
- Giugni, M.; Fontana, N.; Ranucci, A. Optimal location of PRVs and turbines in water distribution systems. J. Water Resour. Plan. Manag. 2014, 140, 06014004. [Google Scholar] [CrossRef]
- Corcoran, L.; McNabola, A.; Coughlan, P. Optimization of water distribution networks for combined hydropower energy recovery and leakage reduction. J. Water Resour. Plan. Manag. 2015, 142, 04015045. [Google Scholar] [CrossRef]
- Coelho, B.; Andrade-Campos, A. Energy recovery in water networks: Numerical decision support tool for optimal site and selection of micro turbines. J. Water Resour. Plan. Manag. 2018, 144, 04018004. [Google Scholar] [CrossRef]
- Fernández García, I.; Mc Nabola, A. Maximizing Hydropower Generation in Gravity Water Distribution Networks: Determining the Optimal Location and Number of Pumps as Turbines. J. Water Resour. Plan. Manag. 2020, 146, 04019066. [Google Scholar] [CrossRef]
- Fecarotta, O.; McNabola, A. Optimal location of pump as turbines (PATs) in water distribution networks to recover energy and reduce leakage. Water Resour. Manag. 2017, 31, 5043–5059. [Google Scholar] [CrossRef]
- Tricarico, C.; Morley, M.S.; Gargano, R.; Kapelan, Z.; Savic, D.; Santopietro, S.; Granata, F.; De Marinis, G. Optimal energy recovery by means of pumps as turbines (PATs) for improved WDS management. Water Sci. Technol. Water Supply 2018, 18, 1365–1374. [Google Scholar] [CrossRef]
- Deb, K.; Pratap, A.; Agarwal, S.; Meyarivan, T. A Fast and Elitist Multiobjective Genetic Algorithm: NSGA-II. IEEE Trans. Evolut. Comput. 2002, 6, 182–197. [Google Scholar] [CrossRef]
- Todini, E.; Pilati, S. A gradient algorithm for the analysis of pipe networks. Computer Application in Water Supply. In System Analysis and Simulation; Coulbeck, B., Choun-Hou, O., Eds.; John Wiley & Sons: London, UK, 1988; Volume I, pp. 1–20. [Google Scholar]
- Novara, D.; Carravetta, A.; McNabola, A.; Ramos, H. Cost Model for Pumps as Turbines in Run-of-River and In-Pipe Microhydropower Applications. J. Water Resour. Plan. Manag. 2019, 145, 04019012. [Google Scholar] [CrossRef]
- Chapallaz, J.M.; Eichenberger, P.; Fischer, G. Manual on Pumps Used as Turbines; VIEWEG, 1992. Available online: http://skat.ch/book/manual-on-pumps-used-as-turbines-volume-11/ (accessed on 22 January 2020).
© 2020 by the authors. Licensee MDPI, Basel, Switzerland. This article is an open access article distributed under the terms and conditions of the Creative Commons Attribution (CC BY) license (http://creativecommons.org/licenses/by/4.0/).