Abstract
Vegetated swales are a popular sustainable drainage system (SuDS) used in a wide range of environments from urban areas and transport infrastructure, to rural environments, sub-urban and natural catchments. Despite the fact that vegetated swales, also known as grassed swales, have received scientific attention over recent years, especially from a hydrological perspective, there is a need for further research in the field, with long-term monitoring. In addition, vegetated swales introduce further difficulties, such as the biological growth occurring in their surface layer, as well as the biological evolution taking place in them. New developments, such as the implementation of thermal devices within the cross-section of green SuDS for energy saving purposes, require a better understanding of the long-term performance of the surface temperature of swales. This research aims to contribute to a better understanding of these knowledge gaps through a descriptive analysis of a vegetated swale in Ryton, Coventry, UK, under a Cfb Köppen climatic classification and a mixed rural and peri-urban scenario. Precipitation and temperature patterns associated with seasonality effects were identified. Furthermore, a level of biological evolution was described due to the lack of periodical and planned maintenance activities, reporting the presence of both plant species and pollinators. Only one event of flooding was identified during the three hydrological years monitored in this research study, showing a robust performance.
1. Introduction
Sustainable drainage systems (SuDS) are nature-based solutions (NBS) utilised to manage water, both in urban and rural environments, as well as in transport infrastructures. They are often referred to as stormwater best management practices (BMP), water sensitive urban design (WSUD), stormwater control measures (SCM) and low impact developments (LID), amongst other terminology [1].
Swales are SuDS that are mainly utilised in transportation infrastructure and in urban and sub-urban environments to capture pollutants and attenuate runoff volumes [2,3,4,5]. Furthermore, they are used in rural environments and farms to manage stormwater [6]. These techniques also provide landscape features, as well as an improvement in biodiversity and amenity [7]. In addition, swales have been utilised in permaculture practices showing a robust long-term performance, as highlighted by Abrahams et al. [8]. These authors, along with Winston et al. [9], related the ecosystem services provided by swales, to those delivered by wetlands, especially when vegetation growth is allowed under a low maintenance condition. In other words, allowing nature to take ownership of the system up to some degree.
Vegetated swales have been treated in scientific analyses as conventional or standard swales, as indicated by Fardel et al. [10]. Therefore, they were included in the same category as swales, grassy swales, vegetated roadside swales, planted swales and grassy media, amongst others. Other categories refer to dry, wet and bio-swales. However, dry swales are often described as swales able to completely drain stormwater runoff between two consecutive storm events by authors such as Hunt et al. [11], which also includes some vegetated swales in this category.
Fardel et al. [10] gathered the main parameters influencing swale performance in the literature up to 2019. The authors distinguished between those variables affecting the drainage area, such as the discharge area, the discharge ratio and the main concentration at the swale inlet; those variables associated with the swale itself, such as the swale length, slope, type of soil, vegetation and operational life. This research also revealed the limitations of previous work, emphasizing the need for continuous and long-term monitoring alongside later work such as Purvis et al. [12]. Most of the investigations carried out in the literature show a limited number of storm events which introduces a certain level of uncertainty, as they miss the major hydrological effects influenced by the climate on the location, the rainfall and temperature patterns and the seasonality. To minimise this problem, McCarthy et al. [13] proposed a minimum range of 15–20 storm events in order to capture robust data from a water quality stand point. Therefore, the hydrology should also reach this threshold in order to be reliable and representative for comparison with other international studies. Recent research, such as Purvis et al. [12], monitored 39 storm events over 12 months in a bio-swale in North Carolina, USA, which also followed the described conditions.
Temperature relationships within swales were highlighted as an important factor, especially when considering potential energy applications like the implementation of a ground source heat pump (GSHP) as outlined by Charlesworth et al. and Rey-Mahía et al. [14,15]. Both reports indicated that more research is needed to understand the long-term patterns and their role in the hydrological impact on pervious pavements and vegetated swales.
The most up-to-date reviews and scientific research on vegetated swales, such as Gavrić et al. [16], pointed out the need for improved modelling in grass–soil media, being underpinned by a better knowledge of physical processes taking place in this SuDS technique. Furthermore, complete facility descriptions ideally are required, to fully describe the functions and ecosystem services provided by vegetated swales.
Design guidance for new developments should specify the implementation of SuDS treatment trains for stormwater management, based on recent studies carried out by Williams et al. [17] regarding user perception of SuDS benefits. Additionally, treatment trains can connect to further social and ecological elements of the urban landscape, due to their comprehensive and holistic design features, as pointed out by Lähde et al. [18]. Treatment trains containing green roofs and grassed swales promote hydrological processes of detention and conveyance, including infiltration within the swale, when designed for that purpose [19].
Once the knowledge gaps were identified in the literature, the research presented in this paper aimed to provide further information about the long-term hydrological processes, occurring in a vegetated swale performing under real weather conditions in the field, showing the seasonality effect as well as the evolution of the water temperature of the system. This research also highlights the hydrological impact of a vegetated swale within a treatment train, when associated with an extensive green roofs.
The specific objectives of this research are cited as follows:
- To accurately describe the hydrological patterns through water level measurement at the discharge point, identifying levels of potential hydraulic failure as well as the storm events that may cause any failure, over three hydrological years.
- To identify surface temperature trends in the vegetated swale over several years of operation.
- To discuss the results depending on the maintenance activities carried out over the research period and the biological evolution of the vegetated swale.
Long-term hydrological and temperature monitoring alongside operation and maintenance monitoring allows detailed investigation of the performance of vegetated swales in the field, to develop a better understanding of this SuDS technique.
2. Materials and Methods
The experimental methods utilised in this research are presented in the following sub-sections, including monitoring equipment, hypotheses, materials and methods.
2.1. Location and Climate Context
The experimental site is located within the premises of the Centre for Agroecology, Water and Resilience (CAWR), Coventry University (52°37′ N, 1°41′ W), in Ryton Organic Gardens, Ryton-on-Dunsmore, Warwickshire, UK. The site, constructed in 2005, is 1 km away from the A45 highway and 1.5 km from the village of Wolston (Figure 1). The land use of the study area could be defined as rural mixed with small peri-urban areas associated with roads, highways, car parks and other civil engineering related infrastructure, as well as small villages. The organic gardens also contain other SuDS devices across the complex such as filter strips, a reed bed, rain gardens and large green areas promoting infiltration and bioretention hydrological processes.

Figure 1.
Study area in Ryton-on-Dunsmore, Coventry, and location of the UK Met Office weather stations.
Coventry has a Cfb climate with warm temperature, fully humid and warm summers, based on the Köppen–Geiger climatic classification used to categorise the climate conditions across the World. Historical weather data for Coventry and its surrounding area have been obtained for the historical series between 1981 and 2010, showing 700.1 mm annual rainfall with 124 days/year with precipitation over 1 mm for Coundon, Coventry, comparing with the UK average values for annual rainfall (1154 mm) and days of rainfall over 1 mm per annum (156) [20]. Data from Church Lawford for the same period exhibited 674.8 mm annual rainfall and 121 days/year of rainfall over 1 mm. In addition, Coleshill presented 712.4 mm annual rainfall and 129 days/year of rainfall over 1 mm. Finally, Wellesbourne showed 614.8 mm annual rainfall and 114 days/year of rainfall over 1 mm (see Table 1).

Table 1.
Historical weather data for Coventry and its surrounding area, ranging between 1981 and 2010 [20].
It is important to put into context for this study, that climate change effects related to temperatures registered in the UK, especially affected the monitoring period of this study. The ten warmest years in the UK since 1884 have taken place between 2002 and 2019 as reported by the Met Office and also emphasised by the British Broadcasting Corporation (BBC) [21]. This time range covers the full period of monitoring for this field study, highlighting that the 7th warmest year on record was 2018, with July 2019 breaking the record for the hottest day ever recorded in the UK (38.7 °C in Cambridge).
2.2. Case Study: Swale and SuDS Treatment Train
The vegetated swale monitored in this research is part of a wider drainage system based in a SuDS treatment train, constructed in 2005, including an extensive green roof which drained into the swale through 3 downspouts (Figure 2). Then, this study could be considered as one of the reports presenting a larger service life for a swale, in an international study so far, considering the investigation of swales reported by Fardel et al. [10] in their review. The area drained by the swale consists of several differentiated sub-catchments depicted in Figure 2, with general characteristics presented in Table 2 as follows.
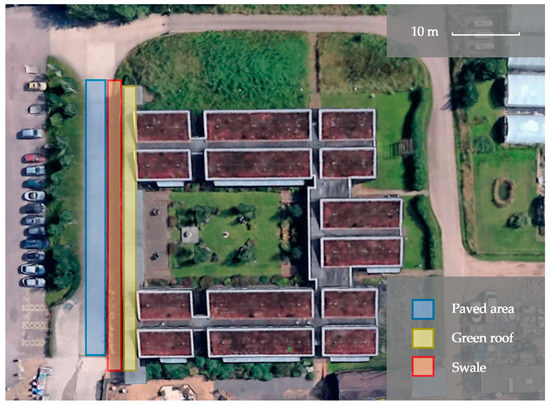
Figure 2.
Drainage area and downspouts draining the runoff from the adjacent extensive green roof.

Table 2.
Estimated areas of the sub-catchments of the drainage area and runoff coefficients from the contributing areas.
The vegetated swale is approximately 45.0 m length and 1.1 m wide at the bottom, with 1.0–1.5% slope, a trapezoidal cross-section, consisting of layers of natural soil and vegetation. The ponding zone is 0.6 m deep and 2:1 side slope (H:V) for a total of around 3.5 m width. Two 40 mm diameter pipes are placed at the discharge point which is further connected downstream to the River Avon.
The contributing area is 375.0 m2 (Table 2), divided into an impervious paved area (225.0 m2) and an extensive green roof (150.0 m2). The ratio between the contributing area and the vegetated swale is 2.4:1 with 42.3% of catchment being impervious (Table 2). These values are within the range of the usual swale area presented by Fardel et al. [10] in their study covering 59 swales internationally.
The average infiltration rate for a grassed swale is considered to be around 13 mm/h based on Ariza et al. [19] whilst the minimum threshold recommended is 2.7 mm/h by the Maryland Department of Environment [26]. The infiltration for the swale was characterised using a system to determine the time to drain the temporary ponding water under a no rainfall scenario, clogging of the discharge point and different water levels (Table 3). It is important to note that the values registered in Table 3 do not differentiate between evapotranspiration and infiltration, therefore accounting for both factors.

Table 3.
Determination of the average time to empty the temporary ponding in the vegetated swale.
A total of 19 events were analysed in the latest stage of the monitoring period presented in this research, resulting in an average ratio of 2.52 mm/h to empty the temporary ponding water in the vegetated swale. This data are close to that recommended by stormwater design manuals such as the Maryland Department of Environment [26].
2.3. Hydrological and Temperature Monitoring
Water level and surface temperature were registered at the discharge point of the vegetated swale, using an Orpheus Mini pressure probe for ground water and open water level measurements with an integrated temperature sensor (OTT Hydromet). The resolution provided is 0.1 °C for temperature and 0.05% FS accuracy for pressure (percentage of full scale), including a ±0.1%/year FS long-term stability. Data were collected at a 1 h interval. The monitoring period for the study was defined between the 21 June 2016 to the 30 September 2019, covering 3.25 years and 3 hydrological years (period defined between 1 October of one year and 30 September of the next by the United States Geological Survey).
Water level monitoring allowed the authors to determine the performance of the swale from a hydrological perspective, by identifying the temporary ponding produced by different storm events over the 3 hydrological years. This temporary ponding enabled the detection of those rainfalls that produce sufficient runoff to exceed the hydraulic capacity of the system, and overflow. The water levels used to pinpoint the 2 levels of hydraulic failure were defined as the diameter of the pipes placed at the discharge point (0.40 m), whilst flooding issues were depicted as those values recorded over the maximum ponding depth (0.60 m) (Figure 3). Then, those water level records registered above these threshold values, would mean that the system failed to cope with the storm event under one of the two levels of security considered.
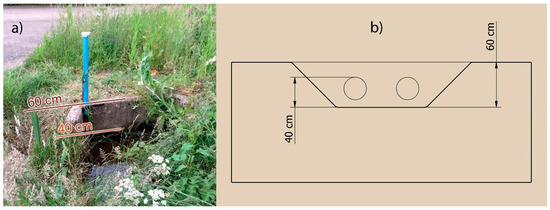
Figure 3.
Water levels of hydraulic failure indicated at the discharge point (a) and its cross section (b).
Storm events were isolated by using 6 h slots where no rainfall was recorded over 2.5 mm values [27]. The reason for choosing 2.5 mm as a minimum threshold lies in the minimum values required to wet the soil during a storm event; the first 2.5 mm of rainfall are not accounted for runoff volume. Interception considerations for swales in the UK SuDS Manual indicate 5 mm as the minimum threshold to isolate storm events liable to create runoff or to contribute to water ponding in the system [7]. Thus, the 2.5 mm value was selected for being more restrictive for the hydrological analyses.
This research presents a descriptive analysis over the 3 year period, plus a more detailed analysis during the 6 months when, on-site weather data were available. The isolation of storm events was possible during that time. Precipitation and temperature data provided for the rest of the monitoring period were given at daily intervals.
The seasonality effect is identified and described through a long-term hydrological and temperature monitoring over 3 hydrological years.
2.4. Climate Data Collection
The following weather stations shown in Table 4 were selected to collect weather data for this study for the period of time starting at the 21 June 2016 and ending at the 30 September 2019 (see location in Figure 1). The on-site weather station was used over 6 months of the monitoring period beginning to register data by the 1 February and ending on the 31 August 2019. Temperature data were collected from Church Lawford and Coundon, Coventry, whilst precipitation was obtained from Church Lawford, Finham and Draycote weather stations (Table 4).

Table 4.
Weather stations utilised in the study for the monitoring period of this research: 21 June 2019–30 September 2019. Source: UK Met Office.
A HOBO U30 NRC (Onset) weather station was used to collect weather data, such as wind speed, wind direction, solar radiation, relative humidity, barometric pressure, gust speed, dew point, air temperature and precipitation on-site. Precipitation and temperature were measured at a 1 min interval using a 0.2 mm resolution tipping-bucket rain gauge and a smart 12 bit temperature sensor, respectively.
Therefore, it is possible to distinguish 2 stages defined by the availability of the on-site weather station data. Weather data from the first 31 months were adjusted through the analysis carried out during the 6 months when data from all sources were available. The method utilised to calibrate the first 31 months followed the inverse distance weighted (IDW) interpolation method (Equation (1), which is described as a simplified way to obtain interpolate data when no weather station is available on-site [28]. More details are presented in Figure 1 regarding the location and Table 4 for the specific characteristics of the UK Met Office weather stations utilised in this method.
where:
- P: Precipitation data.
- D: Distance.
- W: Power factor.
Weighting coefficients (Table 4) were calculated for each of the UK Met Office’s weather station outputs, based on the accuracy of their values in relation to those available from the on-site weather station during the 6 months period with on-site data available.
This methodology provided the following calibrated weather data for the whole period of monitoring where the first 31 months followed the method of calculation showed above and the last 6 months used the data from the weather station located on-site (Figure 4).
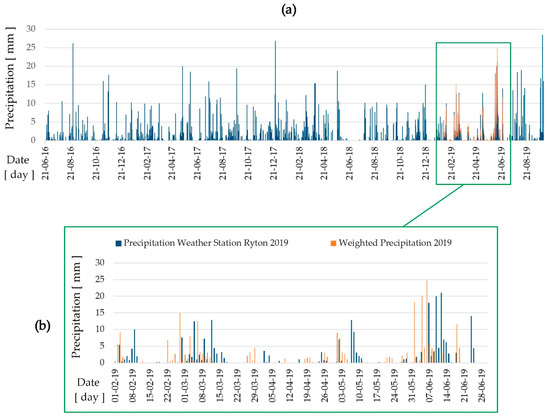
Figure 4.
Weather data at the experimental site for (a) the entire monitoring period and (b) the 6 months of calibration.
2.5. Operation and Maintenance over the Research Period
Between 2016 and 2019, the swale received only superficial reactive maintenance, consisting primarily of an autumnal cut of large vegetation such as the removal of weeds >300 mm in height and coppicing of saplings that had established in the swale. This reduced the visible growth in the winter periods, with an annual regrowth occurring the following spring. A change of ownership of the site occurred in early 2020, resulting in a clear cut and complete removal of vegetation on 3 February 2020 (see Figure 5).
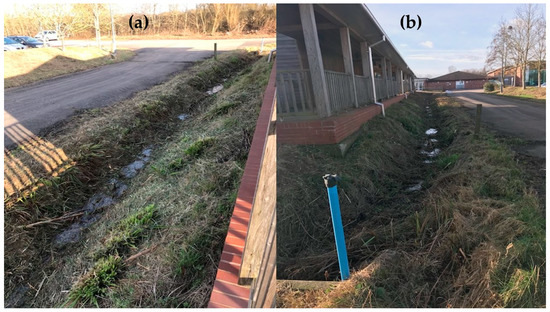
Figure 5.
Detail of the swale after complete removal of vegetation (February 2020): (a) South-west sight of the swale; (b) North-east view of the swale from the discharge point and the monitoring device.
The maintenance schedule allowed the growth of vegetation (see Figure 6) which involved a certain degree of biological evolution, potentially transforming the ecosystem service provided by the system. The removal of large vegetation could prevent out-competition of beneficial plants, such as those that support pollinators, but could limit the hydraulic attenuation of the swale by reducing evapotranspiration and vegetative obstacles to flow.
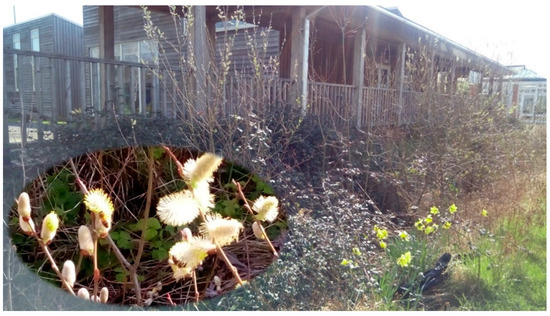
Figure 6.
Detail of the swale before maintenance works. Picture taken looking from North-east to South-west from the mid-point of the swale’s length in early Spring 2019.
Prior to the reactive maintenance, there was evidence that the swale had some biodiversity and ecosystem services value, with extensive bramble growth (Rubus fruticosus), goat willow (Salix caprea), bulrush (Typha latifolia), common nettle (Urtica dioica) and daffodil (Narcissus), as shown in Figure 5. Several species of grass were present, and the majority of the plants encountered were self-seeded, coming into the swale from vegetation adjacent to the swale. Authors noted several specimens of pollinating insect using the swale, including honeybees, bumble bees, hoverflies, butterflies and moths (Figure 6).
3. Results
The results in this paper are divided into three main sub-sections according to the specific objectives of the research: hydrological performance, temperature behaviour and operation and maintenance.
3.1. Hydrological Performance
Three hydrological years were monitored for this study, showing varying storm events from low values to storm events with peaks over 25 mm. Figure 7 shows the direct impact of the storm events on the hydrology of the vegetated swale, by the increment in the water level at the discharge point. It was possible to identify a repeated pattern in 2018 and 2019 for the water level in winter, especially between December and March where water levels ranged between 5 and 15 cm, with some peaks over 20 cm. However, the winter of 2019 shows an irregular performance with some valleys showing no detectable water level.
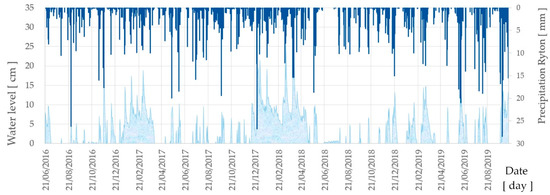
Figure 7.
Water level and rainfall registered during this research.
Summers indicated lower water levels from 0 to 10 cm (Figure 7) and many consecutive days with no temporary water standing in the swale. This long-term descriptive analysis allows the identification of those periods where the vegetated swale varies from dry swale to wet swale, including the identification of maintenance operations marking changes between grassed swale functions and the provision of wet land services with relevant growing of vegetation which will be described in the operation and maintenance sub-section (3.3).
Individual storm events were identified and isolated following the methodology described in previously in the paper and presented in Table 5, as follows over a 6 month period, being similar to the monitoring periods used by other researchers such as Lisenbee et al. [29].

Table 5.
Storm events captured during the 6 month period in 2019 and water level variations.
Maximum rainfall events were recorded around 25 mm, while the usual storm events were registered between 5 and 10 mm. The duration of the storm events lasted a few hours up to several days recording low intensity ratios (Table 5).
Table 6 presents those water levels registered in the vegetated swale that registered values over the threshold identified in the methodology, reaching one of the two levels or types of failure. Only one flooding issue was recorded during the 3 years of monitoring (November 2016). One hydraulic failure was identified in 2016. This pattern is repeated in 2017, with a further two events occurring in 2018 and none in 2019. This long-term monitoring allows the identification of potential emergency issues derived from high intensity storm events.

Table 6.
Data for the water levels reaching one of the two levels of failure: (a) hydraulic failure (0.40 –0.60 m); (b) flooding issue (>0.60 m).
3.2. Temperature Behaviour
Seasonality effects were captured in the field monitoring, being especially clear in the descriptive analysis of the temperatures, recorded in the surface of the vegetated swale. Air temperature also followed the same trend, with peaks in summer and valleys in winter (Figure 8).
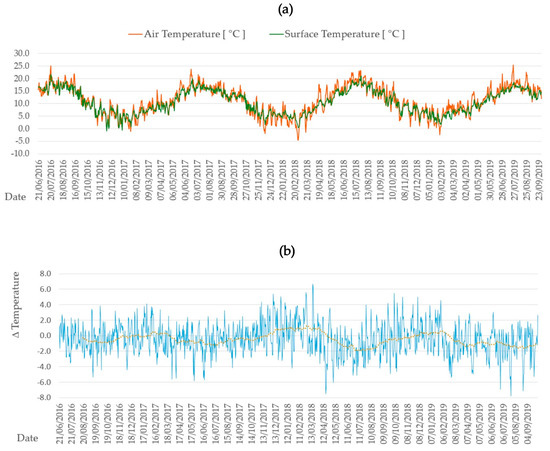
Figure 8.
(a) Surface water temperature (°C) and air temperature (°C) registered during the monitoring period; (b) temperature variation between the surface and the air.
This temperature behaviour presented in Figure 8, reinforces the idea of the design of greener SuDS, such as devices housing GSHP technologies, reported by Charlesworth et al. [14]. Rey-Mahía et al. [15], in their laboratory simulation of the combination of swales and GSHP technologies, presented a range of temperature performance that can be compared to this field study in order to find out whether this laboratory study could be applied to the swale in Ryton, Coventry, UK. Figure 8 shows that even in the worst scenario, represented by air temperature falling below 0 °C several times over the 3 year period of the study (nearly −5 °C in early 2018 as the lowest temperature registered during the monitoring period), the surface temperature for the swale maintained consistent values above 0 °C, temperatures which would be expected to be even higher in the ground below the swale surface. Consequently, the GSHP system could work continuously. Following on from this potential application, the swale surface registered mean temperature values around 5 °C in winter and 17 °C in summer, providing future studies with valuable information to feed their simulations and modelling investigations.
Figure 8 shows that the difference in temperature between the surface of the swale, and the air is pronounced, with much greater extremes in the air temperature. This difference reaches 4–6 °C with peaks up to 8 °C in the summer period. On the other hand, the variation is positive towards the surface in winters, reaching 1–2 °C of difference, being between 4 and 6 °C in the most favourable cases. This is another point of interest for researchers regarding the consistency of the temperature variation between the air and the swale, considering the climatic conditions for this study. In addition, this data could be of particular relevance to local authorities looking to reduce the urban heat island (UHI) effect in urban environments through the implementation of SuDS techniques. In the case of this swale, the temperature behaviour provided by the system was consistent and robust. No high extreme values were registered for the temperature of the swale surface despite the fact that the UK had some of its warmer summers during this monitoring period, as described in Section 2.1.
3.3. Operation and Maintenance
Operation and maintenance are key factors of the hydrological performance and pollutant removal efficiency of vegetated swales, as also reported by Horstmeyer et al. [30] and Johnson and Hunt [31] regarding other related popular stormwater practices in sub-urban areas such as bioretention.
Following on from Section 2 regarding maintenance, operation and maintenance activities—described in stormwater manuals and guides internationally such as Woods Ballard et al. [7], the Maryland Department of Environment [26], the North Carolina Department of Environmental Quality [32]—are compared with those carried out in the current research, putting this report into a wider context. The vegetative swale lacked any kind of short or medium term maintenance. Consequently, maintenance such as the removal of litter and debris, inspection of potential blockage in inlets and outlets, silt accumulation, vegetation coverage, removal of nuisance plants and grass cutting, amongst others, which are required on a monthly or annual basis, were not conducted.
No sediments were removed from the swale, resulting in a silt build-up of 2 cm at the discharge point over the entire period of monitoring. This silt accumulation was confirmed by the pressure sensor measuring the water level during dry periods with no water in the swale. The device was installed 4 cm over the surface of the swale, ending only at 2 cm over the surface, after 3 years of operation.
In conclusion, all maintenance was related to remedial activities after a problem was identified and was usually carried out once a year.
This research emphasises the need for further biological studies and their interaction with hydrological processes as well as temperature in the context of climate change and pandemic scenarios where maintenance could be limited.
4. Discussion
The discussions for this study include descriptions of the limitations faced by this research, as well as the main discussions identified from the results and the future research directions, recommended to fully depict the hydrological performance of vegetated swales under Cfb climate conditions and their impact on a wider SuDS treatment train.
4.1. Limitations of the Study
The investigation presented in this paper evolved under a series of limitations which are relevant to the discussion of the results obtained. The main limitation refers to site conditions, due to the lack of information about the design and construction of the vegetated swale, which forced the research team to undertake forensic engineering to unveil on-site characteristics.
Secondly, the equipment available to develop this research, which started in 2016 with a pressure sensor to measure the water level at the discharge point, only being enhanced in early 2019 with the purchase of a weather station installed in Ryton. These issues limited the investigation to reconstructing weather data for the first 31 months by utilising nearby weather stations from the UK Met Office network. In addition, the research did not have flow meters available to be installed in the inlet of the downspout into the swale to measure the volumes entering the swale, losing the opportunity to carry out a wider study considering the whole treatment train. This problem could be solved in the future through modelling and calibration, which is under development.
Finally, this study defines the long-term hydrological and temperature performance of a vegetated swale under a Cfb climate and a mixed rural and peri-urban environment. This study can be compared to those developed across the world under the same conditions.
4.2. Main Discussion and Future Research Directions
Once the limitations have been described as a framework for the results, the discussion is provided below, also allowing for the identification of future lines of investigation.
- Development of long-term hydrological and temperature models, through modelling and calibration, as added value for the results obtained so far in this descriptive long-term analysis. This would allow researchers and practitioners working under Cfb climates to organise monitoring, operation and maintenance activities through the operational life of the system. This future research line also contributes to strengthening the findings from McCarthy et al. [13] and Lisenbee et al. [29], regarding the minimum number of storm events needed to deliver reliable monitoring data.
- Laboratory based modelling of the swale with scenarios of recent maintenance. This aspect would help to feed modelling parameters where field study is not possible, improving the quality of the predictive models based on real data from the field.
- Obtaining biological models which would allow for the implementation of biological evolution such as vegetation growth and plant science parameters and analyses through modelling, coupling this data to that recorded on-site for this study, which is in line with the findings from Gavrić et al. [16].
- Implement evapotranspiration measures, studying its behaviour depending on the biological evolution and maintenance operations of the vegetated swale.
- This study develops a new research line on the potential design of vegetated swales housing GSHP elements, as this field study describes the long-term temperature performance of a vegetated swale with temporary ponding, being similar to the wet swale design studied in the laboratory by Rey-Mahía et al. [15] which included wet swales with a permanent water level.
- This study will continue to produce data in the following years, becoming one of the few genuine long-term studies developed in the field for the understanding of vegetated swales and their connectivity to other SuDS elements, as well as from a biological evolution stand-point.
- Develop this study under different climatic areas and different environments from rural environments such as transportation infrastructure and consolidated urban environments. This study is one of the few investigations developed in the long-term under these particular conditions—alongside Andrés-Valeri et al. [33].
5. Conclusions
This study reinforces the need for further long-term monitoring of the hydrological performance of vegetated swales in the field. There is a relevant knowledge gap related to the understanding of the biological evolution of such systems under varying scenarios of operation and maintenance. The work presented in this paper demonstrates the evolution of the system from a simple grassed-vegetated swale into a system that could be described as an emerging wetland, under a scenario with no maintenance activities over a year. This is relevant to scenarios in a changing climate, but also during potential lockdown scenarios, such as that faced during COVID-19, where maintenance activities are limited and non-controlled vegetation growth, as well as reduced maintenance budgets, could be a common scenario.
This study represents one of the largest studies presenting data from three complete hydrological years and 19 storm events captured for detailed analysis during the 6 months stage where on-site weather data were available. Therefore, resulting in a longer period than other significant studies recently published such as those by Leroy et al. [34], Purvis et al. [12], Lisenbee et al. [29] and Andrés-Valeri et al. [33], amongst others.
The ratio to empty temporary water ponding in the vegetated swale ranged from 0.77 mm/h up to 5.00 mm/h for an average of 2.52 mm/h according to stormwater manuals [26] which makes this swale representative as a case study. A total of 19 storm events were identified and isolated in 2019 showing varying storm events with peaks reaching around 25 mm, lasting from hours to several days. The hydraulic performance varied as shown by the water level variations recorded. The monitoring identified the seasonality effect both in precipitation and temperatures, as well as the effect of hot summers; the latter being also highlighted by the previous literature for the specific case of the UK.
Long-term monitoring allows for the identification of recurring storm events which cause potentially hazardous water levels in the vegetated swale, which can activate hydraulic or flooding failures.
Vegetated swales have the capability to incorporate rich biodiversity from the surrounding natural environment in rural areas, such as local plant species and a varied range of pollinator insects, as described in this research under long-term field monitoring.
Vegetated swales serve as thermal regulators, due to their capacity to provide higher surface temperatures than the air temperature in winter and the opposite in summer, providing lower temperatures than the air. This research supports the findings of Rey-Mahía et al. [15] in the laboratory, opening the door for the use of GSHP elements embedded in their cross-section, to heat and cool nearby buildings.
Author Contributions
Conceptualization, L.A.S.-F. and S.J.C.; methodology, L.A.S.-F., J.R.-G., and S.J.C.; software, J.R.-G.; validation, L.A.S.-F. and J.R.-G.; investigation, L.A.S.-F., J.R.-G., S.J.C., E.B.-C., C.R.-M., F.P.Á.-R. and C.L.; resources, L.A.S.-F., S.J.C., J.R.-G. and C.L.; data curation, J.R.-G. and E.B.-C.; writing—original draft preparation, L.A.S.-F. and J.R.-G.; writing—review and editing, S.J.C. and C.L.; supervision, L.A.S.-F., F.P.Á.-R. and S.J.C.; project administration, L.A.S.-F. and F.P.Á.-R.; funding acquisition, L.A.S.-F., S.J.C., and F.P.Á.-R. All authors have read and agreed to the published version of the manuscript.
Funding
This research was funded by Coventry University through the project “Investigation of Green Infrastructure as a combined technique for Bioretention, Flood Resilience and Renewable Energy” and the FICYT through the GRUPIN project, grant number IDI/2018/000221, co-financed with EU FEDER funds.
Acknowledgments
The authors wish to acknowledge the Centre for Agroecology, Water and Resilience (CAWR), Coventry University, for the administrative support, and Garden Organics for allowing the access to the whole experimental site. The authors acknowledge the information provided by the National Meteorological Library and Archive, Met Office, UK (© Crown Copyright 2020). Thanks to Tempcon Instrumental Ltd. and OTT Hydrometry Ltd. for supplying the monitoring equipment. Thanks to Anne-Marie McLaughlin and Milena Tulencic who helped in the installation of the pressure probe and the cleaning of the discharge point of the swale back in 2016.
Conflicts of Interest
The authors declare no conflict of interest. The funders had no role in the design of the study; in the collection, analyses, or interpretation of data; in the writing of the manuscript, or in the decision to publish the results.
References
- Fletcher, T.D.; Shuster, W.; Hunt, W.F.; Ashley, R.; Butler, D.; Arthur, S.; Trowsdale, S.; Barraud, S.; Semadeni-Davies, A.; Bertrand-Krajewski, J.L.; et al. SUDS, LID, BMPs, WSUD and more—The evolution and application of terminology surrounding urban drainage. Urban Water J. 2015, 12, 525–542. [Google Scholar] [CrossRef]
- Rezaei, A.R.; Ismail, Z.; Niksokhan, M.H.; Dayarian, M.A.; Ramli, A.H.; Shirazi, S.M. A quantity-quality model to assess the effects of source control stormwater management on hydrology and water quality at the catchment scale. Water 2019, 11, 1415. [Google Scholar] [CrossRef]
- Woznicki, S.A.; Hondula, K.L.; Jarnagin, S.T. Effectiveness of landscape-based green infrastructure for stormwater management in suburban catchments. Hydrol. Processes 2018, 32, 2346–2361. [Google Scholar] [CrossRef]
- Shafique, M.; Kim, R.; Kyung-Ho, K. Evaluating the capability of grass swale for the rainfall runoff reduction from an Urban parking lot, Seoul, Korea. Int. J. Environ. Res. Public Health 2018, 15, 537. [Google Scholar] [CrossRef]
- Young, B.N.; Hathaway, J.M.; Lisenbee, W.A.; He, Q. Assessing the runoffreduction potential of highway swales and WinSLAMM as a predictive tool. Sustainability 2018, 10, 2871. [Google Scholar] [CrossRef]
- Avery, L.M. Rural Sustainable Drainage Systems (RSuDS); Environment Agency: Bristol, UK, 2012; ISBN 9781849112772.
- Ballard, B.W.; Wilson, S.; Udale-Clarke, H.; Illman, S.; Scott, T.; Ashley, R.; Kellagher, R. The SuDS Manual; North Carolina State University CIRIA, Griffin Court: London, UK, 2015; p. 968. [Google Scholar]
- Abrahams, J.; Coupe, S.; Sañudo-Fontaneda, L.; Schmutz, U. The Brookside Farm Wetland Ecosystem Treatment (WET) System: A Low-Energy Methodology for Sewage Purification, Biomass Production (Yield), Flood Resilience and Biodiversity Enhancement. Sustainability 2017, 9, 147. [Google Scholar] [CrossRef]
- Winston, R.; Hunt, W.F.; Kennedy, S.; Wright, J. Evaluation of Permeable Friction Course (PFC), Roadside Filter Strips, Dry Swales, and Wetland Swales for Treatment of Highway Stormwater Runoff; North Carolina State University: Raleigh, NC, USA, 2011; p. 110. [Google Scholar]
- Fardel, A.; Peyneau, P.-E.; Béchet, B.; Lakel, A.; Rodriguez, F. Analysis of swale factors implicated in pollutant removal efficiency using a swale database. Environ. Sci. Pollut. Res. 2019, 26, 1287–1302. [Google Scholar] [CrossRef]
- Hunt, W.F.; Fassman, E.A.; Winston, R.J. NCSU Urban Waterways Factsheet: Designing Dry Swales for the Water Quality Event; 2016, Extension Fact Sheets, Guidebooks & Design Bulletins - Urban Waterways Series (Stormwater BMP Design Bulletins)’ website. Available online: https://stormwater.bae.ncsu.edu/resources/ (accessed on 13 September 2020).
- Purvis, R.A.; Winston, R.J.; Hunt, W.F.; Lipscomb, B.; Narayanaswamy, K.; McDaniel, A.; Lauffer, M.S.; Libes, S. Evaluating the hydrologic benefits of a bioswale in Brunswick County, North Carolina (NC), USA. Water 2019, 11, 1291. [Google Scholar] [CrossRef]
- McCarthy, D.T.; Zhang, K.; Westerlund, C.; Viklander, M.; Bertrand-Krajewski, J.-L.; Fletcher, T.D.; Deletic, A. Assessment of sampling strategies for estimation of site mean concentrations of stormwater pollutants. Water Res. 2018, 129, 297–304. [Google Scholar] [CrossRef]
- Charlesworth, S.M.; Faraj-Llyod, A.S.; Coupe, S.J. Renewable energy combined with sustainable drainage: Ground source heat and pervious paving. Renew. Sustain. Energy Rev. 2017, 68, 912–919. [Google Scholar] [CrossRef]
- Rey-Mahía, C.; Sañudo-Fontaneda, L.A.; Andrés-Valeri, V.C.; álvarez-Rabanal, F.P.; Coupe, S.J.; Roces-García, J. Evaluating the thermal performance ofwet swales housing ground source heat pump elements through laboratory modelling. Sustainability 2019, 11, 3118. [Google Scholar] [CrossRef]
- Gavrić, S.; Leonhardt, G.; Marsalek, J.; Viklander, M. Processes improving urban stormwater quality in grass swales and filter strips: A review of research findings. Sci. Total Environ. 2019, 669, 431–447. [Google Scholar] [CrossRef] [PubMed]
- Williams, J.B.; Jose, R.; Moobela, C.; Hutchinson, D.J.; Wise, R.; Gaterell, M. Residents’ perceptions of sustainable drainage systems as highly functional blue green infrastructure. Landsc. Urban Plan. 2019, 190, 103610. [Google Scholar] [CrossRef]
- Lähde, E.; Khadka, A.; Tahvonen, O.; Kokkonen, T. Can we really have it all?—Designing multifunctionality with sustainable urban drainage system elements. Sustainability 2019, 11, 1854. [Google Scholar] [CrossRef]
- Ariza, S.L.J.; Martínez, J.A.; Muñoz, A.F.; Quijano, J.P.; Rodríguez, J.P.; Camacho, L.A.; Díaz-Granados, M. A multicriteria planning framework to locate and select sustainable urban drainage systems (SUDS) in consolidated urban areas. Sustainability 2019, 11, 2312. [Google Scholar] [CrossRef]
- UK Met Office. UK Climate Averages. Coventry (West Midlands Conurbation). Available online: https://www.metoffice.gov.uk/research/climate/maps-and-data/uk-climate-averages (accessed on 12 August 2020).
- McGrath, M. Climate Change: UK’s 10 Warmest Years All Occurred since 2002. British Broadcasting Corporation Science Environment. 2019. Available online: https://www.bbc.com/news/science-environment-49167797 (accessed on 13 September 2020).
- Hou, L.; Wang, Y.; Shen, F.; Lei, M.; Wang, X.; Zhao, X.; Gao, S.; Alhaj, A. Study on Variation of Surface Runoff and Soil Moisture Content in the Subgrade of Permeable Pavement Structure. Adv. Civ. Eng. 2020, 2020, 8836643. [Google Scholar]
- Baryła, A.; Karczmarczyk, A.; Bus, A. Role of substrates used for green roofs in limiting rainwater runoff. J. Ecol. Eng. 2018, 19, 86–92. [Google Scholar] [CrossRef]
- Palermo, S.A.; Turco, M.; Principato, F.; Piro, P. Hydrological effectiveness of an extensive green roof in Mediterranean climate. Water 2019, 11, 1378. [Google Scholar] [CrossRef]
- Hill, J.; Drake, J.; Sleep, B.; Margolis, L. Influences of four extensive green roof design variables on stormwater hydrology. J. Hydrol. Eng. 2017, 22, 4017019. [Google Scholar] [CrossRef]
- Maryland Department of Environment. Maryland Stormwater Design Manual, Vols. I and II; Maryland Department Of The Environment Water Management Administration: Washington, DC, USA, 2000.
- Iowa Department of Natural Resources. Iowa Storm Water Management Manual; Iowa Department of Natural Resources: Des Moines, IA, USA, 2009.
- Chen, T.; Ren, L.; Yuan, F.; Yang, X.; Jiang, S.; Tang, T.; Liu, Y.; Zhao, C.; Zhang, L. Comparison of spatial interpolation schemes for rainfall data and application in hydrological modeling. Water 2017, 9, 342. [Google Scholar] [CrossRef]
- Lisenbee, W.; Hathaway, J.; Negm, L.; Youssef, M.; Winston, R. Enhanced bioretention cell modeling with DRAINMOD-Urban: Moving from water balances to hydrograph production. J. Hydrol. 2020, 582, 124491. [Google Scholar] [CrossRef]
- Horstmeyer, N.; Huber, M.; Drewes, J.E.; Helmreich, B. Evaluation of site-specific factors influencing heavy metal contents in the topsoil of vegetated infiltration swales. Sci. Total Environ. 2016, 560–561, 19–28. [Google Scholar] [CrossRef] [PubMed]
- Johnson, J.P.; Hunt, W.F. A retrospective comparison of water quality treatment in a bioretention cell 16 years following initial analysis. Sustainability 2019, 11, 1945. [Google Scholar] [CrossRef]
- North Carolina Department of Environmental Quality. C-11. Treatment Swale; North Carolina Department of Environmental Quality Stormwater BMP Manual; North Carolina Department Environmental Quality: Raleigh, NC, USA, 2017; p. 5.
- Andrés-Valeri, V.C.; Castro-Fresno, D.; Sañudo-Fontaneda, L.A.; Rodriguez-Hernandez, J. Comparative analysis of the outflow water quality of two sustainable linear drainage systems. Water Sci. Technol. 2014, 70, 1341–1347. [Google Scholar] [CrossRef] [PubMed]
- Leroy, M.-C.; Portet-Koltalo, F.; Legras, M.; Lederf, F.; Moncond’huy, V.; Polaert, I.; Marcotte, S. Performance of vegetated swales for improving road runoff quality in a moderate traffic urban area. Sci. Total Environ. 2016, 566–567, 113–121. [Google Scholar] [CrossRef] [PubMed]
© 2020 by the authors. Licensee MDPI, Basel, Switzerland. This article is an open access article distributed under the terms and conditions of the Creative Commons Attribution (CC BY) license (http://creativecommons.org/licenses/by/4.0/).