Abstract
The isotope composition of precipitation has been monitored in monthly precipitation at Zagreb, Croatia, since 1976. Here, we present a statistical analysis of available long-term isotope data (3H activity concentration, δ2H, δ18O, and deuterium excess) and compare them to basic meteorological data. The aim was to see whether isotope composition reflected observed climate changes in Zagreb: a significant increase in the annual air temperature and larger variations in the precipitation amount. Annual mean δ18O and δ2H values showed an increase of 0.017‰ and 0.14‰ per year, respectively, with larger differences in monthly mean values in the first half of the year than in the second half. Mean annual d-excess remained constant over the whole long-term period, with a tendency for monthly mean d-excess values to decrease in the first half of the year and increase in the second half due to the influence of air masses originating from the eastern Mediterranean. Changes in the stable isotope composition of precipitation thus resembled changes in the temperature, the circulation pattern of air masses, and the precipitation regime. A local meteoric water line was obtained using different regression methods, which did not result in significant differences between nonweighted and precipitation-weighted slope and intercept values. Deviations from the Global Meteoric Water Line GMWL (lower slopes and intercepts) were observed in two recent periods and could be explained by changes in climate parameters. The temperature gradient of δ18O was 0.33‰/°C. The tritium activity concentrations in precipitation showed slight decreases during the last two decades, and the mean A in the most recent period, 2012–2018, was 7.6 ± 0.8 Tritium Units (TU).
1. Introduction
Water, especially groundwater, has become an invaluable natural resource, and the availability of freshwater is one of the greatest issues facing mankind today [1]. A consistent and careful assessment and management of water resources is crucial for their sustainable development. This can be performed by various methodologies, among which isotope methods using environmental (stable and radioactive) and artificial radioactive isotopes have proven to be effective tools for solving many critical hydrological problems and processes [2,3,4,5,6,7,8,9]. In many cases, isotope techniques have provided information that could not be obtained through any other conventional means [10,11,12].
Isotopes that are constituent elements of a water molecule are of special interest as perfect candidates for water tracers: hydrogen (1H, 2H, 3H) and oxygen (16O, 17O, 18O) isotopes. Among these, only 3H is a radioactive isotope, while the others are stable isotopes.
Precipitation presents an input to groundwater, and therefore knowledge on the isotope composition of precipitation is a prerequisite for groundwater studies. Temporal and spatial patterns of isotopes in precipitation (expressed as δ2H and δ18O values and the tritium activity concentration, A) have been observed since the 1950s and have contributed to hydrological and hydrogeological research [13,14,15,16], climate and paleoclimate studies [4,15,17,18,19,20,21,22], and ecological research [23,24,25]; further, precipitation isotope mapping has been widely implemented during recent decades [25,26].
The International Atomic Energy Agency (IAEA) and the World Meteorological Organization (WMO) have recognized the importance of the isotopic composition of precipitation on a global scale. A program involving the worldwide monitoring of the isotopic composition of monthly precipitation (called the Global Network of Isotopes in Precipitation (GNIP)) was therefore established in 1961. The objective of the network was a systematic collection of data on the isotopic composition of precipitation across the globe to determine temporal and spatial variations of isotopes in precipitation. Isotopic data include the tritium activity concentration, A (expressed in tritium units, TU), and stable isotopes of hydrogen and oxygen isotopes (δ2H and δ18O values), as well as climatological data (mean monthly temperature, monthly precipitation amount, and atmospheric water vapor pressure) [27]. The collected records have enabled the establishment of seasonal variations and various correlations among the data. Seasonal variations in δ18O and δ2H values of precipitation and their weighted mean annual values have remained fairly constant from year to year at a given location as long as the annual range and sequence of climatic conditions did not change significantly from year to year.
However, in recent years, we have become aware of climatic changes that have caused an increase in global temperature and changes in the precipitation pattern, as well as severe and extreme weather events (droughts, heavy storms, and temperature records). The recent increase in global temperature has exceeded the natural variabilities during the Holocene [28]. The planet’s average surface temperature has risen about 1 °C (between 0.8 °C and 1.2 °C [29]) since the late 19th century, a change driven largely by increased carbon dioxide and other human-made emissions into the atmosphere. Most of the warming has occurred in the past 35 years, with 16 of the 17 warmest years on record occurring since 2001. The 10 hottest years ever recorded have all occurred since 1998 [30]. The hottest years on record globally have been the last five (2014–2018), with 2016 being the hottest year [31], and eight months in 2016 (from January through September, except for June) were the warmest on record for those respective months. October, November, and December of 2016 were the second warmest of those months on record: in all three cases, behind records set in 2015. Correlations between the precipitation isotope ratios recorded in the GNIP and meteorological quantities may provide additional evidence of recent climate change that appears to have manifested globally as well as evidence of the local weather situation. To find such evidence, one should have sufficiently long records of both climate data and the isotopic composition of precipitation.
Monitoring of the isotope composition of monthly precipitation at a station in Zagreb (Croatia) has been performed since 1976 (tritium activity concentration, A) and since 1980 (stable isotope ratios of hydrogen (2H/1H) and oxygen (18O/16O)). Isotope data up to 2003 are available in the GNIP database [27]. This work presents details on the history of monitoring the isotope composition of precipitation in Zagreb, Croatia, for the period 1976–2018. Such series of isotope data are rather scarce in Europe [27], and the present time series analysis can be a first step toward a more detailed comparison of data reported for sites with similar long-term records, such as Vienna (Austria), Krakow (Poland), and Ljubljana (Slovenia), in order to obtain a wider spatial and temporal pattern of the isotope composition of precipitation. Statistical analyses of isotope (δ2H, δ18O, deuterium excess, and tritium activity concentration) and basic meteorological data (temperature and precipitation amount) were performed. The complete 43-year-long record was divided into subperiods in order to better investigate climatological and isotope-in-precipitation changes. Subperiods should be neither too long nor too short, so we arbitrarily chose four almost equally long subperiods: 1976–1985, 1986–1995, 1996–2006, and 2007–2018.
In the following section, we introduce the notation (δ2H, δ18O) used for stable isotope composition as well as the concepts of meteoric water lines and deuterium excess. We describe the behavior of tritium activity concentration in the atmosphere and give a brief description of measurement techniques that have changed during the studied period. An overview of sampling locations of monthly precipitation in Croatia and climate characteristics of the area are presented, which will help in discussing the data from Zagreb. In Section 3, we show the results of the monthly data, while in Section 4, we present a discussion of the statistical analyses of the annual data and average values in the subperiods, the observed temporal trends, and various correlations among the data. We discuss how the observed temperature and precipitation amount changes were recorded in the isotopic composition of precipitation in Zagreb.
2. Materials and Methods
2.1. Stable Isotopes of Hydrogen and Oxygen
The isotopic composition of water constituents depends on isotope fractionation caused by phase transfers of water masses (evaporation/precipitation), which depend on the area of water origin (latitude, altitude, continent or maritime, climate region) and the precipitation amount [2,4,32,33,34]. Therefore, the isotopic composition of precipitation of different origins and seasons provides for the application of stable water isotopes as tracers of the hydrological cycle.
The results are reported as δ-values per mill (‰) relative to the standard [4,35,36,37,38]:
Here, RSample and RReference stand for the isotope ratio (R = 2H/1H and R = 18O/16O) in the sample and the reference material (standard), respectively. Standard mean ocean water, SMOW, has been proposed as a (virtual) standard for reporting measured values [39]. SMOW is an arbitrary mean value based on the Epstein–Mayeda oxygen scale obtained from deep ocean water, since it does not interact with the atmosphere and has a stable isotopic composition [40], and it is defined in terms of an actual water reference standard, the NBS-1 (National Bureau of Standards, USA). In 1968, the IAEA established an international standard, the Vienna SMOW (VSMOW), which has been replaced by the VSMOW2 [38,41].
The δ2H and δ18O isotopic compositions of meteoric waters (precipitation and atmospheric water vapor) are strongly correlated. If δ2H is plotted versus δ18O, the data cluster along a straight line is
δ2H = 8.0∙δ18O +10.
The relation in Equation (2) is referred to as the global meteoric water line (GMWL) [2,39,42]. It describes the general relation between δ2H and δ18O on a global scale reasonably well. However, the intercept is higher for precipitation originating from the Mediterranean area [2,4,43,44,45], while the slope does not change, as in the case of the eastern Mediterranean meteoric water line, δ2H = 8 δ18O + 22 [43]. This example shows that for applications in hydrogeological studies, regional local meteoric water lines (LMWLs), either long-term or for certain shorter periods, can be more appropriate. Generally, an LMWL has the form δ2H = a δ18O + b, where a is the slope and b is the intercept. LMWLs can differ from the GMWL in terms of both the slope and intercept values, depending on the conditions for forming a local water source [1,4,46,47]. There are different ways of calculating a- and b-values. Traditionally, the ordinary least squares regression (OLSR) is used, and more recently, the reduced major axis regression (RMA) and the major axis least squares regression (MA, sometimes also called the orthogonal regression) [48,49] have been applied. The precipitation-weighted OLSR approach (PWLSR) was introduced to reduce the impact of small precipitation events that are hydrogeologically not significant [49]. Similarly, precipitation-weighted RMA and MA, i.e., PWRMA and PWMA, regressions have been applied to data from the GNIP database, with at least 36 monthly datapoints available [48].
Deuterium excess (d-excess, or d) is defined as [2]
which can be related to the meteorological conditions in the source region from which the water vapor is obtained [1,4,35,43,46]; therefore, it can be used to identify vapor source regions, and it is often considered to be the most useful parameter in characterizing vapor origin [43]. Winter precipitation originating from the Mediterranean Sea is characterized by distinctly higher d-excess values (d > 18‰) than is precipitation coming from the Atlantic (d ~ 10‰), reflecting the specific source conditions during water vapor formation. Increased deuterium excess in precipitation can also arise from a significant addition of re-evaporated moisture from continental basins to water vapor traveling inland [1,4,27,35,44,45,46,50,51].
d = δ2H − 8 δ18O,
2.2. Tritium
Tritium (3H) is a natural cosmogenic isotope of hydrogen that is formed in the upper atmosphere through reactions of thermal neutrons with 14N. It oxidizes to tritiated water, H3HO, and thus enters the natural water cycle. The half-life of 3H is 12.32 years [52], and it decays to 3He by emitting beta particles with a maximal energy of 18.6 keV.
Tritium is also an anthropogenically produced isotope, and it can be differentiated as “bomb-produced” tritium and technogenic tritium. Massive injections of 3H from weapons tests in the 1950s and 1960s, mostly in the Northern Hemisphere, caused an almost 100-fold increase in the tritium activity concentration in precipitation [1], known as the bomb peak. The highest concentration of tritium, about 6000 TU (1 TU = 0.118 Bq/l), was observed in 1963 in precipitation at continental stations in the Northern Hemisphere [1,27,53], while at maritime stations, the maximal values were lower (about 2000 TU). The data at the marine stations were systematically lower than at the continental stations because moisture evaporated from the ocean has a low 3H activity concentration due to the long residence time of water in the ocean. After the cessation of atmospheric nuclear weapons tests, a gradual decrease in 3H activity concentration at all stations in both hemispheres was observed due to natural decay and the washout of tritium into the oceans and groundwater. The levels of tritium have declined globally and regionally, approaching the natural pre-bomb level. The pre-bomb natural tritium activity concentration is assumed to be about 1 TU in oceanic regions, about 10 TU in inland areas, about 5 TU in central Europe [1], and about 5 TU on average globally [54]. Monitoring of the tritium level in precipitation at several short-distance stations showed that there was no significant systematic discrepancy between them [1]. The “anthropogenically modified natural distributions” present now are “new natural global” environmental levels.
Technogenic tritium is produced in various industries, such as nuclear power plants, nuclear reactors, future fusion reactors, fuel reprocessing plants, heavy water production facilities, medical diagnostics, radiopharmaceuticals, luminous paints, sign illumination, self-luminous aircraft, airport runway lights, luminous dials, and gauges and wrist watches [55,56,57,58]. Technogenic tritium causes deviations from the “anthropogenically modified natural tritium distribution” at a local or regional level.
The seasonal and spatial distribution of tritium activity concentration in precipitation around the globe has been found to be dominated by the annual stratosphere–troposphere exchange at high latitudes in early spring, in combination with latitudinal and continental effects [1]. The latitude effect is described as the highest 3H activity concentrations observed between the 30th and 60th parallel, with values lower by a factor of approximately five at low-latitude and tropical stations.
It should be noted that the seasonal variations in 3H activity concentration in precipitation do not have the same origin as the seasonal variations in δ2H and δ18O: variations in 3H are caused by the exchange between the stratosphere and the troposphere and are not caused or influenced by the temperature, while the local seasonal variations in δ2H and δ18O show a close relation with the local temperature [1,2,4,47].
2.3. Sampling Sites and Climate
There are three main climate types prevailing in Croatia: continental, maritime, and mountain. Such a climate distribution is determined by the geographical position of Croatia in the northern midlatitudes and the corresponding weather processes. Croatia is a relatively small country (56,594 km2) positioned between the Pannonian Plain and the Adriatic Sea and has a large orographic variety. Therefore, the most important climate modifiers are the Adriatic Sea in the southwest, the mountain chain Dinarides in the central part, and openness to the Pannonian plain in the northeast [59]. Accordingly, most of Croatia has a temperate rainy climate (Köppen code Cxx [60,61]). For example, the Zagreb climate zone is described as Cfb: a temperate climate without a dry season and with a warm summer. The highest mountain areas have a cold snow and forest climate (Köppen code Dxx). The complete designation of climates for particular sampling sites is presented in Table S1 (Supplementary Materials). A comparison of the 30-year period 1981–2010 to the standard climatological period, 1961–1990, showed a significant increase in the mean annual temperature at all 20 studied stations in Croatia, with stronger warming at the continental stations than along the coast and with the largest changes in the summer [59]. It was also noted that both minimal and maximal temperatures increased by larger amplitudes inland compared to along the coast. The precipitation pattern has also changed, but differently in different parts of Croatia: an increase in the precipitation amount has been observed inland, with a statistically significant increase in autumn [59]. The observed climate changes (temperature increase and the precipitation regime) have resulted in changes in climate classes for some stations. The stations with isotope-in-precipitation data for which the climate class changed are Dubrovnik and Zadar (from Cfa to Csa) and Puntijarka on Mt. Medvednica, near Zagreb (from Dfb to Cfb) (Table S1).
A long-term isotopes-in-precipitation record (1976–2018) exists in Croatia only for the Zagreb station [27,47,62] (although microlocations have changed, as will be explained later). Data for some other stations with shorter monitoring periods were obtained during various individual projects (location numbers 1 to 12, Figure 1) [18,47,62,63,64,65,66,67,68]. Details on sampling sites are presented in Table S1. Some projects have also included monitoring at stations in Slovenia (location numbers 13 to 15, Figure 1), e.g., in Ljubljana [47,62,69,70,71], Portorož, and Kozina [47,72,73].
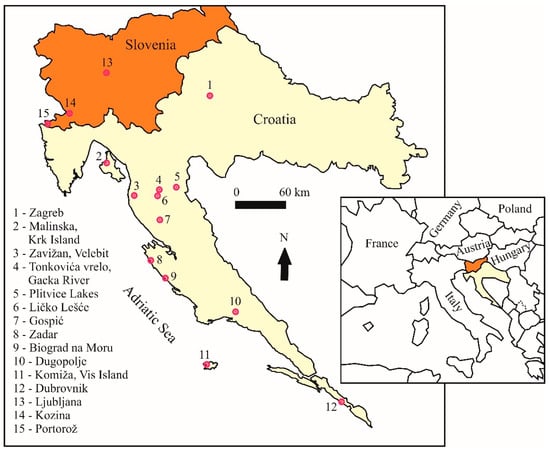
Figure 1.
Map of stations with isotope-in-precipitation data in Croatia (locations 1–12) and in Slovenia (locations 13–15). Details on stations are in Table S1.
Precipitation monthly composite samples for the Zagreb station were collected at the Ruđer Bošković Institute (RBI, 45.817° N, 15.967°, 165 m a.s.l.) from 1976 until 1995. In 1994 and 1995, higher 3H activity concentrations were measured due to experimental research in the nearby department in which technogenic tritium was used [74,75], while there was no influence on stable isotope data. As a consequence of local tritium contamination, a new location for precipitation sampling had to be found. During 1995 and 1996, precipitation samples were additionally collected at Puntijarka, on Mt. Medvednica (45.917° N, 15.95°, 988 m a.s.l.), 15 km north of the city of Zagreb [62], and at the Zagreb–Grič site at the Croatian Meteorological and Hydrological Service (45.814° N, 15.972° E, 157 m a.s.l.) in the center of Zagreb (in 1996). 3H activity concentrations in precipitation at the stations Zagreb–Grič and Puntijarka in 1996 were almost identical, 10.7 ± 4.0 TU and 10.4 ± 6.0 TU, respectively [62]. For the analyses in this paper, the Zagreb–RBI data for tritium activity concentration were used for up to 1993, data from Puntijarka were taken as representative for Zagreb in 1995, and for 1996 and on, data from Zagreb–Grič were used. Tritium data exist for 1994, but they will not be discussed here because they present technogenic (local) tritium. Data for the stable isotope composition of Zagreb precipitation are not available for the 2007–2009 period and for 2011.
Daily rain events were collected in Zagreb for the period from October 2002 to March 2003, and the obtained stable isotope composition was compared to the monthly δ18O and δ2H data [76].
2.4. Meteorological Data
The meteorological data consisted of monthly precipitation amount and average monthly air temperature. Data were obtained on request from the Croatian Meteorological and Hydrological Service (CMHS). Meteorological records for Zagreb, Croatia, exist for the period since 1862 and have been analyzed by CMHS for the usual climatological periods [77]. Here, we used data from only the 1976–2018 period, for which we had records of the isotope composition of precipitation. Minimal and maximal monthly values within a year were identified, and the mean annual values of temperature and the total annual precipitation amount were determined.
2.5. Measurement of δ2H and δ18O
The stable isotope composition of the precipitation samples for the period 1980–2003 was measured on a Varian MAT 250 dual inlet isotope ratio mass spectrometer (IRMS) at the Jožef Stefan Institute in Ljubljana [49,69,70,73]. The isotopic composition of hydrogen (δ2H) was determined by means of the H2 generated by the reduction of water over hot zinc (up to 1998) [69], and later over hot chromium [78]. The oxygen isotopic composition (δ18O) was measured by means of the water–CO2 equilibration technique [40]. All measurements were carried out together with laboratory standards that were calibrated periodically against international standards, as recommended by the IAEA. The measurement precision of duplicates was better than ±0.1‰ for δ18O and ±1‰ for δ2H. The stable isotope composition of the precipitation sampled between 2004 and 2006 was determined at SILab (Stable Isotope Laboratory at the Physics Department, School of Medicine, University of Rijeka, Rijeka, Croatia). An HDO Equilibration Unit (ISO Cal) attached to the dual inlet port of a DeltaPlusXP (Thermo Finnigan) IRMS was used [68,79]. The δ18O and the δ2H were obtained from CO2 and H2 gas, respectively, after equilibration with a 4-ml water sample. The measurement reproducibility of duplicates was better than ±0.1‰ for δ18O and ±1‰ for δ2H. The stable isotope composition of precipitation from 2010 and on was analyzed with a Liquid Water Isotope Analyzer (LWIA-24d, Los Gatos Research) at the Institute for Geochemical Research, the Hungarian Academy of Sciences, Budapest, Hungary. The uncertainty of the measurements was reported to be ±0.2‰ for δ18O and ±0.6‰ for δ2H [66]. The stable isotope composition of Zagreb’s precipitation for the 2012–2018 period was determined at the Laboratory for Spectroscopy of the Faculty of Mining, Geology, and Petroleum Engineering, University of Zagreb, with a Liquid Water Isotope Analyzer (LWIA-45-EP, Los Gatos Research). Data were analyzed by the Laboratory Information Management System (LIMS) [80]. The measurement precision of duplicates was ±0.1‰ for δ18O and ±0.3‰ for δ2H.
2.6. Measurement of Tritium Activity Concentration
Tritium activity concentration (A) in all monthly samples was determined at the Ruđer Bošković Institute in Zagreb. The results are expressed in tritium units (1 TU = 0.118 Bq l−1) [1] since the same units are used by the IAEA–WMO/GNIP database [27]. A tritium unit represents one 3H atom in 1018 atoms of hydrogen. The gas proportional counting technique (GPC) was used up to 2009 [81,82,83]. Methane (CH4) was used as a counting gas in a multiwire proportional counter. It was obtained through the reaction of water (50 ml) with aluminum carbide at 150 °C [81]. The counting energy window was set to energies between 1 keV and 10 keV to obtain the best figure of merit. Gas quality control was performed by simultaneously monitoring the count rate above the tritium channel, i.e., above 20 keV [82]. The detection limit was 2.5 TU, and the measurement uncertainty was between 2 and 5 TU, depending on the activity concentration. In 2008, a technique of liquid scintillation counting of electrolytically enriched samples (LSC-EE) was introduced, and between 2008 and 2009, GPC and LSC-EE techniques were used [83,84]. Since 2010, samples have been measured using the LSC-EE technique only [71,83,84,85,86].
The electrolytic enrichment system at the RBI was produced by the AGH University of Science and Technology, Krakow, Poland [87,88]. It consists of 20 cells 500 ml in volume (stainless steel anodes and mild steel cathodes). Each sample was distilled before electrolysis, as the required conductivity is <50 µS/cm. An enrichment run contained 15 unknown samples, 3 spike waters (water of known tritium activity concentration, 500–600 TU) used for monitoring the electrolysis performances and the calculation of enrichment factor, and 2 tritium-free samples used for system control. The enrichment procedure at RBI took 1420 Ah distributed over 8 days. Enriched samples were distilled again after electrolysis, with 6–8 g of PbCl2 added to each sample. The scintillation cocktails for measurement in LSC were prepared by 8 ml of sample and 12 ml of scintillator Ultima Gold LLT in high-density low-diffusion polyethylene vials. Measurements were performed by an ultra-low-level liquid scintillation counter, the Quantulus 1220, in 10 cycles of 50 min each. Each measurement run consisted of 24 scintillation cocktails: 20 enriched samples, 1 nonenriched spike sample, 1 international standard, and 2 nonenriched background samples. On the basis of the initial and final mass of water in cells and the individual count rates of the spike water before and after enrichment, the enrichment factor E was calculated [86,87]. The average 10-year E value of the system was 26 ± 2. The detection limit obtained by the LSC-EE technique was around 0.5 TU, and the measurement uncertainty was between 0.5 and 3 TU [71,83,84,85,86].
2.7. Data Evaluation
Mean δ18O, δ2H, and d-excess values, weighted by precipitation amount, were calculated from all monthly data and then summed over all collected samples per month and per year. Thus, the monthly mean values for a specific month over a certain period were obtained, as were the annual mean values. The number of datapoints per year for all years (Table 1) fulfilled the requirement for the calculation of annual mean values, i.e., the lowest number of monthly isotope datapoints per year was 9, while at least 7 monthly samples were required [89]. All years with an incomplete number of monthly samples, however, met the requirement that the available isotope data comprise more than 70% of the total precipitation amount collected per year (Table 1) [89].

Table 1.
Mean annual temperature T, ranges of monthly temperatures within a year, annual precipitation amount P, weighted mean (w.m.) annual δ18O, δ2H, d-excess (d), and the mean annual tritium activity concentration A in precipitation at Zagreb, 1976–2018. Here, n: number of monthly datapoints; %P: percentage of precipitation if different from 100%, comprised by δ18O, δ2H, and d-excess data; TU: tritium unit. Bold font: the lowest and highest values in a series.
Correlations between various datapoints were obtained as ordinary least squares regressions, and the Pearson’s coefficient r is given, as are the number of data pairs n and the p-value describing the statistical significance of the correlations. Data taken from the literature usually have the adjacent r2 value reported.
In the special case of correlations between δ2H and δ18O (i.e., for LMWLs), different methods were applied: an ordinary least squares regression (OLSR), a reduced major axis regression (RMA), and a major axis least squares regression (MA) [48,49,89]. In addition, we calculated precipitation-weighted regressions (PWLSR, PWRMA, and PWMA) [48,49], which took into account the precipitation amount in a particular month. The local meteoric water lines are defined as LMWLOLSF, LMWLRMA, LMWLMA, LMWLPWLSR, LMWLPWRMA, and LMWLPWMA. While OLSR regressions were found by commercially available software (MS Excel), for other regressions we used Local Meteoric Water Line Freeware [90]. The software also calculated an average of the root mean square sum of squared errors (rmSSEav), which is a relative error that allows for a comparison of different methods: the closer the value of rmSSEav is to 1.0, the better the regression method for that set of data [48].
Deuterium excess d was calculated from paired monthly data according to Equation (3). Some precipitation samples showed very low (highly negative; in our case, the lowest value was −13‰) d-excess values. This can be caused by improper sampling (e.g., the precipitation stayed for the whole month in a sample collector), by evaporation due to a low amount of precipitation and/or high temperatures, or by the evaporation/sublimation of raindrops falling in a dry atmosphere [50,51,71].
3. Results
Data on monthly temperatures, monthly precipitation amount, and the tritium activity concentration of precipitation at Zagreb for the 1976–2018 period, as well as the stable isotope composition of monthly precipitation (δ18O, δ2H, d-excess) for the 1980–2018 period, are shown in Table S2 (Supplementary Materials).
3.1. Meteorological Data
Minimal monthly (mean air) temperatures at Zagreb for the 1976–2018 period ranged from −3.4 °C (in 1985) to 5.4 °C (in 2014) (Figure 2a). They were measured in January (in 21 cases, or 49%), February (12 cases, or 27.9%), and December (9 cases, or 20.9%), and only once, in 1988, was the coldest month November. The highest monthly temperatures, in a range from 18.9 °C (1978) to 25.8 °C (1992, 2003) were measured in 26 out of 43 years (60.5%) in July, 15 times (35%) in August, and only in 2 cases in June (1979 and 1996).
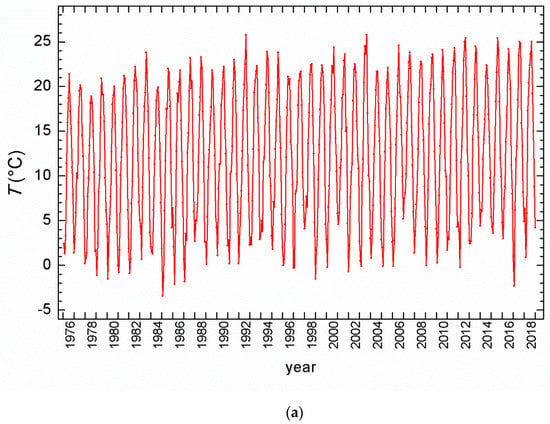
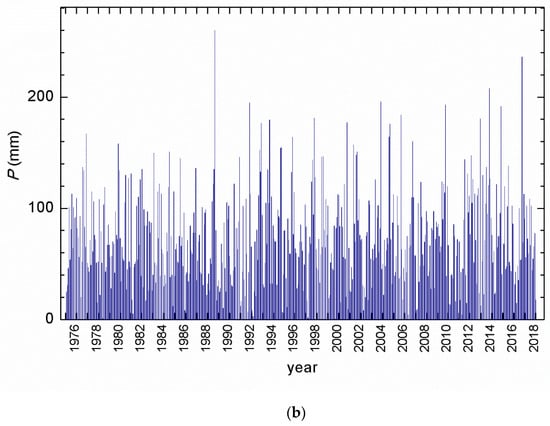
Figure 2.
(a) Mean monthly air temperatures; (b) monthly precipitation amount. Data from station Zagreb–Grič for the 1976–2018 period. Data obtained from the Croatian Meteorological and Hydrological Service (CMHS).
Mean annual temperatures, together with yearly minimal and maximal monthly temperatures and the total yearly amount of precipitation at Zagreb for the 1976–2018 period, are shown in Table 1. Mean annual temperatures ranged from 9.6 °C in 1980 to 14.1 °C in 2018.
The annual precipitation amount ranged from 521 mm (2011) to 1234 mm (2014) (Table 1), while the maximal monthly precipitation amount occurred in August 1989 (260 mm), followed by 236 mm in September 2017 and 208 mm in September 2014. In all other months, the monthly amount of precipitation was below 200 mm (Figure 2b).
3.2. Stable Isotopes
Monthly δ18O values in precipitation at Zagreb ranged from −17.6‰ (January 2005) to −0.5‰ in June 1998 (Figure 3). Similarly, the lowest δ2H = −133.1‰ (January 2005) and the highest δ2H = −11.4‰ (June 1998) were determined in the same months (Figure S1, Supplementary Materials).
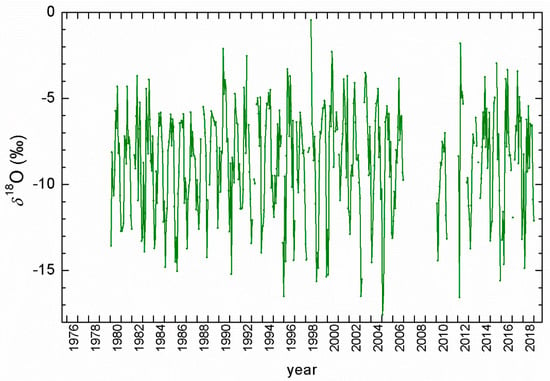
Figure 3.
Monthly δ18O in precipitation at Zagreb, 1980–2018 period.
The lowest weighted mean annual values were observed in 2010 (δ18O = −9.7‰, δ2H = −68.0‰) and the highest in 2000 (δ18O = −5.54‰, δ2H = −39.68‰) (Table 1). The number of monthly isotope datapoints (n) available in each year as well as the percentage of annual precipitation amount (%P) comprised by the isotope data during the n months (Table 1) satisfied the requirements for the calculation of mean annual values [89]. For 15 years out of 39 (with the available stable isotope data), the number of monthly samples was less than 12, but it was never less than 9, and the available isotope data comprised at least 77% of annual precipitation in these years.
Monthly values of deuterium excess (Figure 4, Table S2) ranged from −6.9‰ in May 2000 to 22.5‰ in October 1994, with 110 mm rain, probably from the Mediterranean. It should be noted here that for six months of the entire studied period, the monthly d-excess values were lower than −7‰, i.e., they were more than three standard deviations lower than the overall mean d-excess value and were therefore deleted from the record and further analysis. Three out of six cases were caused by the evaporation of small monthly precipitation amounts (11 mm in March 1996, 22 mm in February 2000, and 2 mm in December 2016), and the other three (January 1996, June 1998, and July 2012) were probably from the evaporation/sublimation of raindrops. Mean annual d-excess values ranged between 2.28‰ and 10.74‰ in 2000 and 1995, respectively (Table 1).
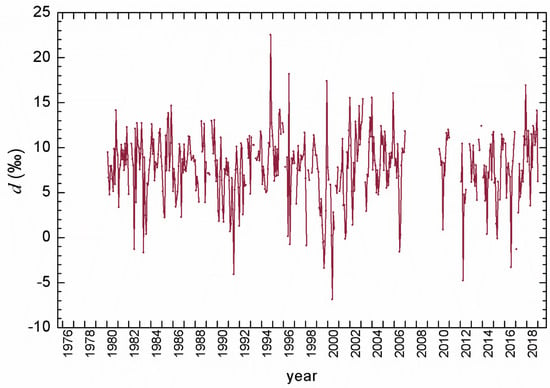
Figure 4.
Monthly deuterium excess values for precipitation at Zagreb, 1980–2018.
3.3. Tritium Activity Concentration in Precipitation at Zagreb
The complete record of tritium activity concentration (A) in precipitation for Zagreb, 1976–2018 (Figure 5), exhibited a pattern typical of continental stations of the Northern Hemisphere. Seasonal variations were superposed on the basic decreasing trend of mean annual values until approximately 1996. The maximal monthly 3H activity concentration at the Zagreb station was observed between May and July, mostly in June. A secondary maximum was also observed three times in January and February. The lowest 3H activity concentrations were almost uniformly distributed from October to February, with a slightly more frequent occurrence in December.
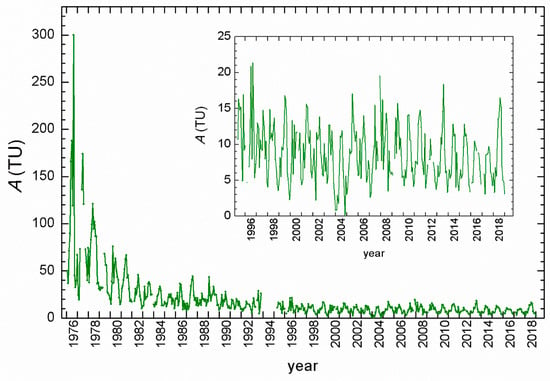
Figure 5.
Complete record of monthly tritium activity concentration (A) in precipitation at Zagreb, 1976–2018. Insert: for the 1995–2018 period.
Data recorded from 1995 to 2018 (insert in Figure 5) showed an almost constant mean annual 3H activity concentration ranging between 5.4 TU (in 2004) and 13.5 TU (in 1995), with a mean value of 8.5 ± 1.2 TU. Seasonal variations remained observable, with winter activities close to the natural pre-bomb 3H activity concentrations (≤5 TU) and summer values up to 21 TU [91,92].
4. Discussion
4.1. Trends in Meteorological Parameters
The annual precipitation amount P at Zagreb for the 1976–2018 period (Figure 6) showed a slight increase (1.4 ± 1.7 mm/y, r = 0.13, p = 0.4), as did the maximal monthly values within a year (0.7 ± 0.5 mm/y, r = 0.23, p = 0.14), while the minimal monthly values within a year, including no-rain months, showed a slight decrease (−0.1 ± 0.1 mm/y, r = −0.13, p = 0.41). However, the trends (statistically not significant) were not the most prominent characteristics of the data. Higher dispersion/fluctuations from the mean value for the whole period, 1976–2018 (867 ± 138 mm), were obvious (Figure 6). In the period 1976–2000, practically all values lay within ±1 standard deviation (±1 σ), while later on there were some years with deviations from the mean over ±2 σ. The mean values of the precipitation amount in the subperiods (1980–1985, 1986–1995, 1996–2006, and 2012–2018) for which isotope data were available showed larger fluctuations in the precipitation amount in more recent periods (Table 2).
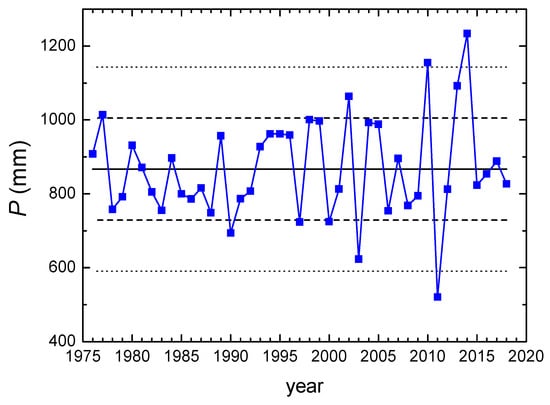
Figure 6.
Annual precipitation amount P in Zagreb, 1976–2018 period. Solid line: the mean value for the whole period; dashed lines: ±1σ; dotted lines: ±2σ.

Table 2.
Comparison of mean values of meteorological parameters (T, P) and isotopic data (δ18O, δ2H, and d-excess) for different periods.
Mean annual temperature and the minimal and maximal monthly temperature within a year (Figure 7) showed a significant increase at a 95% confidence level (p < 0.05) (a mean value of 0.071 ± 0.008 °C per year (r = 0.82), a minimal value of 0.05 ± 0.08 °C/year (r = 0.33), and a maximal value of 0.09 ± 0.02 °C per year (r = 0.69)). Since both the minimal and maximal monthly temperatures increased, but with different gradients, the result was that the increase in the amplitudes of the air temperatures (0.04 ± 0.03 °C per year, r = 0.26, p = 0.09) was significant at a 90% significance level (Figure 7).
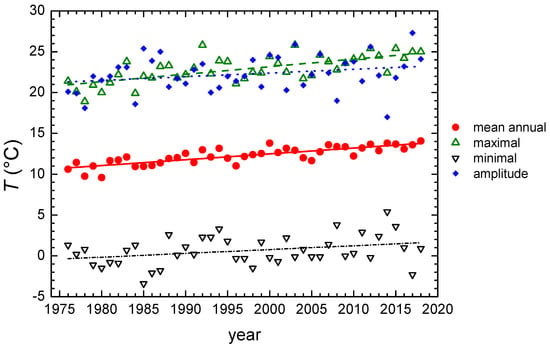
Figure 7.
Mean annual temperature, minimaland maximal monthly temperatures within a year, and the temperature amplitudes in Zagreb, 1976–2018 period. Trend lines for each dataset are shown in the same color.
It is also interesting to look at the monthly mean P and T values at the Zagreb station averaged for each month over a certain period (Figure 8) and calculated for four subperiods. The monthly amount of precipitation was relatively uniformly distributed throughout the year. However, the average values in January–April and in December were lower (<61 mm) than in May–November (>70 mm). The month with the highest average precipitation was September, with 97 mm. September was also the only month showing a constant increase in the amount of precipitation over the studied periods. Monthly precipitation for the period 1976–1996 (i.e., the first two periods from Figure 8a) also showed lower precipitation (<60 mm) for January to April. However, maximum precipitation amounts were observed in June (94 mm) and August (91 mm) [62]. Such a shift in the precipitation regime is in accordance with observations of climate changes in Croatia [59].
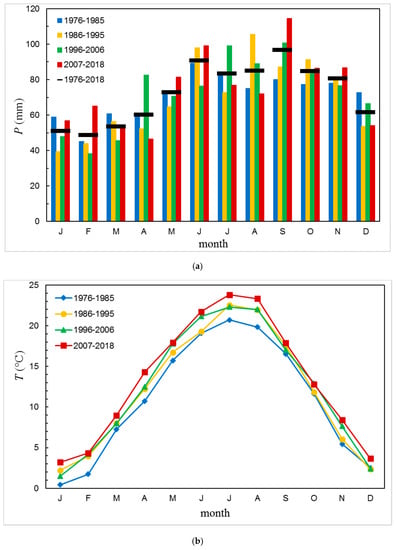
Figure 8.
(a) Monthly mean precipitation amounts for the four subperiods and the average value for the whole period; (b) monthly mean air temperature for the subperiods.
Mean monthly temperatures (Figure 8b) for all months in the 1976–1985 period were lower than in the most recent period, 2007–2018. The difference ranged from 1.1 °C in October and December to 3.5 °C in August and 3.6 °C in April. This observation once more corroborates observations of constant recent temperature increases that are more pronounced in the spring–summer periods [59].
4.2. Trends in Stable Isotope Data
Both the arithmetic mean annual values (δ18Oa, δ2Ha, da) and the weighted mean annual values by amount of precipitation (δ18Ow.m., δ2Hw.m, dw.m.) were calculated (Table S3). Due to the relatively homogeneous distribution of the annual precipitation amount (Figure 8a), there was no significant difference between the two types of annual means; in fact, a very good correlation was obtained, and here we present an example of the δ18O values:
δ18Ow.m. = (1.006 ± 0.16) δ18Oa + (0.48 ± 1.4), n = 34, r = 0.73.
Changes in the weighted mean annual values of δ18O, δ2H, and d-excess in the studied 1980–2018 period are shown in Figure 9 together with their respective trends. The δ18O and δ2H values exhibited increases, with an increase rate of 0.017‰ ± 0.014‰ per year (r = 0.21, p = 0.23) for δ18O and 0.14‰ ± 0.11‰ per year (r = 0.23, p = 0.19) for δ2H. The annual mean d-excess remained constant (slope ≈ 0). The corresponding weighted mean values for the periods 1980–2006 (as well as for the shorter subperiods) and 2012–2018 are shown in Table 2. Both the δ18O and δ2H values were higher in the more recent period, 2012–2018, than from 1980 to 2006. We observed a similar trend earlier: the mean δ18O in the 2001–2003 period (−8.3‰) was more positive than the long-term mean δ18O (−8.8‰) [76]. However, it was noticed (Table 2) that the values in the 1996–2006 and 2012–2018 periods were practically the same, although the temperature differed in these periods.
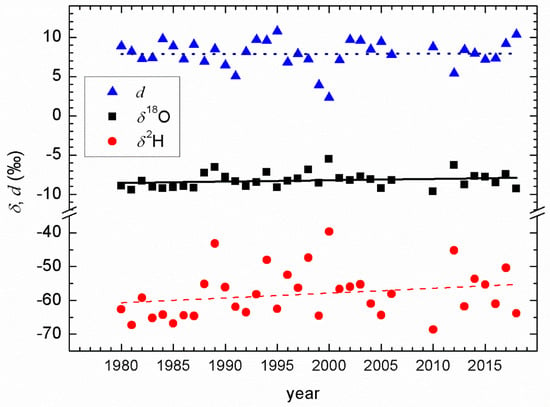
Figure 9.
Temporal changes of weighted mean annual δ18O, δ2H, and d-excess values.
To investigate which months contributed most to the changes in the mean annual values of δ18O and δ2H, we calculated the monthly mean δ18O values in the four subperiods (Figure 10). The most pronounced differences were observed in the first half of the year, with higher values in the 2012–2018 period than in earlier years in January, March, and April, while in February, the most recent δ18O and δ2H were the lowest. The differences in the second half of the year were not large. This is behavior similar to that described earlier for the monthly mean temperature (Figure 8b). However, while the summer temperatures (June, July, and August) were the highest in the most recent period, the δ18O and δ2H were not.
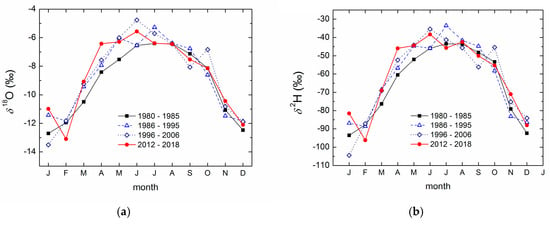
Figure 10.
(a) Monthly mean values of δ18O in the four subperiods; (b) monthly mean values of δ2H in the four subperiods.
No significant correlation was observed between δ18O and P. This was expected for the midlatitude continental station of Zagreb, which had an expressed seasonality in temperature (Figure 8b) and δ18O values (Figure 10a) and a lack of clear seasonality in precipitation amount (Figure 8a) [4]. No amount effect was observed or reported for stations in Croatia and Slovenia [17,47,62,70,71,72,73].
4.3. Deuterium Excess
In previous analyses [47,76], it was demonstrated that the deuterium excess values for Zagreb’s precipitation were higher in autumn than in the spring. The same occurred in this study using monthly mean values of d-excess for the four periods, 1980–1985, 1986–1995, 1995–2006, and 2012–2018 (Figure 11). In all periods, values from January to June (<8‰) were lower than those in the second half of the year (>8‰). While in the first half, there was a slight decrease in the newer periods (7.6 ± 0.6‰ in 1980–1985 to 6.0 ± 1.6‰ in 2012–2018), the d-excess values in the second half of the year showed an increasing trend. Such an interplay of decreases and increases of the monthly mean values eventually resulted in no change in the mean annual d-excess values over the whole studied period, as was shown earlier (Figure 9, Table 2). The higher d-excess in autumn (Figure 11) indicates a higher influence of the Mediterranean air masses in these months. It is interesting to note the shift of the autumn peak in the d-excess value from October (in 1980–1985) to November in the 2012–2018 period. Such behavior resembled the changes in the monthly precipitation amount in autumn (Figure 8a). November was the only month in which a significant increase in d-excess in the whole period was observed, with a rate/slope of 0.14‰ ± 0.04‰ per year (n = 35, r = 0.54, p < 0.05).
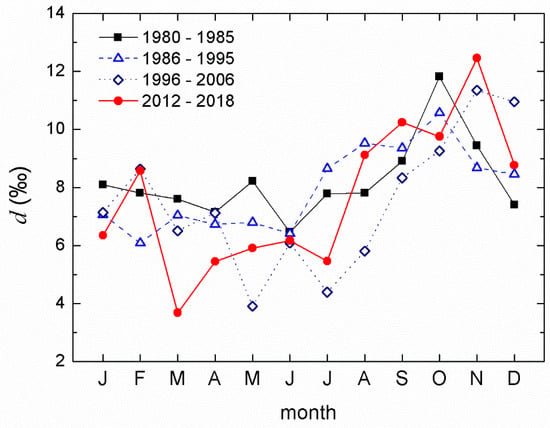
Figure 11.
Monthly mean values of d-excess in the four subperiods.
A similar pattern of monthly d-excess distribution was also observed for all other Croatian stations (Figure 1, Table S1) [27,47]. The mean d-excess value depended on the location and altitude of the station, but in all cases, higher d-excess monthly values were observed in autumn–winter precipitation, usually from September to December [47]. The lowest mean monthly d-excess values were observed in summer months. At the South Adriatic stations (Komiža, Dubrovnik), the distribution of the precipitation amount had higher seasonality (a low amount in summer and high in winter) than it did in Zagreb, and the d-excess values in summer months (from May to August) were lower than 8‰, which is indicative of secondary evaporation of raindrops falling in a warm and dry atmosphere [47,50,51].
The very striking behavior of d-excess in March of the 2012–2018 period (Figure 11) can be explained as follows. During this period, the precipitation amount in March (57%) in four out of seven months was below 23 mm, resulting in d-excess values between −4.8‰ (2012, P = 4 mm) and 4.1‰ (2014, P = 22 mm), which was fully in accordance with observations from the station in Ljubljana [71] d < 5‰) and corresponded with months with low precipitation. These d-excess values were low, but were still within 3σ of the mean value, and therefore they were not excluded from the analyses. When these lower d-excess values were excluded from the mean d-values for March from 2012 to 2018, the mean d-excess for 2012–2018 became 7.4‰, which was not different from other periods. In contrast, in the 1980–2006 period, the total number of months with precipitation below 23 mm was only two (i.e., the occurrence of low precipitation in March was only 8%), and both d-excess values were excluded from the analyses. This observation also corroborated observed changes in the seasonal distribution of precipitation at continental stations in Croatia [59].
4.4. Trends in Tritium Activity Concentration
The seasonal variations in the tritium activity concentration in precipitation at Zagreb for the period from 1976 to 1993 were superposed onto a generally decreasing trend (Figure 5) that could be approximated by an exponential decay curve with a half-life of about 6 years, in accordance with the estimated residence time of tritiated water vapor in the lower stratosphere (of the order of a few years) [1]. The same pattern for the tritium-in-precipitation regime (maxima from June to July and minima in winter) was observed in other continental stations (Figure 1): Ljubljana [47,70,71], Plitvice Lakes [65,67], and Gacka [68]. The ratio of the maximum to minimum value for Zagreb precipitation up to 1996 ranged from 2.2 to 5.7 without a significant trend [62], similarly to other Northern Hemisphere stations (between 2.5 and 6 [1]). The ratio was similar in the 1996–2018 period, between 2.3 and 5.3 in most cases, and was higher only in years with tritium activity concentrations close to the GPC detection limit.
The decrease in mean annual tritium activity concentration values continued after 1996 (Figure 5 insert, Figure 12), but to a much lesser extent of 0.08 TU per year, resulting in mean values of 8.8 ± 1.4 TU in 1996–2006 and 7.6 ± 0.8 TU in 2012–2018. The mean values for the station Ljubljana were 9.1 TU and 8.3 TU during 1998–2010 and 2007–2010, respectively [71], showing the same trend.
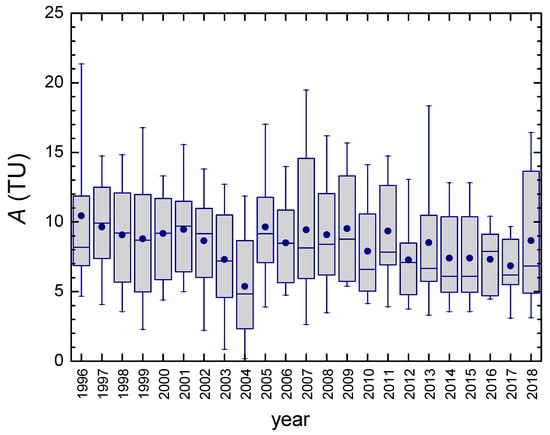
Figure 12.
Tritium activity concentration in precipitation at Zagreb during the period 1996–2018. The boxplot shows the median value and the percentile range 25%–75% in a shadowed box, — shows the percentile range 5%–95%, and the average value is shown by the symbol ●.
Bomb-produced tritium in precipitation until about 1995 prevented studies on whether the natural production of tritium was influenced by variations in solar activities. The modulation of cosmogenic tritium production by an 11-year solar cycle has been recently shown in precipitation at several stations worldwide [93]. Local maxima in the tritium activity concentration in precipitation were observed simultaneously with maxima in neutron flux (minima in sunspot numbers). Our data (Figure 12) also showed local maxima in mean annual values and larger variability in 1996, 2007, and 2018 in accordance with the observations presented in Reference [93].
4.5. Local Meteoric Water Line
The slopes (a) and intercepts (b) of LMWLs were obtained using different regression methods (Table 3). The whole 1980–2018 period was taken, as were individual subperiods, and the present values were compared to the available data on LMWLs for Zagreb precipitation from different earlier periods (obtained using different regression methods). The slopes and intercepts determined using different regression methods increased from the OLSR to the RMA and MA (in the whole period, as well as in the subperiods (Table 3)), as was also observed for most continental stations [48]. The same was also valid for precipitation-weighted regressions. No difference was observed between the corresponding nonweighted and weighted types of regression, as was expected from the rather homogeneous distribution of the monthly precipitation amount. If the rmSSEav value was taken into account, all values were close to 1 (closer to 1 for RMA and PWRMA over the whole long-term period). In subperiod 1980–1985, PWMA represented the LMWL equally as well as PWRMA and RMA did; in subperiods 1986–1995 and 1996–2006, the best fits were obtained by RMA and PWMA; and in the most recent subperiods, the best fits were obtained by RMA and PWLSR (Table 3). It may be concluded that the local meteoric water line for Zagreb was best described by the nonweighted RMA regression method (Figure 13):
δ2HRMA,all = (7.74 ± 0.06) δ18O + (5.6 ± 0.6), n = 389.

Table 3.
Slopes (a) and intercepts (b) of the local meteoric water line (LMWL) for Zagreb in different periods and obtained using different regression methods. OLSR: ordinary least squares regression; RMA: reduced major axis regression; MA: major axis least squares regression; PWLSR, PWRMA, and PWMA: precipitation-weighted respective regressions; n: number of datapoints included; r and r2: regression coefficients; rmSSEav: average of the root mean square sum of squared errors [48].
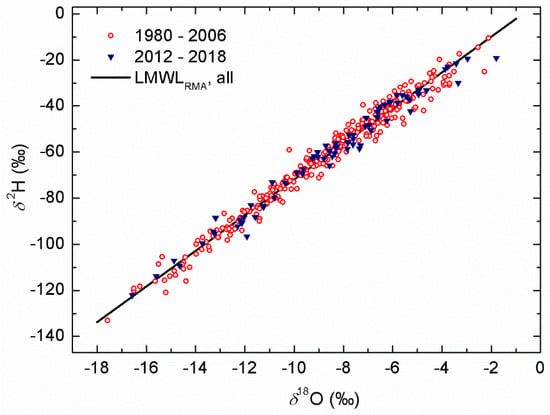
Figure 13.
Local meteoric water line (LMWL) for Zagreb precipitation. Data from two periods are shown by different symbols. The fitted line is expressed by Equation (5).
A closer look at previously published LMWLs points to the difference in data up to 1996, with slope and intercept values close to 8 [27,62], while in 2001–2003, the slope was lower (7.3 + 0.2) and the intercept much lower (2.8 + 1.8) [47]. A similar conclusion was obtained from the present calculations (Table 3): all regression methods resulted in a slope close to 8 and an intercept in the range 7.3 to 9.3 in the subperiods 1980–1985 and 1986–1995. However, the slope values ranged from 7.4 to 7.8 and the intercept values from 2.6 to 6.3 in the subperiods 1996–2006 and 2012–2018. This difference can be explained by increases in temperature, especially in the summer months, and higher variability in the precipitation amount, which both led to more precipitation with lower d-excess, i.e., below the LMWL, as can be seen from Figure 13.
4.6. Temperature Dependence of δ18O
The relation between all values of the mean monthly air temperature T and the monthly δ18O values (Figure 14) can be described as
δ18O = (0.331 ± 0.013) T −(12.8 ± 0.2), n = 394, r = 0.795.
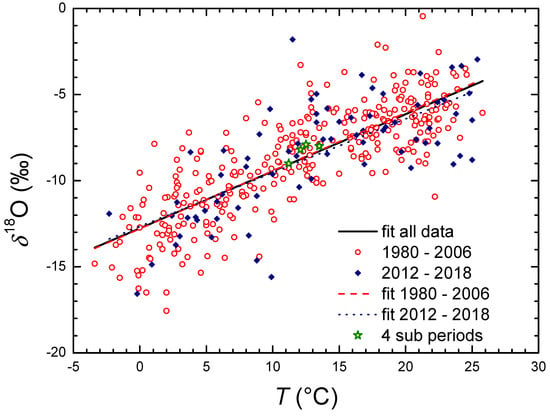
Figure 14.
Temperature dependence of δ18O in monthly precipitation at the Zagreb station during different periods. Regression lines are represented by Equations (6) and (8). The mean values in the subperiods (stars) are taken from Table 2.
When data for the periods 1980–2006 and 2012–2018 were separated, the two relations were
δ18O1980–2006 = (0.336 ± 0.013) T − (12.8 ± 0.2), n = 320, r = 0.814,
δ18O2012–2018 = (0.312 ± 0.036) T − (12.7 ± 0.5), n = 74, r = 0.718.
Although Equations (7) and (8) indicate a slight change in the temperature coefficient, the difference is comparable to the statistical uncertainties in the a-values, and therefore it can be concluded that there was no change in the relation δ18O versus T in the recent period compared to the older one. The two lines (Equations (7) and (8)) are practically indistinguishable (Figure 14). The new relation for the complete set of long-term data for Zagreb (Equation (6)) was not different (i.e., it is within uncertainties) from the same relation for the data for the 1980–1996 period (δ18O = (0.325 ± 0.016) T − (12.6 ± 0.2), r = 0.83, n =183) [62]. The slopes in Equations (7) and (8) were also comparable to the slope of 0.31‰ per °C, which was determined from long-term data from midlatitude stations in the Northern Hemisphere [4].
5. Conclusions
A 43-year-long record of data on the isotope composition of precipitation (δ18O, δ2H, d-excess, and the tritium activity concentration A), together with meteorological data (air temperature, precipitation amount) at a continental station in Zagreb, Croatia, was studied, divided into four almost equally long subperiods. However, due to some missing data on stable isotope composition, the first (1980–1985) and the last (2012–2018) subperiods were shorter than the two subperiods in between (1986–1996, 1996–2006).
A constant increase in mean annual temperature was observed at a rate of 0.07 °C per year. An increase in monthly mean temperature was observed in all months in 2012–2018 when compared to earlier subperiods, with larger differences in the spring–summer than in autumn. The most striking feature of the annual precipitation amount was larger variations in the last two subperiods compared to earlier. A shift of the month with the highest precipitation amount was observed, from June and August to September.
Annual mean δ18O and δ2H values in the whole long-term period showed an increase of 0.017‰ per year and 0.14‰ per year, respectively. When monthly mean values in different subperiods were compared, larger differences were observed in the first half of the year than in the second one. Both of these changes in the stable isotope composition resembled observed changes in air temperature.
Although mean annual d-excess remained constant over the whole long-term period, there was a tendency for a decrease in the d-excess value in the first half of the year and an increase in the second half due to the influence of air masses originating from the eastern Mediterranean. Together with a shift in the maximal monthly mean value from October to November and a significant increase in d-excess in November, these observations point to changes in the precipitation regime and circulation pattern of air masses during the most recent period.
Different regression methods for the calculation of the local meteoric water line for Zagreb gave very similar values for the slope and intercept, with a slight preference for the RMA method and with no difference between nonweighted and precipitation-weighted values. In addition, no significant difference in both LMWLs and the temperature dependence of δ18O values was observed between the most recent period (2012–2018) and the earlier period (1980–2006). The observed temperature gradient of 0.33‰ per °C was comparable to that of other similar stations.
The tritium activity concentration in precipitation in Zagreb between 1976 and 1994 exhibited pronounced seasonal variations superposed on a generally decreasing trend with a half-life of about 6 years, which is typical for continental stations of the Northern Hemisphere. Since 1996, the mean annual A values have been almost constant, and the mean A value during the 2012–2018 period was 7.6 ± 0.8 TU. The tritium activity concentration in precipitation with no bomb-peak influence is worth further monitoring because of possible local contamination with technogenic tritium and also to enable studies of the solar cycle influence on the production of cosmogenic tritium.
The present analysis of long-term data on the isotope composition of precipitation may be useful for future comparisons to some other long-term records in nearby countries to obtain better knowledge on spatial and temporal variations across the wider region. It can also be a good basis for a comparison to some short-term records at other stations in Croatia. Last but not least, this analysis shows that climate changes are reflected in isotope compositions of precipitation, which means that further monitoring at stations with long-term records could be useful in studying the impact of climate changes on the environment, especially on water resources.
Supplementary Materials
The following are available online at https://www.mdpi.com/2073-4441/12/1/226/s1, Figure S1: Monthly δ2H in precipitation at Zagreb, 1980–2018 period; Table S1: Stations from Croatia with available data on isotopes in precipitation; Table S2: Long-term monthly data (precipitation amount P, temperature T, δ18O, δ2H, d-excess, and tritium activity concentration A) for the station at Zagreb, Croatia; Table S3: Mean annual values δ18O, δ2H, d-excess, and A. Comparison of arithmetic and precipitation-weighted mean values.
Author Contributions
Conceptualization, I.K.B. and P.V.; data validation and interpretation, writing the manuscript—original draft preparation, final manuscript, visualization—most graphs, and communicating with the journal, I.K.B.; sample collection, tritium activity sample preparation, and discussion, J.B. and A.S.; data evaluation, database management, and LMWL Freeware software application, D.B.; stable isotope measurements, data reduction, and interpretation, P.V.; meteorological data analysis and visualization, I.L.M. All coauthors participated in discussions and reviewed the manuscript. All authors have read and agreed to the published version of the manuscript.
Funding
This research received no external funding. In the past, the isotope composition of precipitation was part of the following funders and projects: the Ministry of Science and Education (MSE) of the Republic of Croatia, project nos. 00980207 (natural radioisotopes and processes in gases, 1996–2002), 0098014 (natural isotopes of low-level activities and the development of instrumentation, 2002–2006), 098-0982709-2741 (natural radioisotopes in the investigation of Karst ecosystems and dating, 2007–2011); the IAEA, project nos. 11265 (Isotopic Composition of Precipitation in the Mediterranean Basin in Relation to Air Circulation Patterns and Climate Tritium and Stable Isotope Distribution in the Atmosphere in the Coastal Region of Croatia, 2000–2003), CRO/8/006 (the application of isotope techniques in the investigation of water resources and water protection in the Karst area of Croatia, 2005–2006 ), RER/8/012 (isotope methods for the management of drinking water resources in water-scarce areas, 2007–2008), CRO/8/007 (Using Isotope Tracers as a Tool for a Groundwater Vulnerability Assessment in the County of Split, Dalmatia, 2007–2008), RER/8/016 (Using Environmental Isotopes for an Evaluation of Streamwater/Groundwater Interactions in Selected Aquifers in the Danube Basin, 2009–2011), CRO/7/001 (Isotope Investigation of the Groundwater–Surface Water Interactions at the Well-Field Kosnica in the Area of the City of Zagreb, 2016–2017); EU project FP5 ICA2-CT-2002-10009 ANTHROPOL.PROT (a study of anthropogenic influence after the war and establishing protection measures in the National Park Plitvice and the Bihać Region at the border area between Croatia and Bosnia and Herzegovina, 2003–2005); and a project financed by the National Park Plitvice Lakes (“an investigation of the influence of forest ecosystems of the National Park Plitvice Lakes on the quality of water and lakes”, 2003–2006). Cooperation between Croatian and Slovenian partners was funded in recent decades by MSE and the Slovenian Research Agency (SRA) as part of bilateral cooperation (BI-HR/01-03-011, BI-HR/04-05-13, and BI-HR/09-10-032) and the SRA research program P1-0143.
Acknowledgments
The authors are thankful to former Ruđer Bošković Institute laboratory staff members Bogomil Obelić, Nada Horvatinčić, Dušan Srdoč, Elvira Hernaus, and Božica Mustač and the present technician Anita Rajtarić, who all took part in sample and data collection. We are also thankful to colleagues from the Jožef Stefan Institute in Ljubljana (Jože Pezdič, Sonja Lojen, Nives Ogrinc, Silva Perko, Zdenka Trkov, and Stojan Žigon) for stable isotope measurements from the period 1980–2003 and to Jelena Parlov and Zoran Kovač from the Laboratory for Spectroscopy of the Faculty of Mining, Geology, and Petroleum Engineering, University of Zagreb, for stable isotope measurements from the period 2012–2018. Meteorological data were obtained on request (free of charge) from the Croatian Meteorological and Hydrological Service. We thank Catherine E. Hughes and Jagoda Crawford for help in getting LMWL Freeware software and for discussions of the formulae used.
Conflicts of Interest
The authors declare no conflicts of interest. The funders had no role in the design of the study; in the collection; analyses; or interpretation of data; in the writing of the manuscript; or in the decision to publish the results
List of Abbreviations
| CMHS | Croatian Meteorological and Hydrological Service |
| GMWL | Global meteoric water line |
| GNIP | Global Network of Isotopes in Precipitation |
| GPC | Gas proportional counting |
| IAEA | International Atomic Energy Agency |
| IRMS | Isotope ratio mass spectrometry |
| LMWL | Local meteoric water line |
| LSC-EE | Liquid scintillation counting with electrolytic enrichment |
| MA | Major axis least squares regression |
| OLSR | Ordinary least squares regression |
| PWLSR | Precipitation-weighted OLSR |
| PWMA | Precipitation-weighted MA |
| PWRMA | Precipitation-weighted RMA |
| RBI | Ruđer Bošković Institute |
| RMA | Reduced major axis regression |
| rmSSEav | Average of the root mean square sum of squared errors |
| SMOW | Standard mean ocean water |
| TU | Tritium unit |
| WMO | World Meteorological Organization |
References
- Mook, W.G. Environmental Isotopes in the Hydrological Cycle, Principles and Applications, Volumes I, IV and V; Technical Documents in Hydrology No. 39; IAEA-UNESCO: Paris, France, 2001. [Google Scholar]
- Dansgaard, W. Stable isotopes in precipitation. Tellus 1964, 16, 436–468. [Google Scholar] [CrossRef]
- Maloszewski, P.; Zuber, A. Principles and practice of calibration and validation mathematical models for the interpretation of environmental tracer data in aquifers. Adv. Water Resour. 1993, 16, 173–190. [Google Scholar] [CrossRef]
- Rozanski, K.; Araguás-Araguás, L.; Gonfiantini, R. Isotopic patterns in modern global precipitation. Geophys. Monogr. 1993, 78, 1–36. [Google Scholar] [CrossRef]
- Rozanski, K.; Araguás-Araguás, L. Spatial and temporal variability of stable isotope composition of precipitation over the South American continent. Bull. Inst. Fr. Études Andin. 1995, 24, 379–390. [Google Scholar]
- Adomako, D.; Gibrilla, A.; Maloszewski, P.; Ganyaglo, S.Y.; Rai, S.P. Tracing stable isotopes (δ2H and δ18O) from meteoric water to groundwater in the Densu River basin of Ghana. Environ. Monit. Assess. 2015, 187, 1–15. [Google Scholar] [CrossRef]
- Vrzel, J.; Kip Solomon, D.; Blažeka, Ž.; Ogrinc, N. The study of the interactions between groundwater and Sava River water in the Ljubljansko polje aquifer system (Slovenia). J. Hydrol. 2018, 556, 384–396. [Google Scholar] [CrossRef]
- Parlov, J.; Kovač, Z.; Nakić, Z.; Barešić, J. Using Water Stable Isotopes for Identifying Groundwater Recharge Sources of the Unconfined Alluvial Zagreb Aquifer (Croatia). Water 2019, 11, 2177. [Google Scholar] [CrossRef]
- Kong, Y.; Wang, K.; Li, J.; Pang, Z. Stable Isotopes of Precipitation in China: A Consideration of Moisture Sources. Water 2019, 11, 1239. [Google Scholar] [CrossRef]
- Rao, S.M. Injected radiotracer techniques in hydrology. Proc. Indian Acad. Sci. 1984, 99, 319–335. [Google Scholar]
- Clark, I.; Fritz, P. Environmental Isotopes in Hydrogeology; Lewis Publ.: Boca Raton, FL, USA, 1997; p. 328. [Google Scholar]
- Kendall, C.; McDonnell, J.J. Isotope Tracers in Catchment Hydrology; Elsevier Science: Amsterdam, The Netherlands, 1998; p. 840. [Google Scholar]
- Mayr, C.; Langhamer, L.; Wissel, H.; Meier, W.; Sauter, T.; Laprida, C.; Massaferro, J.; Försterra, G.; Lücke, A. Atmospheric controls on hydrogen and oxygen isotope composition of meteoric and surface waters in Patagonia. Hydrol. Earth Syst. Sci. 2018. [Google Scholar] [CrossRef]
- Burnik Šturm, M.; Ganbaatar, O.; Voigt, C.C.; Kaczenskya, P. First field-based observations of δ2H and δ18O values of event-based precipitation, rivers and other water bodies in the Dzungarian Gobi, SW Mongolia. Isot. Environ. Health Stud. 2017, 53, 157–171. [Google Scholar] [CrossRef] [PubMed]
- Lawrence, J.R.; White, J.R.C. The Elusive Climate Signal in the Isotopic Composition of Precipitation Stable Isotope Geochemistry: A Tribute to Samuel Epstein. In Stable Isotope Geochemistry: A Tribute to Samuel Epstein; Taylor, H.P., O’Neil, J.R., Jr., Kaplan, I.R., Eds.; Special Publication No.3; The Geochemical Society: Washington, DC, USA, 1991. [Google Scholar]
- Gat, J.R. Some classical concepts of isotope hydrology. In Isotopes in the Water Cycle: Past, Present and Future of a Developing Science; Aggarwal, P.K., Gat, J.R., Fröhlich, K., Eds.; Springer: Dordrecht, The Netherlands, 2005; pp. 127–137. [Google Scholar]
- Krklec, K.; Domínguez-Villar, D.; Lojen, S. The impact of moisture sources on the oxygen isotope composition of precipitation at a continental site in central Europe. J. Hydrol. 2018, 561, 810–821. [Google Scholar] [CrossRef]
- Horvatinčić, N.; Krajcar Bronić, I.; Barešić, J.; Obelić, B.; Vidič, S. Tritium and stable isotope distribution in the atmosphere at the coastal region of Croatia. In Isotopic Composition of Precipitation in the Mediterranean Basin in Relation to Air Circulation Patterns and Climate, IAEA-TECDOC-1453; Gourcy, L., Ed.; IAEA: Vienna, Austria, 2005; pp. 37–50. [Google Scholar]
- Giustini, F.; Brilli, M.; Patera, A. Mapping oxygen stable isotopes of precipitation in Italy. J. Hydrol. Reg. Stud. 2016, 8, 162–181. [Google Scholar] [CrossRef]
- Longinelli, A.; Anglesio, E.; Flora, O.; Iacumin, P.; Selmo, E. Isotopic composition of precipitation in Northern Italy: Reverse effect of anomalous climatic events. J. Hydrol. 2006, 329, 471–476. [Google Scholar] [CrossRef]
- Rozanski, K.L.; Gonfiantini, R. Isotopes in climatological studies: Environmental isotopes are helping us understand the world’s climate. IAEA Bull. 1990, 4, 9–15. [Google Scholar]
- Marchetti, D.W.; Marchetti, S.B. Stable isotope compositions of precipitation from Gunnison, Colorado 2007–2016: Implications for the climatology of a high-elevation valley. Heliyon 2019, 5, e02120. [Google Scholar] [CrossRef]
- Ehleringer, J.R.; Cerling, T.E.; West, J.B.; Podlesak, D.W.; Chesson, L.A.; Bowen, G.J. Spatial considerations of stable isotope analyses in environmental forensics. In Issues in Environmental Science and Technology; Hester, R.E., Harrison, R.M., Eds.; Royal Society of Chemistry Publishing: Cambridge, UK, 2008; Volume 26, pp. 36–53. [Google Scholar] [CrossRef]
- Bowen, G.J.; Wassenaar, L.I.; Hobson, K.A. Global application of stable hydrogen and oxygen isotopes to wildlife forensics. Oecologia 2005, 143, 337–348. [Google Scholar] [CrossRef]
- West, A.G.; February, E.C.; Bowen, G.J. Spatial analysis of hydrogen and oxygen stable isotopes (“isoscapes”) in ground water and tap water across South Africa. J. Geochem. Explor. 2014, 145, 213–222. [Google Scholar] [CrossRef]
- Terzer, S.; Wassenaar, L.I.; Araguás-Araguás, L.J.; Aggarwal, P.K. Global isoscapes for δ18O and δ2H in precipitation: Improved prediction using regionalized climatic regression models. Hydrol. Earth Syst. Sci. 2013, 17, 4713–4728. [Google Scholar] [CrossRef]
- IAEA/WMO. Global Network of Isotopes in Precipitation. The GNIP Database. Available online: https://nucleus.iaea.org/wiser (accessed on 22 November 2019).
- Lewis, S.L.; Maslin, M.A. Defining the Anthropocene. Nature 2015, 519, 171–180. [Google Scholar] [CrossRef]
- IPCC. The Intergovernmental Panel on Climate Change. Available online: https://www.ipcc.ch/sr15/ (accessed on 26 November 2019).
- Climate Central. Available online: https://www.climatecentral.org/gallery/graphics/the-10-hottest-global-years-on-record (accessed on 22 November 2019).
- NASA. Available online: https://www.nasa.gov/press-release/nasa-noaa-data-show-2016-warmest-year-on-record-globally (accessed on 22 November 2019).
- Craig, H. Isotope variations in meteoric waters. Science 1961, 133, 1702–1703. [Google Scholar] [CrossRef] [PubMed]
- Gat, J.R. Oxygen and hydrogen isotopes in the hydrologic cycle. Annu. Rev. Earth Planet Sci. 1996, 24, 225–262. [Google Scholar] [CrossRef]
- Gat, R.J.; Mook, W.G.; Meijer, A.J. Atmospheric water. In Environmental Isotopes in the Hydrological Cycle—rinciples and Applications; Mook, W.G., Ed.; Technical Documents in Hydrology; IAEA: Vienna, Austria, 2001; No. 39; Volume 2, p. 113. [Google Scholar]
- IAEA. Stable Isotope Hydrology: Deuterium and Oxygen-18 in Water Cycle; Gat, J.R., Gonfiantini, R., Eds.; Technical Reports Series 210; IAEA: Vienna, Austria, 1981; p. 339. [Google Scholar]
- Coplen, T.B. New guidelines for the reporting of stable hydrogen, carbon, and oxygen isotope ratio data. Geochim. Cosmochim. Acta 1996, 60, 3359. [Google Scholar] [CrossRef]
- Coplen, T.B.; Bohlke, J.K.; De Bievre, P.; Ding, T.; Holden, N.E.; Hopple, J.A.; Krouse, H.R.; Lamberty, A.; Peiser, P.S.; Revesz, K.; et al. Isotope-abundance variations of selected elements (IUPAC Technical Report). Pure Appl. Chem. 2002, 74, 1987–2017. [Google Scholar] [CrossRef]
- Dunn, P.J.H.; Carter, J.F. (Eds.) Good Practice Guide for Isotope Ratio Mass Spectrometry, 2nd ed.; FIRMS: Bristol, UK, 2018; p. 84. ISBN 978-0-948926-33-4. Available online: http://www.forensic-isotopes.org/gpg.html (accessed on 26 November 2019).
- Craig, H. Standard for Reporting Concentrations of Deuterium and Oxygen-18 in Natural Waters. Science 1961, 133, 1833–1834. [Google Scholar] [CrossRef]
- Epstein, S.; Mayeda, T.K. Variations of 18O content of waters from natural sources. Geochim. Cosmochim. Acta 1953, 4, 213–224. [Google Scholar] [CrossRef]
- Brand, W.A.; Coplen, T.B.; Vogl, J.; Rosner, M.; Prohaska, T. Assessment of International Reference Materials for Isotope-Ratio Analysis (IUPAC Technical Report). Pure Appl. Chem. 2014, 86, 425–467. [Google Scholar] [CrossRef]
- Dansgaard, W. The isotope composition of natural waters. Medd. Grønland 1961, 165, 120. [Google Scholar]
- Gat, J.R.; Carmi, I. Evolution of the Isotopic Composition of Atmospheric Waters in the Mediterranean Sea Area. J. Geophys. Res. 1970, 75, 3039–3048. [Google Scholar] [CrossRef]
- Cruz-San, J.; Araguas-Araguas, L.; Rozanski, K.; Benavente, J.; Cardenal, J.; Hidalgo, M.C.; Garcia-Lopez, S.; Martinez-Garrido, J.C.; Moral, F.; Olias, M. Sources of precipitation over South-Eastern Spain and groundwater recharge—An isotopic study. Tellus B 1992, 44, 226–236. [Google Scholar] [CrossRef]
- IAEA. Isotopic Composition of Precipitation in the Mediterranean Basin in Relation to Air Circulation Patterns and Climate: Final Report of a Coordinated Research Project 2000–2004; IAEA-TECDOC-1453; IAEA: Vienna, Austria, 2005. [Google Scholar]
- Gat, J.R.; Shemesh, A.; Tziperman, E.; Hecht, A.; Georgopoulos, D.; Basturk, O. The stable isotope composition of waters of the eastern Mediterranean Sea. J. Geophys. Res. 1996, 101, 6441–6451. [Google Scholar] [CrossRef]
- Vreča, P.; Krajcar Bronić, I.; Horvatinčić, N.; Barešić, J. Isotopic characteristics of precipitation in Slovenia and Croatia: Comparisom of continental and maritime stations. J. Hydrol. 2006, 330, 457–469. [Google Scholar] [CrossRef]
- Crawford, J.; Hughes, C.E.; Lykoudis, S. Alternative least squares methods for determining the meteoric water line, demonstrated using GNIP data. J. Hydrol. 2014, 519, 2331–2340. [Google Scholar] [CrossRef]
- Hughes, C.E.; Crawford, J. A new precipitation weighted method for determining the meteoric water line for hydrological applications demonstrated using Australian and global GNIP data. J. Hydrol. 2012, 464, 344–351. [Google Scholar] [CrossRef]
- Araguás-Araguás, L.; Fröhlich, K.; Rozanski, K. Deuterium and oxygen-18 isotope composition of precipitation and atmospheric moisture. Hydrol. Process. 2000, 14, 1341–1355. [Google Scholar] [CrossRef]
- Peng, H.; Mayer, B.; Harris, S.; Krouse, H.R. A 10-yr record of stable isotope ratios of hydrogen and oxygen in precipitation at Calgary, Alberta, Canada. Tellus B 2004, 56, 147–159. [Google Scholar] [CrossRef]
- Lucas, L.; Unterweger, M.P. Comprehensive review and critical evaluation of the half-life of tritium. J. Res. Natl. Inst. Stand. Technol. 2000, 105, 541–549. [Google Scholar] [CrossRef]
- Nikolov, J.; Krajcar Bronić, I.; Todorović, N.; Stojković, I.; Barešić, J.; Petrović-Pantić, T. Tritium in water—Hydrology and health implications. In Tritium—Advances in Research and Applications; Janković, M.M., Ed.; NOVA Science Publishers: New York, NY, USA, 2018; pp. 157–213. [Google Scholar]
- Tadros, C.V.; Hughes, C.E.; Crawford, J.; Hollins, S.E.; Chisari, R. Tritium in Australian precipitation: A 50 year record. J. Hydrol. 2014, 513, 262–273. [Google Scholar] [CrossRef]
- Rozanski, K.; Gonfiantini, R.; Araguas-Araguas, L. Tritium in the global atmosphere: Distribution patterns and recent trends. J. Phys. G Nucl. Part. Phys. 1991, 17, 523–536. [Google Scholar] [CrossRef]
- Galeriu, D.; Melintescu, A.; Beresford, N.A.; Crout, N.M.J.; Takeda, H. 14C and tritium dynamics in wild mammals: A metabolic model. Radioprotection 2005, 40, S351–S357. [Google Scholar] [CrossRef][Green Version]
- Hebert, D. Technogenic Tritium in Central European Precipitations. Isot. Environ. Health Stud. 1990, 26, 592–595. [Google Scholar] [CrossRef]
- UN; ILO; WHO. Selected Radionuclides—Environmental Health Criteria 25; WHO: Geneva, Switzerland, 1983; ISBN 92-4-154085-0. [Google Scholar]
- Nimac, I.; Perčec Tadić, M. New 1981–2010 climatological normals for Croatia and comparison to previous 1961–1990 and 1971–2000 normals. In Proceedings of the GeoMLA Conference, Belgrade, Serbia, 21–24 June 2016; University of Belgrade—Faculty of Civil Engineering: Belgrade, Serbia, 2016; pp. 79–85. [Google Scholar]
- Köppen, W. Das geographische System der Klimate. In Handbuch der Klimatologie; Köppen, W., Geiger, G., Eds.; Gebrüder Borntraeger: Berlin, Germany, 1936; pp. 1–44. [Google Scholar]
- Peel, M.C.; Finlyanson, B.L.; McMahon, T.A. Updated world map of the Köppen-Geiger climate classification. Hydrol. Earth Syst. Sci. 2007, 11, 1633–1644. [Google Scholar] [CrossRef]
- Krajcar Bronić, I.; Horvatinčić, N.; Obelić, B. Two decades of environmental isotope records in Croatia: Reconstruction of the past and prediction of future levels. Radiocarbon 1998, 40, 399–416. [Google Scholar] [CrossRef]
- Krajcar Bronić, I.; Vreča, P.; Horvatinčić, N.; Barešić, J.; Obelić, B. Distribution of hydrogen, oxygen and carbon isotopes in the atmosphere of Croatia and Slovenia. Arch. Ind. Hyg. Toxicol. 2006, 57, 23–29. [Google Scholar]
- Krajcar Bronić, I.; Horvatinčić, N.; Barešić, J.; Obelić, B.; Vreča, P. Widening the Radiation Protection World, Tritium distribution in precipitation over Croatia and Slovenia. In Proceedings of the 11th International Congress of the International Radiation Protection Association, Madrid, Spain, 23–28 May 2004; IRPA: Madrid, Spain, 2014. ISBN 84-87078-05-2. [Google Scholar]
- Horvatinčić, N.; Kapelj, S.; Sironić, A.; Krajcar Bronić, I.; Kapelj, J.; Marković, T. Investigation of water resources and water protection in the karst area of Croatia using isotopic and geochemical analyses. In Proceedings of the Advances in Isotope Hydrology and its Role in Sustainable Water Resources Management (IHS-2007), Vienna, Austria, 21–25 May 2007; IAEA: Vienna, Austria, 2007; Volume 2, pp. 295–304, ISBN 978-92-0-110207-2. [Google Scholar]
- Horvatinčić, N.; Barešić, J.; Krajcar Bronić, I.; Karman, K.; Forisz, I.; Obelić, B. Study of the bank filtered groundwater system of the Sava River at Zagreb (Croatia) using isotope analyses. Cent. Eur. Geol. 2011, 54, 121–127. [Google Scholar] [CrossRef]
- Babinka, S.; Obelić, B.; Krajcar Bronić, I.; Horvatinčić, N.; Barešić, J.; Kapelj, S.; Suckow, A. MRT of water from springs of the Plitvice Lakes and Una River area. In Book of Abstracts IAEA-CN-151, Proceedings of the IAEA IHS International Symposium on Advances in Isotope Hydrology and its Role in Sustainable Water Resources Management, Vienna, Austria, 21–25 May 2007; IAEA: Vienna, Austria, 2007; p. 45. [Google Scholar]
- Mandić, M.; Bojić, D.; Roller-Lutz, Z.; Lutz, H.O.; Krajcar Bronić, I. Note on the spring region of Gacka River (Croatia). Isot. Environ. Health Stud. 2008, 44, 201–208. [Google Scholar] [CrossRef]
- Pezdič, J. Izotopi in Geokemijski Procesi; Naravoslovnotehniška Fakulteta, Oddelek za Geologijo: Ljubljana, Slovenia, 1999; p. 269. [Google Scholar]
- Vreča, P.; Krajcar Bronić, I.; Leis, A.; Brenčič, M. Isotopic composition of precipitation in Ljubljana (Slovenia). Geologija 2008, 51, 169–180. [Google Scholar] [CrossRef]
- Vreča, P.; Krajcar Bronić, I.; Leis, A.; Demšar, M. Isotopic composition of precipitation at the station Ljubljana (Reaktor), Slovenia—Period 2007–2010. Geologija 2014, 57, 217–230. [Google Scholar] [CrossRef]
- Vreča, P.; Krajcar Bronić, I.; Leis, A. Isotopic composition of precipitation in Portorož (Slovenia). Geologija 2011, 54, 129–138. [Google Scholar] [CrossRef]
- Vreča, P.; Malenšek, N. Slovenian Network of Isotopes in precipitation (SLONIP)—A review of activities in the period 1981–2015. Geologija 2016, 59, 67–84. [Google Scholar] [CrossRef]
- Horvatinčić, N.; Krajcar Bronić, I.; Obelić, B.; Bistrović, R. Long-time atmospheric tritium record in Croatia. Acta Geol. Hung. 1996, 39, 81–84. [Google Scholar]
- Horvatinčić, N.; Krajcar Bronić, I. 14C and 3H as indicators of the environmental contamination. RMZ Mater. Geoenviron. 1998, 45, 56–60. [Google Scholar]
- Barešić, J.; Horvatinčić, N.; Krajcar Bronić, I.; Obelić, B.; Vreča, P. Stable isotope composition of daily and monthly precipitation in Zagreb. Isot. Environ. Health Stud. 2006, 42, 239–249. [Google Scholar] [CrossRef] [PubMed]
- Zaninović, K.; Gajić-Čapka, M.; Perčec Tadić, M.; Vučetić, M.; Milković, J.; Bajić, A.; Cindrić, K.; Cvitan, L.; Katušin, Z.; Kaučić, D.; et al. Klimatski Atlas Hrvatske/Climate Atlas of Croatia 1961–1990, 1971–2000; Državni Hidrometeorološki Zavod: Zagreb, Croatia, 2008. [Google Scholar]
- Gehre, M.; Hoefling, R.; Kowski, P.; Strauch, G. Sample preparation device for quantitative hydrogen isotope analysis using chromium metal. Anal. Chem. 1996, 68, 4414–4417. [Google Scholar] [CrossRef]
- Surić, M.; Roller-Lutz, Z.; Mandić, M.; Krajcar Bronić, I.; Juračić, M. Modern C, O, and H isotope composition of speleothem and dripwater from Modrič Cave, eastern Adriatic coast (Croatia). Int. J. Speleol. 2010, 39, 91–97. [Google Scholar] [CrossRef]
- Coplen, T.B.; Wassenaar, L.I. LIMS for Lasers for achieving long-term accuracy and precision of δ2H, δ17O, and δ18O of waters using laser absorption spectrometry. Rapid Commun. Mass Spectrom. 2015, 29, 2122–2130. [Google Scholar] [CrossRef]
- Horvatinčić, N. Radiocarbon and tritium measurements in water samples and application of isotopic analyses in hydrology. Fizika 1980, 12, 201–218. [Google Scholar]
- Krajcar Bronić, I.; Obelić, B.; Srdoč, D. The simultaneous measurement of tritium activity and background count rate in a proportional counter by the Povinec method: Three years experience at the Rudjer Bošković Institute. Nucl. Instrum. Methods Phys. Res. B 1986, 17, 498–500. [Google Scholar] [CrossRef]
- Barešić, J.; Horvatinčić, N.; Krajcar Bronić, I.; Obelić, B. Comparison of two techniques for low-level tritium measurement—Gas proportional and liquid scintillation counting. In Proceedings of the Third European IRPA Congress, Helsinki, Finland, 14–18 June 2010; IRPA: Helsinki, Finland, 2010; pp. 1988–1992. [Google Scholar]
- Barešić, J.; Krajcar Bronić, I.; Horvatinčić, N.; Obelić, B.; Sironić, A.; Kožar-Logar, J. Tritium activity measurement of water samples using liquid scintillation counter and electrolytical enrichment. In Proceedings of the 8th Symposium of the Croatian Radiation Protection Association, Krk, Croatia, 13–15 April 2011; Krajcar Bronić, I., Kopjar, N., Milić, M., Branica, G., Eds.; HDZZ: Zagreb, Croatia, 2011; pp. 461–467. [Google Scholar]
- Krajcar Bronić, I.; Barešić, J.; Sironić, A.; Horvatinčić, N. Stability analysis of systems for preparation and measurement of 3H and 14C (Analiza stabilnosti sustava za pripremu i mjerenje 3H i 14C, in Croatian with English Abstract). In Proceedings of the 9th Symposium of the Croatian Radiation Protection Association, Krk, Croatia, 10–12 April 2013; Knežević, Ž., Majer, M., Krajcar Bronić, I., Eds.; CRPA: Zagreb, Croatia, 2013; pp. 495–501. [Google Scholar]
- Stojković, I.; Todorović, N.; Nikolov, J.; Krajcar Bronić, I.; Barešić, J.; Kozmidic Luburić, U. Methodology of tritium determination in aqueous samples by Liquid Scintillation Counting techniques. In Tritium—Advances in Research and Applications; Janković, M.M., Ed.; NOVA Science Publishers: New York, NY, USA, 2018; pp. 99–156. [Google Scholar]
- Rozanski, K.; Gröning, M. Tritium assay in water samples using electrolytic enrichment and liquid scintillation spectrometry. In Quantifying Uncertainty in Nuclear Analytical Measurements IAEA-TECDOC-1401; IAEA: Vienna, Austria, 2004; pp. 195–217. [Google Scholar]
- Gröning, M.; Auer, R.; Brummer, D.; Jaklitsch, M.; Sambandam, C.; Tanwee, A.; Tatzber, H. Increasing the performance of tritium analysis by electrolytic enrichment. Isot. Environ. Health Stud. 2009, 45, 118–125. [Google Scholar] [CrossRef]
- IAEA. Statistical Treatment of Environmental Isotopes in Precipitation; Technical Report Series 331; IAEA: Vienna, Austria, 1992; p. 781. [Google Scholar]
- Australian Nuclear Science and Technology Organisation (ANSTO). Local Meteoric Water Line Freeware. 2012. Available online: https://openscience.ansto.gov.au/collection/879 (accessed on 28 November 2019).
- Barešić, J.; Štrok, M.; Svetek, B.; Vreča, P.; Krajcar Bronić, I. Activity concentration of tritium (3H) in precipitation—Long-term investigations performed in Croatia and Slovenia. In Proceedings of the Sixth International Conference on Radiation and Applications in Various Fields of Research, Ohrid, North Macedonia, 18–22 June 2018; Ristić, G., Ed.; RAD Association: Niš, Serbia, 2018; p. 186. [Google Scholar]
- Krajcar Bronić, I. Environmental 14C and 3H levels in Croatia. In Book of Abstracts, ENVIRA2017, Proceedings of the 4th International Conference on Environmental Radioactivity: Radionuclides as Tracers of Environmental Processes, Vilnius, Litva, 29 May–2 June 2017; Lujaniene, L., Povinec, P., Eds.; ENVIRA: Vilnius, Litva, 2017; p. 152. [Google Scholar]
- Palcsu, L.; Morgenstern, U.; Sültenfuss, J.; Koltai, G.; László, E.; Temovski, M.; Major, Z.; Nagy, J.T.; Papp, L.; Varlam, C.; et al. Modulation of Cosmogenic Tritium in Meteoric Precipitation by the 11-year Cycle of Solar Magnetic Field Activity. Sci. Rep. 2018, 8, 12813. [Google Scholar] [CrossRef]
© 2020 by the authors. Licensee MDPI, Basel, Switzerland. This article is an open access article distributed under the terms and conditions of the Creative Commons Attribution (CC BY) license (http://creativecommons.org/licenses/by/4.0/).