Abstract
Increased connectivity between coastal lagoons and the sea is expected to entail a greater proportion of marine species in the former. Chetumal Bay, estuary of the Hondo river into the Caribbean, had a limited access to the sea until the opening of the Zaragoza Canal. We sought changes in the fish community from 1999–2001 (just after an expansion of the canal) to 2015–2018. The same fishing gear was used, in the same localities, during all seasons. Total fish abundance and mean local richness decreased, although total abundance increased in the polyhaline zone. Diversity was greater in the oligohaline zone in 1999–2001, and in the mesohaline zone in 2015–2018. Three guilds were absent in 2015–2018: Medium-sized herbivores, large piscivores, and medium-sized planktivores. Abundance of small benthivores decreased by decade; medium-sized piscivores and small planktivores became more abundant in 2015–2018 in the polyhaline zone. These changes may be due to the opening of the channel, but illegal fishing outside the bay may explain the decrease in juveniles of large piscivores, and erosion in the innermost part may be destroying important habitats. Our findings can be a reference for similar situations, as coastal development and climate change interact and affect tropical estuaries.
1. Introduction
Chetumal Bay (known as Corozal Bay in Belize) is the estuary of the Hondo River and minor affluents, connecting them to the Caribbean Sea, at the border between Mexico and Belize. This large water body (about 3500 km2 in area) is protected by both countries [1]. For thousands of years, the narrow and winding natural passage of Bacalar Chico was the connection of the Mexican part of the bay to the Caribbean Sea; a much wider opening exists near the Belize–Guatemala border, about 300 km south. However, between 1999 and 2004 an artificial channel was dredged and expanded for navigation, the Zaragoza Canal, opened initially in 1901, but never made deep enough for larger vessels. This direct communication started having a strong influence on the abiotic and biotic conditions of the system, including the intrusion of corals and other reef organisms to formerly brackish areas of the bay [2].
Many of the fishes found in this system are important resources. Most relevant for recreational fisheries in Belize and Mexico are bonefish (Albula vulpes), but also permit (Trachinotus falcatus), snook (Centropomus undecimalis), and tarpon (Megalops atlanticus) [3]. Other species are fished mostly for local markets: Snappers (Lutjanus spp., especially L. griseus and L. apodus), mojarras (Gerres cinereus, Eugerres plumieri), mackerels (Scomberomorus maculatus and other species), and barracuda (Sphyraena barracuda) [4]. Other mojarras (Eucinostomus spp.) are also abundant, as are needlefishes (Strongylura spp.), pupfishes (Cyprinodontidae), flatfishes (several families), sea catfishes (Ariidae), gobies (Gobiidae), puffer (Sphoeroides testudineus), and, under the influence of freshwater, also cichlids, poeciliids, and tetra (Astyanax bacalarensis), among others [5]. A recent addition to this ichthyofauna is an exotic invader, lionfish (Pterois volitans) (unpublished observation).
Qualitative and quantitative data on the ichthyofauna of Chetumal Bay are available from the time just before the expansion in depth and width of the Zaragoza Canal [5,6]. Our aim in this paper is to evaluate ichthyological changes almost two decades later, in terms of composition, diversity (including richness, evenness, beta-diversity), abundance of species, trophic guilds, and salinity-tolerance categories, maximum length, and distribution through the salinity gradient of the bay, from the river mouth to the Zaragoza Canal. We discuss possible processes to account for the observed patterns.
2. Materials and Methods
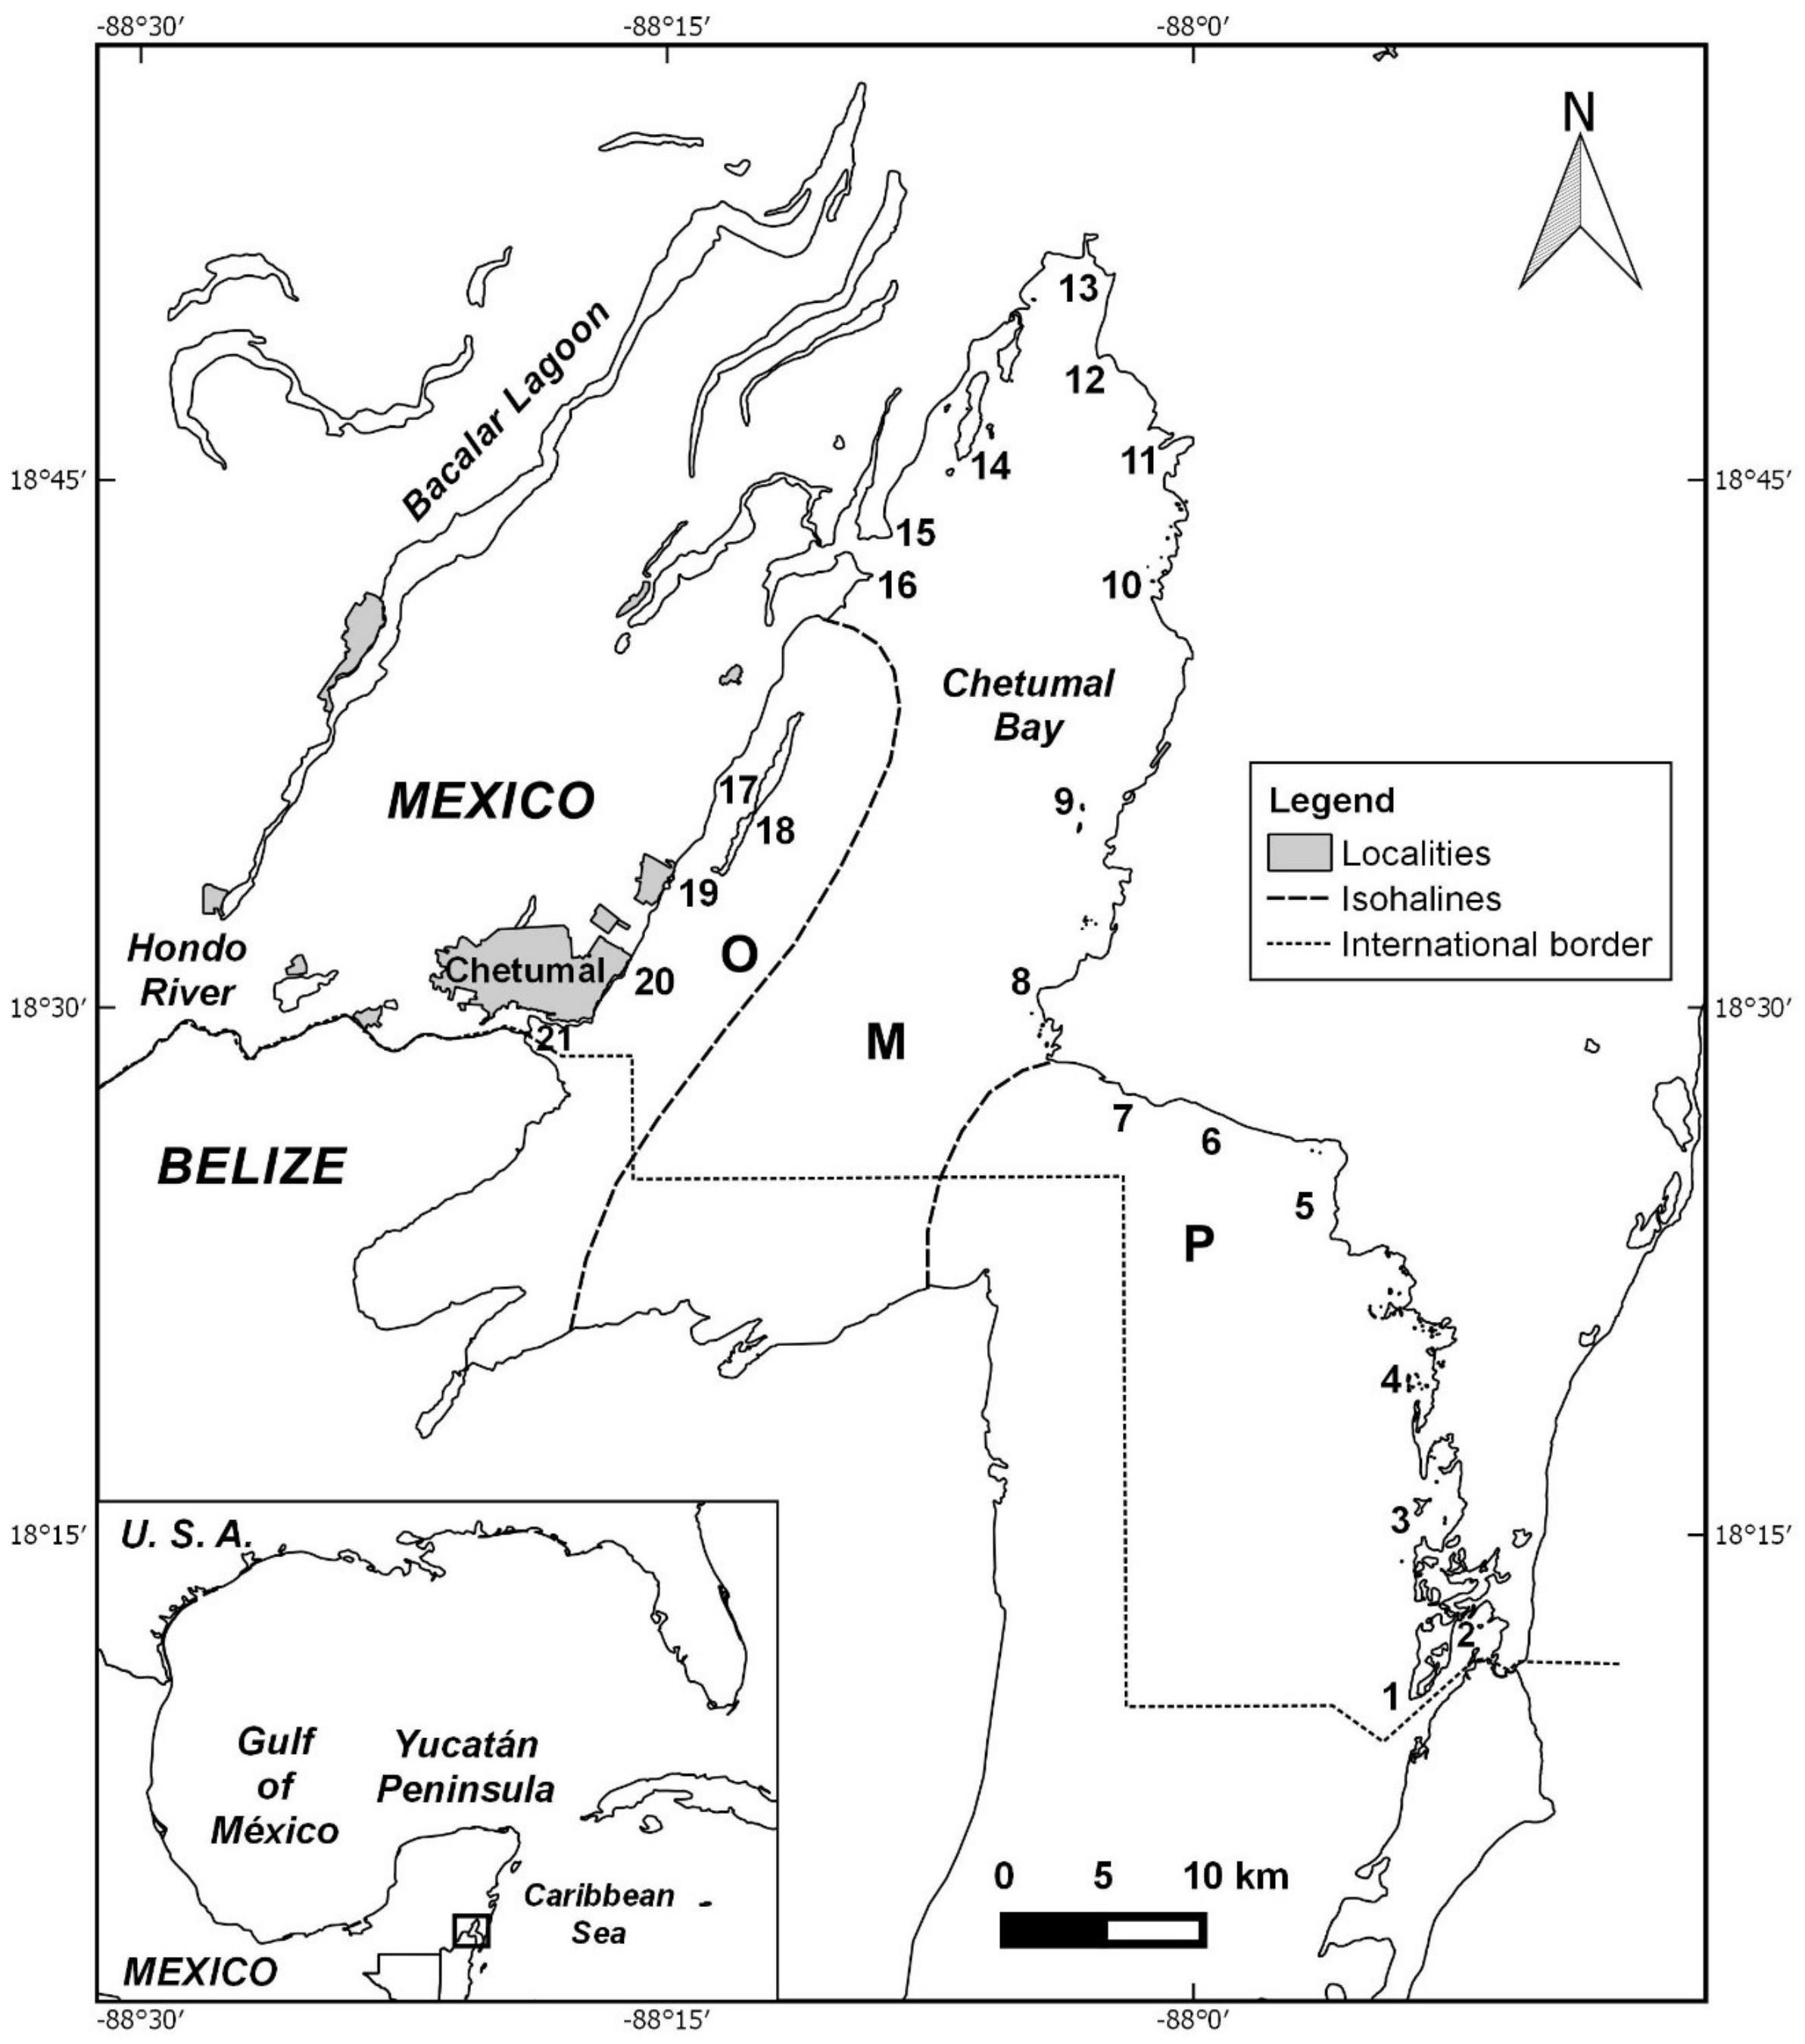
2.1. Study Area
The region has a warm humid climate, with summer rains and an average temperature greater than 26.5 °C, with an annual precipitation of 1000–1500 mm; the bay is shallow, its maximum depth 5 m (mean 3.2 m), with scattered, much deeper, sinkholes [7]. Most of the bay is mesohaline (13 to 22 psu), with freshwater conditions occurring near the mouth of the Hondo River, and marine salinity close to the Zaragoza Canal [8]. Salinity varies seasonally, increasing in the dry season (February to April) and decreasing during the rains (May to October) and during the colder “north winds” season (November to January). However, three areas can be recognized year-round, and we term them here Oligohaline, Mesohaline, and Polyhaline (Figure 1). Except in winter, southeasterly trade winds predominate, with a mean wind speed of 3.1 m·s−1 [7].
Figure 1.
Study area, the northern (Mexican) part of the Bay of Chetumal (known as Bay of Corozal in Belize). Localities: 1 Cayo Chelem; 2 Zaragoza Canal; 3 Dos de Abril; 4 Mala Noche; 5 Punta Jas; 6 Mainada; 7 Punta Calentura; 8 Punta Flor; 9 Dos Hermanos; 10 Mogote Barlovento; 11 Siete Esteros; 12 Tollocan; 13 Río Krik; 14 Cayo Venado; 15 Punta Pol Box; 16 Punta Lagarto; 17 Isla Tamalcab (leeward); 18 Isla Tamalcab (windward); 19 Punta Catalán; 20 UQROO; 21 ECOSUR. Abbreviations for salinity zones: O—oligohaline; M—mesohaline; P—polyhaline (see text). Map by Janneth Padilla.
Tides are semidiurnal, with excursions ≥ 0.5 m but, nevertheless, inducing inward or outward currents at the Zaragoza Canal and minor channels. Water temperature fluctuates between 22 °C at the peak of the north-winds season and 31 °C in August [7]. Bottoms are mostly sandy or sandy-muddy, except near rocky points, usually without vegetation but often with seagrass and algae. Mangrove rims the coast, with Avicennia germinans reaching heights of 10 m [9], and occasional patches of exotic Casuarina equisetifolia trees.
There are no human settlements in the northern half of the bay. Chetumal City lies at the mouth of the Hondo river (Figure 1), and just to the south is the Belizean town of Sarteneja. Pesticides from agricultural fields along both banks of the river and organic matter from Chetumal represent environmental stressors [10], although largely confined to the river mouth by winds and currents.
2.2. Field and Laboratory Work
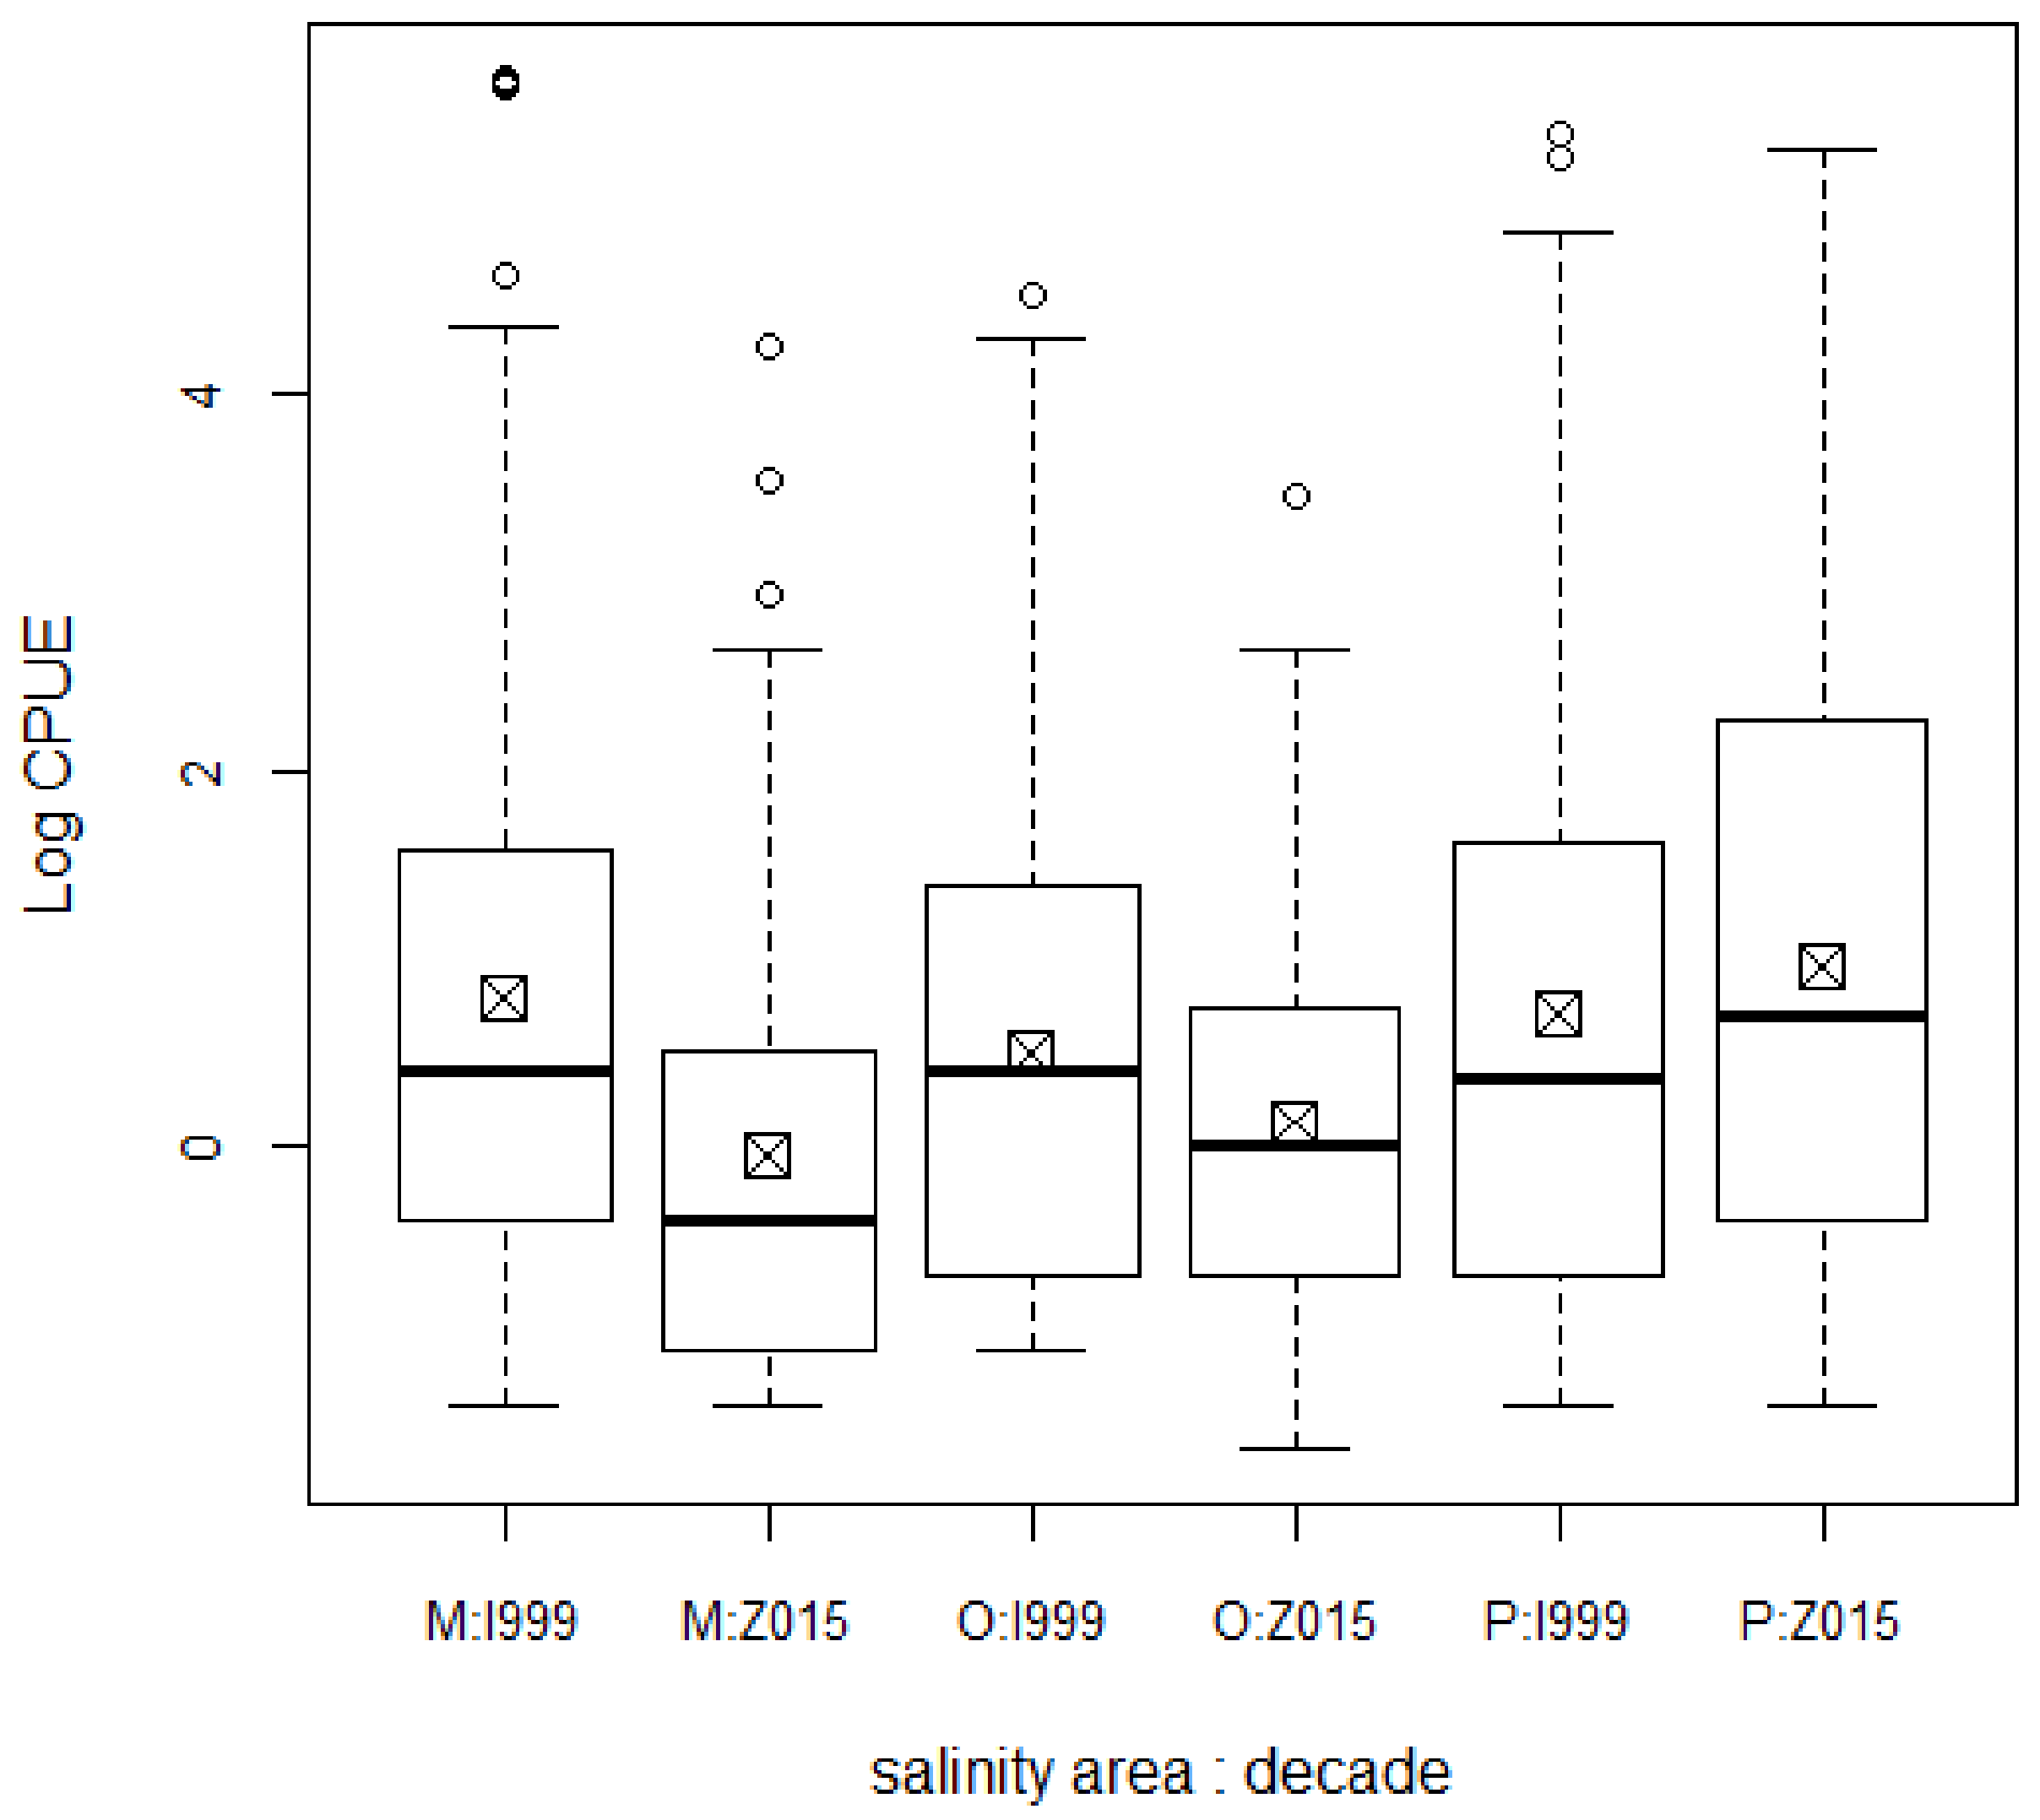
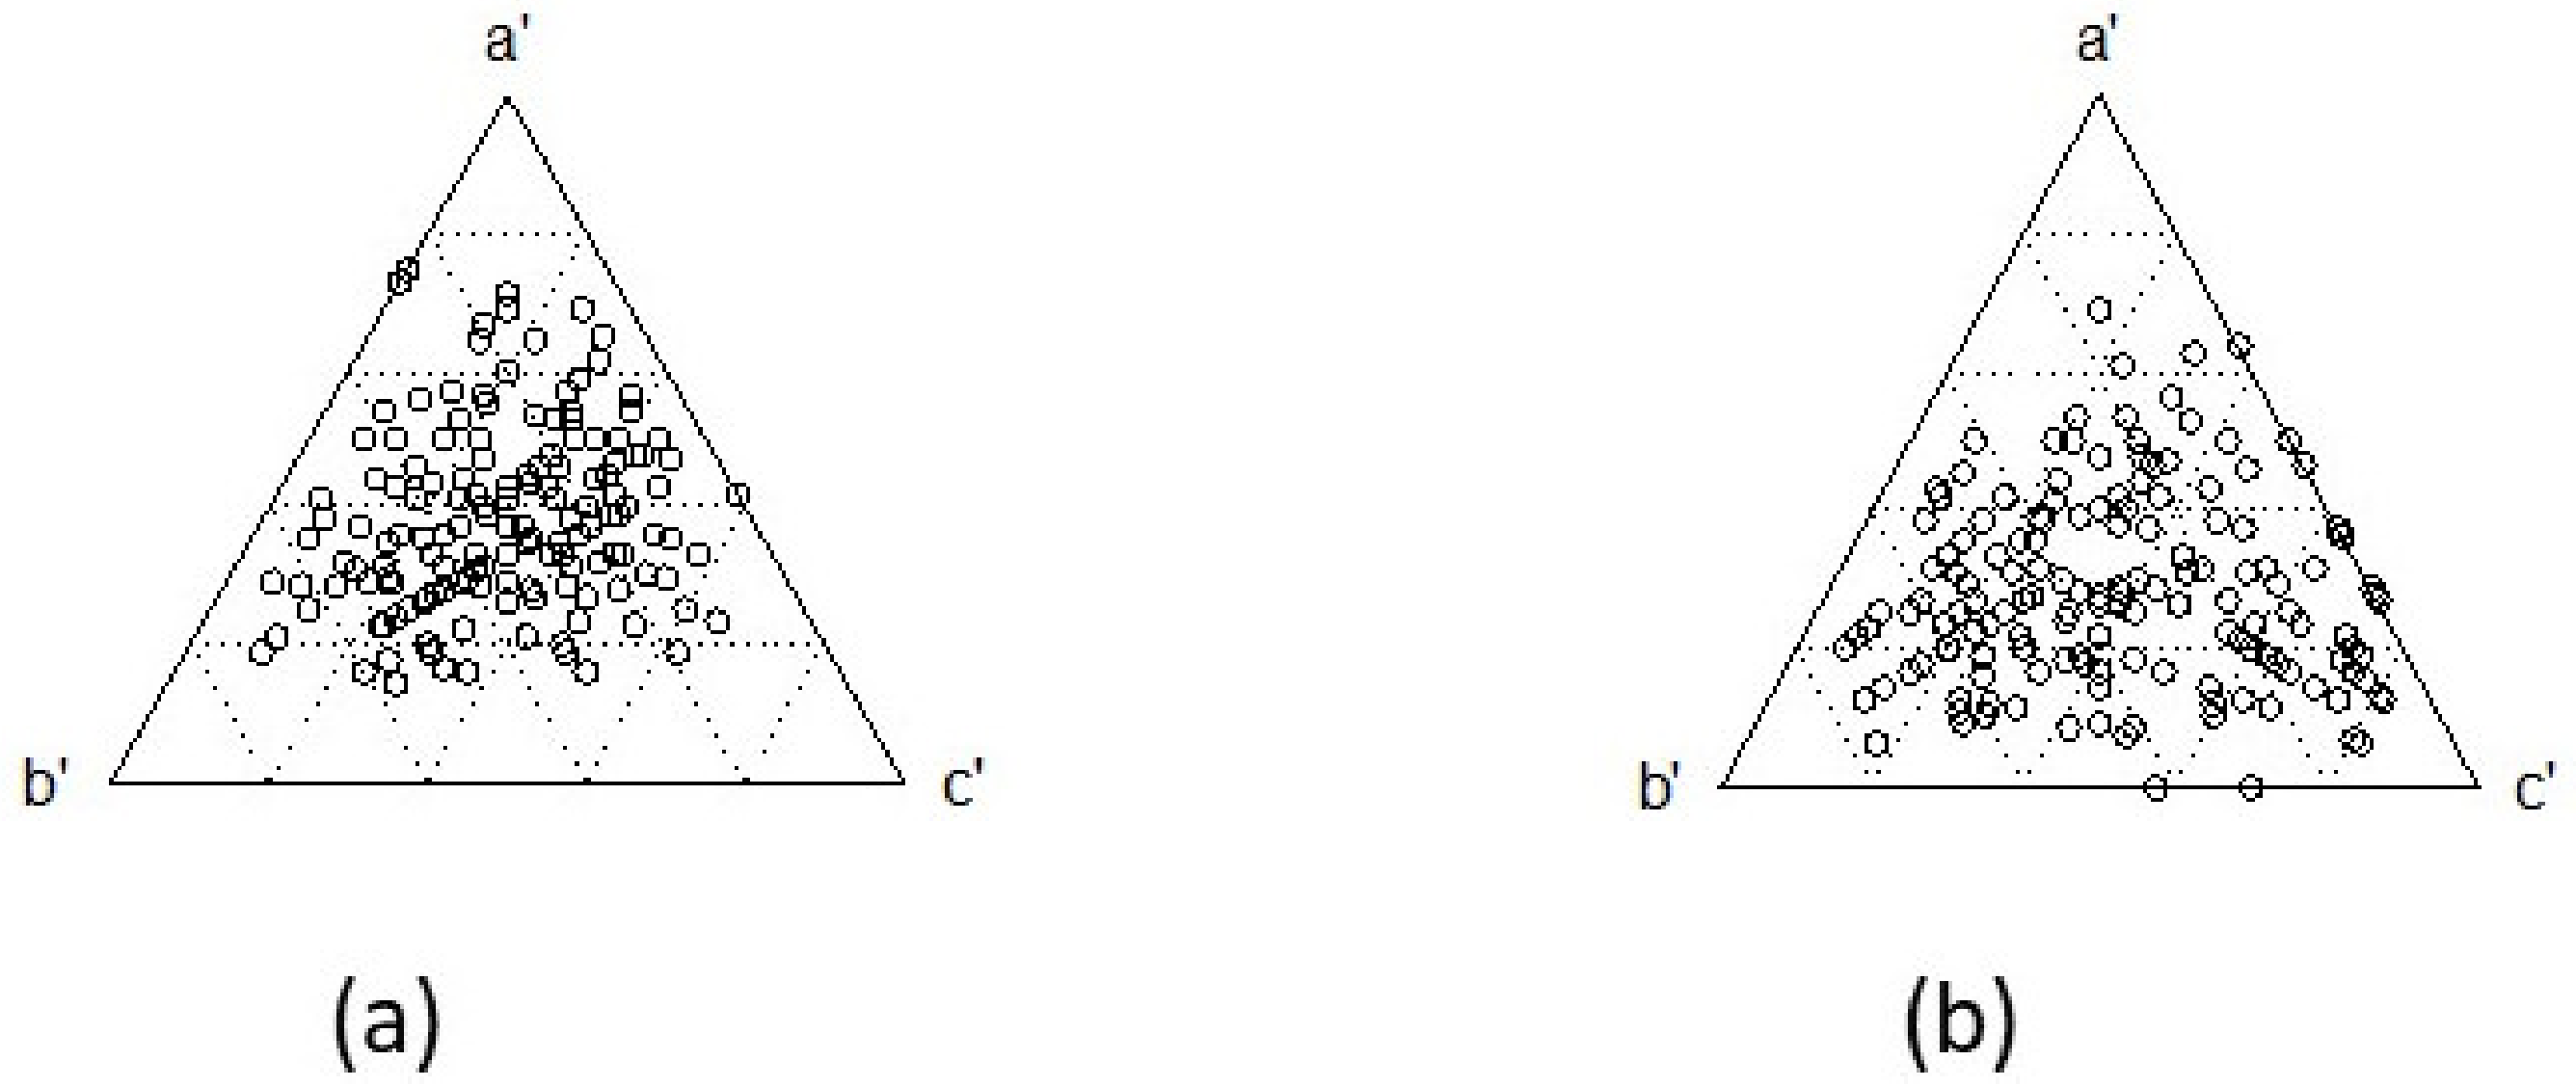
We sampled the bay for fishes at the same 21 localities explored by us about 15 years before [6] (Figure 1); the same procedure described below was applied. Expeditions took place in April 13–15 (dry season) and July 6–8, 2016 (wet season), and in April 23–24, 2018 (same as in 1999–2001), and more than 13,000 specimens were collected from 162 samplings, using the same fishing gear and effort (a beach seine, 20 m long, 1.2 m tall, 1 cm diagonal mesh, 2–5 seinings per site, until no new species were found, each seining lasting ca. 3 min). The contagious distribution of some species could be a source of heteroscedasticity even within one same site, but usually abundant species continued to be present in a similar proportion in all subsequent seinings.
Fish were identified and counted in situ and then freed; voucher specimens were kept only for those species which could not be determined in the field, such as specimens of Eucinostomus, which were deposited in the fish collection of ECOSUR (acronym ECO-CH). Abundance was controlled by the number of seinings per site/date, as catch per unit effort (CPUE). Collected specimens were measured (standard length) to the nearest millimeter with a vernier caliper or an ichthyometer.
Composition (i.e., the species list) included data from the literature [11,12], revision of collection specimens, and observations or captures outside seinings.
2.3. Data Analysis
We compared the following variables between decades (1999–2001 vs. 2015–2018) and by salinity areas (Oligohaline, Mesohaline, and Polyhaline—hereafter zones O, M, P): (a) composition (i.e., presence/absence of species); (b) richness; (c) diversity, both alpha and beta; (d) abundance (i.e., CPUE) of dominant species; (e) abundance by guild (see below); (f) abundance by salt-tolerance category [13]: marine stenohaline, marine euryhaline, estuarine resident, freshwater primary or secondary; (g) maximum observed length of selected species; (h) frequency (i.e., proportion of localities where present); (i) environmental abiotic variables, mainly temperature, salinity, and wind at the time of capture. We did not compare biotic data by month because an earlier analysis found no seasonal difference in 1999–2001 [6]. Differences in salinity (refractometer, to 1 psu), temperature (digital thermometer, to 1 °C) and wind force (Beaufort scale) were examined controlling by season (see Study Area) and time of day (morning 07–10:59, noon 11–14:59, afternoon 15–19 h: time when sampling started). Fourteen guilds were defined as combinations of feeding habits and three body-size categories [14,15,16].
In addition to analyzing pooled data, the variables listed above were examined separately by salt-tolerance category of the fishes. Abundance was log-transformed to achieve homoscedasticity and normality of the data. Only species that made up 75% of total abundance were analyzed separately. The test used was a two-way ANOVA (by decade and by salinity area), with an interaction term; post-hoc comparisons were performed using Tukey Honest Distance. Frequencies were compared by a Kolmogorov–Smirnov test (KS). Diversity (H’n, Shannon index, in nats) and its components (richness, as number of species; J’n, Pielou’s equity) were calculated by locality and controlled by rarefaction. Beta-diversity as turnover was explored via the Sørensen index and plotted in the triangular graph suggested by Koleff et al. [17]. The software used to analyze data and prepare graphs was R [17], with p < 0.05 (instances where p > 0.05 but p < 0.10 are also mentioned and discussed); the package “vegan” was used for diversity analyses [18].
We sampled under Permit PPF/DGOPA-053/15 from the Comisión Nacional de Pesca (the Mexican Commission for Fisheries), with further authorization by the protected area “Bahía de Chetumal Santuario del Manatí”. Accession to our database will be provided during review.
3. Results
Sampling effort, with emphasis on the mesohaline zone (samplings: 140 O, 261 M, 215 P) due to the greater number of localities (5 O, 8 M, 7 P), did not vary between decades (KS, D = 0.67). Every locality was sampled on average 29 times between both decades. The mean number of fish by species per sampling was 9; the maximum, 294.
Salinity varied from 1 to 36 psu (mean 10.9 psu); water temperature, 25–34 °C (mean 29 °C). Wind force in the Beaufort scale was 1 to 4 (mode 2). Controlling by season, salinity varied significantly between decades (F = 10.9), changing from a mean of 10.4 psu in 1999–2001 to 11.8 psu in 2015–2018. Controlling by season and by time of day, water temperature was also significantly different between decades (F = 6.9), from 29.2 °C to 28.7 °C, as well as wind force (F = 21.6), from 1.9 to 2.4 in the Beaufort scale.
General abundance of fish decreased from 1999–2001 to 2015–2018, except in zone P (F = 5.82 by decade, F = 8.05 for the interaction decade:zone; Figure 2, Appendix A). By zone, an “estuary effect” is apparent, with greater abundance in zone P than in O, but greater in O than in M (F = 5.97).
Figure 2.
General abundance of fishes by salinity area and decade in Chetumal Bay. Abundance (CPUE) log-transformed. Posthoc significant differences between M:1999 and M:2015, P:1999 and M:2015, M:2015 and P:2015, and O:2015 and P:2015. Abbreviations for salinity zones: O—oligohaline; M—mesohaline; P—polyhaline; “1999” is 1999–2001 and “2015” is 2015–2018.
There were few changes in composition (Appendix B). The most conspicuous novelty is the lionfish Pterois volitans, absent in 1999–2001, now confirmed in the zone P, closest to the Zaragoza Canal. Among the species that were captured in 1999–2001 but not in 2015–2018 are A. vulpes, Ariopsis assimilis, Centropomus undecimalis, Jenkinsia lamprotaenia, Opsanus beta, and Opisthonema oglinum; however, all of them are still present in the area, as observed outside our seinings. On the contrary, species that were not seined in 1999–2001 but that were collected in 2015–2018 include A. bacalarensis, Corvula sanctaeluciae, Hypanus spp., Diapterus auratus, and Lutjanus spp. Juveniles of Trachinotus falcatus, not found in the quantitative samplings in 1999–2001, were captured in all three salinity zones in 2015–2018. Three species of Strongylura were seined in 1999–2001, but in 2015–2018 only S. notata. Also exclusive to the older decade were usually reef-dwelling species, as Holocentrus rufus and Sparisoma rubripinne, freshwater secondary species, as Poecilia kykesis, and others (Syngnathus spp., Selene vomer, Haemulon spp., Chaetodipterus faber, Chilomycterus schoepfi, Bothus ocellatus, and Acanthurus spp.). One case of concern was Gobiosoma yucatanum, the only species endemic to Chetumal Bay [19,20], which we found in 1999–2001, but not in the most recent expeditions.
Changes in dominance were clearer than changes in composition. Atherinomorus stipes and Harengula jaguana were always abundant and frequent, the former especially in the windward (sandy) side of mangrove islands, whereas Floridichthys polyommus, in both decades, predominated in the leeward (silty) side. Bairdiella ronchus and Cyprinodon artifrons decreased (in frequency, 3 to 1); in 1999–2001, C. artifrons was more abundant than the ecologically similar Jordanella pulchra, which increased in frequency from 1 to 3. Concerning another ecologically similar pair, Eugerres plumieri was more abundant than Gerres cinereus in 1999–2001 (especially in zone O), but not in 2015–2018 (G. cinereus increased in frequency from 2 to 3). The five species of Eucinostomus kept their relative abundances similar, except that E. melanopterus was not seined in 1999–2001.
Few species displayed significant changes by decade or salinity zone (Table 1). Most increases occurred in zone P, most decreases in zone M. The flatfish Achirus lineatus decreased in abundance in all three salinity zones; among zones, it preferred O to P, in spite of being a marine species. The silverside Atherinomorus stipes was almost absent from zone O back in 1999–2001, and in 2015–2018 it preferred P to M. As stated above, E. plumieri decreased, especially in zone O, which it used to prefer in 1999–2001. The needlefish Strongylura notata became more abundant in zone P in 2015–2018.
Table 1.
Fish species whose abundance changed significantly by decade (1999–2001 vs. 2015–2018) and/or between salinity zones (Oligohaline, Mesohaline, Polyhaline) in Chetumal Bay.
Diversity was not uniform by locality. In 1999–2001 most of the sites with greater diversity belonged in zone O, such as Punta Catalán (H’n = 2.47 nats) and UQROO (2.14 nats), same as equity (J’n = 0.84, 0.97, respectively) and richness (up to 19 spp.), whereas in 2015–2018 most diverse localities were in zone M, e.g., Siete Esteros (2.32 nats) and Punta Flor (2.19 nats), same as equity (0.90, 0.88, respectively) and richness (up to 14 spp., although Chelem, in zone P, reached 15 spp.).
Total diversity or equity did not differ between decades (t = 0.36 and t = 1.10, respectively), but richness yes (t = 2.30), decreasing from a mean of 11.8 spp. in 1999–2001 to 9.3 spp. in 2015–2018. Beta-diversity (turnover) did not differ between decades, although the graph shows a somewhat greater dispersion in 2015–2018 than in 1999–2001 (Figure 3). Turnover varied slightly between decades, from 0.78 to 0.79, and nestedness from 0.06 to 0.08.
Figure 3.
Beta-diversity of fishes in Chetumal Bay by decade: (a) 1999–2001; (b) 2015–2018. Circles are pairwise comparisons of species turnover derived from the Sørensen formula, where a’ are shared species, b’ are species exclusive to the focal locality and c’ are species exclusive to the compared locality.
The most frequent guilds were benthivores, small and medium-sized, followed by small planktivores and medium-sized piscivores. No large benthivores occurred in our samplings in 1999–2001 and three guilds were absent in 2015–2018: Medium-sized herbivores, large piscivores, and medium-sized planktivores. Although medium-sized and small benthivores always predominated, the proportions for the 14 guilds changed significantly between decades (χ2 = 106.75; Table 2). However, significant changes in abundance by guild between decades and/or zones occurred only for small benthivores (F = 5.27: decreased by decade), medium-sized piscivores (F = 4.03: greater in zone P than zone M in 2015–2018), and small planktivores (F = 8.00: greater in zone P than in zones M and O in 2015–2018, mostly due to juveniles of H. jaguana).
Table 2.
Fish guild occurrences in Chetumal Bay in 1999–2001 and 2015–2018. Figures are number of samplings.
By salinity-tolerance, the most frequent species were marine euryhaline, followed by resident estuarine, freshwater, and very few marine stenohaline, the latter only in the most saline localities of zone P. Freshwater fishes appeared not only in zone O, but also in stream mouths within zone M (not only secondary freshwater species, but also primary, i.e., A. bacalarensis), especially during the rainy season. The proportions did not change between decades (KS, D = 0.25). Marine euryhaline species decreased between decades in zones O and M, but increased in zone P (F = 9.54; Figure 4a). Estuarine species decreased in zones M and P, and increased in zone O, but, in spite of that trend, they always tended to prefer areas of greater salinity (F = 2.85, p = 0.06; Figure 4b).
Figure 4.
Abundances of salinity-tolerance groups of fishes by decade and salinity area in Chetumal Bay. Abundance (catch per unit effort (CPUE)) log-transformed; (a) marine euryhaline fishes; (b) estuarine resident fishes. Posthoc significant differences for (a): M:2015 against M, O, and P:1999 and P:2015; P:2015 against O:2015; (b) P vs. O and M. Abbreviations for salinity zones: O—oligohaline; M—mesohaline; P—polyhaline; “1999” is 1999–2001 and “2015” means 2015–2018.
Only two species exhibited significant differences in maximum length observed in seinings. Strongylura notata decreased in size between decades from 268.9 to 181.7 mm (F = 6.15). Eucinostomus gula increased (F = 8.49), but only in zone O, from a mean maximum length of 56.4 mm in 1999–2001 to 87.3 mm in 2015–2018; by zones, only in 2015–2018, it was larger in zone O than in zone P (50.8 mm), whereas in 1999–2001 there was no spatial difference in size. Another mojarra, E. argenteus, also seemed to increase marginally in size in all zones, from 42.4 mm in 1999–2001 to 50.0 mm in 2015–2018 (F = 3.6, p = 0.07).
4. Discussion
Given that our study features no parallel “control” for the “impacted” area, ours is not a true B.A.C.I. (Before/After-Control/Impact) design [21]. Moreover, the “before” data belong in fact to a period after the initial enlargement of the canal. Nevertheless, we expected the expansion of the Zaragoza Canal after 1999–2001 to induce changes in composition and diversity of fishes in Chetumal Bay, some of them perhaps positive for the environmental integrity (greater access of marine fishes, at least to zone P, and better development of sea grasses due to increased salinity [22]), others probably negative, not just because of the entrance of lionfish and sargasso (unpubl.), but also due to the methods required for the expansion. The bottom of the canal is mostly bedrock, so explosives are needed to deepen it, resulting in sediment suspension likely affecting habitats in the bay and adjacent reef; moreover, widening the canal implies destroying mangrove, an important habitat for fishes within and outside the bay [23].
The increase in abundance between decades specific to the polyhaline zone, as well as the increase of the guilds of medium-sized piscivores and small planktivores, and the group of marine euryhaline fishes, were in line with our expectations, given the expansion of Zaragoza Canal and its interaction with other factors (discussed below). When an artificial channel was opened in the El Carmen-Machona coastal lagoon system in the southern Gulf of Mexico, the composition of the estuary included more marine and fewer estuarine species over the course of one decade [24].
Large schools of the sardine Harengula jaguana, a planktivore that we classified as “small” because we captured mostly juveniles, occurred in zone P in 2015–2018 apparently as often as they do in the adjacent coast, usually over seagrass meadows (pers. obs.), whereas in former decades they were more abundant in zones O and M (Table 1, Appendix A). In addition, the oligohaline zone was the most diverse area in 1999–2001, but the mesohaline zone was most diverse in 2015–2018, also shifting dominance towards the seaward opening of the system. Notwithstanding, no general change in composition or diversity was apparent, and several trends that may cause concern were detected, e.g., decreases in total abundance, mean local richness, and number of guilds.
Excessive illegal fishing outside the bay may be one factor that helps explain the decrease in juveniles of large piscivores. The negative trend for this guild exists as well in the reefs adjacent to Chetumal Bay [21]. The probable shift in dominance from E. plumieri to G. cinereus may also reflect the fact that the former is preferred as a fishery resource in the bay [4].
The increased size of E. gula, and perhaps also E. argenteus, especially in zone O, could be a by-product of the decline in abundance of other benthivores in that area, possibly because of less competition. In contrast, S. notata became smaller in length in zone P, where diversity increased. Body size strongly influences trophic level and habitat use of fishes [25].
The changes in zone P may reflect the salinity increase in Chetumal Bay during the last decade, a process that had been noted already by other researchers [26]. However, the reason for this salinization is not only the expansion of Zaragoza Canal: There is a general trend in the region for the dry season to be longer, thus increasing evaporation and decrease freshwater input from rains (Carrillo, pers. comm.). As for the lower local water temperature in the face of increasing regional heat [27], the increased wind force may offer a straightforward explanation, although an interacting factor could be the canal expansion itself, i.e., greater tidal movement of water, fewer shallow sites with slow-moving water susceptible to heating.
The differences in freshwater and estuarine species are more difficult to explain, except for the catfish A. assimilis, which in 1996 suffered a massive mortality that was attributed to pollution and specific pathogens [28]; the species seemingly has not recovered ever since. The interdecadal decrease for the guild of small benthivores, many of them estuarine, especially strong in zone M, is not explainable by predation, because medium-sized and large piscivores also declined. We speculate that this decline could be accounted for, at least in zone O, by the loss of habitat due to the continued erosion of the western coast of the bay. This process that has been ongoing for centuries, as attested by Classic Mayan fishery structures that should have been in contact to the shore, but now are several meters away from the coast [29].
The man-made opening of seaward channels strongly alters benthic communities of plants and invertebrates in lagoons [30] by promoting the entrance of marine organisms, including stony corals [2], into Chetumal Bay. This obviously affects herbivore and benthivore species, also accounting for the spread of the invasive lionfish [31]. The zooplankton can be affected as well, especially if the salinity and the trophic state of the estuary change [32]. However, as stated above, we are cautious to ascribe this change solely to the expansion of the canal, given the mentioned regional trend towards less precipitation in the region, related to global climate change.
On the other hand, and although we did not detect any interdecadal difference in beta-diversity, the increased abundance in zone M of freshwater species, even primary, and of marine species in zone O, may signal a faunistic homogenization of the bay. In fact, part of our original rationale for defining these three areas was to follow approximately the isolines of 9 psu, upper salinity tolerance of the primary freshwater characid A. bacalarensis and lower limit for juveniles of the marine euryhaline snapper L. apodus, and 19 psu, upper bound for the secondary freshwater molly P. mexicana [33], and yet, in 2015–2018, many of these species were recorded outside their preferred salinity area.
As observed by Rahel [34], “[h]abitat and flow homogenization are major drivers of biotic homogenization.” At a planetary level, biotic homogenization implies invasion by nonnative species [35], a process enhanced by global warming [36]. Locally, however, impact factors, such as hurricanes, can also make the fauna more homogeneous [37]. In any case, it is clear that the canal expansion is not an isolated factor for this process.
The expansion of the Zaragoza Canal may be ethically ambiguous. On the one hand, it favors the entry of invaders and could induce faunal homogenization, as well as the probable loss of such important guilds as large piscivores. On the other hand, making the opening wider and deeper might play a positive role for the seasonal migratory movements of bonefish [12], barracuda [23], and other species between the Caribbean sea and the bay. However, if habitat destruction is not controlled, especially the flats and mangrove cays that are favorite feeding grounds for bonefish and permit, the damage would be both ecological and socioeconomical, by impinging detrimentally on such species that support an important fishery in Belize and Mexico [3].
In spite of the methodological limitations of this study, and perhaps the idiosyncratic nature of Chetumal Bay and its artificial canal, our findings can be a useful reference for similar sites elsewhere. For example, coastal works in Spain’s Mar Menor [38] have brought positive changes (increased benthic biodiversity due to greater availability of hard bottoms), but also negative ones (altered sediment quality and vegetation cover), and canals are globally a major pathway for biological invasions [39]. Examining a variety of outcomes for comparable situations should be necessary for environmental managers and ecologists alike.
Author Contributions
Conceptualization, J.J.S.-S.; methodology, J.J.S.-S. and R.L.H.-P.; software, J.J.S.-S.; validation, J.J.S.-S. and R.L.H.-P.; formal analysis, J.J.S.-S.; investigation, J.J.S.-S. and R.L.H.-P.; resources, J.J.S.-S. and R.L.H.-P.; data curation, J.J.S.-S.; writing—original draft preparation, J.J.S.-S.; writing—review and editing, J.J.S.-S. and R.L.H.-P.; visualization, J.J.S.-S.; supervision, J.J.S.-S.; project administration, J.J.S.-S.; funding acquisition, J.J.S.-S.
Funding
This research was funded by the Consejo Nacional de Ciencia y Tecnología (Mexican council for science and technology), grant number 242558.
Acknowledgments
Janneth Padilla prepared the map. In addition to the authors, field workers included Fernando Aguilar, Juan Aguilar, Rudy Castellanos, Felipe Martínez, Norman Mercado, Erica Pimentel, Áxel Schmitter and Martha Valdez. The anonymous reviewers improved the manuscript.
Conflicts of Interest
The authors declare no conflict of interest. The funders had no role in the design of the study; in the collection, analyses, or interpretation of data; in the writing of the manuscript, or in the decision to publish the results.
Appendix A
Quantitative sampling: Fish species of Chetumal Bay by salinity zone (Oligohaline, Mesohaline, Polyhaline) and decade. Figures are mean abundances (CPUE).
| Species Zone | 1999–2001 | 2015–2018 |
| Anchoa cayorum | 0.5 | 0.5 |
| O | 0 | 0.5 |
| P | 0.5 | 0 |
| Achirus lineatus | 68.3 | 13.4 |
| M | 45.4 | 2.0 |
| O | 19.0 | 9.7 |
| P | 3.8 | 1.7 |
| Albula vulpes | 3.5 | 0 |
| P | 3.5 | 0 |
| Anchoa colonensis | 0.3 | 0 |
| M | 0.3 | 0 |
| Anchoa cubana | 19.2 | 10.0 |
| M | 3.0 | 0 |
| O | 11.7 | 0 |
| P | 4.5 | 10.0 |
| Ariopsis assimilis | 2.3 | 0 |
| M | 1.0 | 0 |
| O | 1.3 | 0 |
| Astyanax bacalarensis | 0 | 45.2 |
| M | 0 | 38.0 |
| O | 0 | 1.2 |
| P | 0 | 6.0 |
| Atherinomorus stipes | 2306.3 | 590.7 |
| M | 1542.2 | 90.8 |
| O | 167.7 | 0.3 |
| P | 596.5 | 499.5 |
| Bairdiella ronchus | 43.3 | 2.0 |
| M | 21.5 | 0 |
| O | 21.3 | 0 |
| P | 0.5 | 2 |
| Bathygobius curacao | 0 | 1.2 |
| M | 0 | 1.2 |
| Bothus ocellatus | 0.3 | 0 |
| P | 0.3 | 0 |
| Canthigaster rostrata | 0 | 0.3 |
| P | 0 | 0.3 |
| Centropomus undecimalis | 1.0 | 0 |
| M | 1.0 | 0 |
| Chriodorus atherinoides | 9.8 | 2.5 |
| M | 8.2 | 0 |
| P | 1.7 | 2.5 |
| Corvula sanctaeluciae | 0 | 0.7 |
| P | 0 | 0.7 |
| Cyprinodon artifrons | 45.2 | 6.0 |
| M | 1.5 | 0.7 |
| O | 0 | 1.5 |
| P | 43.7 | 3.8 |
| Diapterus auratus | 0 | 23.3 |
| P | 0 | 23.3 |
| Eucinostomus argenteus | 34.2 | 63.6 |
| M | 9.5 | 3.3 |
| O | 4.5 | 0.5 |
| P | 20.2 | 59.8 |
| Eucinostomus gula | 269.8 | 53.8 |
| M | 38.8 | 12.3 |
| O | 9.5 | 5.0 |
| P | 221.5 | 36.5 |
| Eucinostomus harengulus | 15.7 | 30.7 |
| M | 3.3 | 11.2 |
| O | 0.3 | 1.0 |
| P | 12 | 18.5 |
| Eucinostomus jonesii | 257.5 | 72.8 |
| M | 155.3 | 13.8 |
| O | 45.3 | 34.1 |
| P | 56.8 | 24.8 |
| Eucinostomus melanopterus | 0 | 1.7 |
| M | 0 | 0.3 |
| P | 0 | 1.3 |
| Eugerres plumieri | 78.4 | 7.8 |
| M | 23.6 | 1.0 |
| O | 52.3 | 2.9 |
| P | 2.5 | 3.8 |
| Floridichthys polyommus | 133.4 | 266.7 |
| M | 78.3 | 34.4 |
| O | 12.5 | 5.5 |
| P | 42.7 | 226.8 |
| Gerres cinereus | 1.8 | 31.2 |
| M | 1 | 4.3 |
| O | 0 | 20.3 |
| P | 0.8 | 6.5 |
| Gobiosoma yucatanum | 1.5 | 0 |
| O | 1.5 | 0 |
| Gambusia sexradiata | 0.5 | 0 |
| O | 0.5 | 0 |
| Gambusia yucatana | 9.8 | 1.5 |
| M | 8.5 | 1.0 |
| P | 1.3 | 0.5 |
| Harengula clupeola | 9 | 30 |
| P | 9 | 30 |
| Harengula humeralis | 6 | 0.3 |
| P | 6 | 0.3 |
| Harengula jaguana | 174.7 | 149.0 |
| M | 37.3 | 1.0 |
| O | 74.3 | 0 |
| P | 63.0 | 148.0 |
| Hippocampus erectus | 0.3 | 0 |
| P | 0.3 | 0 |
| Hypanus americanus | 0 | 0.3 |
| M | 0 | 0.3 |
| Hyporhamphus roberti | 1.5 | 0.25 |
| M | 0 | 0.25 |
| O | 1.5 | 0 |
| Jenkinsia lamprotaenia | 2.5 | 0 |
| P | 2.5 | 0 |
| Jordanella pulchra | 8.0 | 8.9 |
| M | 8.0 | 2.0 |
| O | 0 | 6.25 |
| P | 0 | 0.7 |
| Lophogobius cyprinoides | 13.8 | 2.8 |
| M | 7.3 | 0 |
| O | 6.5 | 2.8 |
| Lutjanus griseus | 0 | 13.3 |
| P | 0 | 13.3 |
| Mayaheros urophthalmus | 4.2 | 1.5 |
| M | 4.2 | 0 |
| O | 0 | 1.5 |
| Monacanthus tuckeri | 0 | 0.3 |
| M | 0 | 0.3 |
| Oligoplites saurus | 1.2 | 0.3 |
| M | 0.7 | 0 |
| P | 0.5 | 0.3 |
| Oostethus lineatus | 0 | 0.3 |
| M | 0 | 0.3 |
| Opisthonema oglinum | 9.8 | 0 |
| O | 5 | 0 |
| P | 4.8 | 0 |
| Opsanus beta | 1.7 | 0 |
| O | 1.7 | 0 |
| Paraclinus fasciatus | 0.5 | 0 |
| O | 0.5 | 0 |
| Poecilia mexicana | 20.2 | 0.4 |
| M | 19.2 | 0 |
| O | 2.0 | 0.4 |
| Sphoeroides testudineus | 36.0 | 47.8 |
| M | 6.0 | 27.4 |
| O | 25.2 | 11.7 |
| P | 4.8 | 8.7 |
| Sphyraena barracuda | 24.8 | 12.0 |
| M | 8.8 | 4.6 |
| O | 5.2 | 3.5 |
| P | 10.8 | 4.0 |
| Strongylura marina | 0.5 | 0 |
| P | 0.5 | 0 |
| Strongylura notata | 51.9 | 150.5 |
| M | 25.3 | 27.2 |
| O | 5.8 | 1.5 |
| P | 20.8 | 121.8 |
| Strongylura timucu | 1.5 | 0 |
| M | 1.5 | 0 |
| Syngnathus floridae | 0.25 | 0 |
| M | 0.25 | 0 |
| Syngnathus scovelli | 0.5 | 0 |
| O | 0.5 | 0 |
| Trachinotus falcatus | 0 | 1.2 |
| M | 0 | 0.3 |
| O | 0 | 0.5 |
| P | 0 | 0.3 |
| Trichromis salvini | 0 | 3.5 |
| O | 0 | 3.5 |
| Vieja melanurus | 2.0 | 0 |
| O | 2.0 | 0 |
Appendix B
Qualitative records: Fish species of Chetumal Bay by salinity zone (Oligohaline, Mesohaline, Polyhaline) and decade (before 2005 vs. 2006 up to now). Voucher numbers (at ECO-CH, except one from the Colección Nacional de Peces, acronym CNPE) or literature sources (in italics) given, when the species was not recorded in this study. Records not assignable with precision to one of the three salinity zones, or known only from ichthyoplankton, not considered.
| Species | O | Before 2005 M | P | O | 2006 up to Now M | P |
| Acanthurus bahianus | 4222 | |||||
| Achirus lineatus | X | X | X | X | X | X |
| Aetobatus narinari | pers. obs. | |||||
| Albula vulpes | 4221 | X | [12] | [12] | ||
| Anchoa cayorum | X | X | ||||
| A. colonensis | X | |||||
| A. cubana | X | X | X | X | ||
| Archosargus probatocephalus | 4219 | |||||
| A. rhomboidalis | 4217 | |||||
| Ariopsis assimilis | X | X | 4261 | |||
| Astyanax bacalarensis | 7815 | 1301 | X | X | X | |
| Atherinomorus stipes | X | X | X | X | X | X |
| Bagre marinus | 3143 | |||||
| Bairdiella ronchus | X | X | X | X | ||
| Bathygobius curacao | X | |||||
| Bothus ocellatus | X | |||||
| Canthigaster rostrata | X | |||||
| Caranx latus | 4214 | X | ||||
| Centropomus undecimalis | 4216 | X | ||||
| Chaetodipterus faber | 4213 | |||||
| Chilomycterus schopfi | 4047 | |||||
| Chriodorus atherinoides | X | X | 8020 | X | ||
| Conodon nobilis | CNPE 3221 | |||||
| Corvula sanctaeluciae | 1703 | X | ||||
| Cribroheros robertsoni | X | |||||
| Cyprinodon artifrons | X | X | X | X | X | |
| D. guttata | 4194 | |||||
| Diapterus auratus | X | |||||
| Echeneis neucratoides | 2785 | X | ||||
| Elops saurus | [38] | |||||
| Epinephelus itajara | pers. obs. | pers. obs. | ||||
| Eucinostomus argenteus | X | X | X | X | X | X |
| E. gula | X | X | X | X | X | X |
| E. harengulus | X | X | X | X | X | X |
| E. jonesii | X | X | X | X | X | X |
| E. melanopterus | X | X | ||||
| Eugerres plumieri | X | X | X | X | X | X |
| Floridichthys polyommus | X | X | X | X | X | X |
| Gambusia sexradiata | X | |||||
| G. yucatana | X | X | X | X | ||
| Gerres cinereus | X | X | X | X | X | |
| Gobiosoma yucatanum | X | |||||
| Gymnothorax funebris | pers. obs. | |||||
| Haemulon sciurus | pers. obs. | |||||
| Harengula clupeola | 2061 | X | X | |||
| H. humeralis | X | 7806 | X | |||
| H. jaguana | X | X | X | X | X | |
| Hippocampus erectus | X | |||||
| Holocentrus rufus | 4224 | |||||
| Hypanus americanus | X | |||||
| Hyporhamphus roberti | X | X | ||||
| Jenkinsia lamprotaenia | X | |||||
| Jordanella pulchra | X | X | X | X | ||
| Kyphosus incisor | pers. obs. | |||||
| Lachnolaimus maximus | pers. obs. | |||||
| Lobotes surinamensis | 4218 | |||||
| Lophogobius cyprinoides | X | X | X | |||
| Lupinoblennius vinctus | 4134 | |||||
| Lutjanus analis | [38] | |||||
| L. apodus | 4236 | |||||
| L. cyanopterus | pers. obs. | |||||
| L. griseus | 4384 | X | ||||
| L. jocu | [39] | |||||
| L. mahogoni | pers. obs. | |||||
| L. synagris | X | |||||
| Mayaheros urophthalmus | X | X | X | |||
| Megalops atlanticus | 3139 | 4381 | ||||
| Monacanthus tuckeri | 7838 | |||||
| Mugil cephalus | pers. obs. | |||||
| Narcine brasiliensis | pers. obs. | |||||
| Ocyurus chrysurus | [39] | |||||
| Oligoplites saurus | X | X | X | |||
| Oostethus lineatus | X | |||||
| Opisthonema oglinum | X | X | ||||
| Opsanus beta | X | |||||
| Paraclinus fasciatus | X | 3169 | ||||
| Poecilia kykesis | 1246 | |||||
| P. mexicana | X | X | X | |||
| Pristis sp. | pers. obs. | pers. obs. | ||||
| Pterois volitans | pers. obs. | |||||
| Scomberomorus maculatus | 4768 | pers. obs. | ||||
| Selene vomer | 4215 | |||||
| Sparisoma viride | pers. obs. | |||||
| Sphoeroides testudineus | X | X | X | X | X | X |
| Sphyraena barracuda | X | X | X | X | X | X |
| Strongylura marina | X | |||||
| S. notata | X | X | X | X | X | X |
| S. timucu | 5063 | X | 8025 | |||
| Styracura schmardae | 3799 | |||||
| Symphurus diomedeanus | 4137 | |||||
| Syngnathus floridae | X | |||||
| S. scovelli | X | |||||
| Trachinotus falcatus | X | X | X | |||
| Trichromis salvini | X | |||||
| Vieja melanurus | X | 4302 |
References
- Espinoza-Ávalos, J.; Islebe, G.A.; Hernández-Arana, H.A. El sistema Ecológico de la Bahía de Chetumal/Corozal, Costa Occidental del Mar Caribe; El Colegio de la Frontera Sur: Chetumal, Mexico, 2009; ISBN 9786077637134. [Google Scholar]
- Hernández-Arana, H.A.; Ameneyro-Ángeles, B. Benthic biodiversity changes due to the opening of an artificial channel in a tropical coastal lagoon (Mexican Caribbean). J. Mar. Biol. Assoc. 2011, 91, 969–978. [Google Scholar] [CrossRef]
- Perez, A.U.; Arce-Ibarra, A.M.; García-Ortega, M.; Azueta, J.O. Artisanal recreational fisheries: Using a combined approach to fishery assessment aimed at providing insights for fishery managers. Mar. Resour. Econ. 2014, 29, 89–109. [Google Scholar] [CrossRef]
- Medina-Quej, A.; Arce-Ibarra, A.M.; Herrera-Pavón, R.L.; Caballero-Pinzón, P.I.; Ortiz-León, H.; Rosas-Correa, C.O. Pesquerías: Sector Social, Recurso Base y Manejo. In El Sistema Ecológico de la Bahía de Chetumal/Corozal: Costa Occidental del Mar Caribe; Espinoza-Ávalos, J., Islebe, G.A., Hernández-Arana, H.A., Eds.; El Colegio de la Frontera Sur: Chetumal, Mexico, 2009; pp. 184–195. ISBN 9786077637134. [Google Scholar]
- Schmitter-Soto, J.J.; Vásquez-Yeomans, L.; Pimentel Cadena, E.; Herrera-Pavón, R.L.; Paz, G.; García-Téllez, N. Peces. In El Sistema Ecológico de la Bahía de Chetumal/Corozal: Costa Occidental del Mar Caribe; Espinoza-Ávalos, J., Islebe, G.A., Hernández-Arana, H.A., Eds.; El Colegio de la Frontera Sur: Chetumal, Mexico, 2009; pp. 102–114. [Google Scholar]
- Schmitter-Soto, J.J.; Monks, S.; Vásquez-Yeomans, L.; Pimentel Cadena, E.; Herrera-Pavón, R.L.; Pulido-Flores, G.; Quintal-Lizama, C.; Valtierra-Vega, M.T. Peces, Ictioplancton y Helmintos Parásitos en la Bahía de Chetumal (Santuario del Manati); Technical Report; Conabio, Ecosur: Chetumal, Mexico, 2001. [Google Scholar]
- Carrillo, L.; Palacios-Hernández, E.; Ramírez-Manguilar, A.M.; Morales-Vela, B. Características Hidrometeorológicas y Batimétricas. In El Sistema Ecológico de la Bahía de Chetumal/Corozal: Costa Occidental del Mar Caribe; Espinoza-Avalos, J., Islebe, G.A., Hernández-Arana, H.A., Eds.; El Colegio de la Frontera Sur: Chetumal, Mexico, 2009; pp. 12–20. [Google Scholar]
- Carrillo, L.; Palacios-Hernández, E.; Yescas, M.; Ramírez-Manguilar, A.M. Spatial and seasonal patterns of salinity in a large and shallow tropical estuary of the western Caribbean. Estuaries Coasts 2009, 32, 906–916. [Google Scholar] [CrossRef]
- Granados-Sánchez, D.; López-Ríos, G.; Martínez-V, F.J.; Martínez-Castillo, J. Los manglares de Quintana Roo. Rev. Chapingo Ser. Cienc. For. Ambient. 1998, 4, 253–265. [Google Scholar]
- Álvarez-Legorreta, T. Contaminación acuática. In El Sistema Ecológico de la Bahía de Chetumal/Corozal: Costa Occidental del Mar Caribe; Espinoza-Ávalos, J., Islebe, G.A., Hernández-Arana, H.A., Eds.; El Colegio de la Frontera Sur: Chetumal, Mexico, 2009; pp. 205–217. [Google Scholar]
- Herrera-Pavón, R.L. Pesca deportivo-recreativa. In Riqueza Biológica de Quintana Roo. Un Análisis para su Conservación.Tomo 1; Pozo, C., Ed.; CONABIO: Mexico City, 2011; pp. 190–193. [Google Scholar]
- Perez, A.U.; Schmitter-Soto, J.J.; Adams, A.J.; Heyman, W.D. Connectivity mediated by seasonal bonefish (Albula vulpes) migration between the Caribbean Sea and a tropical estuary of Belize and Mexico. Environ. Biol. Fishes 2019, 102, 197–207. [Google Scholar] [CrossRef]
- Castro-Aguirre, J.L.; Espinosa-Pérez, H.; Schmitter-Soto, J.J. Ictiofauna Estuarino-Lagunar y Vicaria de México; Noriega-Limusa, IPN: Mexico City, Mexico, 1999; ISBN 9681857747. [Google Scholar]
- Ruiz-Cauich, L.E.; Schmitter-Soto, J.J.; Barba-Macías, E.; González-Solís, D. Stability vs. organization: potential of a trophic model for the management of shallow tropical streams. Food Webs 2016, 6, 38–47. [Google Scholar]
- FishBase. Available online: www.fishbase.org (accessed on 31 August 2018).
- Koleff, P.; Gaston, K.J.; Lennon, J.J. Measuring beta diversity for presence-absence data. J. Anim. Ecol. 2003, 72, 367–382. [Google Scholar] [CrossRef]
- Venables, W.N.; Smith, D.M. An Introduction to R, Version 1.0; The R Development Core Team: Auckland, New Zealand, 2003. [Google Scholar]
- Oksanen, J.; Blanchet, F.G.; Kindt, R.; Legendre, P.; Minchin, P.R.; Hara, R.B.O.; Simpson, G.L.; Solymos, P.; Stevens, M.H.H.; Wagner, H. Package ‘Vegan’: Community Ecology Package; CRAN: Oulu, Finland, 2015; p. 292. [Google Scholar]
- Dawson, C.E. Gobiosoma (Garmannia) yucatanum, a new seven-spined Atlantic goby from México. Copeia 1971, 1971, 432–439. [Google Scholar] [CrossRef]
- Greenfield, D.W.; Thomerson, J.E. Fishes of the Continental Waters of Belize; University Press of Florida: Gainesville, FL, USA, 1997; ISBN 0-8130-1497-2. [Google Scholar]
- Schmitter-Soto, J.J.; Aguilar-Perera, A.; Cruz-Martínez, A.; Herrera-Pavón, R.L.; Morales-Aranda, A.A.; Cobián-Rojas, D. Interdecadal trends in composition, density, size, and mean trophic level of fish species and guilds before and after coastal development in the Mexican Caribbean. Biodivers. Conserv. 2017, 27, 459–474. [Google Scholar] [CrossRef]
- Espinoza-Ávalos, J.; Hernández-Arana, H.A.; Álvarez-Legorreta, T.; Quan-Young, L.I.; Oliva-Rivera, J.J.; Valdez-Hernández, M.; Wórum, F.; Villegas, A.; van Tussenbroek, B.I. Vegetación acuática sumergida. In El sistema Ecológico de la bahía de Chetumal/Corozal: Costa Occidental del Mar Caribe; Espinoza-Ávalos, J., Islebe, G.A., Hernández-Arana, H.A., Eds.; El Colegio de la Frontera Sur: Chetumal, Mexico, 2009; pp. 28–40. [Google Scholar]
- Torres-Chávez, P.; Schmitter-Soto, J.J.; Mercado-Silva, N.; Valdez-Moreno, M.E. Movimiento entre hábitats de la barracuda Sphyraena barracuda, determinado por aproximaciones tróficas en el Caribe. Rev. Mex. Biodivers. 2018, 89, 865–872. [Google Scholar] [CrossRef]
- Salvadores Baledón, M.L.; Reséndez Medina, A. Modificaciones en la composición ictiofaunística del sistema lagunar El Carmen-Machona Tabasco, por la apertura de Boca de Panteones. Univ. Cienc. 1990, 7, 5–13. [Google Scholar]
- Bonaldo, R.M.; Bellwood, D.R. Size-dependent variation in the functional role of the parrotfish Scarus rivulatus on the Great Barrier Reef, Australia. Mar. Ecol. Prog. Ser. 2008, 360, 237–244. [Google Scholar] [CrossRef]
- Herrera-Silveira, J.A.; Arreola-Lizárraga, J.A.; Ramírez, J. Cambios hidrológicos y de estado trófico entre los años 2000 y 2006. In El Sistema Ecológico de la Bahía de Chetumal/Corozal: Costa Occidental del Mar Caribe; Espinoza-Ávalos, J., Islebe, G.A., Hernández-Arana, H.A., Eds.; El Colegio de la Frontera Sur: Chetumal, Mexico, 2009; pp. 21–27. [Google Scholar]
- Sheppard, C.; Rioja-Nieto, R. Sea surface temperature 1871–2099 in 38 cells in the Caribbean region. Mar. Environ. Res. 2005, 60, 389–396. [Google Scholar] [CrossRef] [PubMed]
- Vidal-Martínez, V.M.; Aguirre-Macedo, M.L.; Gold-Bouchot, G.; Caballero-Pinzón, P.I. Potential interactions between metazoan parasites of the Mayan catfish Ariopsis assimilis and chemical pollution in Chetumal Bay, Mexico. J. Helminthol. 2003, 77, 173–184. [Google Scholar] [CrossRef] [PubMed]
- Melgar Tísoc, E.R. La explotación de recursos marinos en Oxtankah, Quintana Roo. Actual. Arqueol. 2006, 1, 5–29. [Google Scholar]
- Netto, S.A.; Domingos, A.M.; Kurtz, M.N. Effects of artificial breaching of a temporarily open/closed estuary on benthic macroinvertebrates (Camacho Lagoon, Southern Brazil). Estuaries Coasts 2012, 35, 1069–1081. [Google Scholar] [CrossRef]
- Layman, C.A.; Jud, Z.R.; Nichols, P.K. Lionfish alter benthic invertebrate assemblages in patch habitats of a subtropical estuary. Mar. Biol. 2014, 161, 2179–2182. [Google Scholar] [CrossRef]
- Santangelo, J.M.; Rocha, A.M.; Bozelli, R.L.; Carneiro, L.S.; Esteves, F.A. Zooplankton responses to sandbar opening in a tropical eutrophic coastal lagoon. Estuar. Coast. Shelf Sci. 2007, 71, 657–668. [Google Scholar] [CrossRef]
- Schmitter-Soto, J.J. Catálogo de Los Peces Continentales de Quintana Roo; El Colegio de la Frontera Sur: San Cristóbal de Las Casas, Mexico, 1998; ISBN 9687555041. [Google Scholar]
- Rahel, F.J. Homogenization, differentiation, and the widespread alteration of fish faunas. Am. Fish. Soc. Symp. 2010, 73, 311–326. [Google Scholar]
- Villéger, S.; Blanchet, S.; Beauchard, O.; Oberdorff, T.; Brosse, S. Homogenization patterns of the world’s freshwater fish faunas. Proc. Natl. Acad. Sci. USA 2011, 108, 18003–18008. [Google Scholar] [CrossRef]
- Doney, S.C.; Ruckelshaus, M.; Duffy, J.E.; Barry, J.P.; Chan, F.; English, C.A.; Galindo, H.M.; Grebmeier, J.M.; Hollowed, A.B.; Knowlton, N.; et al. Climate change impacts on marine ecosystems. Ann. Rev. Mar. Sci. 2012, 4, 11–37. [Google Scholar] [CrossRef] [PubMed]
- Álvarez-Filip, L.; Millet-Encalada, M.; Reyes-Bonilla, H. Impact of hurricanes Emily and Wilma on the coral community of Cozumel island, Mexico. Bull. Mar. Sci. 2009, 84, 295–306. [Google Scholar]
- Pérez-Ruzafa, Á.; García-Charton, J.A.; Barcala, E.; Marcos, C. Changes in benthic fish assemblages as a consequence of coastal works in a coastal lagoon: the Mar Menor (Spain, Western Mediterranean). Mar. Pollut. Bull. 2006, 53, 107–120. [Google Scholar] [CrossRef] [PubMed]
- Bax, N.; Williamson, A.; Aguero, M.; Gonzalez, E.; Geeves, W. Marine invasive alien species: A threat to global biodiversity. Mar. Policy 2003, 27, 313–323. [Google Scholar] [CrossRef]
© 2019 by the authors. Licensee MDPI, Basel, Switzerland. This article is an open access article distributed under the terms and conditions of the Creative Commons Attribution (CC BY) license (http://creativecommons.org/licenses/by/4.0/).