Hazard Assessment of Typhoon-Driven Storm Waves in the Nearshore Waters of Taiwan


 ,
,
Abstract
1. Introduction
2. Materials and Methods
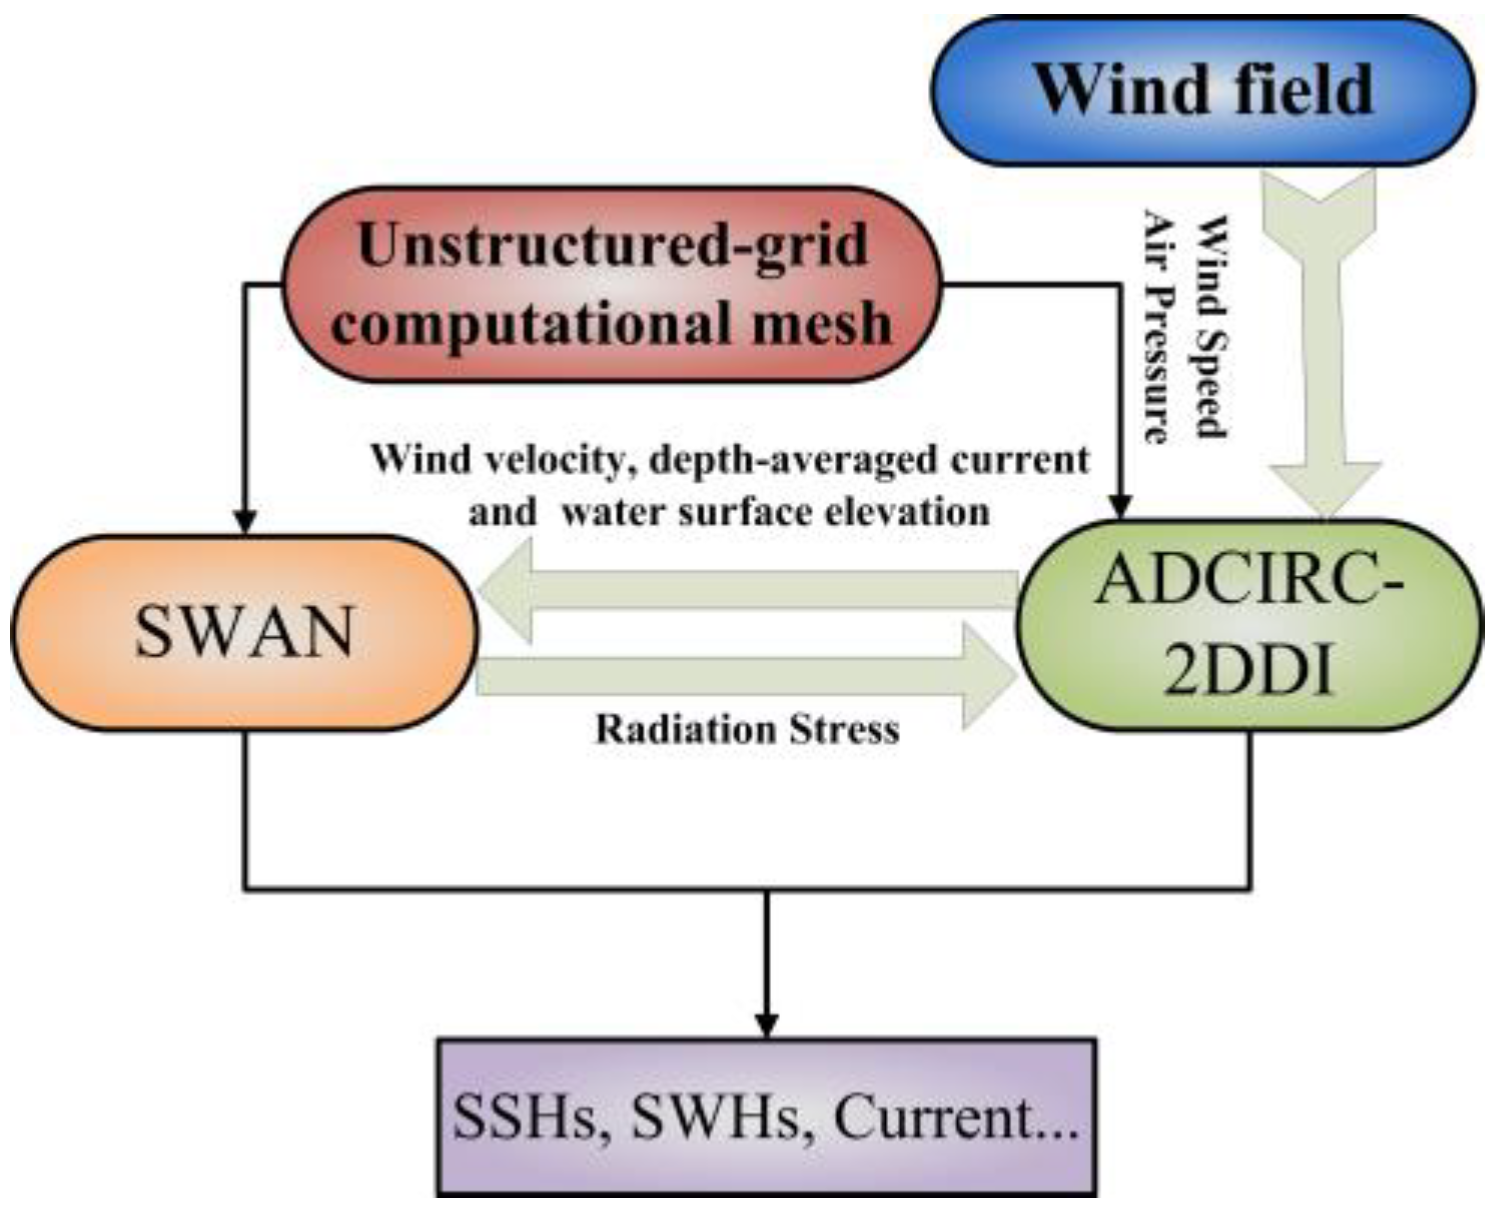
2.1. Two-Dimensional Hydrodynamic Model
2.2. Third-Generation Spectral Wave Model
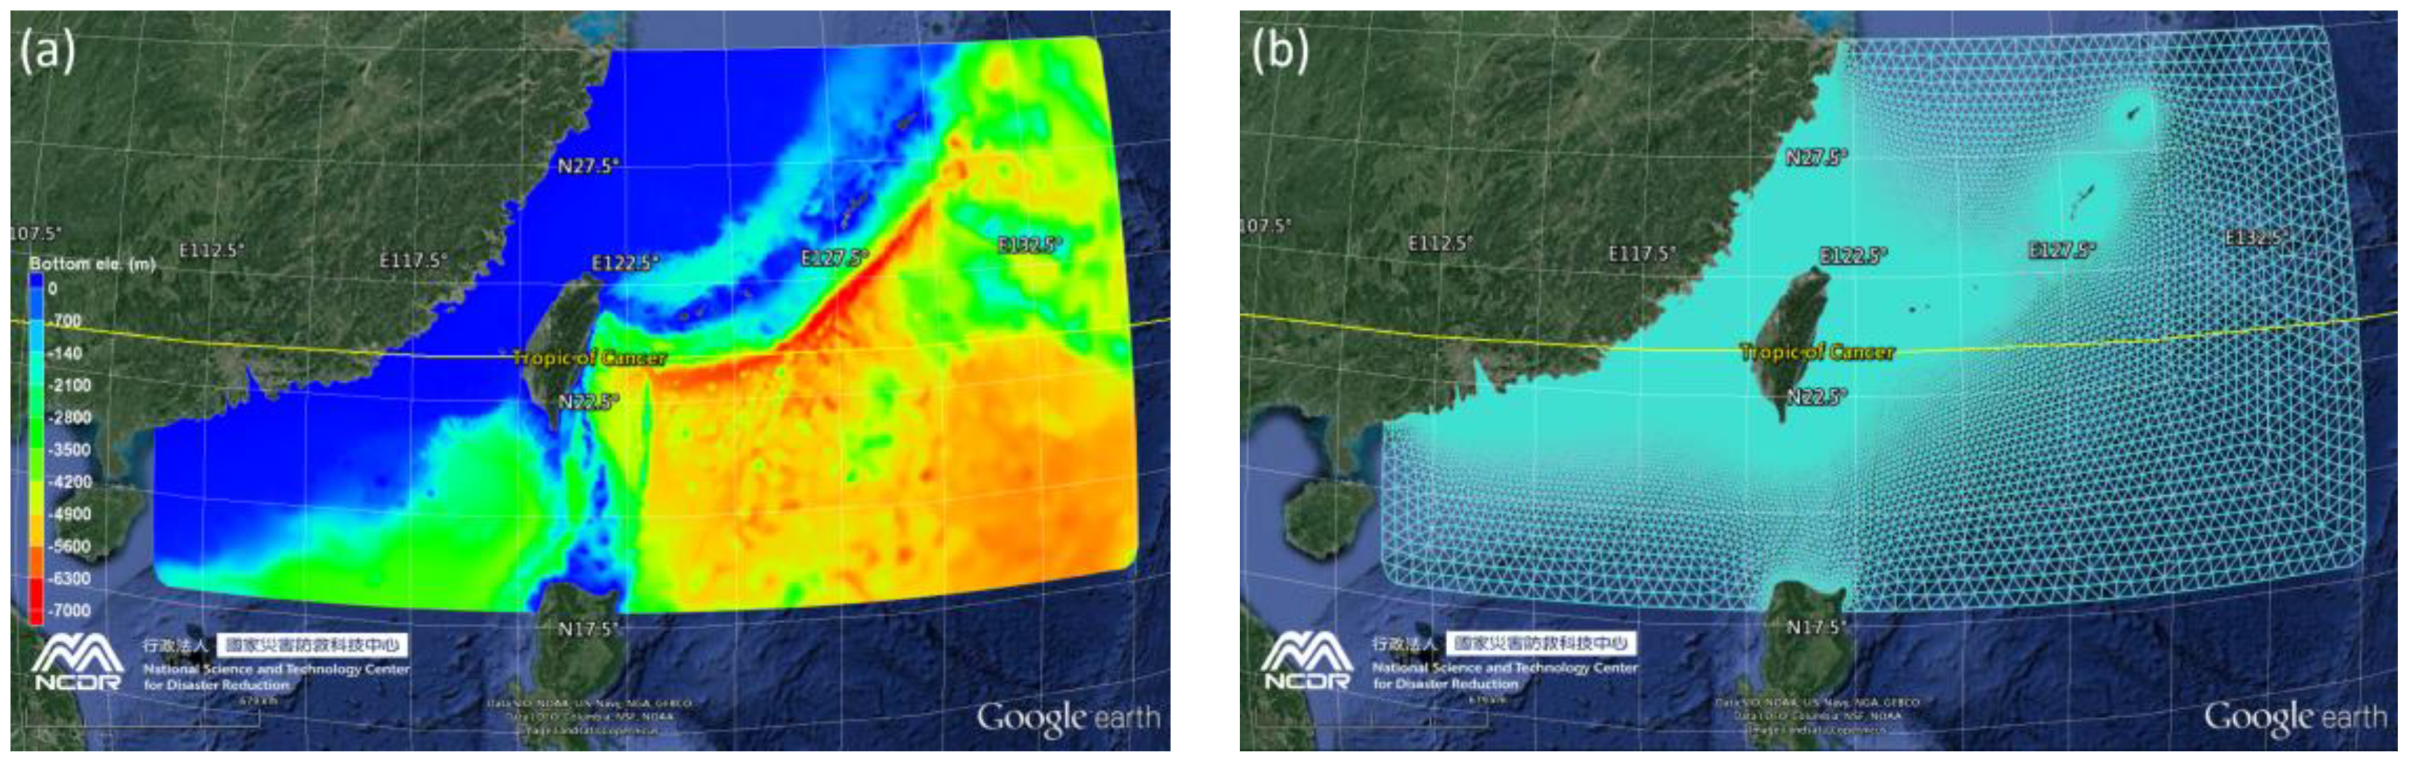
2.3. Model Setup
2.4. Model Forcing
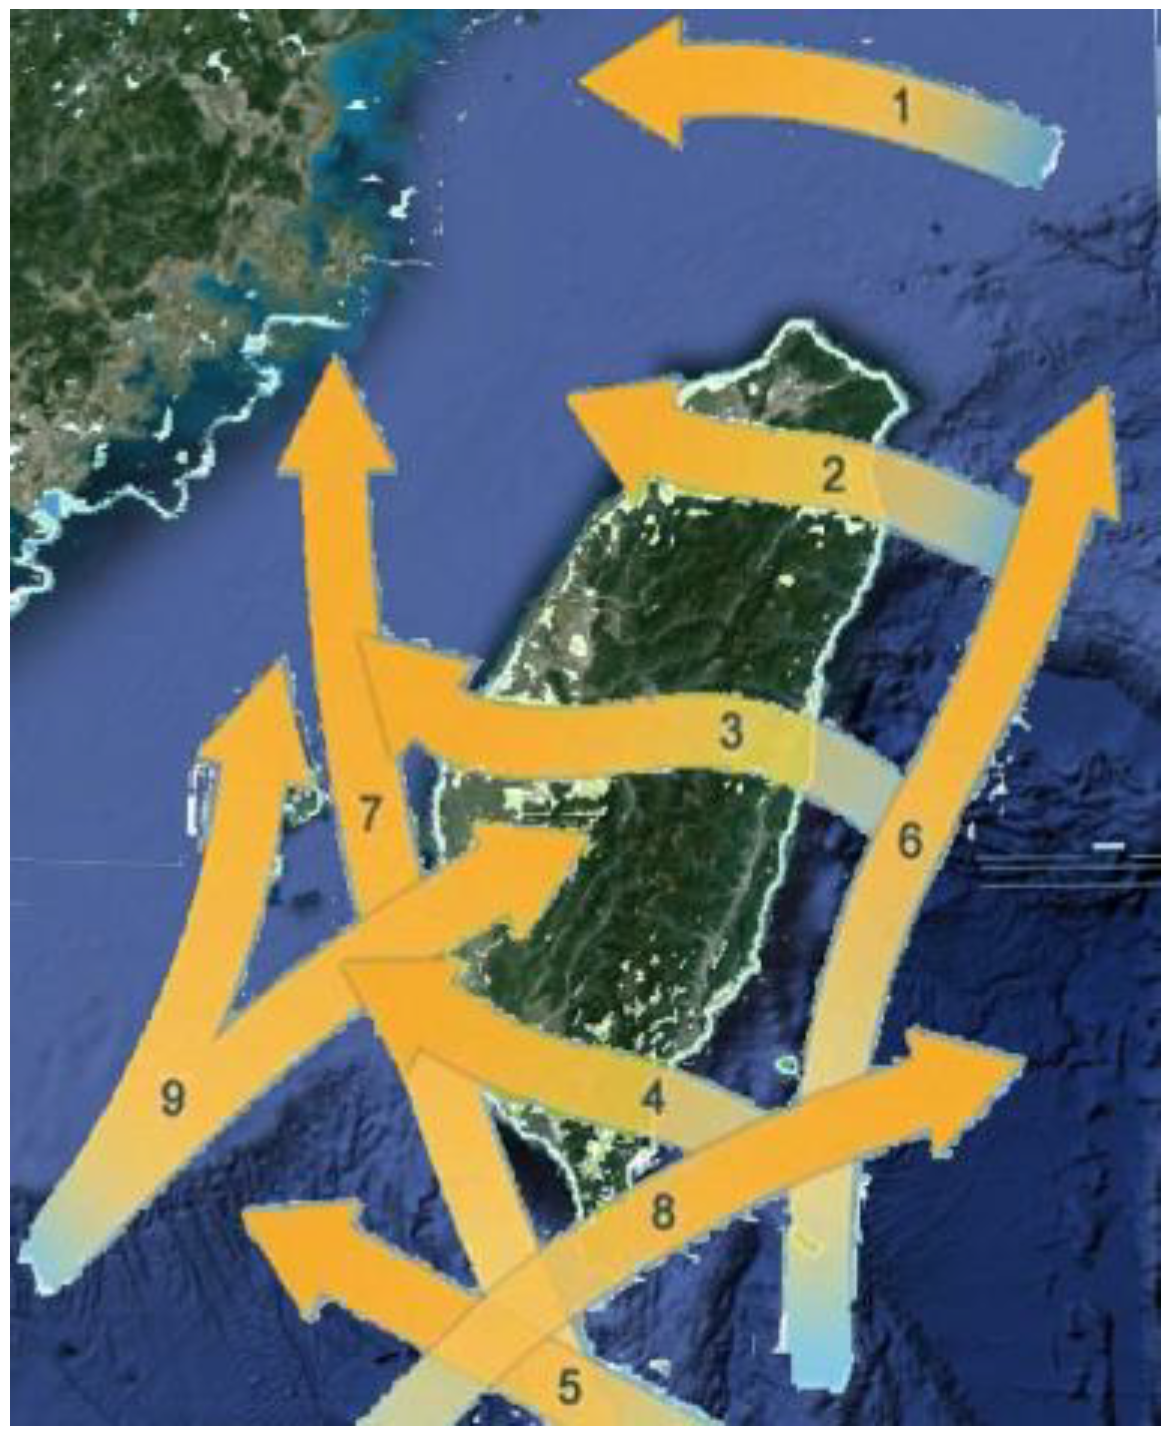
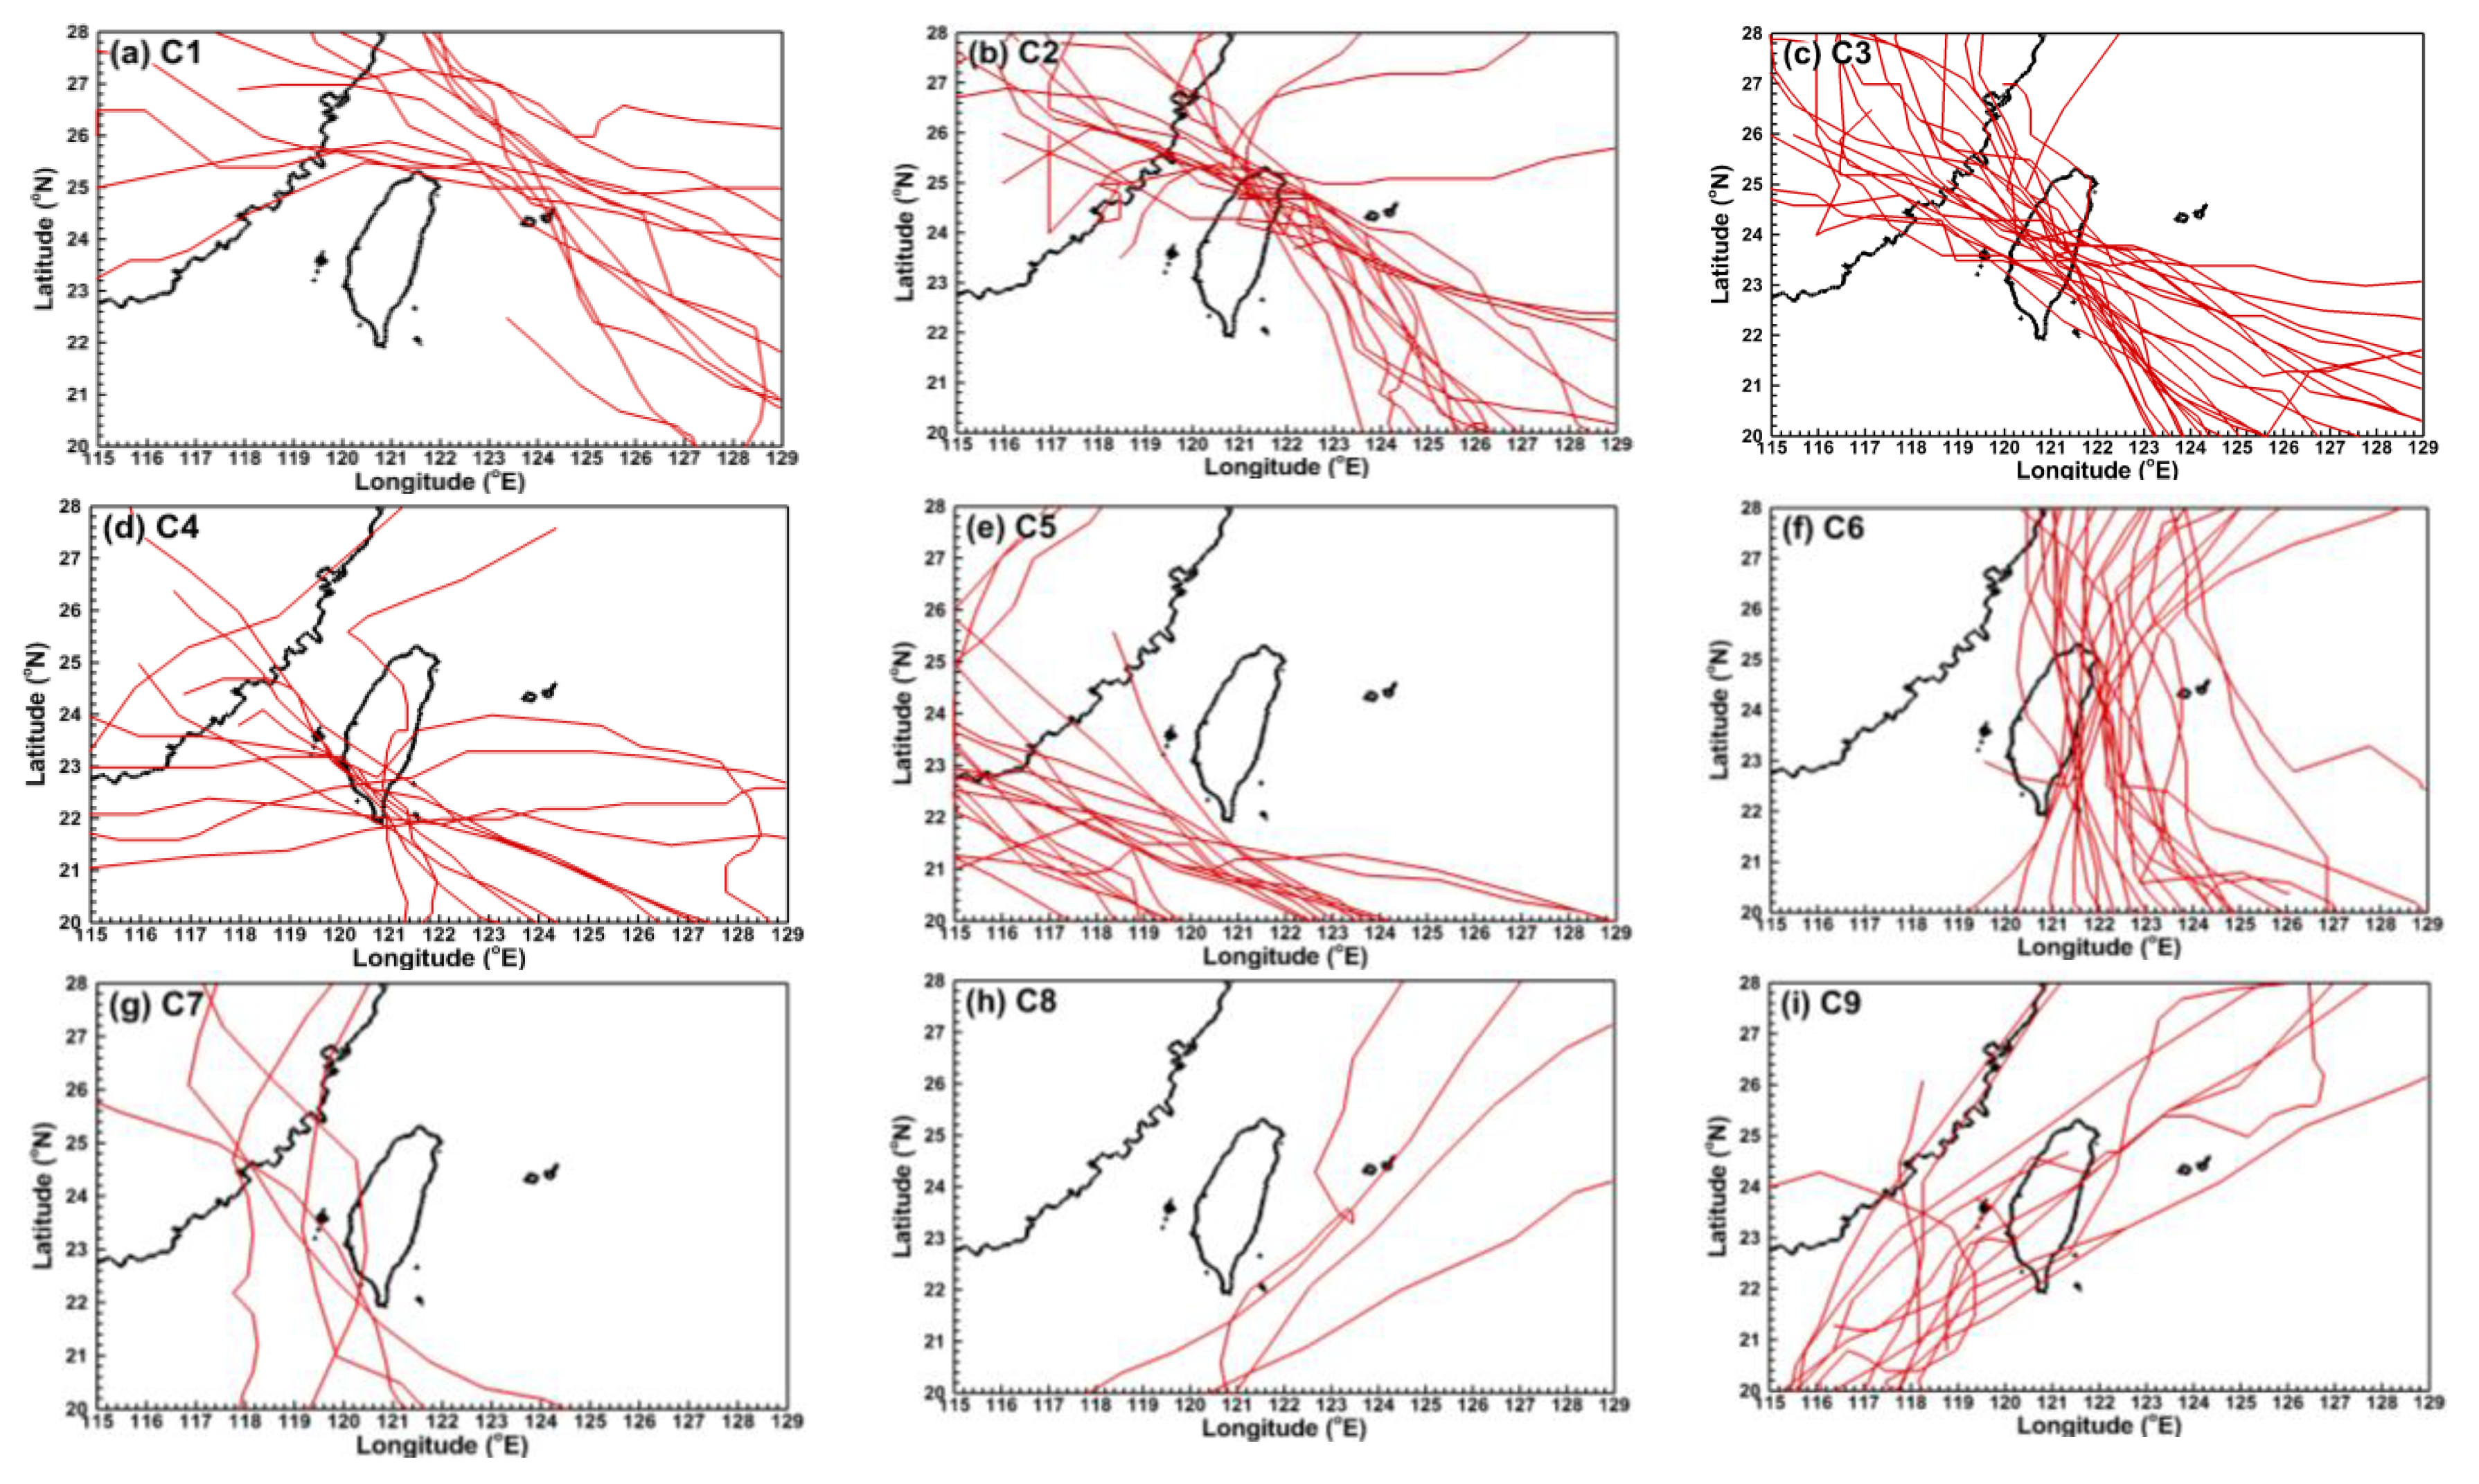
2.5. Typhoon Events
2.6. Metrics for Evaluation of Model Performance
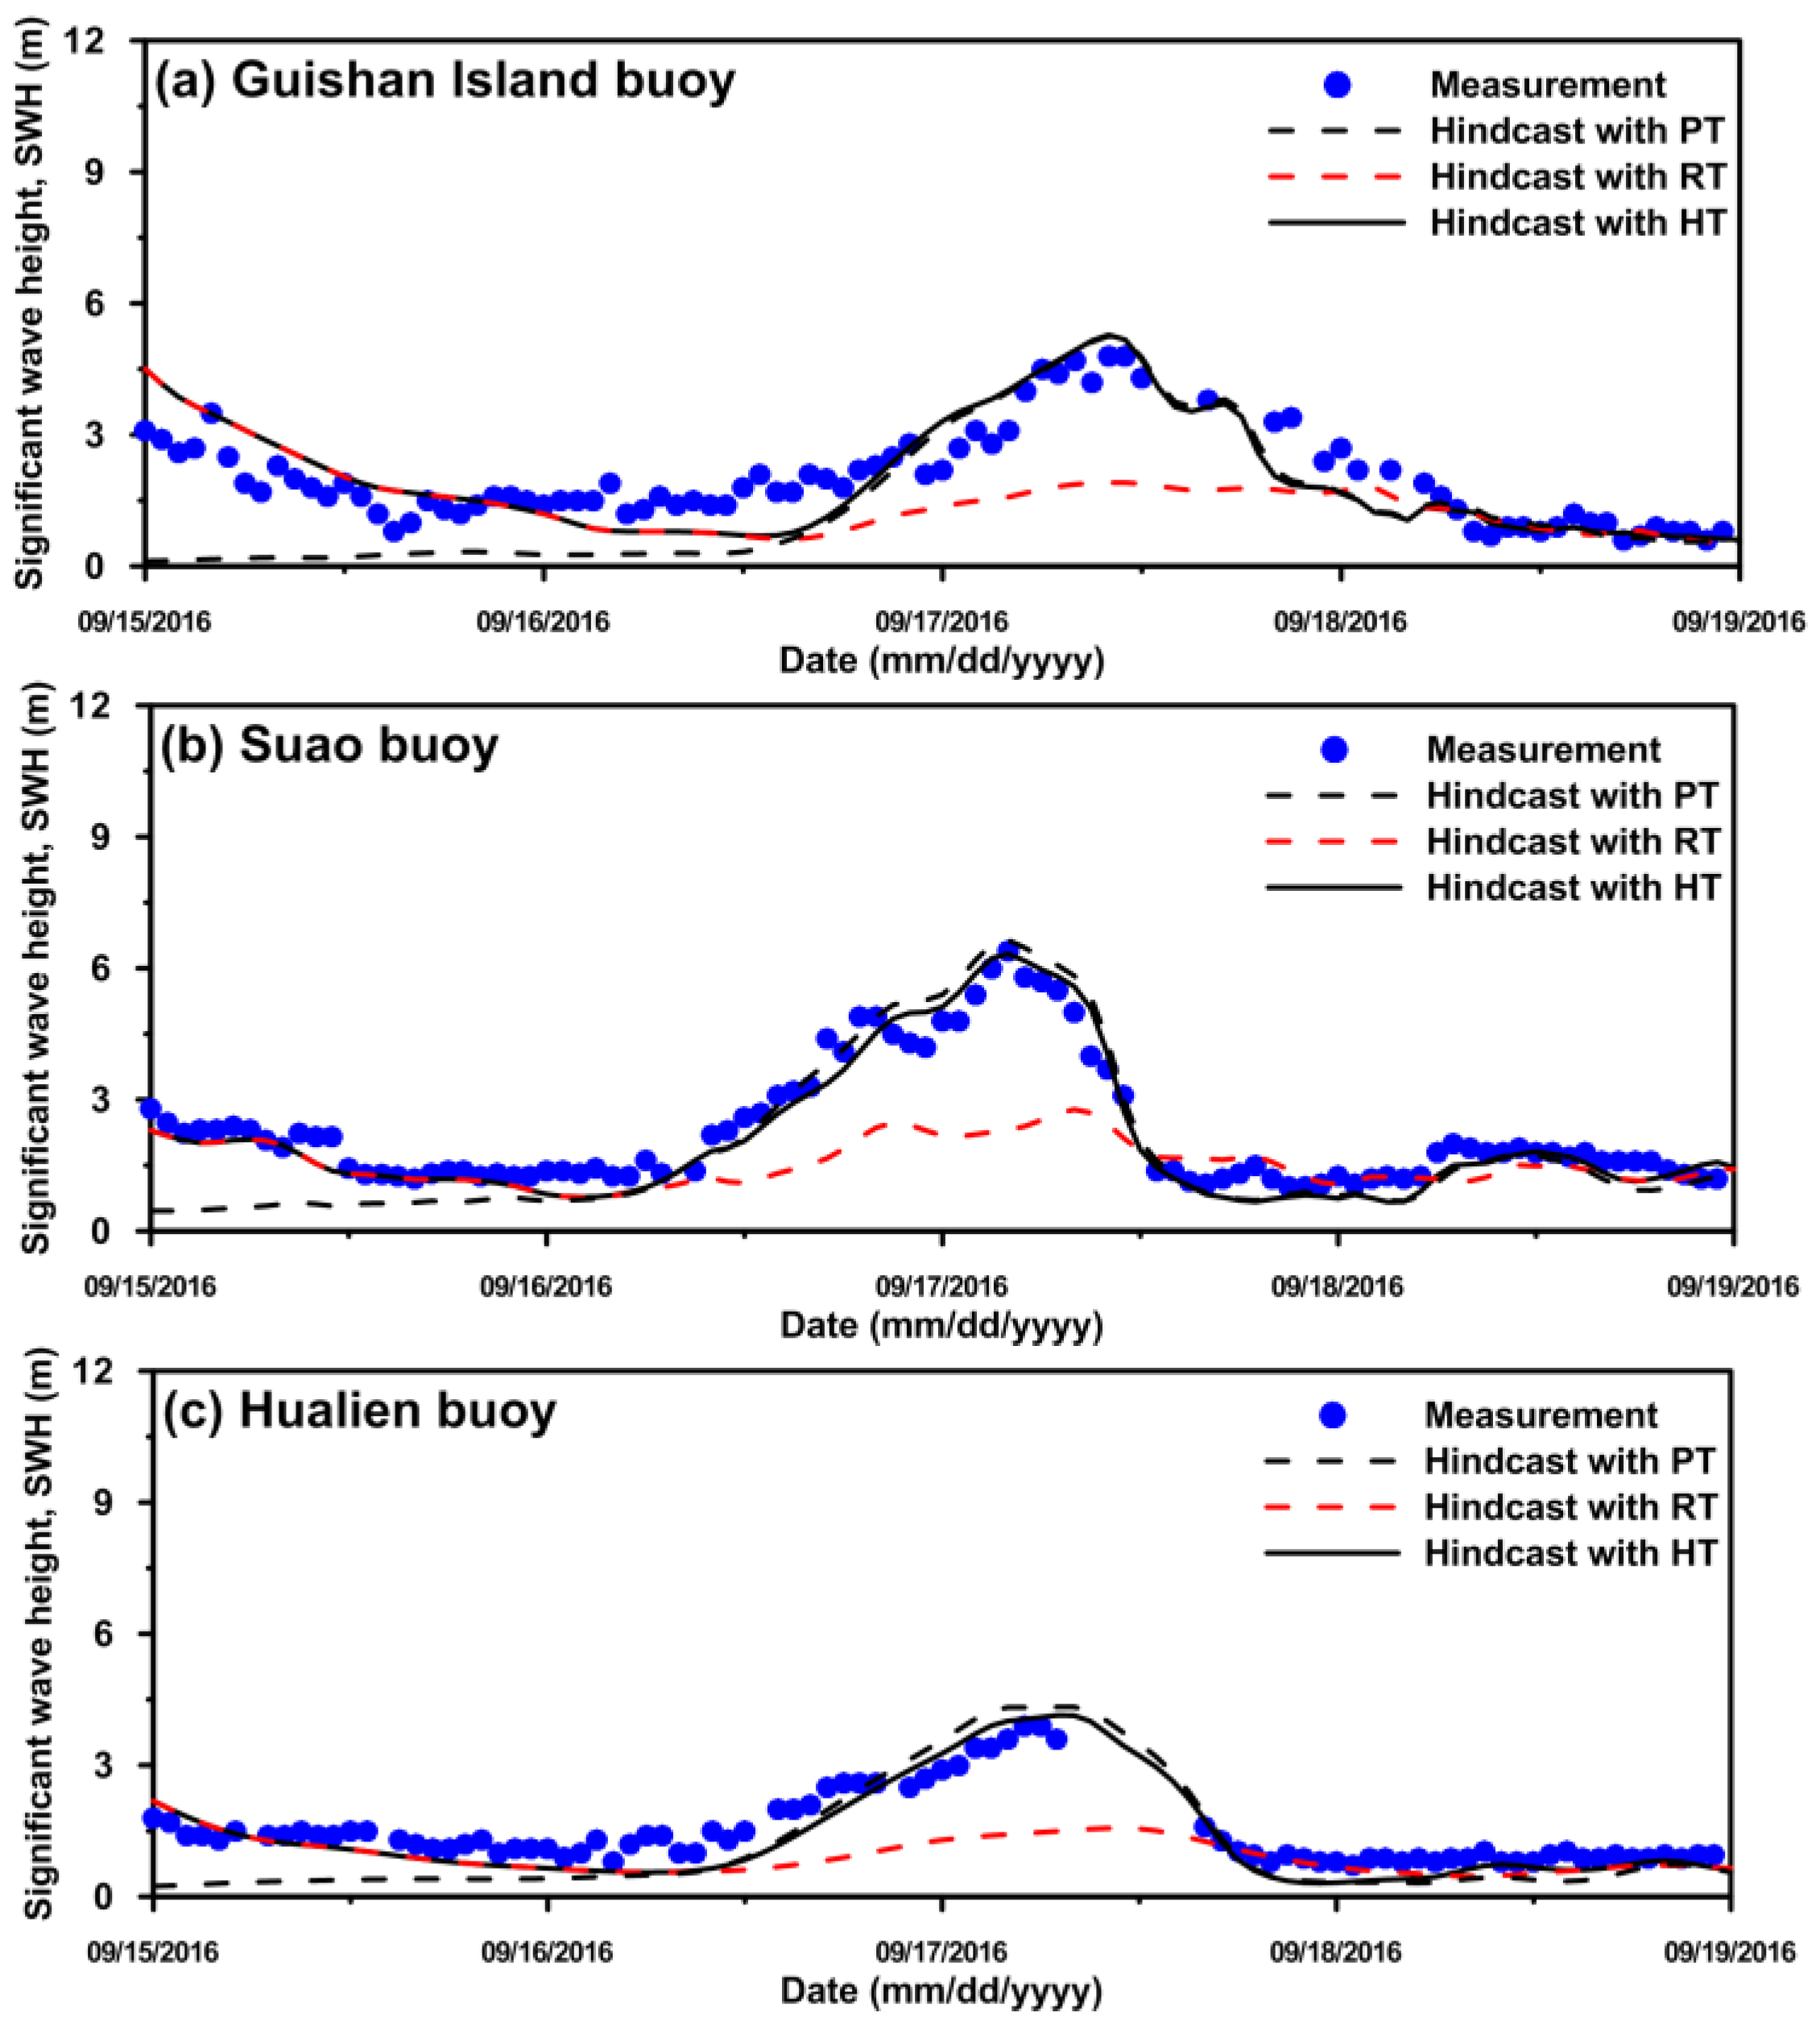
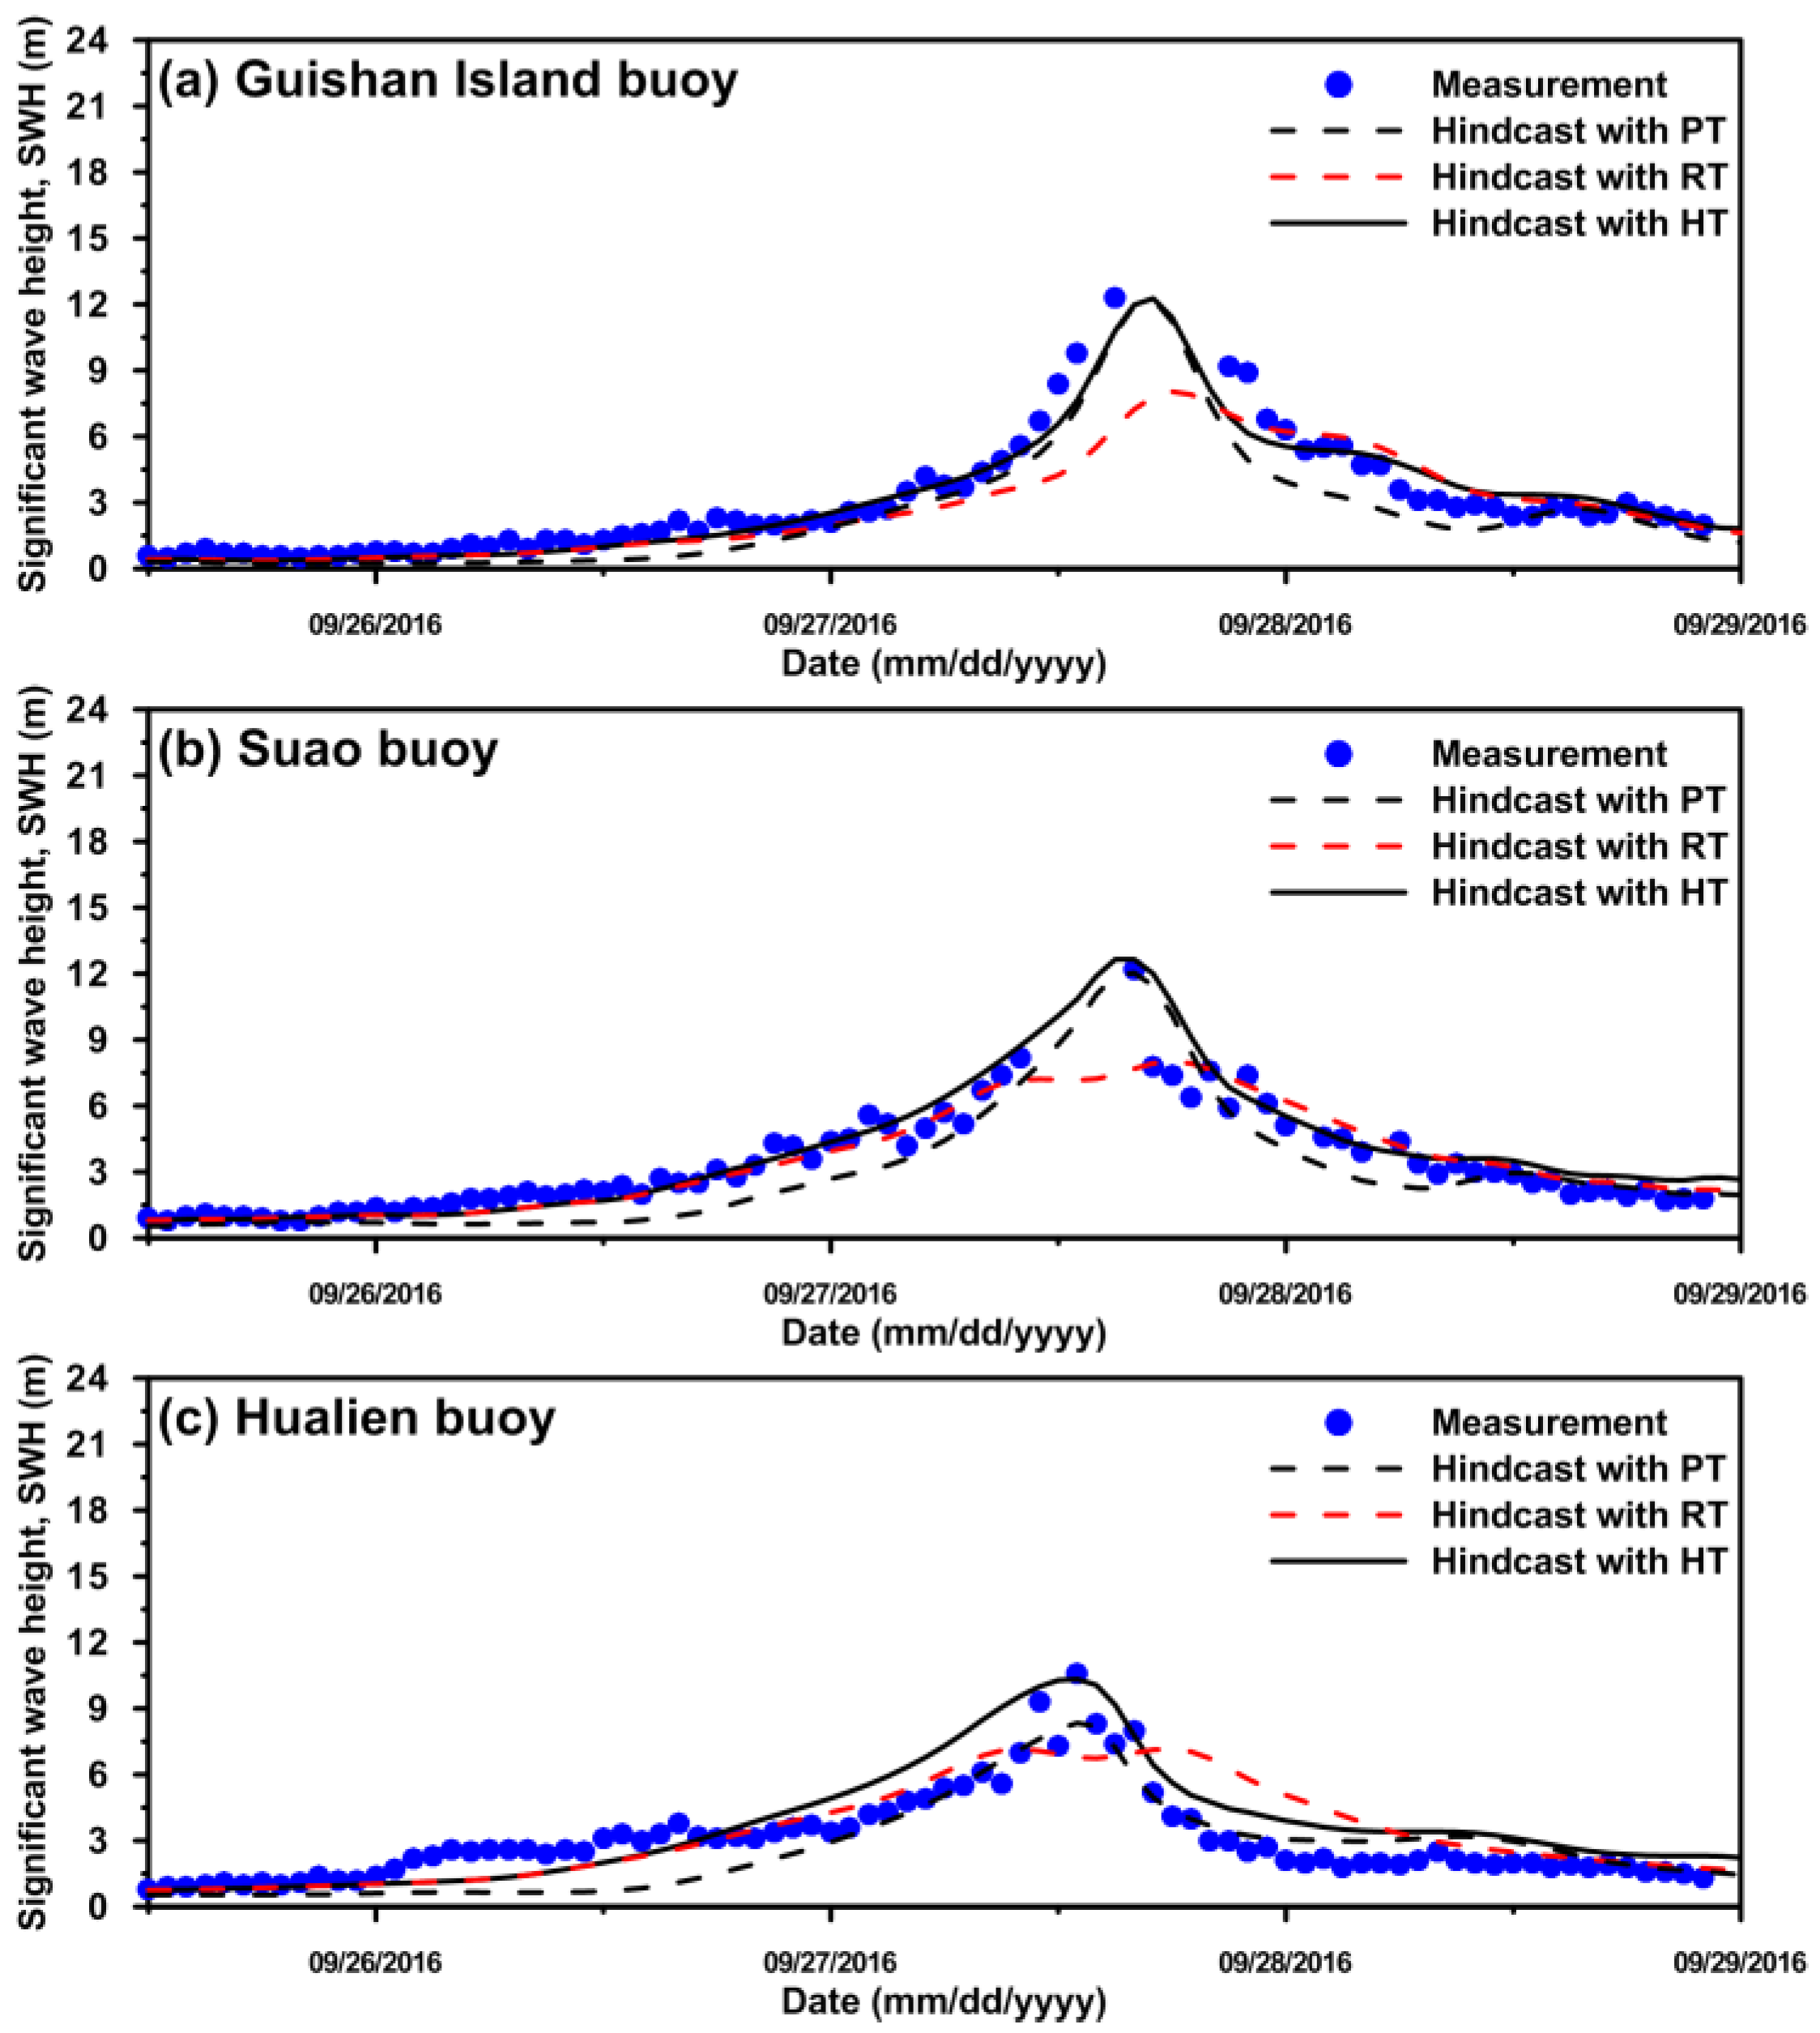
3. Model Performance Using Different Wind Fields
4. Results and Discussion
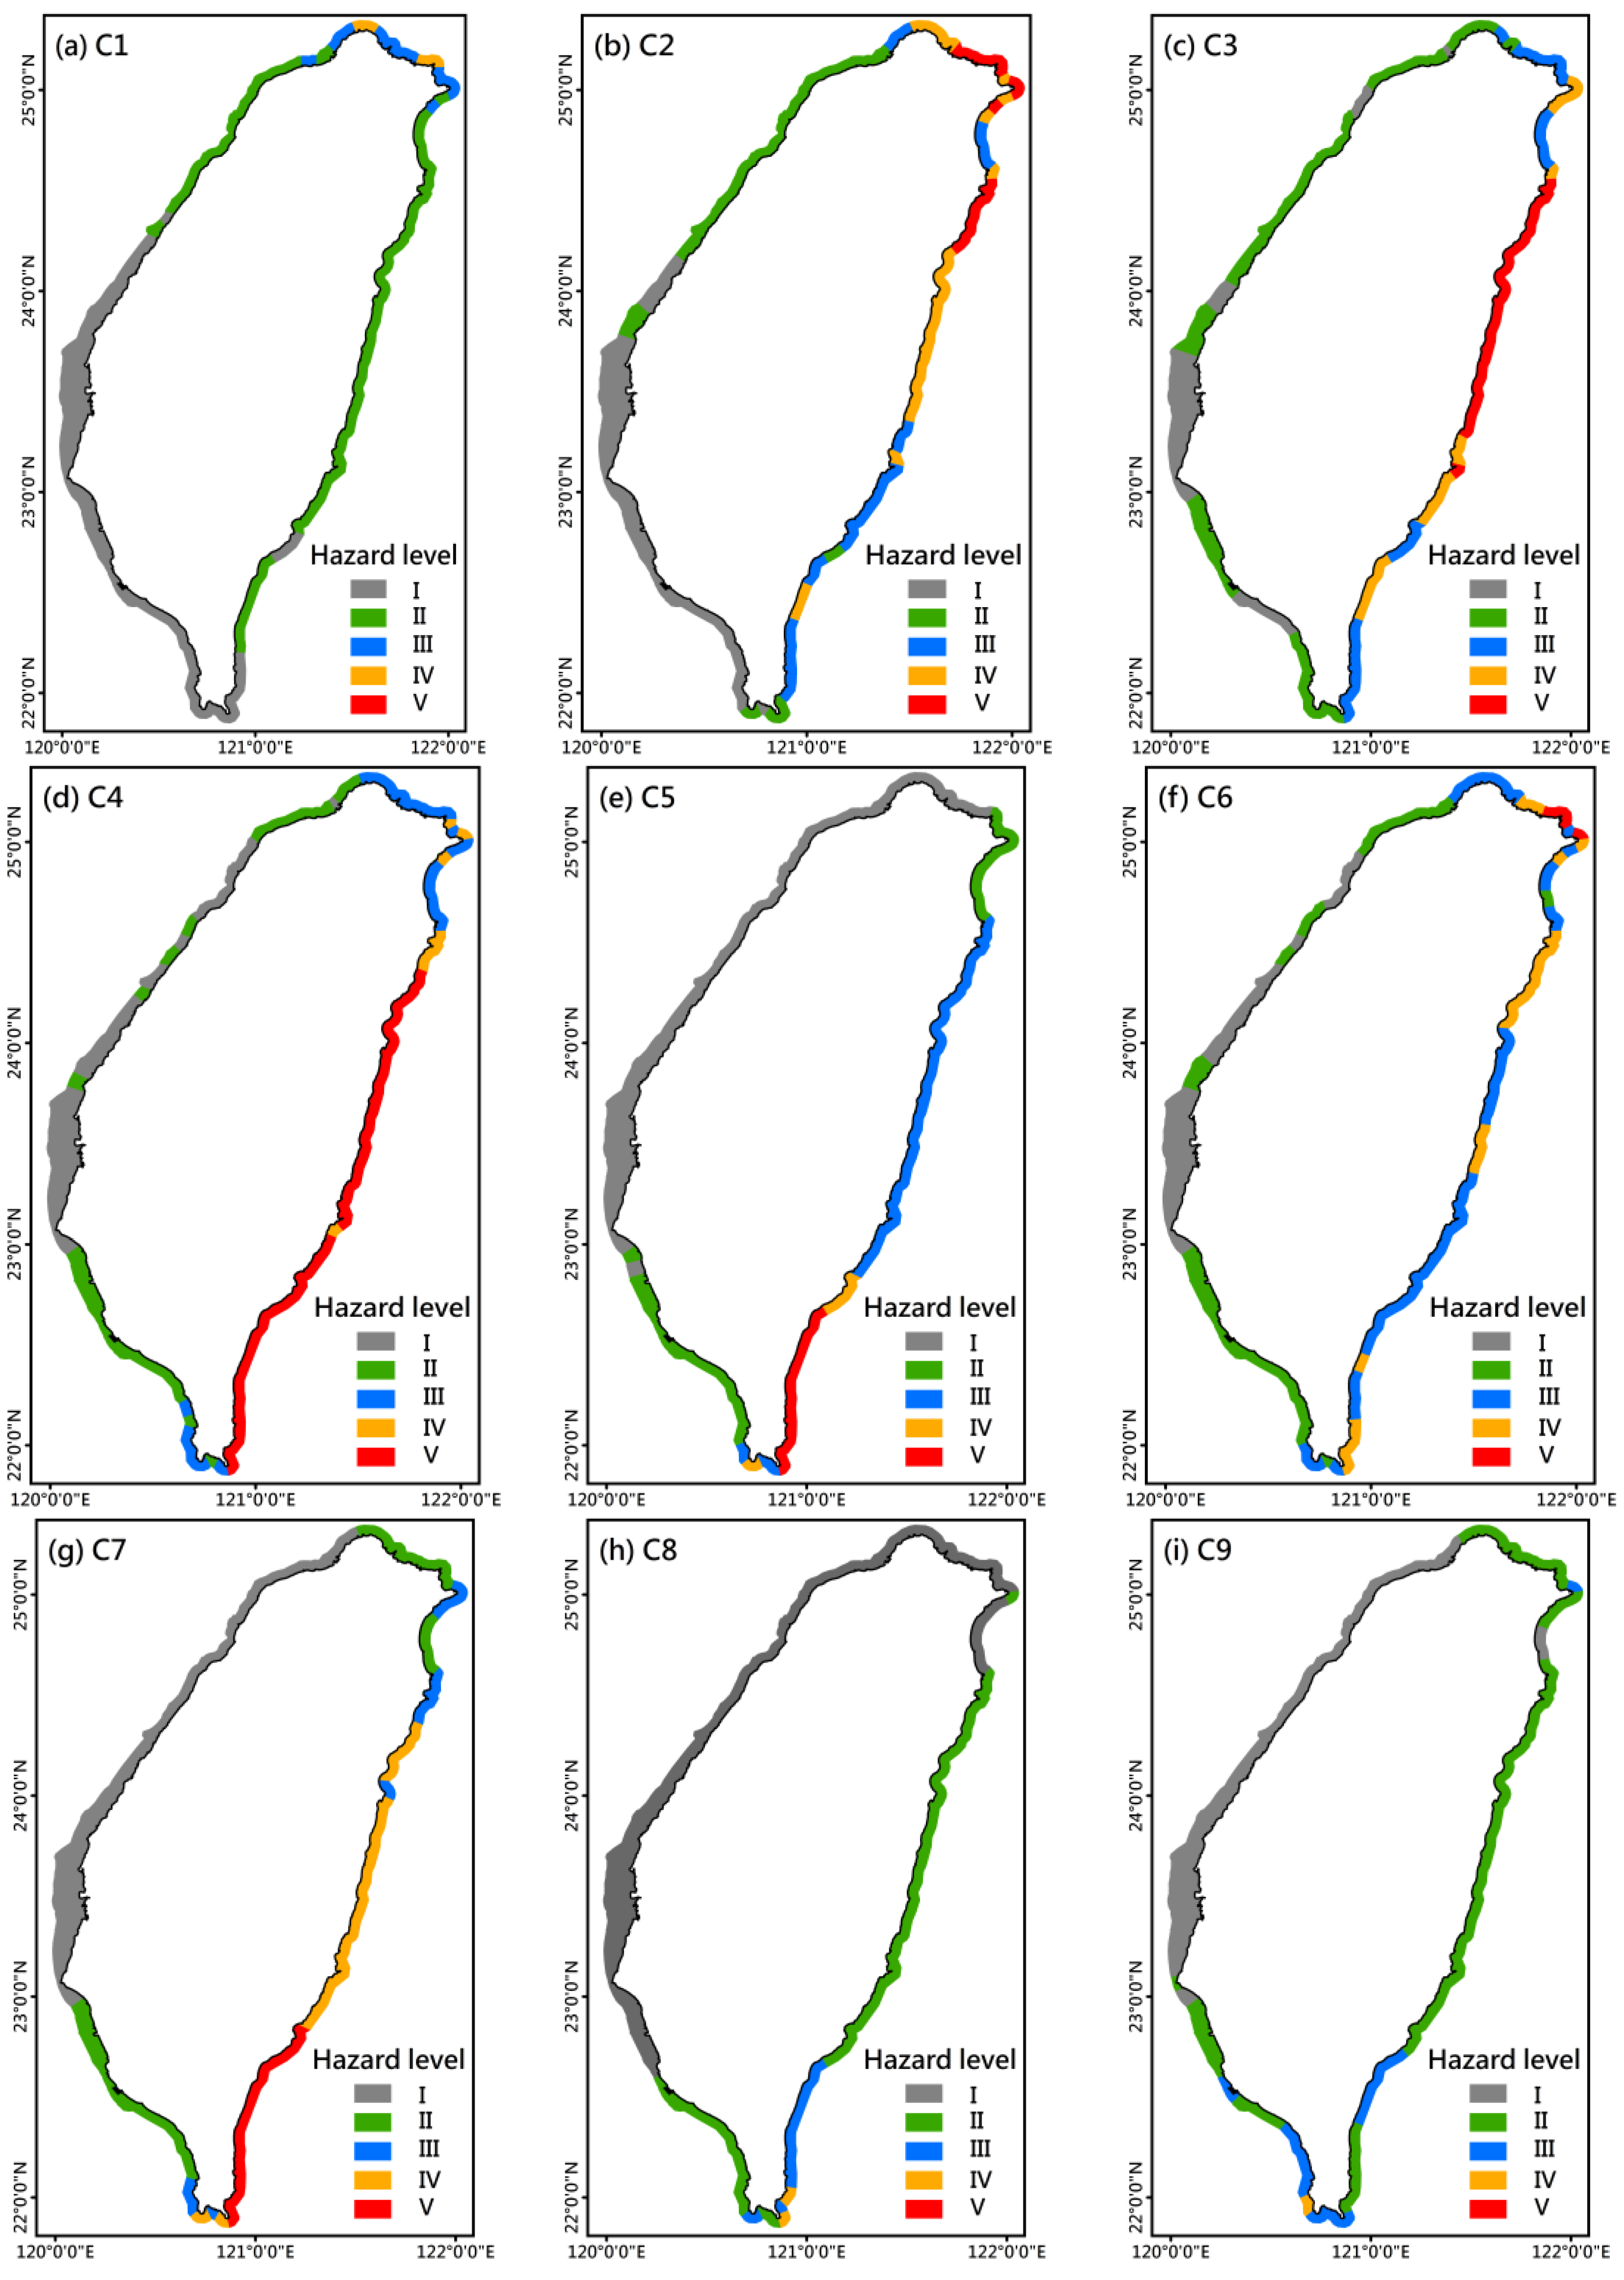
4.1. Producing Storm Wave Hazard Maps for Each Typhoon Category
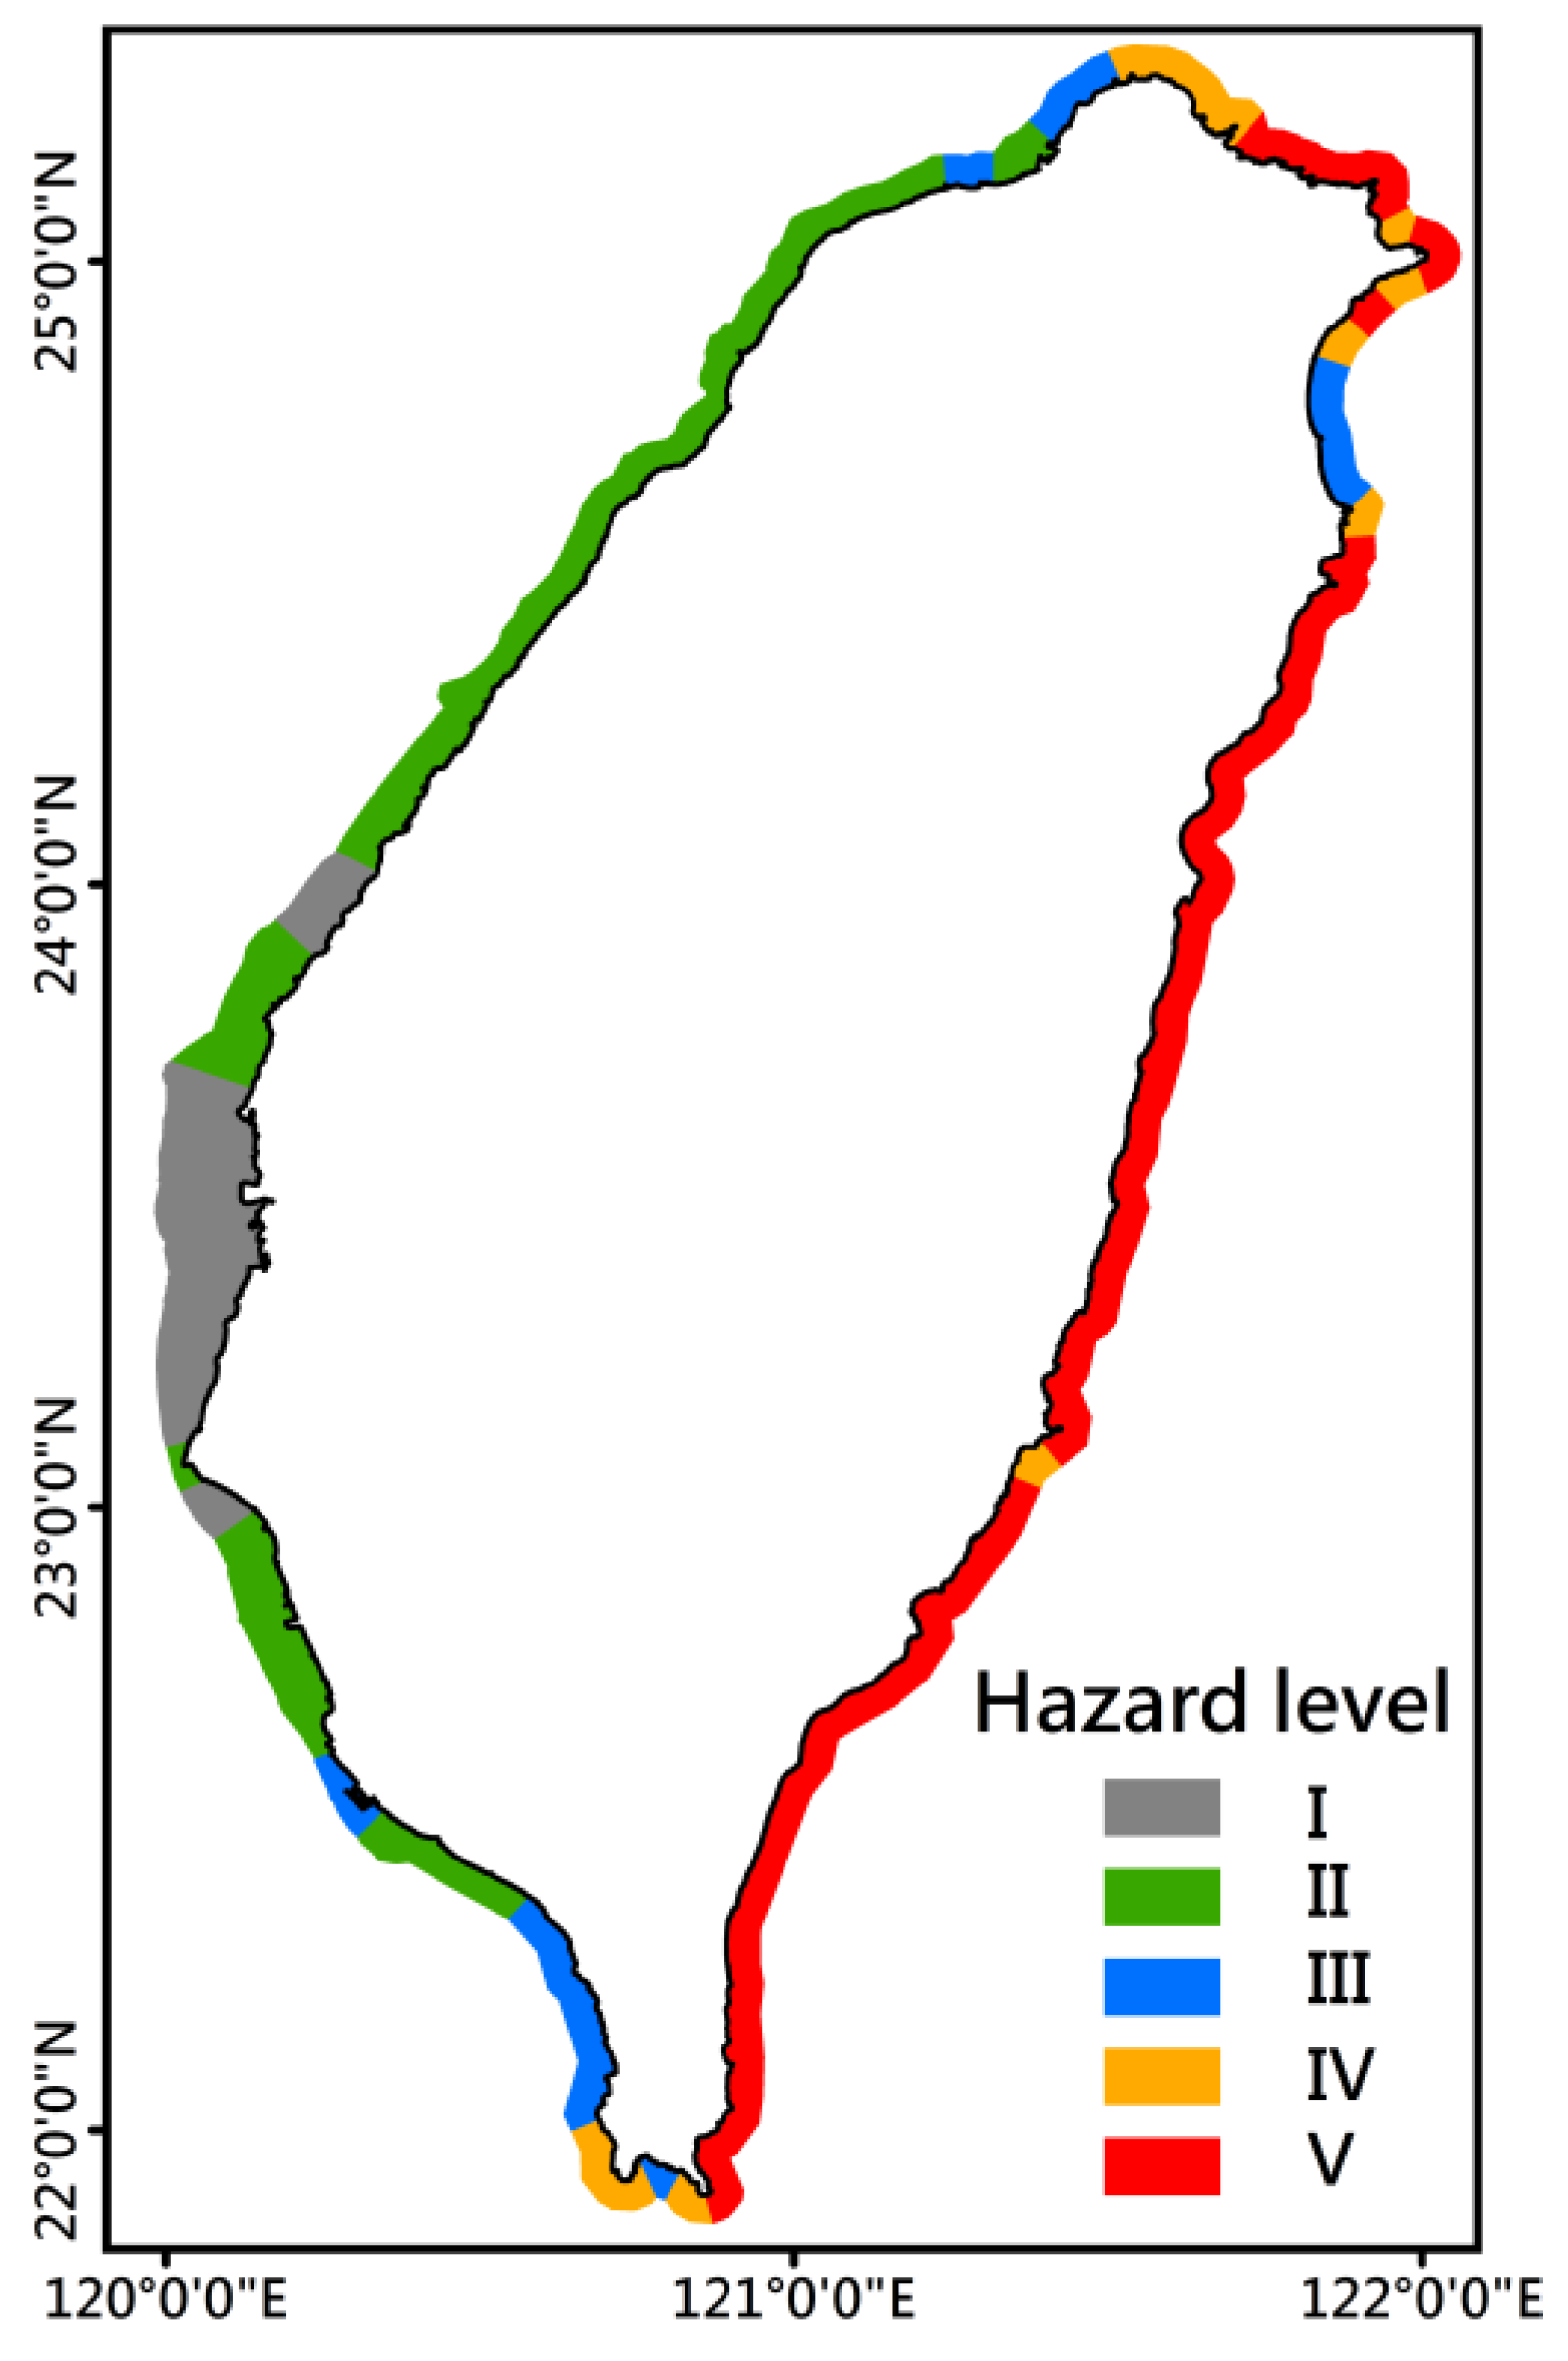
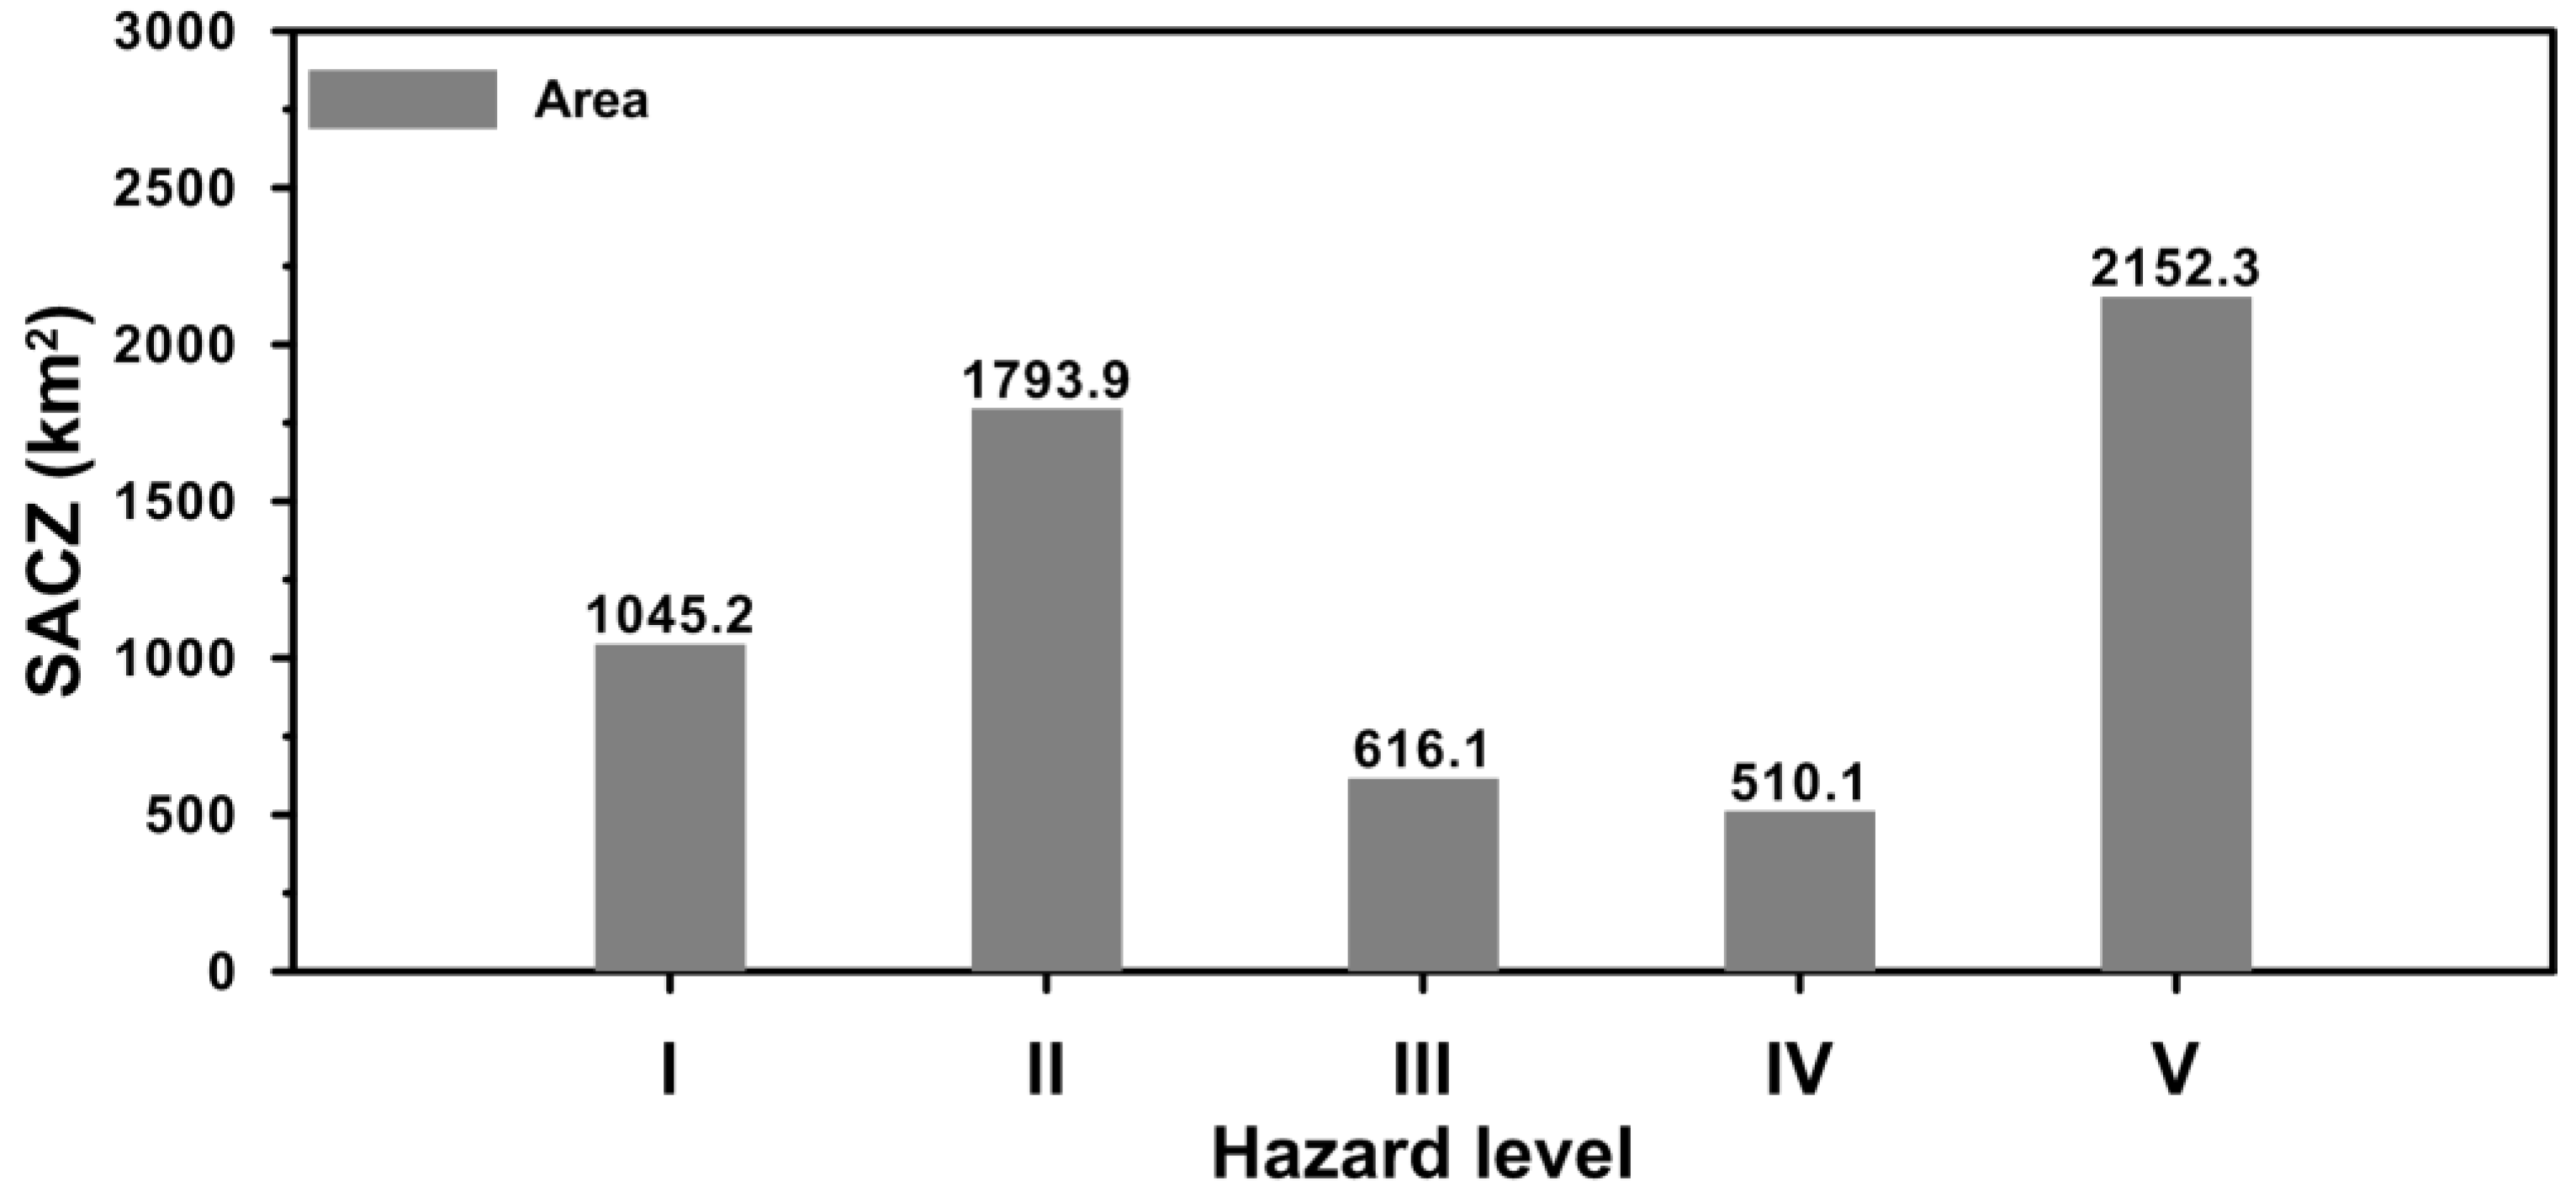
4.2. Assessing the Comprehensive Storm Wave Hazard
4.3. Discussion and Future Work
5. Conclusions
Author Contributions
Funding
Acknowledgments
Conflicts of Interest
References
- Neumann, B.; Vafeidis, A.T.; Zimmermann, J.; Nicholls, R.J. Future coastal population growth and exposure to sea-rise and coastal flooding—A global assessment. PLoS ONE 2015, 10, e0118571. [Google Scholar] [CrossRef] [PubMed]
- Smith, L. Environmental Hazards: Assessment Risk and Reducing Disaster, 2nd ed.; Routledge: London, UK, 1996; ISBN 0-415-31804-1. [Google Scholar]
- Nicholls, R.J.; Wong, P.P.; Burkett, V.R.; Codignotto, J.O.; Hay, J.E.; McLean, R.F.; Ragoonaden, S.; Woodroffe, C.D. Coastal systems and low-lying areas. In Climate Change 2007: Impacts, Adaptation and Vulnerability. Contribution of Working Group II to the Fourth Assessment Report of the Intergovernmental Panel on Climate Change; Parry, M.L., Canziani, O.F., Palutikof, J.P., van der Linden, P.J., Hanson, C.E., Eds.; Cambridge University Press: Cambridge, UK, 2007; pp. 315–356. [Google Scholar]
- Bertin, X.; Li, K.; Roland, A.; Bidlot, J.-R. The contribution of short-wave in storm surges: Two case studies in the Bay of Biscay. Cont. Shelf Res. 2015, 96, 1–15. [Google Scholar] [CrossRef]
- Heaps, N. Storm surge, 1967–1982. Geophys. J. Int. 1983, 74, 331–376. [Google Scholar] [CrossRef]
- Pang, L.; Chen, X.; Li, Y.L. Long-term Probability Prediction on the Extreme Sea States Induced by Typhoon of the South China Sea. Adv. Mater. Res. 2013, 726, 833–841. [Google Scholar] [CrossRef]
- Krien, Y.; Dudon, B.; Roger, J.; Zahibo, N. Probabilistic hurricane-induced storm surge hazard assessment in Guadeloupe, Lesser Antilles. Nat. Hazards Earth Syst. Sci. 2015, 15, 1711–1720. [Google Scholar] [CrossRef]
- Krien, Y.; Dudon, B.; Roger, J.; Arnaud, G.; Zahibo, N. Assessing storm surge hazard and impact of sea level rise in the Lesser Antilles case study of Martinique. Nat. Hazards Earth Syst. Sci. 2017, 17, 1559–1571. [Google Scholar] [CrossRef]
- Liu, Q.; Ruan, C.; Zhong, S.; Li, J.; Yin, Z.; Lian, X. Risk assessment of storm surge disaster based on numerical models and remote sensing. Int. J. Appl. Earth Obs. Geoinf. 2018, 68, 20–30. [Google Scholar] [CrossRef]
- Cardone, V.J.; Jensen, R.E.; Resio, D.T.; Swail, V.R.; Cox, A.T. Evaluation of contemporary ocean wave models in rare extreme events: The “halloween storm” of October 1991 and the “Storm of the Century” of March 1993. J. Atmos. Ocean. Technol. 1996, 13, 198–230. [Google Scholar] [CrossRef]
- Moon, I.J.; Ginis, I.; Hara, T.; Tolman, H.; Wright, C.W.; Walsh, E.J. Numerical simulation of sea-surface directional wave spectra under hurricane wind forcing. J. Phys. Oceanogr. 2003, 33, 1680–1706. [Google Scholar] [CrossRef]
- Babanin, A.V.; Hsu, T.W.; Roland, A.; Ou, S.H.; Doong, D.J.; Kao, C.C. Spectral wave modelling of typhoon Krosa. Nat. Hazards Earth Syst. Sci. 2011, 11, 501–511. [Google Scholar] [CrossRef]
- Liu, Q.; Babanin, A.; Fan, Y.; Zieger, S.; Guan, C.; Moon, I.J. Numerical simulations of ocean surface waves under hurricane conditions: Assessment of existing model performance. Ocean. Model. 2017, 118, 73–93. [Google Scholar] [CrossRef]
- Young, I.R. Wind Generated Ocean. Waves; Elsevier Science Ltd.: Amsterdam, The Netherlands, 1999. [Google Scholar]
- Group, T.W. The WAM model—A third generation ocean wave prediction model. J. Phys. Oceanogr. 1988, 18, 1775–1810. [Google Scholar] [CrossRef]
- Sun, Y.; Chen, C.; Beardsley, R.C.; Xu, Q.; Qi, C.; Lin, H. Impact of current-wave interaction on storm surge simulation: A case study for Hurricane Bob. J. Geophys. Res. Ocean. 2013, 118, 2685–2701. [Google Scholar] [CrossRef]
- Kudryavtsev, V.N.; Makin, V.K.; Chapron, B. Coupled Sea Surface-Atmosphere Model: 2. Spectrum of Short Wind Waves. J. Geophys. Res. 1999, 104, 7625–7639. [Google Scholar] [CrossRef]
- Booij, N.; Ris, R.; Holthuijsen, L.H. A third-generation wave model for coastal regions: 1. Model description and validation. J. Geophys. Res. 1999, 104, 7649–7666. [Google Scholar] [CrossRef]
- Romero, L.; Lenain, L.; Kendall Melville, W. Observations of Surface Wave–Current Interaction. J. Phys. Oceanogr. 2017, 47, 615–632. [Google Scholar] [CrossRef]
- Davidson, M.A.; O’Hare, T.J.; George, K.J. Tidal modulation of incident wave heights Fact or Fiction? J. Coast. Res. 2008, 24, 151–159. [Google Scholar] [CrossRef]
- Chen, W.B.; Lin, L.Y.; Jang, J.H.; Chang, C.H. Simulation of Typhoon-Induced Storm Tides and Wind Waves for the Northeastern Coast of Taiwan Using a Tide–Surge–Wave Coupled Model. Water 2017, 9, 549. [Google Scholar] [CrossRef]
- Shih, H.J.; Chang, C.H.; Chen, W.B.; Lin, L.Y. Identifying the Optimal Offshore Areas for Wave Energy Converter Deployments in Taiwanese Waters Based on 12-Year Model Hindcasts. Energies 2018, 11, 499. [Google Scholar] [CrossRef]
- Shih, H.J.; Chen, H.; Liang, T.Y.; Fu, H.S.; Chang, C.H.; Chen, W.B.; Su, W.R.; Lin, Y.Y. Generating potential risk maps for typhoon-induced waves along the coast of Taiwan. Ocean. Eng. 2018, 163, 1–14. [Google Scholar] [CrossRef]
- Luettich, R.A.; Westerink, J.J. Formulation and Numerical Implementation of the 2D/3D ADCIRC Finite Element Model. Version 44.XX; University of North Carolina at Chapel Hill: Morehead City, NC, USA, 2004; Available online: http://www.unc.edu/ims/adcirc/adcirc_theory_2004_12_08.pdf (accessed on 20 May 2018).
- Atkinson, J.H.; Westerink, J.J.; Hervouet, J.M. Similarities between the wave equation and the quasi-bubble solutions to the shallow water equations. Int. J. Numer. Methods Fluids 2004, 45, 689–714. [Google Scholar] [CrossRef]
- Dawson, C.; Westerink, J.J.; Feyen, J.C.; Pothina, D. Continuous, discontinuous and coupled discontinuous–continuous galerkin finite element methods for the shallow water equations. Int. J. Numer. Methods Fluids 2006, 52, 63–88. [Google Scholar] [CrossRef]
- Westerink, J.J.; Luettich, R.A.; Feyen, J.C.; Atkinson, J.H.; Dawson, C.; Roberts, H.J.; Powell, M.D.; Dunion, J.P.; Kubatko, E.J.; Pourtaheri, H. A basin to channel scale unstructured grid hurricane storm surge model applied to southern Louisiana. Mon. Weather Rev. 2008, 136, 833–864. [Google Scholar] [CrossRef]
- Powell, M.D.; Vickery, P.J.; Reinhold, T.A. Reduced drag coefficient for high wind speeds in tropical cyclones. Nature 2003, 422, 279–283. [Google Scholar] [CrossRef] [PubMed]
- Battjes, J.A. Computation of Set-Up, Longshore Currents, Run-Up and Overtopping Due to Wind-Generated Waves; Rep. 74–2, Communications on Hydraulics; Department of Civil Engineering, Delft University of Technology: Delft, The Netherlands, 1974. [Google Scholar]
- Longuet-Higgins, M.S.; Stewart, R.W. Radiation stress and transport in gravity wave, with application to ‘surf beat’. J. Fluid Mech. 1962, 13, 485–504. [Google Scholar] [CrossRef]
- Longuet-Higgins, M.S.; Stewart, R.W. Radiation stress in water waves: A physical discussion with applications. Deep Sea Res. 1964, 11, 529–562. [Google Scholar]
- Zijlema, M. Computation of wind–wave spectra in coastal waters with SWAN on unstructured grids. Coast. Eng. 2010, 57, 267–277. [Google Scholar] [CrossRef]
- Holthuijsen, L.H.; Booij, N.; Ris, R.C. A spectral wave model for the coastal zone. In Proceedings of the 2nd International Symposium on Ocean Wave Measurement and Analysis, New Orleans, LA, USA, 25–28 July 1993; American Society of Civil Engineers: Reston, VA, USA, 1993; pp. 630–641. [Google Scholar]
- Ris, R.C.; Booij, N.; Holthuijsen, L.H. A third-generation wave model for coastal regions: 2. Verification. J. Geophys. Res. 1999, 104, 7667–7681. [Google Scholar] [CrossRef]
- Zijlema, M.; van der Westhuysen, A.J. On convergence behaviour and numerical accuracy in stationary SWAN simulations of nearshore wind wave spectra. Coast. Eng. 2005, 52, 237–256. [Google Scholar] [CrossRef]
- Battjes, J.A.; Janssen, J.P.F.M. Energy loss and set-up due to breaking of random waves. In Proceedings of the 16th International Conference on Coastal Engineering, Hamburg, Germany, 27 August–3 September 1978; ASCE: Reston, VA, USA, 1978; pp. 569–587. [Google Scholar]
- Dietrich, J.C.; Zijlema, M.; Westerink, J.J.; Holthuijsen, L.H.; Dawson, C.; Luettich, R.A., Jr.; Jensen, R.E.; Smith, J.M.; Stelling, G.S.; Stone, G.W. Modeling hurricane waves and storm surge using integrally-coupled, scalable computations. Coast. Eng. 2011, 58, 45–65. [Google Scholar] [CrossRef]
- Zu, T.; Gana, J.; Erofeevac, S.Y. Numerical study of the tide and tidal dynamics in the South China Sea. Deep Sea Res. 2008, 55, 137–154. [Google Scholar] [CrossRef]
- Janssen, P. The Interaction of Ocean. Waves and Wind; Cambridge University Press: Cambridge, UK, 2004. [Google Scholar]
- Cardone, V.J.; Cox, A.T. Tropical ccyclone wind field forcing for surge models: Critical issues and sensitivities. Nat. Hazards 2009, 51, 29–47. [Google Scholar] [CrossRef]
- Fujita, T. Pressure distribution in typhoon. Geophys. Mag. 1952, 23, 437–451. [Google Scholar]
- Jelesnianski, C.P. A numerical computation of storm tides induced by a tropical storm impinging on a continental shelf. Mon. Weather Rev. 1965, 93, 343–358. [Google Scholar] [CrossRef]
- Holland, G.J. An analytical model of the wind and pressure profiles in hurricanes. Mon. Weather Rev. 1980, 108, 1212–1218. [Google Scholar] [CrossRef]
- Wang, X.; Qian, C.; Wang, W.; Yan, T. An elliptical wind field model of typhoons. J. Ocean. Univ. China 2004, 3, 33–39. [Google Scholar] [CrossRef]
- MacAfee, A.W.; Pearson, G.W. Development and testing of tropical Cyclone parametric wind models tailored for midlatitude application-preliminary results. J. Appl. Meteorol. Climatol. 2006, 45, 1244–1260. [Google Scholar] [CrossRef]
- Wood, V.T.; White, L.W.; Willoughby, H.E.; Jorgensen, D.P. A new parametric tropical cyclone tangential wind profile model. Mon. Weather Rev. 2013, 141, 1884–1909. [Google Scholar] [CrossRef]
- Jakobsen, F.; Madsen, H. Comparison and further development of parametric tropical cyclone models for storm surge modelling. J. Wind Eng. Ind. Aerodyn. 2004, 92, 375–391. [Google Scholar] [CrossRef]
- Hubbert, G.D.; Holland, G.J.; Leslie, L.M.; Manton, M.J. A real-time system for forecasting tropical cyclone storm surges. Weather Forecast. 1991, 6, 86–97. [Google Scholar] [CrossRef]
- Lin, N.; Chavas, D. On hurricane parametric wind and applications in storm surge modeling. J. Geophys. Res. 2012, 117, D9. [Google Scholar] [CrossRef]
- Zhang, H.; Sheng, J. Examination of extreme sea levels due to storm surges and tides over the northwest Pacific Ocean. Cont. Shelf Res. 2015, 93, 81–97. [Google Scholar] [CrossRef]
- Georgiou, P. Design Wind Speeds in Tropical Cyclone Prone Regions. Ph.D. Thesis, University of Western Ontario, London, Canada, 1985. [Google Scholar]
- Dee, D.P.; Uppala, S.M.; Simmons, A.J.; Berrisford, P.; Poli, P.; Kobayashi, S.; Andrae, U.; Balmaseda, M.A.; Balsamo, G.; Bauer, P.; et al. The ERA-Interim reanalysis: Configuration and performance of the data assimilation system. Q. J. R. Meteorol. Soc. 2011, 137, 53–597. [Google Scholar] [CrossRef]
- Li, J.; Pan, S.; Chen, Y.; Fan, Y.M.; Pan, Y. Numerical estimation of extreme waves and surges over the northwest Pacific Ocean. Ocean. Eng. 2018, 153, 225–241. [Google Scholar] [CrossRef]
- Pan, Y.; Chen, Y.P.; Li, J.X.; Ding, X.L. Improvement of wind field hindcasts for tropical cyclones. Water Sci. Eng. 2016, 9, 58–66. [Google Scholar] [CrossRef]
- Feng, X.; Li, M.; Yin, B.; Yang, D.; Yang, H. Study of storm surge trends in typhoon-prone coastal areas based on observations and surge-wave coupled simulations. Int. Appl. Earth Obs. Geoinf. 2018, 68, 272–278. [Google Scholar] [CrossRef]
- Chen, W.; Chen, K.; Kuang, C.; Zhu, D.; He, L.; Mao, X.; Liang, H.; Song, H. Influence of sea level rise on saline water instruction in the Yangtze River Estuary, China. Appl. Ocean. Res. 2016, 54, 12–25. [Google Scholar] [CrossRef]
- Dietrich, J.C.; Westerink, J.J.; Kennedy, A.B.; Smith, J.M.; Jensen, R.E.; Zijlema, M.; Holthuijsen, L.H.; Dawson, C.N.; Luettich, R.A., Jr.; Powell, M.D.; et al. Hurricane Gustav (2008) waves and storm surge: Hindcast, synoptic analysis, and validation in Southern Louisiana. Mon. Weather Rev. 2011, 139, 2488–2522. [Google Scholar] [CrossRef]
- Dietrich, J.C.; Tanaka, S.; Westerink, J.J.; Dawson, C.N.; Luettich, R.A., Jr.; Zijlema, M.; Holthuijsen, L.H.; Smith, J.M.; Westerink, L.G.; Westerink, H.J. Performance of the unstructured-mesh, SWAN+ADCIRC model in computing hurricane waves and surge. J. Sci. Comput. 2012, 52, 468–497. [Google Scholar] [CrossRef]
- Hope, M.E.; Westerink, J.J.; Kennedy, A.B.; Kerr, P.C.; Dietrich, J.C.; Dawson, C.; Bender, C.; Smith, J.M.; Jensen, R.E.; Zijlema, M.; et al. Hindcast and validation of hurricane Ike (2008): Waves, forerunner, and stormsurge. J. Geophys. Res. Oceans 2013, 118, 4424–4460. [Google Scholar] [CrossRef]
- Murty, P.L.N.; Bhaskaran, P.K.; Gayathri, R.; Sahoo, B.; Srinivasa Kumar, T.; SubbaReddy, B. Numerical study of coastal hydrodynamics using a coupled model for Hudhud cyclone in the Bay of Bengal, Estuar. Coast. Shelf Sci. 2016, 183, 13–27. [Google Scholar] [CrossRef]
- Xu, F.; Perrie, W.; Solomon, S. Shallow Water Dissipation Processes for Wind Waves off the Mackenzie Delta. Atmos. Ocean. 2013, 51, 296–308. [Google Scholar] [CrossRef]
- Murakami, H. Tropical cyclones in reanalysis data sets. Geophys. Res. Lett. 2014, 41, 2133–2141. [Google Scholar] [CrossRef]
- Michalakes, J.; Chen, S.; Dudhia, J.; Hart, L.; Klemp, J.; Middlecoff, J.; Skamarock, W. Development of a next generation regional weather research and forecast model. In Developments in Teracomputing, Proceedings of the Ninth ECMWF Workshop on the Use of High Performance Computing in Meteorology, Reading, UK, 13–17 November 2000; Zwieflhofer, W., Kreitz, N., Eds.; World Scientific: Singapore, 2001; pp. 269–276. [Google Scholar]


| Count | Category | ||||||||
|---|---|---|---|---|---|---|---|---|---|
| C1 | C2 | C3 | C4 | C5 | C6 | C7 | C8 | C9 | |
| Typhoon number | 12 | 15 | 23 | 12 | 17 | 21 | 5 | 4 | 13 |
| Station | Wind Field | MAE (m) | RMSE (m) | MAPE (%) | Skill |
|---|---|---|---|---|---|
| Guishan Island | PT | 0.93 | 1.19 | 46.04 | 0.86 |
| RT | 0.82 | 1.21 | 32.87 | 0.96 | |
| HT | 0.53 | 0.71 | 25.68 | 0.95 | |
| Suao | PT | 0.78 | 0.96 | 32.98 | 0.98 |
| RT | 0.66 | 1.02 | 22.53 | 0.97 | |
| HT | 0.41 | 0.49 | 17.99 | 0.98 | |
| Hualien | PT | 0.81 | 0.95 | 4459 | 0.89 |
| RT | 0.84 | 1.16 | 37.69 | 0.71 | |
| HT | 0.66 | 0.75 | 29.77 | 0.94 |
| Hazard Level | Range of SWHs (m) | Descriptions |
|---|---|---|
| I | <3.0 | Small Wave |
| II | (3.0–6.0) | Big Wave |
| III | (6.0–9.0) | Giant Wave |
| IV | (9.0–12.0) | Violent Wave |
| V | ≥12.0 | Roaring Wave |
| Hazard Level | Category | ||||||||
|---|---|---|---|---|---|---|---|---|---|
| C1 | C2 | C3 | C4 | C5 | C6 | C7 | C8 | C9 | |
| I | 2906.5 | 2183.0 | 1402.2 | 1898.9 | 2847.2 | 1714.9 | 2477.5 | 3513.6 | 2508.7 |
| II | 2564.2 | 1309.7 | 2179.1 | 1307.0 | 1168.2 | 1546.3 | 1331.3 | 2020.7 | 2793.0 |
| III | 490.5 | 1012.5 | 941.8 | 926.4 | 1364.4 | 1805.7 | 533.8 | 489.0 | 761.4 |
| IV | 156.2 | 1041.2 | 668.7 | 287.2 | 210.0 | 904.5 | 1092.8 | 94.3 | 54.3 |
| V | 0.0 | 571.0 | 925.7 | 1698.0 | 527.7 | 146.0 | 682.1 | 0.0 | 0.0 |
© 2018 by the authors. Licensee MDPI, Basel, Switzerland. This article is an open access article distributed under the terms and conditions of the Creative Commons Attribution (CC BY) license (http://creativecommons.org/licenses/by/4.0/).
Share and Cite
Chang, C.-H.; Shih, H.-J.; Chen, W.-B.; Su, W.-R.; Lin, L.-Y.; Yu, Y.-C.; Jang, J.-H. Hazard Assessment of Typhoon-Driven Storm Waves in the Nearshore Waters of Taiwan. Water 2018, 10, 926. https://doi.org/10.3390/w10070926
Chang C-H, Shih H-J, Chen W-B, Su W-R, Lin L-Y, Yu Y-C, Jang J-H. Hazard Assessment of Typhoon-Driven Storm Waves in the Nearshore Waters of Taiwan. Water. 2018; 10(7):926. https://doi.org/10.3390/w10070926
Chicago/Turabian StyleChang, Chih-Hsin, Hung-Ju Shih, Wei-Bo Chen, Wen-Ray Su, Lee-Yaw Lin, Yi-Chiang Yu, and Jiun-Huei Jang. 2018. "Hazard Assessment of Typhoon-Driven Storm Waves in the Nearshore Waters of Taiwan" Water 10, no. 7: 926. https://doi.org/10.3390/w10070926
APA StyleChang, C.-H., Shih, H.-J., Chen, W.-B., Su, W.-R., Lin, L.-Y., Yu, Y.-C., & Jang, J.-H. (2018). Hazard Assessment of Typhoon-Driven Storm Waves in the Nearshore Waters of Taiwan. Water, 10(7), 926. https://doi.org/10.3390/w10070926