Abstract
The effect of weather on sport events is largely discussed in the sports medicine and exercise physiology context. It is important, both for event organizers and for medical staff, to know whether the competition is happening at a time and place with extreme weather or in general not appropriate weather and climatic conditions. In order to find out, whether a place or time is appropriate, two factors should be included when establishing the effect of atmospheric conditions on visitors and athletes. These are the main climatic conditions, based on long term data, and the quantification of extreme events, like heat waves. The present analysis aims at determining what kind of data are required for an appropriate quantification of weather and climate thermal stress. For the analysis, indices like Physiologically Equivalent Temperature (PET) and mPET (modified PET) are applied. The advantage of these indices is the consideration of both, thermo-physiological and meteorological factors to provide results and information that can be used for decision making. In this paper, we analyzed the Tokyo area with regards to the upcoming Tokyo 2020 Summer Olympic Games. The results show that this kind of event may not be appropriate for visitors, if it is placed during months with extreme conditions. For Tokyo, this is the period from May to September, when conditions cause strong heat stress to the visitors for the vast majority of hours of the day. A more appropriate time would be the months from November to February or the early morning and the late afternoon hours, when thermally comfortable conditions are much more frequent. The methods that are applied here can quantify the thermal conditions and show limitations and possibilities for specific events and locations. Should the organizers still want to have these competitions organized during these months with extreme conditions, they should promote and propose all possible countermeasures for the spectators, workforce, and athletes.
1. Introduction
Sport events on the international scale, e.g., the 2020 Olympics in Tokyo, are mostly hosted during the summer season. This might be due to the fact that they are often originating from Europe, where the summer season is the one with the largest fraction of thermally comfortable hours [1]. There are several perspectives to be considered when analyzing the effect of meteorological conditions: (a) the athlete’s [2] and (b) the visitors’ and workforces’ attending the events [1]. This study does focus on athletes participating in the competitions of, as well as on visitors, originating from various places all over the world (e.g., Europe). Just like athletes, visitors have different thermal perception and they express different behaviors.
However, there are several factors which must be considered. First of all, it has to be stated that visitors and tourists are the groups mostly affected by extreme meteorological conditions. This is due to the usually short acclimatization time and lack of information on how to counteract the effects of heat while travelling. Proper hydration schedules, shading behaviors, and clothing should be adopted when exposed to outdoor conditions. On the other hand, athletes participating in events usually tend to arrive on the site of the event few days prior to competition. This strategy allows them to progressively acclimatize to the local climatic conditions and increase the exercising load up to the day of competition. To allow for a safe participation in sport events, it is recommended that athletes arrive at the competition location at least two weeks prior to the event [3]. When arriving on the site of the event in advance is not possible, acclimatization should take place in an environment with similar climatic conditions to the final destination. Proper hydration behaviors and clothing should also be adopted, and athletes should be familiar with strategies to limit dehydration, sun exposure, and lowering their body temperature.
The existing methodologies for the quantification and assessment of the effect of the thermal environment on human beings, mostly estimating thermal indices, are well known and applied regularly for other purposes than sport events [1]. Typical applications in this field are: analyzing different designs of open spaces and the effect on local thermal comfort, the benefit of green areas in terms of human thermal biometeorology [4], as well as heat waves in urban areas [5]. The impact of the environment on human thermal comfort includes different meteorological and non-meteorological parameters [6,7]. Especially, some of the meteorological measures are severely modified by the environment (e.g., wind speed and the individual radiation fluxes) [8]. Urban environments, which are most probably the prevailing environment type in Tokyo (alike all types of areas in general), generate modifications of the local meteorological conditions by morphology and surface properties of the various specific elements and their configurations [1,2]. This, however, can be turned into an advantage as the resulting local micro climate may be modified by planning measures to achieve a reduction of heat load on humans attending the event in question [1,9,10].
The aim of this study is to propose a methodology that can be used as a basis for future decisions about location, time of year and time of the day for specific sport events. Furthermore, to create a method to quantify general and specific conditions for different kind of sports e.g., road races or wind influenced sports [9,10]. Another objective is to define short term conditions assessment and procedures to generate recommendations and tools for delaying, or, in extreme conditions, canceling, sport events. The methodology that is presented here does allow for the identification of time periods of the year, which are appropriate or inappropriate in the context of human thermal comfort, for the timely design of the appropriate countermeasures that are necessary to avoid casualties. At the same time, it is intended to provide the methodology to enable planners and responsible persons to run a similar analysis themselves. In contrast to earlier studies on similar topics, the research that is presented here not only is relying on a quantification of individual parameters influencing human-biometeorology, e.g., air temperature (Ta) on a coarse temporal resolution, but on the analysis of temporal variability and sensitivity of two complex thermal indexes (Physiologically Equivalent Temperature (PET) and modified Physiological Equivalent Temperature (mPET)) for a long period of meteorological data in 3 h temporal resolution. The methodology was designed to obtain results that may assist in the early stage of planning different sporting events all over the world. The method is described in detail to allow for the planning committees to reproduce the analysis for their local conditions to obtain quantitative results for their specific location. The results are presented in graphs, which are designed in a way that can be understood easily by non-specialists in the field of thermal human-biometeorology.
2. Methodology and Data
2.1. Study Area
Tokyo is an agglomeration of around 10 million inhabitants that are located in the eastern center of the Japanese main island Honshū. The Japanese capital together with the Greater Tokyo Area surrounding the Bay of Tokyo is considered to exceed 38 million inhabitants. The approximate coordinates are 35°41’ N and 139°45’ E. The local climate is temperate—humid (Köppen climate classification Cfa [11]) with hot, perhumid summers, precipitation exceeding 300 mm in September and October, and less precipitation (of less than 90 mm in January) in cool winters. The region, like much of Japan, experiences a one-month seasonal lag, with the warmest month on average being August, with an average maximum air temperature of 29.9 °C. The coldest month is January with an average minimum air temperature of 3.2 °C (compare to Figure 1). Snowfall is sporadic but does occur almost annually. The overall average air temperature is 16.3 °C. The overall average sum of precipitation per year is 2546 mm. The most humid month thereby is September with 333.6 mm, while the least amount of average precipitation per month is recorded for January with only 88.4 mm. An overview over them local conditions in Tokyo in terms of different meteorological parameters is provided by Table 1.
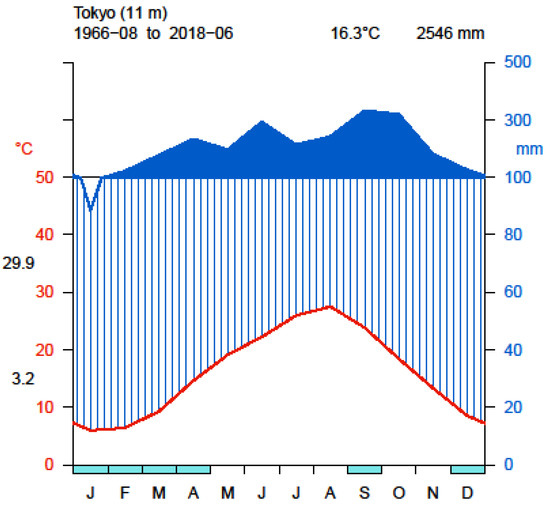
Figure 1.
‘Walter and Lieth’ diagram [11] for Tokyo City showing averages for air temperature (Ta, left axis, shown in red) and average sum of monthly precipitation (right axis, provided in blue) in the period from August 1966 to June 2018. Humid conditions (average monthly sum of precipitation exceeds 0.5 times the average Ta) are shown by blue lines (blue polygons if 300 mm are exceeded).

Table 1.
Overview table showing statistics for the meteorological parameters air temperature, relative humidity, vapor pressure, wind velocity (in 10.0 m above ground level) and cloud cover recorded at Tokyo covering the period 22 August 1966 to 1 June 2018 in 3 h temporal resolution.
2.2. Physiologically Equivalent Temperature
The Physiologically Equivalent Temperature (PET) is the thermal index that is applied as a measure for human thermal comfort in this study. It is defined “as the air temperature at which, in a typical indoor setting (without wind and solar radiation), the energy balance of the human body is balanced with the same core and skin temperature as under the complex outdoor conditions to be assessed” [6,12,13]. PET was selected for being one of the most commonly used indices in the field of human thermal comfort. Results can therefore be compared easily to those by other authors and studies [4,14]. Another advantage of PET is the index using °C as a unit, which facilitates the interpretation of the results by people without specific knowledge in the field of human-biometeorology. PET, as well as many other complex thermal indices, does rely on a human energy balance model. For the case of PET, this is the Munich Energy Balance Model for Individuals, MEMI [15]. Like most of the complex thermal indices, PET is dependent on the meteorological input parameters air temperature, vapor pressure and wind speed, as well as information about the local radiation fluxes. They are summarized as the mean radiant temperature (Tmrt), and, especially during summer at daytime [16], have a strong effect on PET. Tmrt is defined as the temperature of a perfect black and equal surrounding environment, which leads to the same energy balance as the current environment [17,18].
2.3. Modified Physiologically Equivalent Temperature
The modified Physiological Equivalent Temperature (mPET) is based on classic PET (see above), but it comprises a multi-node heat transport model and a self-adapting clothing model [19]. mPET also contains quite some improvement in the consideration of humidity, which is considered a major weakness in PET [19]. Furthermore, mPET is designed to return results in the same range as PET, so pre-existing thermal perception classifications for PET (e.g., as presented in [20]) can be applied for mPET results as well.
2.4. RayMan Model
The widely used model RayMan was applied for analyzing the thermal comfort conditions for the whole input period by calculating the thermal indices PET and mPET. The micro-scale model RayMan is developed to “calculate radiation fluxes in simple and complex environments” [21,22]. This allows for the calculation of Tmrt, which is an important input parameter in the calculation of thermal indices, e.g., PET. In this study, the PET results were classified applying the thermal perception classification for Central Europe by [20] (Table 2).
Table 2.
Thermal stress classification for Central European human beings (with an internal heat production of 80 W and a heat transfer resistance of the clothing of 0.9 clo (clothing index)), modified after [20].
2.5. Input Data for the Analysis of Thermal Comfort
To obtain representative and comprehensive results, meteorological data for the long period from August 1966 to June 2018 in 3 h resolution provided by a meteorological station in the center of Tokyo (WMO station 47662) and extracted from the synoptic database were used. The station is located within the city at 35°41’30” N, 139°45’04” E in a height of 25.2 m. Thus, the data is expected to be the best-possible representative. The original wind speed needed to be altitude-corrected to be valid for the average human gravity center at a height of 1.1 m above ground level based on a power-law profile approach applied previously [23]. Wind speed at 1.1 m ranges from 0.0 to 33.3 m/s (compare to Table 1) and it is mostly coming from North, North-Northwest, and South at daytime (compare to Figure 2a) and from North-Northwest, North, South and Southwest at nighttime (compare to Figure 2b). For the other parameters, altitude correction was not necessary as their measurement height of 2 m approximately agrees to the destination height and the error therefore is expected to be irrelevant (e.g., Ta, measured in 2 m above ground level would be reduced wet adiabatically by 0.6 K for 100 m height. This results in −0.0054 K difference for 0.9 m, as applied in this study, which is smaller than the usual precision of 0.1 K Ta is presented in).
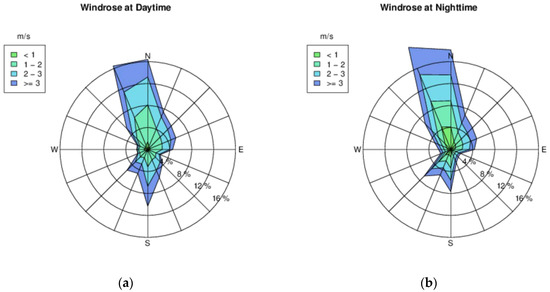
Figure 2.
Wind roses showing the distribution of wind speed and direction in 1.1 m above ground for Tokyo City based on the period August 1966 to June 2018 at day (a) and nighttime (b).
3. Results
The results section is divided into two subsections: the first one focuses on the frequencies of thermal sensation classes for PET and mPET. Both are presented in a 10-day resolution. Each month therefore is split into three intervals to show conditions throughout the months more precisely. The second subsection concentrates on the daily distribution of average PET and mPET throughout the year based on the long measurement period from August 1966 to June 2018. The graphs apply a blue to red color encoding, which facilitates interpretation by non-experts.
3.1. Frequencies of PET and mPET Classes
The frequencies of PET classes in Tokyo for the period 1966–2018 according to Table 2 are presented in Figure 3. Average PET values do range from less than −13.4 °C to up to more than 47.2 °C. It can be observed that the class lower or equal 4 °C only occurs from end of October to end of May in Tokyo. However, it is quite dominant from December to March with the highest frequency in the last decade of January, when 80.4% of the PET results do belong to this class. Also, the class with 4–8 °C does not occur in the summer months. Its highest frequencies are found in spring and fall, where it exceeds 25%, while its frequency drops to 13.5% at the end of January. The highest frequency of the class 18 °C to 23 °C can also be found in spring and fall, but later in spring and earlier in fall. Its maximum frequency of 41.7% in mid-November is much higher than the maximum of the previous class. It is followed by the maximum frequency of the 8 °C to 13 °C class with about 39.6%. The classes 18 °C–23 °C and 23 °C–29 °C are also mostly observed in spring and autumn, but increasingly later in spring and earlier in fall. The classes with PET of 35 °C and above are limited to the months of April to October. The months of July and August, which will be the time of the 2020 Summer Olympics in Tokyo, are showing the highest frequencies for classes of very high PET of about 35 °C with combined average frequencies (for the classes 35–41 °C and >41 °C together) of about 11.5% to about 25.4%. The very time of the Olympics, starting from the 24th of July to 9th of August, or the last decade of July and the first decade of August, can be considered the hottest throughout the year. PET values of about 35 °C are found in 25.4 and 24.3% of all cases in the two decades. It is thereby noted that the frequency diagrams do comprise values for day and nighttime. Cooler conditions mostly occur during nighttime (compare to sec. 3.2), while the situation at daytime is worse than indicated by the plots 3–6. The two decades of the Olympics also show the highest frequencies for PET about 41 °C, translating to extreme heat stress according to the PET perception classification (Table 2), with 2.7 and 2.8%.
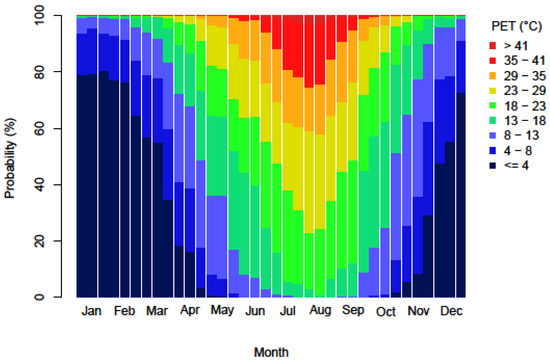
Figure 3.
Frequency diagram (decades) showing the average occurrence of Physiologically Equivalent Temperature (PET) classes for Tokyo during the period August 1966 to June 2018 (3 h resolution). The reference height for the results is 1.1 m. The sensation classes are defined in Table 2.
mPET values are slightly more moderate and they range from less than −13.1 °C up to more than 43.8 °C (Figure 4). Especially in the winter months, the frequency of the class <4 °C is strongly reduced (by up to 25%) in favor of the more moderate classes 4–8 °C and 8–13 °C when comparing the mPET results to those for PET (compare Figure 3 and Figure 4). This is mostly due to the self-adapting clothing model in mPET. Also, the occurrence of the class >41 °C in the summer months is reduced by up to 1.8% in mid-September.
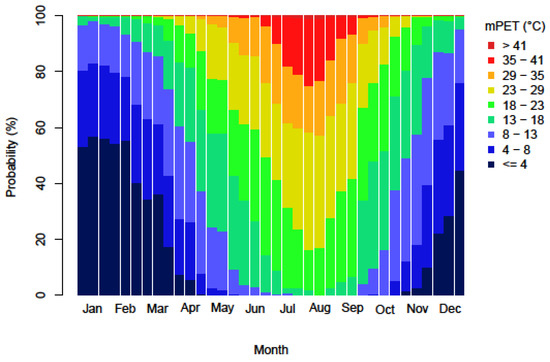
Figure 4.
Frequency diagram (decades) showing the average occurrence of modified Physiological Equivalent Temperature (mPET) classes for Tokyo during the period August 1966 to June 2018 (3 h resolution). The reference height for the results is 1.1 m. The sensation classes are defined in Table 2.
Looking at the individual days of the Olympics in detail, the days from the 24th of July to the 9th of August, the dominance of warm to hot conditions in this time becomes more obvious (compare to Figure 5 and Figure 6). Both PET and mPET indicate increasingly warmer conditions for the time from 24th of July to the 6th of August and slightly cooler conditions on average for the 8th and 9th of August. PET thereby does again calculate to slightly more extreme conditions for the daily frequencies than mPET. In contrast to mPET, PET calculates frequencies for the class 8–13 °C for the 27th and 30th of July (0.4%), while the lowest class is 13–18 °C for mPET in the time of the Olympics. Also, for the hot classes, PET calculates much higher frequencies for the class >41 °C (up to 3.9% for 24th of July) than mPET (with a maximum of 1.8% for the 1st of August).
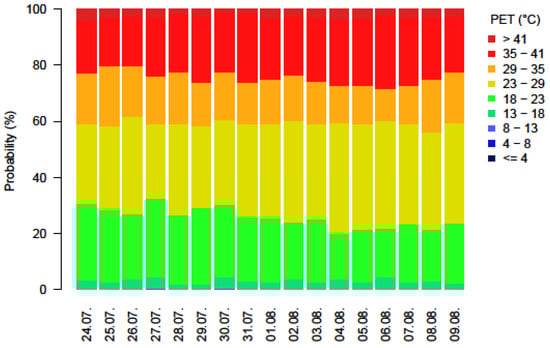
Figure 5.
Frequency diagram showing the average occurrence of PET classes for Tokyo for individual days in the range of the 24th of July and the 9th of August based on data of the years 1966 to 2018. The classes meet the thermal sensation classes stated in Table 2.
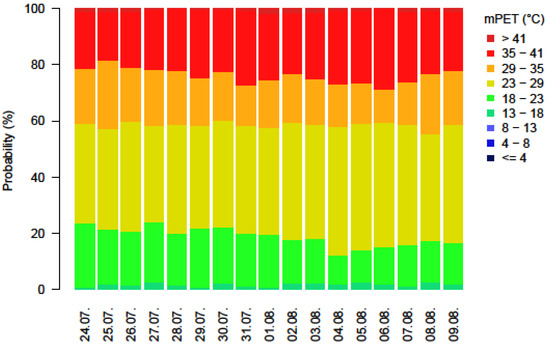
Figure 6.
Frequency diagram showing the average occurrence of mPET classes for Tokyo for individual days in the range of the 24th of July and the 9th of August based on data of the years 1966 to 2018. The classes meet the thermal sensation classes stated in Table 2.
3.2. Daily Distribution of Mean PET and mPET
The mean distribution of PET (Figure 7) and mPET (Figure 8) while considering daytime and day of year at the same time is analyzed to determine the periods with heat stress at specific days and times of the year. When comparing Figure 7 and Figure 8 to the frequency plots (Figure 3, Figure 4, Figure 5 and Figure 6), it can be seen that the hours with high values of PET representing hot conditions according to the sensation classification (Table 2) are mostly occurring during daytime. However, even at nighttime, conditions in Tokyo can be perceived as warm in average in August (Figure 8).
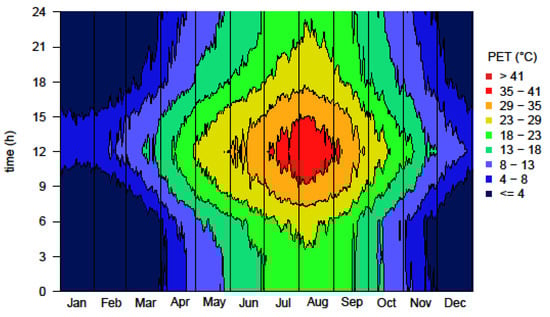
Figure 7.
Temporal diagram for PET for Tokyo during the period August 1966 to June 2018 (3 h resolution). The reference height for the results is 1.1 m. The sensation classes are defined in Table 2. The variation throughout the day can be seen in y-direction, while the variation over the year is given in x-direction.
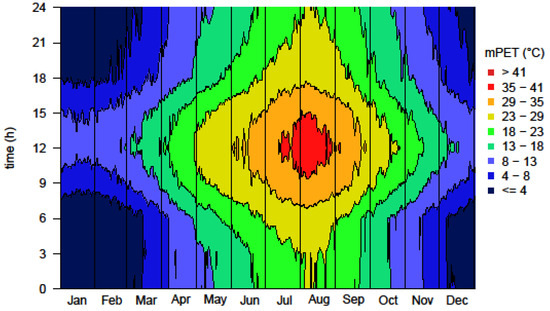
Figure 8.
Temporal diagram for mPET for Tokyo during the period August 1966 to June 2018 (3 h resolution). The reference height for the results is 1.1 m. The sensation classes are defined in Table 2. The variation throughout the day can be seen in y-direction, while the variation over the year is given in x-direction.
Figure 7 indicates that hot conditions, represented by PET of about 35 °C, do occur in average from July to September. Hours with PET of 35 °C and above are most frequent in July and August, where they can be found in the time between 9 a.m. and 3 p.m.
The distribution of average PET and mPET for day and year (Figure 7 and Figure 8) shows a quite similar pattern. In the time from mid-July to the end of August at mid-day, the mPET conditions are higher than 35 °C in average. Warm conditions with mPET in between 29–41 °C do occur from the morning (around 7 a.m.) to late afternoon (approximately 6 p.m.). Both indices do indicate the hottest period of the year, on average, to be found in mid-July to August and, thus, in the time of the 2020 Summer Olympics.
For comparison, the same distribution was also added for air temperature (Figure 9) while using the same thermal classification as for PET and mPET. Air temperature generally shows the same trend but it appears to be much more moderate than the thermal indices (compare to Figure 7 and Figure 8). This is due to other important input parameters that are not considered.
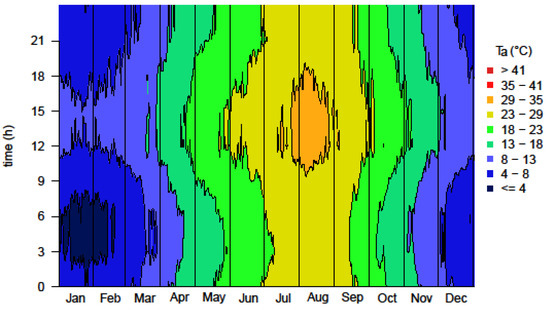
Figure 9.
Temporal diagram for Ta for Tokyo during the period August 1966 to June 2018 (3 h resolution). The reference height for the results is 1.1 m. The sensation classes are defined in Table 2. The variation throughout the day can be seen in y-direction, while the variation over the year is given in x-direction.
4. Discussion and Conclusions
Based on the results, it can be concluded that quantifications and an integral analysis of meteorological conditions for the selection of periods, when sport events may take place over the year do require meteorological input data covering a long period of time of at least 30 years (as recommended by the WMO) in high temporal resolution (<=3 h). Analysis that is based on monthly resolution and average values cannot provide appropriate information. While a long time period is required to provide statistical stability, the temporal resolution should allow for an identification of the beneficial and less beneficial times of the day.
In times of global climate change [24] and urban areas being affected the most, it should be stated that most recent data should be used in order to account for changing frequency and intensity of heat waves and the recent development of the urban canopy influencing the urban heat island effect [14,25].
When comparing Figure 7 and Figure 8 to Figure 9, one can find that the conditions causing thermally uncomfortable or even stressful conditions, namely heat stress, cannot be quantified based on air temperature only. This is in quite good agreement to other studies [5]. Ta is only one of the constituent environmental parameters affecting a human body’s energy balance and therefore it cannot represent the human thermal perception with enough precision [17,18,26]. The human thermal perception is based on the human energy balance influenced by integral effect of air temperature, air humidity, wind speed, and radiation fluxes [15,18]. The applied thermal indices PET and mPET allow for this quantification [7,13]. The presentation of the results in terms of frequency diagrams that are based on thermal comfort classes facilitates the visualization of the conditions throughout day and year as well as their interpretation [20]. From the Figure 7 and Figure 8, it can be concluded that thermal stress in terms of heat stress could be significantly reduced by either moving the date of the event or by carefully setting the time of day. Even in the hottest time of the year, which is found to be the last decade of July, as well as the first two decades of August (compare to Figure 3 and Figure 4), comfortable conditions can be met in the early morning or late afternoon hours.
While this study is mainly focused on visitors originating from Central Europe, it can be considered to be representative for people originating from other regions but with similar thermal climatic conditions. It can further easily be adopted for visitors from other continents or climatic regions by using a different assessment scale that is more representative for the corresponding climatic region, e.g., the classification for Israel [26] or Taiwan [27].
The current study presents some limitations that need to be considered. Readings from an individual meteorological station can be hardly representative for a whole city or urban area, like Tokyo. All of the input parameters to the thermal indices as well as the indices themselves are modified significantly by the urban environment and show strong variation in short distances of few meters [28,29]. However, the general background conditions and the temporal variation in day and year can be seen from the readings and for keeping the study simple only one station was used. This is intended to facilitate reproduction of the results prior to other events. If both, know-how, as well as input data is available, the results can be improved by considering the actual local conditions using a building-resolving urban climate model, e.g., the SkyHelios model [29].
This study describes an approach to determine and assess the conditions that foreign athletes and visitors attending sport events are facing. The approach does provide quantitative results that are based on human biometeorological methods. The intention of the authors is not to prove a specific location unsuitable to host a sport event but rather to provide decision makers with a useful methodology to assess the prevailing conditions and timely take action in order to allow for a safe participation for athletes as well as spectators. Being able to accurately predict climatic conditions does enable the responsible persons to take the most effective countermeasures on time and safeguard all attendees’ health.
Author Contributions
Conceptualization, A.M.; methodology, A.M.; software, A.M. and D.F.; validation, A.M., D.F., S.B. and P.E.A.; formal analysis, A.M., D.F., S.B. and P.E.A.; investigation, A.M., D.F., S.B. and P.E.A.; resources, A.M., D.F., S.B. and P.E.A.; data curation, D.F.; writing—original draft preparation, A.M., D.F., S.B. and P.E.A.; writing—review and editing, A.M., D.F., S.B. and P.E.A.; visualization, D.F.; supervision, A.M.; project administration, A.M.; funding acquisition, A.M., S.B. and P.E.A.
Funding
This research received no external funding.
Acknowledgments
In this section you can acknowledge any support given which is not covered by the author contribution or funding sections. This may include administrative and technical support, or donations in kind (e.g., materials used for experiments).
Conflicts of Interest
The authors declare no conflict of interest.
References
- Matzarakis, A.; Fröhlich, D. Sport events and climate for visitors—The case of FIFA World Cup in Qatar 2022. Int. J. Biometeorol. 2015, 59, 481–486. [Google Scholar] [CrossRef] [PubMed]
- Wong, P.; Lai, P.-C.; Hart, M. Microclimate Variations between Semienclosed and Open Sections of a Marathon Route. Adv. Meteorol. 2013, 287934. [Google Scholar] [CrossRef]
- Armstrong, L.E.; Casa, D.J.; Millard-Stafford, M.; Moran, D.S.; Pyne, S.W.; Roberts, W.O. American College of Sports Medicine position stand. Exertional heat illness during training and competition. Med. Sci. Sports Exerc. 2007, 39, 556–572. [Google Scholar] [CrossRef] [PubMed]
- Lin, T.P.; Matzarakis, A.; Hwand, R.L. Shading effect on long-term outdoor thermal comfort. Build. Environ. 2010, 45, 213–221. [Google Scholar] [CrossRef]
- Nastos, P.; Matzarakis, A. The effect of air temperature and Physiologically Equivalent Temperature on mortality in Athens, Greece. Theor. Appl. Climatol. 2012, 108, 591–599. [Google Scholar] [CrossRef]
- Höppe, P.R. The physiological equivalent temperature—A universal index for the bioclimatological assessment of the thermal environment. Int. J. Biometeorol. 1999, 4, 71–75. [Google Scholar]
- Höppe, P.R. Indoor Climate. Experientia 1993, 49, 775–779. [Google Scholar] [CrossRef]
- Matzarakis, A. The dilemma in thermal comfort estimations in urban areas. In Two hundred years of urban meteorology in the heart of Florence. In Proceedings of the International Conference on Urban Climate and History of Meteorology, Florence, Italy, 25–27 February 2013; Istituto di Biometeorologia: Sassari, Italy, 2013; pp. 3–11. [Google Scholar]
- Hirabayashi, S.; Abe, T.; Imamura, F.; Morioka, C. Development of a Distributed Modeling Framework to Estimate Thermal Comfort along 2020 Tokyo Olympic Marathon Course. Atmosphere 2018, 9, 210. [Google Scholar] [CrossRef]
- Kosaka, E.; Iida, A.; Vanos, J.; Middel, A.; Yokohari, M.; Brown, R. Microclimate Variation and Estimated Heat Stress of Runners in the 2020 Tokyo Olympic Marathon. Atmosphere 2018, 9, 192. [Google Scholar] [CrossRef]
- Walter, H.; Lieth, H. Klimadiagram-Weltatlas; VEB Gustav Fischer Verlag: Jena, Germany, 1660. [Google Scholar]
- Mayer, H.; Höppe, P. Thermal Comfort of Man in Different Urban Environments. Theor. Appl. Climatol. 1987, 38, 43–49. [Google Scholar] [CrossRef]
- Matzarakis, A.; Mayer, H.; Iziomon, M.G. Applications of a universal thermal index: Physiological equivalent temperature. Int. J. Biometeorol. 1999, 43, 76–84. [Google Scholar] [CrossRef]
- Nouri, A.S.; Fröhlich, D.; Silva, M.M.; Matzarakis, A. The Impact of Tipuana tipu Species on Local Human Thermal Comfort Thresholds in Different Urban Canyon Cases in Mediterranean Climates: Lisbon, Portugal. Atmosphere 2018, 9, 12. [Google Scholar] [CrossRef]
- Höppe, P.R. Die Energiebilanz des Menschen. Dissertation, Wissenschaftliche Mitteilungen des Meteorologischen Instituts der Universität München 49, Munich, Germany, 1984. [Google Scholar]
- Herrmann, J.; Matzarakis, A. Mean radiant temperature in idealized urban canyons—Examples from Freiburg, Germany. Int. J. Biometeorol. 2012, 56, 199–203. [Google Scholar] [CrossRef] [PubMed]
- VDI. Environmental Meteorology, Methods for the Human-Biometeorological Evaluation of Climate and Air Quality for the Urban and Regional Planning at Regional Level; Part, I. Climate. VDI/DIN—Handbuch Reinhaltung der Luft. Band 1b; VDI: Düsseldorf, Germany, 1998. [Google Scholar]
- Fanger, P.O. Thermal Comfort; McGraw-Hill: New York, NY, USA, 1972. [Google Scholar]
- Chen, Y.C.; Matzarakis, A. Modified physiologically equivalent temperature—Basics and applications for western European climate. Theor. Appl. Climatol. 2018. [Google Scholar] [CrossRef]
- Matzarakis, A.; Mayer, H. Another kind of environmental stress: Thermal stress. WHO Newsl. 1996, 18, 7–10. [Google Scholar]
- Matzarakis, A.; Rutz, F.; Mayer, H. Modelling Radiation fluxes in simple and complex environments—Application of the RayMan model. Int. J. Biometeorol. 2007, 51, 323–334. [Google Scholar] [CrossRef] [PubMed]
- Matzarakis, A.; Rutz, F.; Mayer, H. Modelling Radiation fluxes in simple and complex environments—Basics of the RayMan model. Int. J. Biometeorol. 2010, 54, 131–139. [Google Scholar] [CrossRef] [PubMed]
- Matzarakis, A.; De Rocco, M.; Najjar, G. Thermal bioclimate in Strasburg—The 2003 heat wave. Theor. Appl. Climatol. 2009, 98, 209–220. [Google Scholar] [CrossRef]
- Campbell, S.; Remenyi, T.A.; Whiteb, C.J.; Johnston, F.H. Heatwave and health impact research: A global review. Health Place 2018, 53, 210–218. [Google Scholar] [CrossRef] [PubMed]
- Oke, T.R. City size and the urban heat island. Atmos. Environ. 1967, 8, 769–779. [Google Scholar] [CrossRef]
- Cohen, P.; Potchter, O.; Matzarakis, A. Human thermal perception of Coastal Mediterranean outdoor urban environments. Appl. Geogr. 2013, 37, 1–10. [Google Scholar] [CrossRef]
- Lin, T.P.; Matzarakis, A. Tourism climate and thermal comfort in Sun Moon Lake, Taiwan. Int. J. Biometeorol. 2008, 52, 281–290. [Google Scholar] [CrossRef] [PubMed]
- Tomczyk, A.M.; Półrolniczak, M.; Kolendowicz, L. Cold Waves in Poznań (Poland) and Thermal Conditions in the City during Selected Cold Waves. Atmosphere 2018, 9, 208. [Google Scholar] [CrossRef]
- Fröhlich, D.; Matzarakis, A. Spatial Estimation of Thermal Indices in Urban Areas—Basics of the SkyHelios Model. Atmosphere 2018, 9, 209. [Google Scholar] [CrossRef]
© 2018 by the authors. Licensee MDPI, Basel, Switzerland. This article is an open access article distributed under the terms and conditions of the Creative Commons Attribution (CC BY) license (http://creativecommons.org/licenses/by/4.0/).