Abstract
The Mediterranean region is characterized by its vulnerability to changes in the water cycle, with the impact of global warming on the water resources being one of the major concerns in social, economical and scientific ambits. Even if precipitation is the best-known term of the Mediterranean water budget, large uncertainties remain due to the lack of suitable offshore observational data. In this study, we use the data provided by the Advanced Microwave Sounding Unit-B (AMSU-B) on board NOAA satellites to detect and analyze precipitating and convective events over the last decade at spatial resolution of 0.2° latitude × 0.2° longitude. AMSU-B observation shows that rain occurrence is widespread over the Mediterranean in wintertime while reduced in the eastern part of the basin in summer. Both precipitation and convection occurrences display a weak diurnal cycle over sea. In addition, convection occurrences, which are essentially located over land during summertime, shift to mostly over the sea during autumn with maxima in the Ionian sub-basin and the Adriatic Sea. Precipitation occurrence is also inferred over the sea from two other widely used climatological datasets, HOAPS (Hamburg Ocean Atmosphere Parameters and Fluxes from Satellite Data) and the European Centre for Medium-Range Weather Forecasts (ECMWF) reanalysis interim (ERA-Interim). There is generally a rather fair agreement between these climatologies for describing the large-scale patterns such as the strong latitudinal gradient of rain and eastward rain signal propagation. Furthermore, the higher spatial resolution of AMSU-B measurements (16 km at nadir) gives access to mesoscale details in the region (e.g., coastal areas). AMSU-B measurements show less rain occurrences than HOAPS during wintertime, thereby suggesting that some of the thresholds used in our method might be too stringent during this season. We also observed that convection occurrences in ERA-Interim are systematically lower than those derived from AMSU-B. These results are potentially valuable to evaluate the rainfall parameterization in weather and climate models and to constrain ocean models.
1. Introduction
The Mediterranean region (Figure 1) is a densely populated area and one of the most responsive to climate change (e.g., [1,2]). On the one hand, water availability is of great importance, and on the other hand, severe weather events, which cause heavy rainfall and floods, add to the socio-economical distress. In fact, trend analysis of daily rainfall data for the period of 1951 to 1995 based on 265 Mediterranean stations have shown that the Central–Western Mediterranean faced a change in the rainfall distribution with reduction of mean precipitation totals, as well as the whole Mediterranean Sea [3], but increase in the occurrence of heavy precipitating events (e.g., [4]). The expected increase in weather systems severity in the future would contribute to the increase in extreme rainfall [5].
Since the beginning of the 2000s, several studies have been carried out to investigate the precipitation climatology over the Mediterranean region. These studies have shown that rain gauges, satellite observation or reanalyses show reasonable agreement regarding large-scale rainfall distribution, while results differ in regional scale particularly over coastal areas and regions with complex topographies (e.g., [6,7]).
In general, the monitoring of precipitation at a high spatial and temporal resolution over the Mediterranean Sea remains challenging (see e.g., [7]). Conventional instrumentation for measuring precipitation such as rain gauges quantify the flux of rainfall and provide rain rate using direct measurements in a small area. Errors in the rain gauges measurements arise from several factors, such as short rainfall events, wind flow, evaporation and the spatial and temporal distribution of raindrop size [8,9,10]. In contrast, weather radar and satellites take a snapshot of the rainfall distribution over a limited area of about a 200 km radius around the site. In spite of uncertainty in the retrieval relationship reflectivity/rainfall from weather radars, they have gained a greater interest due to their capability to monitor rainfall at high spatial and temporal resolution.
Rain gauges and weather radar systems networks are unevenly distributed and mostly concentrated over land masses. Over the oceans, the few existing systems are mainly located on islands and are therefore subject to local influences. While both rain gauges and radars provide quite accurate estimates of rainfall rate, the level of representation of the measurement relative to the surrounding region remains a major issue. The measurement of precipitation on a global basis must therefore rely on satellite systems that are able to provide information at regular intervals (for a review, see [8,9,10,11]).
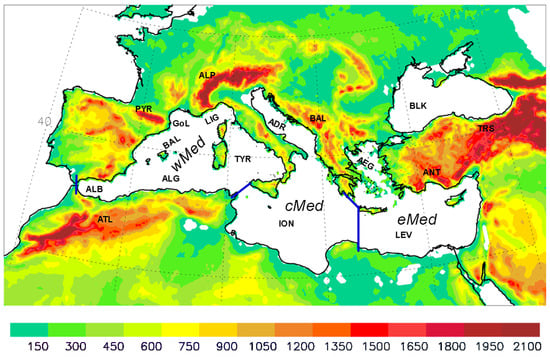
Figure 1.
Orography of the studied area (in meters). wMed: The western Mediterranean basin consists of the Alboran (ALB), the Algerian (ALG), the Balearic (BAL), the Ligurian (LIG) and the Tyrrhenian (TYR) sub-basins; cMed: the central Mediterranean basin consists of the Adriatic Sea (ADR) and the Ionian sub-basin (ION); and eMed: the eastern Mediterranean basin consists of the Aegean Sea (AEG) and the Levantine sub-basin (LEV); BLK: Black Sea; ALP: Alps; ATL: Atlas; BAL: Balkan; PYR: Pyrenees; ANT: Anatolian and TRS: Taurus Mountains. Blue-solid lines indicate limits between western, central and eastern Mediterranean basins.
It is generally admitted that passive microwave (PMW) techniques (e.g., the Special Sensor Microwave Imager (SSM/I), the Tropical Rainfall Measuring Mission (TRMM), the Advanced Microwave Scanning Radiometer—Earth Observing System (AMSR-E)) provide better instantaneous estimates of precipitation than visible/infrared techniques (e.g., [12,13,14]). The infra-red (IR)-based technique offers a very high temporal sampling (e.g., 15 min for GEO satellites) and a fine spatial resolution (down to 3 km). However, a limitation of the IR-based methods is that the relationship of surface rainfall and cold cloud tops is indirect and highly dependent on season and location. The problem is even more severe when dealing with multilayer cloud systems and the bad collocation of the coldest cloud tops and the heaviest precipitation. These issues limit the IR-algorithm’s applicability in global climate studies [9,14].
PMW techniques exploit the fact that microwave radiation emitted from the earth’s surface interacts with the atmosphere constituents such as water vapor and cloud distribution and precipitation particles. Therefore, the desired measurement (i.e., the precipitation signal) is mixed with the earth’s surface radiation. That means that depending on the surface emissivity, the measured signal can be affected. For example, an over-ocean signal due to emission by rain subsequently results in a warmer area than the colder ocean background. Over land, the rainfall is detected by the reduction of the upwelling radiation due to scattering by large, frozen hydrometors. Overall, PMW retrieval methods work better over ocean than over land areas where the emissivities of soil and vegetation are greatly variable from place to place [8]. The spatial resolution (5–60 km) of PMW sensor is constrained by the antenna size, but it still has adequate resolution for global and regional (such as the Mediterranean basin) climatological studies.
PMW captures the precipitation characteristics and provides a better measure of precipitation than IR, even if IR tracks faithfully the movement of precipitating system [9]. Since polar-orbiting satellites that carry microwave sounders overpass the same point on the globe roughly twice daily, infrared observations from geostationary satellites have been consistently used for the characterization of diurnal aspects of precipitation. However, with the launch of a series of Advanced Microwave Sounding Unit (AMSU) instruments on board several platforms, the number of overpasses has increased significantly, providing an unprecedented opportunity to explore microwave-based data to characterize precipitation and convection over the Mediterranean region in a diurnal timescale.
In this paper, we use the data provided by the AMSU-B radiometer (replaced on recent platforms by the Microwave Humidity Sounder, or, MHS), which permits a concomitant observation of convection/precipitation over land and sea at a temporal resolution higher than that of meteorological analyses and with a spatial resolution of roughly 20 km. Brightness temperatures measured since 1999 by channels of the AMSU-B and MHS sensors in the water vapor absorption line (183–191 GHz) allow a screening of precipitation over the whole Mediterranean region, including the sea, where in situ observations are scarce, providing a complementary and completely independent picture from studies based on reanalysis and ground station data.
The present work aims at better characterizing the occurrence of precipitation and convection over the Mediterranean basin at a regional scale over the last decade. It is the first time that the monthly climatology of the MR and DC over the Mediterranean region with a spatial resolution of 0.2° × 0.2° latitudes is discussed. Compared to a number of climatic studies that have been conducted over this area, the spatial resolution is improved, and therefore we can expect more detailed results especially over the sea, where the monitoring remains challenging. It is a contribution to the HyMeX (Hydrological cycle in the Mediterranean eXperiment [15]) program whose objectives are to better understand and quantify the hydrological cycle and related processes in the Mediterranean, with an emphasis on (i) high-impact weather events, (ii) interannual to decadal variability of the Mediterranean coupled system, and (iii) associated trends in the context of global change. Climatological features of precipitation at regional scale will be presented with an emphasis on the Mediterranean Sea, separating moderate rain (MR) and deep convection (DC) occurrences following Funatsu et al. [16]. Comparisons with the widely used HOAPS (Hamburg Ocean Atmosphere Parameters and Fluxes from Satellite Data) observational dataset with a spatial resolution of 0.5° × 0.5° latitude–longitude, and with the European Centre for Medium-Range Weather Forecasts (ECMWF) reanalysis interim (ERA-Interim; resolution of 0.75° × 0.75° latitude–longitude) will also be discussed in order to illustrate the advantages and shortcomings of AMSU-B products.
The paper is organized as follows. Section 2 describes microwave AMSU-B satellite observations and diagnostics used to detect precipitation and convection occurrences, and the other precipitation datasets considered in this paper. A general description of the monthly climatology of MR and DC occurrences is done in Section 3. Comparisons with other climatologies (HOAPS, ERA-Interim) at basin and regional scales are presented in Section 4. Finally, in Section 5, the results of the study are discussed and summarized.
2. Precipitation Products
2.1. AMSU-Based Precipitation and Convection Occurrence
Since this dataset has been described in details in a recent paper [17], we recall here only the most important points. This study mainly uses the AMSU-B sensor, which is a cross-scanning microwave instrument flying on board NOAA sun-synchronous polar-orbiting satellites since late 1998. AMSU-B has three channels (3 to 5) centered around the water vapor absorption line (183 GHz) and has 90 fields of views (FOVs) along a wide (~2300 km) swath. FOV of AMSU-B ranges between 16 km at nadir and 36 km for the largest viewing angles [18]. This sounder was initially designed for optimal moisture retrieval, but a number of studies have shown its utility for rainfall detection (e.g., [19,20]). More details can be found in the NOAA’s KLM User’s Guide (http://www2.ncdc.noaa.gov/docs/klm/). NOAA-15, 16, and 17 observations are considered in this study. The longest time series are provided by NOAA-15, which has been operational from January 1999 until July 2010. However, we do not use NOAA-15 observations after December 2007, due to scan asymmetry issues especially for channel 4 [21], which may affect deep convection determination (see below). We also dropped NOAA-16 measurement after December 2007 due to a residual uncorrected radio-frequency interference (in spite of initial corrections made by NOAA) and asymmetry problem [22].

Table 1.
Time intervals considered for the descending and ascending satellite passes for each platform (NOAA-15, 16 and 17) to cover the Mediterranean region (25°–60°N, 10°W–0°E).
| Dsc (UTC) | Asc (UTC) | |
|---|---|---|
| NOAA-15 | 02–09 | 12–19 |
| NOAA–16 | 22–05 | 08–15 |
| NOAA–17 | 06–13 | 16–23 |
AMSU-B channels 3, 4 and 5 (frequencies respectively: 183 ± 1, 183 ± 3 and 183 ± 7 GHz) can be used to detect precipitation and convection because cold precipitating clouds cause a depression in the emitted radiation due to scattering of icy particles [23]. Firstly, level-1c AMSU-B brightness temperature (BT) is re-sampled to a regular grid of 0.2° longitude × 0.2° latitude, using a weighting of 1/R2, where R is the distance of the measured point to the grid point [16]. Then satellite passes covering the Mediterranean region (25°–60°N, 10°W–50°E) are concatenated providing, for each satellite, twice daily (for ascending or descending branches) BT records. In case of overlapping areas (which occur mostly in the northern part of the area), we interpolate the brightness temperatures of the different orbits. Table 1 summarizes the time intervals considered for each platform (NOAA 15, 16, 17).
Following Funatsu et al. [16,24] and Hong et al. [25], MR is detected whenever the BT difference of channels 3 minus 5 (hereafter, B3m5) is equal or larger than −8 K; DC areas are detected whenever B3m5, B4m5 and B3m4 are simultaneously equal or larger than zero.
By comparing with TRMM 3B42, it was shown that with 70 to 80% of the cases whenever DC was detected, there was accumulated precipitation in TRMM [24]. In the case of MR, the threshold in B3m5 was determined so that it would detect accumulated rainfall greater than 0 compared to TRMM 3B42 product and, at the same time, minimize false positives. This approach was found to give a good qualitative agreement not only with TRMM 3B42 rain product, but also ground station data. In particular, comparison with independent radar and ground measurements (OHM-CV (Observatoire hydro-météorologique méditerranéen Cévennes-Vivarais [26]) and SQR (Séries Quotidiennes de Référence) were conducted for several heavy-precipitating events (for more details see [24]). A very good correspondence between areas with significant rainfall measured by ground stations and areas determined by our method was found. In addition, there was a minimal number of cases of false alarms. In addition, Funatsu et al. [24] have shown that, over the Mediterranean region, the MR and DC thresholds correspond in more than 50% of the cases to an accumulated rainfall of at least 10 mm/3 h and 20 mm/3 h respectively when compared to the TRMM 3B42 3-hourly accumulated precipitation.
These results were obtained for areas outside the Alps, the Pyrenees and the mountainous regions around the Black Sea, which were found to be problematic due to the high elevation and presence of snow. An additional constraint of upper-tropospheric humidity (UTH > 70%) has been therefore added to discriminate frozen hydrometeors from snow or ice on the ground. Following Buehler and John [27], UTH is computed from AMSU-B channel 3. Although this condition (UTH > 70%) results in a significant underestimation of precipitating events especially during wintertime, it restrains the false positive detection of precipitation [28]. In addition, in the presence of snowfall, scattering might be compensated by emission by cloud liquid water in the snowing clouds [29]. Estimating missing detection is more complicated because an independent source of precipitation measurement at the exact same time as of the AMSU measurement would be needed to perform a direct comparison. Funatsu et al. [24] have shown examples of detection of precipitation from AMSU-B compared to radar and ground-based data (see their Figure 9 and Figure 10). They found an overall good spatial match concerning the precipitation area, though there were some missing detection regions as well. The mismatch was explained to be a result of the different nature of these observations: while AMSU provides a near-instantaneous observation, the radar-derived and rain-gauge data provide an accumulated rainfall value. It could be that the precipitation accumulated in the “mismatch” area fell after the satellite passed.
Note that we mainly analyze the rain frequency, i.e., the percentage of rain observation at a given grid point. We do not determine a rain rate due to the rather weak correlation between scattering intensity and instantaneous rain rate at the surface (e.g., [30]) and saturation issues (e.g., [31]), which could lead to an underestimation of large rain rates associated with severe events, which are of special interest in the HyMeX project. However, we apply the retrieval algorithm for each sensor (ascendant and descendant passes) separately to record MR and DC occurrence twice daily, and then the average of both records gives one daily record.
2.2. HOAPS
Because of the lack of reliable in situ measurements, comparisons between satellite and in situ observations for oceanic precipitation are still limited—the strong spatial and temporal variabilities of precipitation add to these difficulties. One of the longest records of precipitation derived from SSM/I passive microwave radiometer observation over the area is provided by the HOAPS product (http://www.hoaps.zmaw.de/index.php). We use the latest release, HOAPS-3.2, which provides surface fluxes and related atmospheric variables (and among others, the rain rate) over the global ice-free ocean from July 1987 to December 2008 ([32,33]). This version uses an optimum interpolation gap filling and diurnal cycle corrections. HOAPS-3.2 datasets are available as monthly averages and six-hourly multi-satellite composite on a regular latitude/longitude grid with a spatial resolution of 0.5 × 0.5°. Andersson et al. [34] have performed a global assessment of HOAPS-3 (previous release) dataset.
Since our concern is the high temporal resolution to compute the rain frequency, we use the product HOAPS-C (six-hourly composites) from HOAPS-3.2. HOAPS-3.2 coverage after July 2006 is limited to only two satellites (DMSP F13 and F14; see: http://www.hoaps.zmaw.de/index.php), resulting in gaps over some parts of the studied area. We thus restrict the analysis to the period 1999–2005 to compare the results to NOAA-15. We therefore use the morning (0–6 UTC overpasses) and the evening (12–18 UTC overpasses) records from HOAPS-3.2 dataset, which are close to the NOAA-15 satellite time passes over the Mediterranean region (see Table 1). The daily fields of rain frequency are then computed in each grid-box for several thresholds (20, 30, 40, 50 and 60 mm/day) to be compared to the Mediterranean Sea climatology from NOAA-15.
2.3. ERA-Interim
The ERA-Interim dataset is the latest reanalysis dataset released by ECMWF (extensively described in [35]); it uses four-dimensional variational analysis and an improved processing of input observations, particularly satellite data. ERA-Interim dataset provides since 1989 global precipitation rate and convective rain rate every six hours on a regular grid with a horizontal resolution of 0.75° × 0.75° latitude–longitude. It is a six-hour cumulative rain from the forecast system which starts at 12:00 UTC the day before.
Cumulus convection is parameterized by a bulk mass-flux scheme which was originally described in Tiedtke [36]. The scheme considers deep, shallow and mid-level convection. Clouds are represented by a single pair of entraining/detraining plumes, which describes updraught and downdraught processes. For deep convection, the convective mass-flux is determined by assuming that Convective Available Potential Energy (CAPE) is adjusted towards zero over a specified timescale. For mid-level convection, the cloud base mass-flux is directly related to the large-scale vertical velocity. The intensity of shallow convection is estimated by assuming an equilibrium of moist static energy in the sub-cloud layer. The convection scheme provides tendencies of temperature, specific humidity and wind components ([37]; for more details see: www.ecmwf.int/research/ifsdocs/CY33r1/PHYSICS/IFSPart4.pdf).
For the comparison, we use eight years of precipitation data between 2000 and 2007 overlapped with the NOAA-15 dataset. To increase the temporal matching between ERA-Interim and NOAA-15 datasets, we use the morning (06 UTC) and the evening (18 UTC) records from ERA-Interim, which are close to NOAA-15 time passes in the Mediterranean region (see Table 1). We then produced the daily fields of rain and convective rain (assumed to correspond to DC) frequency for several thresholds too (20, 30, 40, 50 and 60 mm/day) to be compared to those from NOAA-15.
3. Rain and Deep Convection Occurrence Characteristics
3.1. Mean Annual Cycle
The mean annual cycle of MR and DC frequencies has been computed over the period 2002–2007 separately for land and sea (Figure 2) of the Mediterranean region (10°W–40E°/28°–50°N; sea area excluding the Atlantic Ocean and the Black Sea) and for the three platforms that carried AMSU-B at that time.
The Mediterranean Sea annual cycle of MR shows a distinct seasonal signal (Figure 2a) with maximum occurrence (~9‰) in autumn (SON) and minimum (~0.5‰) in summer (JJA). These features were also found by Mariotti et al. [6] and Dubois et al. [38] in terms of rain rate. However, we note a shift compared to Mariotti et al. [3,6] who show a maximum of precipitation between October to December using several coarse resolution datasets. An interesting feature is that both descending and ascending annual cycles follow broadly the same evolution in the Mediterranean Sea, thus indicating that, globally, the diurnal cycle over the sea is not very pronounced. The largest differences between morning and evening occurrences (Table 1) take place from September to February, and the smallest occur during May–August; overall, a slight difference remains all year long.
DC annual cycle over the Mediterranean Sea is rather similar to the MR one, but with smaller amplitude (Figure 2b). DC is more frequent over the Mediterranean Sea during autumn (~2 to 4‰ in September–November) than the rest of year (~in the range 0.5–1‰) in agreement with an independent study which mainly considers infrared satellite observations over a four-year period [39]. This is consistent with the DC signal migration from land to sea during summer and early autumn [28]. As for MR, it is during SON that the diurnal cycle is more important with DC more frequent in the early morning (descending-passes from NOAA-16 and NOAA-15 on Figure 2). It remains however weak compared to the land surfaces as shown in Figure 2 (lower panel). From May until October, over land, MR and DC occurrence is much larger in ascending than in descending time sampling. More specifically, the maximum occurrence is in the window 12–19 UTC. This corresponds well to the maximum of precipitating clouds found around 18 h (local time) over mountains of the Mediterranean region [40]. Precipitation occurrences, especially in terms of DC, do not show a strong difference between the three satellites from October until March. The decreased performance of the detection algorithm in the presence of snow and/or cold surface may partly explain this feature. However, it is worth noting that Zampieri et al. [41] found almost the same annual cycle of monthly mean precipitation climatology using the CRU dataset over the Alps region (see their Figure 5). For evening passes—for both MR and DC—two strong peaks are observed in June and August, and to a lesser extent a third one in February. Morning passes show different features for MR and DC: MR is at a minimum from April to August, while DC is at a minimum from November until April.
A broad agreement between the three platforms has been found, with most of the differences related to the time sampling and the diurnal cycle, which is significant especially over land during the warm season. We observed that, unlike over land, MR and DC show a consistent annual cycle over sea, with maximum frequencies in September–October and minimum ones in June–July in good agreement with the recent study of Melani et al. [39]. MR and DC are more frequent in the evening over land and in the morning over sea, although the diurnal cycle is smaller over sea.
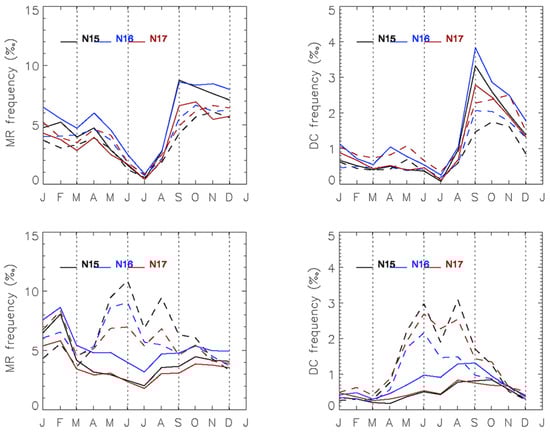
Figure 2.
Descending (solid) and ascending (dashed) annual cycle of (left column) moderate rain (MR) and (right column) deep convection (DC) frequency for the Mediterranean Sea (upper panel) and for land-only of the Mediterranean region (lower panel) based on NOAA-15 (black), NOAA-16 (blue) and NOAA-17 (red) observations over 2002–2007.
3.2. Interannual Variability
We now examine the interannual variability of MR and DC frequencies in the Mediterranean Sea from the monthly mean time series over January 2000–January 2010 (Figure 3). Both MR and DC evolution over the Mediterranean Sea exhibit a strong seasonal signal modulated by an interannual variability that are in line with analyses performed by Melani et al. [39] over the 2007–2010 period. For example, MR frequencies display amplitude values of 7–10‰, reaching more than 13‰ during autumn 2007 and 2009 (Figure 3a), while DC amplitude values range ~3‰ except during autumn in 2003, 2004, 2006, 2007 and 2009, when it reaches 4.2–5.5‰ (Figure 3b). The minimum DC values occur during summer 2003 and 2005 when the latter records the longest and driest summer.
High correlation values (correlation coefficients: 0.6–0.87) between all time series of both MR and DC indicate a good agreement between the three satellites observation in term of amplitude and variabilities. Some differences are still observed; for example, NOAA-16 shows slightly higher amplitude values of MR frequency along the studied period, while NOAA-17 exhibits slightly higher amplitude values of DC frequency from 2004 onward. This difference could be related to the sampling time [17].
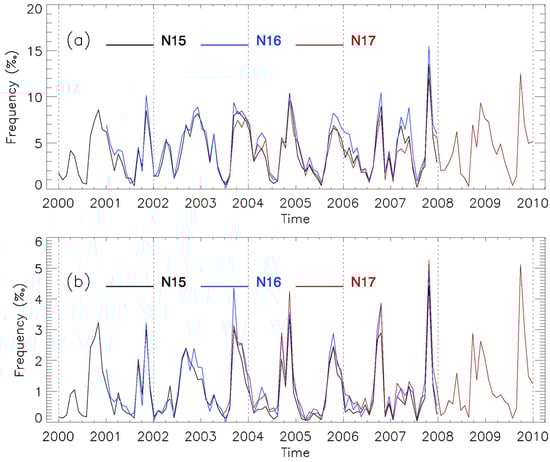
Figure 3.
Monthly mean of (a) MR and (b) DC frequency over the Mediterranean Sea based on NOAA-15 (black), NOAA-16 (blue) and NOAA-17 (red) observations.
3.3. Spatial Patterns of MR and DC Occurrence
Figure 4 shows the eight-year climatology of MR and DC observed by NOAA-15 over the Mediterranean region from January 2000 through December 2007. Both MR and DC patterns show a complex structure constrained by the orography and topography of the Mediterranean region (Figure 4a,c). The MR frequency shows a distinct latitudinal gradient pattern in agreement with previous studies [6,7,17,28,42,43]. Northern regions show precipitation frequency values of >6‰ except the center of the Iberian Peninsula and northwestern France. The driest area is found in the southeastern part of the studied domain with frequency values below 1‰ (northeast Africa and southeastern Mediterranean), in agreement with previous studies mentioned above and other precipitation products such as the GPCP (Global Precipitation Climatology Project) [42] and TRMM [44]. Maximum precipitation occurrence is found over the Alps and the Atlas Mountains with a frequency of >15‰ [41]. The dominant feature is that frequencies of ~10–15‰ form an arch which starts in the Pyrenees and stretches along the Balkan and the Carpathians relieves, only interrupted by low frequencies in the Rhone valley. The high MR frequencies in the Anatolian region could be related to the low-pressure systems’ path during summer and autumn [45,46]. Indeed, the Taurus and Atlas regions are characterized by an MR frequency larger than 7‰, related to the orography of the area.
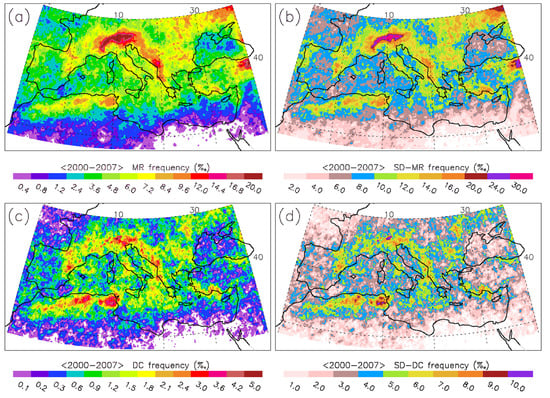
Figure 4.
NOAA-15 climatologies: (left) mean state and (right) interannual variability computed as standard deviation of the monthly means over the period 2000–2007. (a,b) MR frequencies (‰), and (c,d) DC frequencies (‰).
The Mediterranean Sea displays minimum MR occurrences of ~0.4‰ in the southeastern Alboran Sea and southeastern Levantine sub-basin; there are maximum MR occurrences of >7.2‰ in the Gulf of Lions, the northern Ionian sub-basin and the Adriatic Sea. Although the western Mediterranean basin exhibits nearly homogeneous MR frequencies, the central and the eastern Mediterranean basins record a strong southward gradient, from ~8‰ along the Balkan coasts to ~0.4‰ along the Libyan and Egyptian coasts. This could be related to the impact of Atlas Mountains on the local climate and likely related to low-pressure system paths [47,48,49].
The overall pattern of the DC distribution correlates well with that of MR, hence DC is more frequent over the northern regions and the Atlas Mountains than the southeastern regions (Figure 4c). The highest DC frequencies (>4‰) occur over the Alps. DC frequencies higher than 3.5‰ are found over the Tunisian region. The minimum DC frequencies (<0.2‰) are recorded over the Gulf of Biscay, Black Sea and the southeastern regions of the studied area. Over 1.5‰ are found in the surrounding areas of the western Mediterranean basin and the Adriatic Sea (Pyrenees, Alps, Balkan, Carpathians and Atlas Mountains). Similarly to the MR frequency pattern, DC is more frequent over the northern–central Mediterranean than the western and eastern Mediterranean basins. The Alboran and southern Levantine sub-basins exhibit the lowest (frequency below 0.2‰) DC precipitating systems in the Mediterranean Sea.
The MR and DC variability in terms of geographical distribution and amplitude are represented by the standard deviation (SD) of the monthly mean time series (96 months; 2000–2007; annual cycle included) at each grid point and shown in Figure 4b,d. SD values are relatively high compared to the mean frequency, particularly for low frequencies (compare Figure 4a with Figure 4b); this may be explained by the strong seasonal variability in the Mediterranean Sea. The most pronounced pattern is the SD values (>12‰ for MR and >6‰ for DC) over the Pyrenees, Alpines, Balkan, Carpathians and Atlas Mountains. The minimum values of the SD, below 4‰ for MR and 2‰ for DC, appear in the center of Iberian Peninsula, southeastern Alboran Sea, southeastern Mediterranean Sea and northern Africa, but they are still larger than the mean frequency there, highlighting occasional precipitation in those areas. The greatest variability in the Mediterranean Sea occurs in the southern Adriatic Sea, the northern Ionian sub-basin and around Sicily Channel, near the Balearic Islands and the Gulf of Lions, and along the Aegean coasts and the northern Levantine coasts, in good agreement with the GPCPv2 climatology variability [7]. These areas coincide with the spatial density distribution of intense low-pressure systems and medicanes from MEDEX (MEDiterranean EXperiment on cyclones that produce high impact weather in the Mediterranean) observations [50].
3.4. Monthly Mean Spatial Patterns of MR and DC Occurrences
Figure 5 shows the spatial distribution of the monthly mean climatology of MR frequency averaged over the period January 2000 through December 2007 from NOAA-15 in the Mediterranean area (28°N–50°N; 10°W–40°E). The distinct latitudinal gradient pattern of the MR frequency is still observed from May until September in contrast to previous studies [43] (for an example, see Figure 3a–c,k–l). The highest frequency (>20‰) of precipitation occurs over the Alps and Balkan Mountains from November until March, over Taurus Mountains during January–February and over Tunisia and Atlas Mountains during May–September. Most of northern Africa and the eastern Mediterranean basin are the driest regions during summertime (June–September), in good agreement with TRMM observations [43,44]. These regions are characterized by a minimum MR frequencies (<1‰) during wintertime.
From May to August, MR occurrence spreads over the whole European continent, displaying frequencies values of 9–18‰. The MR signal moves southward over the western Mediterranean basin during September–October and towards the eastern Mediterranean basin from October to December. Southeastward propagation of the MR signal—which seems to be linked to DC seasonal migration (see Figure 4)—has already been mentioned by several authors ([6,28,40,43], among others). The effect of the orography—modulated by the seasonal cycle—is clearly seen on the MR maps where the highest MR frequencies are tightly locked to the mountainous areas (ex: maximum/minimum frequency over the Alps in winter/autumn and over the Atlas in summer/winter respectively).
The MR is more frequent in the Mediterranean Sea in September to December, as also found with TRMM observations [44], and less frequent from January until August in agreement with the studies of Xoplaki et al. [51] and Mehta and Yong [43]. The western Mediterranean basin displays maximum MR frequencies of >10‰ during September–October, when the minimum MR frequency (<0.5‰) is recorded in July. One can observe a maximum of MR frequency of ~15–18‰ near the Balearic Islands and northern Gulf of Lions in September. Precipitation is more frequent (~10‰) over the Adriatic Sea from August until October. The Ionian sub-basin shows a strong seasonal variability with maximum frequencies in October–December and minimum frequency in July–August. The highest MR occurrence over the Aegean Sea is recorded during November–December. The Levantine sub-basin persists dry the year round except during November–January a sporadic precipitation occurs along the Anatolian coasts.
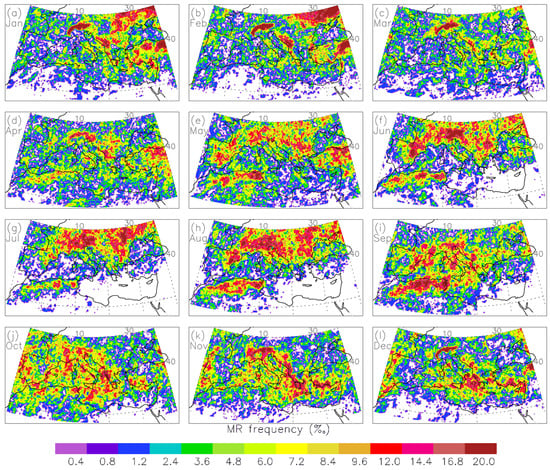
Figure 5.
Spatial distribution of monthly climatology of MR frequency over the Mediterranean region from January 2000 throughDecember 2007 from NOAA-15 satellite.
Figure 6 shows the spatial distribution of the monthly climatology of DC frequency averaged over the period January 2000–December 2007 in the Mediterranean area from NOAA-15. Note that for a better visualization, we smoothed the DC fields by running average window of 2 × 2 grid points.
Except for wintertime (December–March), DC occurrence follows almost the same geographical distribution pattern as MR occurrence but with lower values. Particularly, high DC frequencies (>3–7‰) are recorded around the lees of the Pyrenees, the Alps, the Balkans, the Carpathians and the Atlas Mountains in summertime (July–August) and over the Anatolian region in October–November. This reflects the important role of these instances of relief on the convective precipitation systems. The maximum DC frequencies are found over the Atlas Mountains (>7‰) in summer (July–September) and the minimum DC frequencies are observed over the continent in wintertime (December until March). The southward propagation of DC signal from land to sea during August–September and eastward propagation of precipitation over the Mediterranean Sea during October–November are depicted on Figure 6 in accordance with the analysis of Mehta and Yang [43], Funatsu et al. [28] and Melani et al. [39]. DC distribution shows frequency values over the Mediterranean Sea higher than those of the surrounding continents from October until February. An interesting feature is that the DC is lagged by one month over the western Mediterranean basin, the Ionian sub-basin and the Levantine sub-basin, which can be explained by the eastward propagation of DC precipitation. The seasonal variability of DC signal over land is stronger than over sea, which is consistent with the small SD values over sea (Figure 4d).
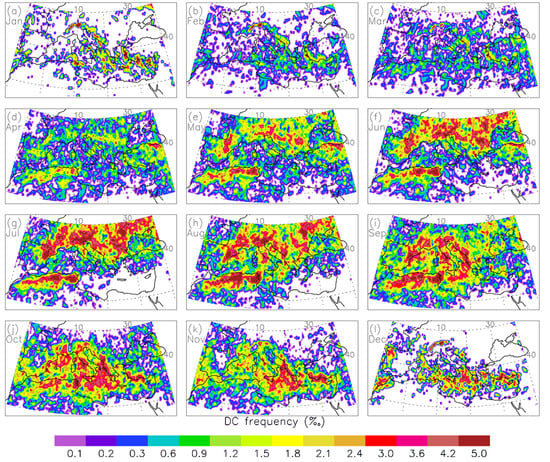
Figure 6.
Spatial distribution of monthly climatology of DC frequency over the Mediterranean region from January 2000 through December 2007 from NOAA-15 satellite.
3.5. Annual Cycle of Zonally and Meridionally Averaged Precipitation Occurrence
The variations of MR and DC occurrence over the Mediterranean region are investigated as function of latitude and longitude (Figure 7). Latitude–time distribution of the MR frequency averaged between 10°W and 40°E over the period January 2000–December 2007 is shown on Figure 7a. The predominant feature is the maximum of MR events in winter (JFM) and summer (JJA) around 45–50°N, likely related to the precipitation at mid-latitudes associated with the orography of the region (Alps, Pyrenees, etc.). The minimum of MR frequencies is observed below 31°N almost year-round; in addition, this dry signal extends north until 35–39°N during summer (JJA), associated to the low precipitation over the African continent and the eastern Mediterranean basin. Figure 7a shows that the high MR frequency signal shifts northward starting at ~35°N from March to June, and then it moves from 50°N to 30°N during July to December. This indicates the latitudinal and seasonal propagation of the occurrence of precipitating systems. These features are consistent with the Meteosat-IR observations of Levizzani et al. [40] and the TRMM observations of Mehta and Yang [43].
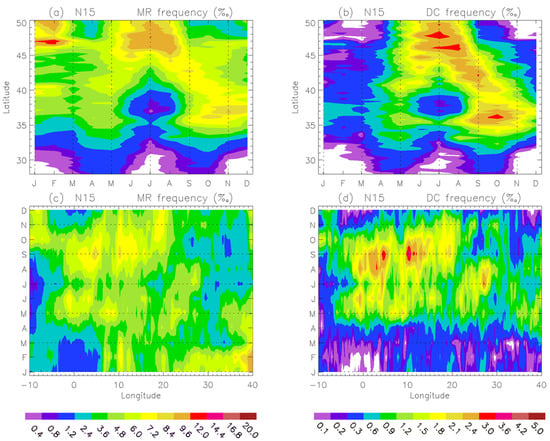
Figure 7.
Latitude time sections (a,b) and time longitude (c,d) of MR (left column) and DC (right column) frequencies over the Mediterranean region based on NOAA-15 observations, 2000–2007.
Longitude–time distribution of MR frequencies averaged between 28° and 50°N over the period January 2000–December 2007 are displayed in Figure 7c. MR is more frequent in the central part (5°–20°E) of the Mediterranean region during September–December with maximum of frequency of >7‰ linked to the precipitation over the western Mediterranean basin and the Atlas Mountains (see Figure 4). However, eastward propagation of MR frequency is evident from September through December in good agreement with previous works [28,39,40,43]. Latitude time and longitude time distributions of DC frequencies (Figure 7b,d) show almost the same patterns as the MR one. DC patterns indicate that more convective events occur during summer–autumn than during wintertime over almost the whole domain, except the southern parts of the eastern Mediterranean basin in summer. In terms of signal propagation, we again find the southward and slightly eastward propagations similar to the MR ones.
4. Comparison with HOAPS and ERA-Interim
4.1. HOAPS
4.1.1. Spatial Variability and Precipitation Occurrence
In this section, we compare our results to those derived from HOAPS-3.2 (hereinafter HOAPS) over the period 1999–2005. It is noteworthy that we take into account NOAA-15 measurements also in 1999 (as mentioned earlier) to increase the length of the common period between both datasets, even though they are less reliable than after 2000 due to remaining scan asymmetries problems with respect to the angle of view [27].
Figure 8a displays the HOAPS climatology of rain rate frequency for a threshold of 30 mm/day over the period 1999–2005 in the Mediterranean Sea. We chose the threshold of 30 mm/day because it is the one that compares better with NOAA-15 observations. Since HOAPS measurements are limited to the open maritime areas, observations over some key areas (i.e., Adriatic and Aegean seas and coastal areas) are missing, compared to NOAA-15 coverage (see Figure 4a). HOAPS maps appear smoother than AMSU-B ones due to the spatial resolution of HOAPS product (0.5° × 0.5°) relative to AMSU-B (0.2° × 0.2°).
The spatial distribution of HOAPS rain frequency exhibits a zonal pattern with maximum occurrences (>9‰) in the northwestern parts (off Gulf of Lions, northern Ionian sub-basin) and minimum occurrences (<1.5‰) in the southeastern ones of the Mediterranean Sea (southern Ionian and Levantine sub-basins). These values are consistent with those retrieved from NOAA-15 and with the patterns reported by Romanou et al. [52] from the monthly mean product of HOAPS-3.0 averaged over a longer period (1988–2005). The largest interannual variability of the precipitation occurrence estimated from the standard deviation (>16‰) takes place in the northern Ionian sub-basin and off Gulf of Lions, and the smallest one (<4‰) in the southern Ionian and southeastern Levantine sub-basins (Figure 8b) again in good agreement with NOAA-15 observation (see Figure 4b) and analyses performed by Romanou et al. [52].
Some differences between HOAPS and AMSU-B rain occurrences can be observed for example, in the center of the western Mediterranean basin (between Balearic and Sardinia Islands), and the mesoscale details of the low occurrence values in the southern Ionian sub-basin. However, the AMSU dataset provides finer scale details and better coverage, particularly in the coastal area where it allows a continuous sea-land screening of the whole Mediterranean region. In spite of the collocation of the maximum SD patterns in both climatologies (HOAPS and AMSU) off Gulf of Lions, NOAA-15 shows almost a uniform structure in the western Mediterranean basin with weaker interannual variability relative to the HOAPS one (compare Figure 4b and Figure 8b).
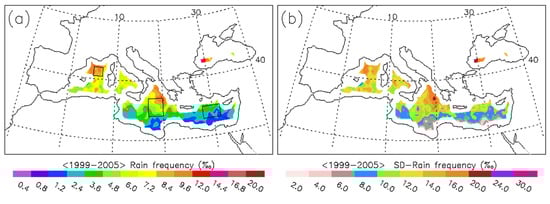
Figure 8.
(a) HOAPS-3.2 rain-frequency climatology (‰) and (b) interannual variability computed as standard deviation (‰) of the monthly means over the period 1999–2005 for a threshold of 30 mm/day.
4.1.2. Basin Scale Precipitation Occurrence
The monthly mean annual cycle of MR occurrence from NOAA-15 and rain occurrence from HOAPS in the Mediterranean Sea over the period 1999–2005 are depicted on Figure 9. In order to examine the sensitivity of our analysis to the choice of thresholds the rain occurrence from HOAPS has been determined for several rain-rate thresholds (30, 40, and 50 mm/day). To avoid the spatial resolution dependency in the averaged area, we normalized the rain frequency from HOAPS by the number of measured grid-boxes (where rain occurrence >0) and MR occurrence from AMSU-B by the number of measured grid points (when detected MR frequency >0).
The annual cycle of the MR frequencies from NOAA-15 over the Mediterranean Sea (Figure 9a; UTH > 70%) shows a clear seasonal cycle with maximum MR frequency (~7‰) in November and a secondary peak (~4.5‰) in April. The minimum MR frequency (~1‰) occurs during July and a secondary minimum (~2‰) in March. The annual cycle of the MR/rain frequencies from both datasets AMSU-B/HOAPS shows a striking similar behavior (for example: correlation coefficient = 0.82 between MR frequency and HOAPS rain frequency for a threshold of 50 mm/day). While two maxima are found on November and April, two minima are seen on July and March. MR frequency from AMSU-B is slightly higher than those of HOAPS during summertime (JJA), but there are fewer occurrences than in HOAPS during wintertime (JFM). This could be related to: (i) continuous (less intermittent) heavy precipitation during the sampling time; (ii) the fact that the lower frequencies (HOAPS: around 89 GHz) are more sensitive to the full atmospheric column, including the rain emission in the liquid phase, even when the rain is not associated to a large frozen phase, as rain occurrences that are missed by the high frequencies are more likely to be captured by the low frequencies; and (iii) the UTH constraint thresholds used in our method during this season. To test this hypothesis, we computed the MR occurrence from NOAA-15 for three UTH constraint thresholds (>70%, >50% and >30%). The method shows indeed high sensitivity of MR occurrence retrieval from NOAA-15 to UTH thresholds conditions in winter (Figure 9a). For example, except for December and January, the MR occurrence from NOAA-15 for UTH > 30% exhibits quite higher values than rain occurrence from HOAPS for rain-rate threshold of 30 mm/day. The rain-frequency cycle from HOAPS is more sensitive to rain-rate threshold values in wintertime than in summertime and exhibits a distinct seasonal variability, whatever the threshold value.
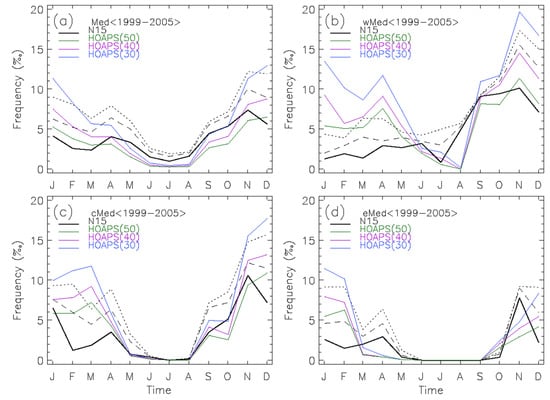
Figure 9.
Monthly mean annual cycle averaged over the period 1999–2005 of NOAA-15 MR frequency for different thresholds of UTH (<70%, <50%, and <30%; thick-solid, dashed and dotted black, respectively), and HOAPS-3.2 rain frequency (thin-solid) for different thresholds (30, 40 and 50 mm/day; blue, purple, and green, respectively) in (a) Mediterranean Sea (Med), (b) wMed, (c) cMed and (d) eMed (see Figure 8 for the regions location).
4.1.3. Regional Scale Precipitation Occurrence
In order to go further into details in the comparison between NOAA-15 and HOAPS datasets, we investigate in both datasets the temporal variability in three target regions (see Figure 8). The first box is located in the western Mediterranean basin (indicated by wMed; 40.5–42.0°N, 5.0–7.0°E), the second one is located in the northern Ionian basin (indicated by cMed as central Mediterranean; 36.5–38.5°N: 18.0–20.0°E), and the third one is located in the Levantine basin (indicated by eMed as eastern Mediterranean; 33.0–35.0°N, 28.0–31.5°E). The three annual cycles are shown on Figure 9b–d and exhibit a quite similar global behavior as the whole basin one (Figure 9a) with maximum precipitation in autumn and minimum in summertime. In spite of this similarity, there are differences within the individual variation in each region. The largest amplitude of the seasonal variability occurs in wMed and cMed and the smallest one in eMed, which is consistent with SD analysis above (Figure 4 and Figure 8). Although the eastward propagation of rainfall signal is captured on the climatological annual cycle from NOAA-15, it is not the case (less clear) for HOAPS. For example, the rainfall occurrence from NOAA-15 (HOAPS) starts to increase in July (August) in wMed, in August (August) in cMed and in October (September) in eMed. The dry season becomes longer from wMed to eMed in both databases in good agreement with analyses of Romanou et al. [52] in terms of rain rate. Note that the rain-frequency annual cycle exhibits the same behavior for all thresholds, with higher amplitude (more occurrences) for 30 and 40 mm/day. This suggests that, according to HOAPS, weak rain is more frequent than heavy rain during autumn–springtime. Besides, except for the wMed, the MR occurrence from NOAA-15 with threshold-UTH > 30% reaches higher amplitudes than rain occurrence from HOAPS with a rain-rate threshold of 30 mm/day.
4.2. ERA-Interim
4.2.1. Spatial Variability and Precipitation Occurrence
Since reanalyses provide a complete coverage of the whole studied area, and are widely used, in particular for forcing oceanic models, it is interesting to compare them to our results. Geographical distribution of frequency climatologies (threshold of 30 mm/day) of rain and convective precipitation from ERA-Interim reanalysis over the period January 2000–December 2007 in the Mediterranean region are presented in Figure 10a,c. We use again a threshold of 30 mm/day, as done in the previous subsection for HOAPS, because it is the one that compares better with NOAA-15 observations. ERA-Interim rain frequency shows a fair similarity with MR frequency from NOAA-15 in terms of geographical distribution pattern (Figure 4a and Figure 10a). Yet, NOAA-15 climatology provides more details due to its high spatial resolution (~0.2° latitude) relative to ERA-Interim (0.75° latitude).
The well-known latitudinal gradient pattern of the mean rain frequency in the Mediterranean region is captured by the reanalysis, as does NOAA-15. The local maxima of rain frequency (8–20‰) occur over the northwestern regions and are closely tied to orography: for instance, more than 15‰ of rainfall is recorded over the Alps and is spreading (>8‰) toward the Dinaric Alps and the Pyrenees. Other localized maxima (>10‰) are found along the Portuguese coasts and over the Taurus Mountains. The minima of rain frequency (<1.5‰) occur in the southern regions below 35°N and in the eastern Mediterranean basin in good agreement with MR frequency distribution from NOAA-15. However, some dissimilarity between both datasets is observed: for example, the precipitation frequency of <5‰ over the Portugal coast in NOAA-15 coincides with high rain frequency >10‰ in ERA-Interim. Also, the MR over the Atlas Mountains is very frequent in NOAA-15 (>10‰) and contrasts with the low rain frequency <7‰ in ERA-Interim reanalysis. The western Mediterranean basin exhibits higher rain frequency (<2.5‰) than the central and eastern basins (<1‰), in contrast with HOAPS observations, though NOAA-15 results are consistent with the results of Romanou et al. [52] in terms of rain rate.
Since the ERA-Interim dataset provides also convective precipitation estimates (hereinafter DC), they are analyzed and the derived DC frequency fields are compared to the DC fields from NOAA-15. The spatial distribution of DC occurrence from ERA-Interim (Figure 10c) exhibits a complex pattern. Although the latitudinal gradient is barely observed, the maxima over the Alps, the Balkan Mountains, northern Ionian, Adriatic Sea and the Anatolian coasts and the minima over the northern African and eastern Mediterranean regions are well collocated with NOAA-15 results, but with lower amplitude (Figure 4c and Figure 10c). The most significant discrepancies occur in the Atlas Mountains and the western Mediterranean basin (off Gulf of Lions) when the DC frequency field from ERA-Interim displays very low amplitude (<0.5‰) relative to DC frequency from NOAA-15 field (>1.5‰).
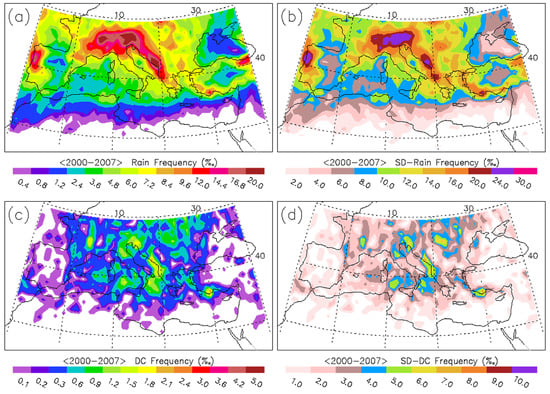
Figure 10.
ERA-Interim climatologies (left) mean state and (right) interannual variability computed as standard deviation of the monthly means over the period 2000–2007 for a threshold of 30 mm/day. (a,b) rain frequency (‰) and (c,d) convective rain frequency (‰).
The monthly mean standard deviation of rain and DC frequencies has been computed at each grid point over the period January 2000–December 2007 from ERA-Interim (Figure 10b,d). The monthly mean standard deviation of rain frequency from ERA-Interim shows almost the same distribution as the rain frequency one from NOAA-15 with low values in northern Africa which tend to increase northward (Figure 10a,b). Local maxima of variability are found in the Alps, the Balkan Mountains and Anatolian and Portugal coastal areas. Although the Mediterranean Sea exhibits low variability, the Ionian sub-basin, the Adriatic and Aegean Seas show a slightly stronger variability than the western Mediterranean basin and the Levantine sub-basin, in agreement with HOAPS observations, albeit with much lower amplitude (cf. Figure 8). The low variability in the eastern Mediterranean basin associated to low rain occurrence suggests a persistent year-round dry area in ERA-Interim. The DC variability (Figure 10d) shows a quite different distribution than the total precipitation one. Although DC from NOAA-15 displays more fine-scale features, DC frequency from ERA-Interim shows weaker variation particularly in the north Ionian sub-basin and Aegean Sea. Nevertheless, large/small SD values are closely associated to high/low frequencies, respectively.
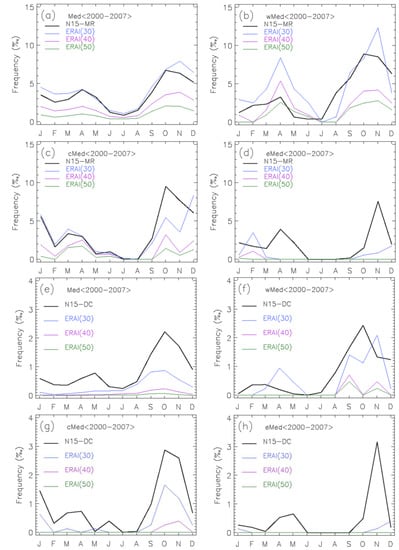
Figure 11.
Monthly mean annual cycle averaged over the period 2000–2007 in (a) Mediterranean sea (Med), (b) wMed, (c) cMed and (d) eMed of NOAA-15 MR frequency (thick-solid black), and ERA-Interim reanalysis rain frequency (thin-solid) for different thresholds (30, 40 and 50 mm/day; blue, purple, and green respectively) and in (e) Mediterranean sea (Med), (f) wMed, (g) cMed and (h) eMed of NOAA-15 DC frequency (thick-solid black), and ERA-Interim reanalysis DC frequency (thin-solid) for different thresholds (30, 40 and 50 mm/day; blue, purple, and green respectively). See Figure 8 for the regions location.
4.2.2. Basin Scale Precipitation Occurrence
Similarly to HOAPS analysis, we have computed the rain occurrence from ERA-Interim for several thresholds (30, 40 and 50 mm/day) and superimposed them on the monthly mean annual cycle of MR occurrence from NOAA-15 in the Mediterranean Sea over the period January 2000–December 2007 (Figure 11a). In this section, we will not describe in details the annual cycle characteristics, but we just stress the similarities and differences between the datasets.
While the annual cycle of the MR frequency from NOAA-15 shows a maximum in October and a minimum in July, rain frequency from ERA-Interim (for threshold of 30 mm/day) shows a similar annual cycle (correlation coefficient > 0.9) with a shifted maximum towards November. The annual cycle of rain frequency from ERA-Interim is sensitive to the chosen threshold values: for example, it shows a stronger seasonality for low thresholds (30 mm/day) than for high thresholds (50 mm/day), in contrast with HOAPS observations. This sensitivity indicates that heavy rain is much less frequent in ERA-Interim than low or moderate rain. It must be noted that the annual cycle of rain rate from ERA-Interim (not shown) exhibits a maximum in winter (DJF) and a minimum in summer (JJA). This suggests more frequent precipitation in October–November than in December–January, but with lower rain rates in ERA-Interim.
The annual cycles of DC frequencies from both datasets in the Mediterranean Sea are depicted in Figure 11e. The DC frequency from ERA-Interim over the entire Mediterranean Sea shows a low seasonal signal with the maxima in autumn and minima in spring and summertime. The annual cycle of DC frequency from ERA-Interim shows weak seasonality and a different behavior than the annual cycle of DC frequency from NOAA-15; it also exhibits systematically lower occurrence values and amplitude than those of NOAA-15. Nevertheless, both datasets confirm that convective precipitation is more frequent in autumn over the Mediterranean Sea (Section 3.4).
4.2.3. Regional Scale Precipitation Occurrence
In this section, the comparison between NOAA-15 and ERA-Interim datasets is performed in the three previous targeted regions (wMed, cMed and eMed; see Figure 8 and Section 4.1.3). Figure 11b–d shows the annual cycle of frequencies from both datasets. Both AMSU-B and ERA-Interim show distinct annual cycles with maxima in late autumn to early winter and minima during summer in all regions. Maxima values tend to decrease from wMed toward eMed. The largest difference between NOAA-15 and ERA-Interim rain frequency appears during the first half of the year, particularly the peaks in March–April in wMed when NOAA-15 shows less MR occurrence (Figure 11b), and in eMed when the peak is shifted two months later (Figure 11d). Except for springtime in wMed, NOAA-15 exhibits comparable and higher occurrences than ERA-Interim (for rain-rate threshold 30 mm/day) in contrast to HOAPS. ERA-Interim rain frequencies in eMed are very low year-round associated to very low precipitation (<1 mm/day; not shown). Some of these differences probably pertain to the methodology, but this seems to indicate that there is also a relationship to the nature of the rain event (both in terms of quantity and intermittency). In particular, it remains unclear why the differences HOAPS/AMSU are larger in April for wMed, in March for cMed, and in February for eMed. As noted in other studies (e.g., [53]), there is a need for caution when assessing the performance of rain products.
Similarly, DC from ERA-Interim is analyzed over the three regions (wMed, cMed and eMed) and is compared to DC from NOAA-15 (Figure 11f–h). Except for wMed in springtime, the annual cycle of DC frequency from NOAA-15 displays higher occurrence values than that from ERA-Interim. While the annual cycle from NOAA-15 shows almost the same behavior in the three regions, ERA-Interim annual cycle exhibits different shapes for each region. For example: in wMed, ERA-Interim displays two sharp maxima in September and November, while NOAA-15 exhibits a maximum in October only. DC frequency from NOAA-15 shows secondary peaks during March–May in the three regions, missed by ERA-Interim. Besides, DC frequency starts increasing in July (August) over wMed, in August (September) and September (October) for cMed and eMed respectively for NOAA-15 (ERA-Interim), thereby suggesting the eastward propagation of DC signal as shown above (Section 3.5).
5. Discussion
The present study is based on the AMSU-B sensors on board NOAA satellites which permits since 1999 a concomitant observation of convection/precipitation over land and sea with a spatial resolution of 0.2° latitude × 0.2° longitude. More specifically, the diagnostics rely on brightness temperatures measured by channels 3 to 5 of the AMSU-B in the water vapor absorption line (183 GHz). The methodology to detect MR and DC from brightness temperatures has been validated for surfaces free of snow and ice by comparing diagnostics to rain gauges, radar and satellite (TRMM) measurements. Over snow-covered and very cold surfaces, improvements are still underway, since the discrimination between frozen hydrometeors and the surface is not easy; MR and DC occurrence over these areas is very likely underestimated, but false detection is restrained by a threshold on relative humidity.
The zonal propagation of MR and DC occurrence is to be expected in the region dominated by the westerly wind system, while the meridional propagation could be related to disturbances coming from midlatitudes. The seasonal cycle of MR and DC is very distinct over sea and over land. A broad agreement between the three platforms has been found, with most of the differences related to the sampling time and the diurnal cycle, which is significant especially over land during the warm season. Regions with large occurrences of MR and DC such as the Adriatic Sea and the northern Ionian sub-basin are known for strong cyclone activity resulting from complex interactions involving atmospheric dynamics, orography, and land–sea temperature gradients [54].
The comparison of MR from HOAPS and NOAA-15 datasets is restricted to maritime areas away from the coasts (due to its coarser spatial resolution of 0.5° × 0.5°). Also, morning and evening HOAPS instantaneous products (00–06 UTC and 12–18 UTC overpasses) do not cover exactly the same time window as those covered by NOAA-15/AMSU-B (02–09 UTC and 12–19 UTC). In the case of ERA-Interim, the spatial resolution is of 0.75° × 0.75°, and in addition to total precipitation, convective precipitation has also been considered for comparisons to MR and DC from AMSU-B. Finally, besides large-scale comparisons, three boxes, located in the western, central and eastern parts of the Mediterranean Sea, have been considered. In spite of the aforementioned limitations of the comparison, the three climatologies are in good agreement in terms of large-scale structures. For example, the eastward propagation of rainfall signal is captured on the three climatological annual cycles (AMSU-B, HOAPS and ERA-Interim) with rainfall occurrence starting to increase in July–August in wMed, in August–September in cMed and in October–November in eMed; also the dry season becomes longer from wMed to eMed. Both HOAPS and ERA-Interim exhibit large rain occurrence in the northern Ionian sub-basin and the Gulf of Lions, while the smallest occurrences are recorded in the Levantine sub-basin in good agreement with AMSU-B. Both ERA-Interim and AMSU-B agree on the largest occurrence of DC in the Adriatic Sea, the Tyrrhenian basin and the northern Ionian basin. Nevertheless, more details could be seen on AMSU-B results due to its higher spatial resolution. HOAPS and ERA-Interim also capture the annual cycle of MR and DC when available. Concerning HOAPS, the differences during summertime (precipitation less frequent than for AMSU-B) suggest an increased sensitivity to precipitation of channels sounding around 183 GHz, compared to those sounding around 89 GHz (SSM/I). The temporal sampling of HOAPS and NOAA-15 very certainly contribute to the seasonal differences. For winter, we have also shown that the application of UTH thresholds in the detection of precipitation occurrence in AMSU-B leads to the underestimation of MR frequency. In addition, the fact that lower frequencies (HOAPS) are more sensitive to the full atmospheric column—including the rain emission in the liquid phase, even when the rain is not associated to a large frozen phase—may have also contributed to the differences.
6. Conclusion
The purpose of this article is to analyze at a rather high spatial resolution moderate precipitation and convection occurrence over the Mediterranean Basin, with an emphasis on the sea part, where it remains not well known (see e.g., [3,7]).
The spatial distribution of MR and DC occurrence from AMSU-B from NOAA-15, 16 and 17 during the last decade at a monthly scale has been analyzed. A southward propagation of MR and DC occurrence from land to sea during August–September, together with an eastward propagation over the sea during October–November appear clearly. Areas with frequent MR and DC occurrence generally coincide with low-pressure systems distribution, and also show a strong link to the orography over land. MR and DC show, unlike over land, a consistent annual cycle over sea, with maximum frequencies in September–October and minimum ones in June–July. MR and DC are more frequent over land in the evening and over sea in the morning, although the difference is smaller over sea. The regions that exhibit the largest occurrence of the MR are the Adriatic Sea, the northern Ionian sub-basin and the Gulf of Lions, while the Levantine sub-basin shows the fewest occurrences in AMSU-B. The largest occurrence of DC is found in the Adriatic Sea, the Tyrrhenian sub-basin and the northern Ionian basin, while the eastern Alboran Sea and the Levantine basin indicate the lowest DC occurrence in AMSU-B. MR and DC occurrences show a strong interannual variability along the northern coasts of the Mediterranean Sea, while the sea (except cMed) shows low variability.
In a second part, MR and DC occurrences derived from AMSU-B from NOAA-15 have been compared to similar products from two widely used precipitation climatologies: HOAPS and ERA-Interim. The global mean distribution of rain and convection occurrence is in good agreement in the three climatologies (AMSU-B, HOAPS and ERA-Interim) in terms of large-scale structures. Advantages of an increased spatial resolution of AMSU-B appear clearly with specifically more details for coastal regions, such as the Sicilian coasts, the Gulf of Lions area and the Anatolian coasts. Different thresholds for the calculation of MR and DC occurrence suggest that MR is more frequent in HOAPS during winter, and DC is almost absent in ERA-Interim. The temporal mismatch of the HOAPS morning and evening passes and NOAA-15 ones, as well as the intermittency of precipitation, very certainly contribute to the differences in all seasons.
In spite of the failure of AMSU-B/MHS in some NOAA platforms, the recent/upcoming launch of two MHS-carrying Metop satellites in 2012/2016 will contribute to the continuity of the AMSU data. In this context, we hope that, besides a better monitoring and characterization of precipitation/convection patterns at regional scales, the determination of trends, if any, will be possible. This is a key issue in a region that is considered as one of the most responsive to climate change.
Acknowledgments
This study was funded by the Chaire de Développement Durable of the Ecole Polytechnique-EDF and was partly sponsored by the Centre National de la Recherche Scientifique (CNRS), the Centre National d’Etudes Spatiales (CNES), the Direction Générale de l'Armement (DGA) at ENSTA-ParisTech within the ReaMed project, and by the Groupe Mission Mercator Coriolis (GMMC) within the SiMED project. AMSU data was obtained from the French Mixed Service Unit ICARE, HOAPS-3.2 data from www.hoaps.zmaw.de/index.php, and ERA-Interim from ECMWF http://www.ecmwf.int via CLIMSERV-IPSL http://climserv.ipsl.polytechnique.fr. We thank the three anonymous reviewers for their constructive criticisms on the previous version of the manuscript.
Author Contributions
Led design of the study and writing of the manuscript (Bahjat Alhammoud and Chantal Claud), processing of the AMSU-B datasets (Bahjat Alhammoud and Beatriz M. Funatsu) and assembly of the HOAPS and ERA-Interim datasets (Bahjat Alhammoud). All authors contributed to the overall data analysis, discussion of the results and their implications, as well as commenting on the manuscript. All authors have seen and approved the final version of the manuscript.
Conflicts of Interest
The authors declare no conflict of interest.
References and Notes
- Giorgi, F. Climate change hot-spots. Geophys. Res. Lett. 2006. [Google Scholar] [CrossRef]
- Hulme, M.; Barrow, E.M.; Arnell, N.W.; Harrison, P.A.; Johns, T.C.; Downing, T.E. Relative impacts of human-induced climate change and natural variability. Nature 1999, 397, 688–691. [Google Scholar] [CrossRef]
- Mariotti, A. Recent changes in the mediterranean water cycle: A pathway toward long-term regional hydroclimatic change? J. Clim. 2010, 23, 1513–1525. [Google Scholar] [CrossRef]
- Alpert, P.; Ben-Gai, T.; Baharad, A.; Benjamini, Y.; Yekutieli, D.; Colacino, M.; Diodato, L.; Ramis, C.; Homar, V.; Romero, R.; et al. The paradoxical increase of mediterranean extreme daily rainfall in spite of decrease in total values. Geophys. Res. Lett. 2002. [Google Scholar] [CrossRef]
- Gaertner, M.A.; Jacob, D.; Gil, V.; Dominguez, M.; Padorno, E.; Sanchez, E.; Castro, M. Tropical cyclones over the mediterranean sea in climate change simulations. Geophys. Res. Lett. 2007. [Google Scholar] [CrossRef]
- Mariotti, A.; Struglia, M.; Zeng, N.; Lau, K. The hydrological cycle in the mediterranean region and implications for the water budget of the mediterranean sea. J. Clim. 2002, 15, 1674–1690. [Google Scholar] [CrossRef]
- Aznar, R.; Sotillo, M.G.; Martin, M.L.; Somot, S.; Valero, F. Comparison of model and satellite-derived longterm precipitation databases over the mediterranean basin: A general overview. Atmos. Res. 2010, 97, 170–184. [Google Scholar] [CrossRef]
- Michaelides, S.; Levizzani, V.; Anagnostou, E.; Bauer, P.; Kasparis, T.; Lane, J.E. Precipitation: Measurement, remote sensing, climatology and modeling. Atmos. Res. 2009, 94, 512–533. [Google Scholar] [CrossRef]
- Tapiador, F.J.; Turk, F.J.; Petersen, W.; Hou, A.Y.; García-Ortega, E.; Machado, L.A.T.; Angelis, C.F.; Salio, P.; Kidd, C.; Huffman, G.J.; et al. Global precipitation measurement: Methods, datasets and applications. Atmos. Res. 2012, 104–105, 70–97. [Google Scholar] [CrossRef]
- Strangeways, I. Improving precipitation measurement. Int. J. Clim. 2004, 24, 1443–1460. [Google Scholar] [CrossRef]
- Delrieu, G.; Braud, I.; Berne, A.; Borga, M.; Boudevillain, B.; Fabry, F.; Freer, J.; Gaume, E.; Nakakita, E.; Seed, A.; et al. Weather radar and hydrology preface. Adv. Water Resour. 2009, 32, 969–974. [Google Scholar] [CrossRef]
- Béranger, K.; Barnier, B.; Gulev, S.; Crépon, M. Comparing 20 years of precipitation estimates from different sources over the world ocean. Ocean Dyn. 2006, 56, 104–138. [Google Scholar]
- Ebert, E.E.; Janoviak, J.E.; Kidd, C. Comparison of near-real-time precipitation estimates from satellite observations and numerical models. Bull. Am. Meteorol. Soc. 2007, 88, 47–64. [Google Scholar] [CrossRef]
- Feidas, H.; Kokolatos, G.; Negri, A.; Manyin, M.; Chrysoulakis, N.; Kamarianakis, Y. Validation of an infrared-based satellite algorithm to estimate accumulated rainfall over the Mediterranean basin. Theor. Appl. Climatol. 2008, 95, 91–109. [Google Scholar]
- Drobinski, P.; Ducrocq, V.; Alpert, P.; Anagnostou, E.; Beranger, K.; Borga, M.; Braud, I.; Chanzy, A.; Davolio, S.; Delrieu, G.; et al. Hymex, a 10-year multidisciplinary project on mediterranean water cycle. Bull. Am. Meteorol. Soc. 2013. [Google Scholar] [CrossRef]
- Funatsu, B.M.; Claud, C.; Chaboureau, J.-P. A 6-year amsu-based climatology of upper-level troughs and associated precipitation distribution in the mediterranean region. J. Geophys. Res.: Atmos. 2008. [Google Scholar] [CrossRef]
- Claud, C.; Alhammoud, B.; Funatsu, B.M.; Lebeaupin-Brossier, C.; Chaboureau, J.-P.; Béranger, K.; Drobinski, P. A high resolution climatology of precipitation and deep convection over the mediterranean region from operational satellite microwave data: Development and application to the evaluation of model uncertainties. Nat. Hazard. Earth Syst. Sci. 2012, 12, 785–798. [Google Scholar] [CrossRef]
- Goodrum, G.; Kidwell, K.; Winston, W. NOAA KLM User’s Guide; US Dept. of Commerce Washington, DC, USA/National Oceanic and Atmospheric Administration/National Environmental Satellite Data and Information Service: Suitland, MD, USA, 2000. [Google Scholar]
- Laviola, S.; Levizzani, V. Observing precipitation by means of water vapor absorption lines: A first check of the retrieval capabilities of the 183-wsl rain retrieval method. Italian J. Remote Sens. 2009, 41, 39–49. [Google Scholar] [CrossRef]
- Laviola, S.; Levizzani, V. The 183-wsl fast rain rate retrieval algorithm. Part I: Retrieval design. Atmos. Res. 2011, 99, 443–461. [Google Scholar] [CrossRef]
- John, V.O.; Holl, G.; Atkinson, N.; Buehler, S.A. Monitoring scan asymmetry of microwave humidity sounding channels using simultaneous all angle collocations (saacs). J. Geophys. Res.: Atmos. 2013, 118, 1536–1545. [Google Scholar] [CrossRef]
- Surussawadee, C.; Staelin, D.H. Global precipitation retrievals using the noaa amsu millimeter-wave channels: Comparisons with rain gauges. J. Appl. Meteorol. Climatol. 2010, 49, 124–135. [Google Scholar] [CrossRef]
- Greenwald, T.J.; Christopher, S.A. Effect of cold clouds on satellite measurements near 183 GHz. J. Geophys. Res.: Atmos. 2002. [Google Scholar] [CrossRef]
- Funatsu, B.M.; Claud, C.; Chaboureau, J.-P. Potential of advanced microwave sounding unit to identify precipitating systems and associated upper-level features in the mediterranean region: Case studies. J. Geophys. Res.: Atmos. 2007. [Google Scholar] [CrossRef]
- Hong, G.; Heygster, G.; Miao, J.; Kunzi, K. Detection of tropical deep convective clouds from amsu-b water vapor channels measurements. J. Geophys. Res.: Atmos. 2005. [Google Scholar] [CrossRef]
- Delrieu, G.; Ducrocq, V.; Gaume, E.; Nicol, J.; Payrastre, O.; Yates, E.; Kirstetter, P.E.; Andrieu, H.; Ayral, P.A.; Bouvier, C.; et al. The catastrophic flash-flood event of 8–9 September 2002 in the gard region, france: A first case study for the cevennes-vivarais mediterranean hydrometeorological observatory. J. Hydrometeorol. 2005, 6, 34–52. [Google Scholar] [CrossRef]
- Buehler, S.A.; John, V.O. A simple method to relate microwave radiances to upper tropospheric humidity. J. Geophys. Res.: Atmos. 2005. [Google Scholar] [CrossRef]
- Funatsu, B.M.; Claud, C.; Chaboureau, J.-P. Comparison between the large-scale environments of moderate and intense precipitating systems in the mediterranean region. Mon. Weather Rev. 2009, 137, 3933–3959. [Google Scholar] [CrossRef]
- Liu, G.; Seo, E.-K. Detecting snowfall over land by satellite high-frequency microwave observations: The lack of scattering signature and a statistical approach. J. Geophys. Res.: Atmos. 2013, 118, 1376–1387. [Google Scholar] [CrossRef]
- Bennartz, R.; Petty, G.W. The sensitivity of microwave remote sensing observations of precipitation to ice particle size distributions. J. Appl. Meteorol. 2001, 40, 345–364. [Google Scholar] [CrossRef]
- Lima, W.F.A.; Machado, L.A.T.; Morales, C.A.; Viltard, N. Rainfall sensitivity analyses for the hsb sounder: An amazon case study. Int. J. Remote Sens. 2007, 28, 3520–3545. [Google Scholar]
- Andersson, A.; Fennig, K.; Klepp, C.; Bakan, S.; Grassl, H.; Schulz, J. The hamburg ocean atmosphere parameters and fluxes from satellite data—HOAPS-3. Earth Syst. Sci. Data 2010, 2, 215–234. [Google Scholar] [CrossRef]
- Fennig, K.; Andersson, A.; Bakan, S.; Klepp, C.-P.; Schröder, M. Hamburg Ocean Atmosphere Parameters and Fluxes from Satellite Data—HOAPS 3.2—Monthly Means/6-Hourly Composites; Satellite Application Facility on Climate Monitoring: Offenbach, Germany, 2012. [Google Scholar]
- Andersson, A.; Klepp, C.; Fennig, K.; Bakan, S.; Graßl, H.; Schulz, J. Evaluation of HOAPS-3 ocean surface freshwater flux components. J. Appl. Meteorol. Climatol. 2011, 50, 379–398. [Google Scholar] [CrossRef]
- Dee, D.P.; Uppala, S.M.; Simmons, A.J.; Berrisford, P.; Poli, P.; Kobayashi, S.; Andrae, U.; Balmaseda, M.A.; Balsamo, G.; Bauer, P.; et al. The erainterim reanalysis: Configuration and performance of the data assimilation system. Quart. J. R. Meteorol. Soc. 2011, 137, 553–597. [Google Scholar] [CrossRef]
- Tiedtke, M. A comprehensive mass flux scheme for cumulus parameterization in large-scale models. Mon. Weather Rev. 1989, 117, 1779–1800. [Google Scholar] [CrossRef]
- Bechtold, P.; Chaboureau, J.-P.; Beljaars, A.; Betts, A.K.; Miller, M.; Köhler, M.; Redelsperger, J.-L. The simulation of the diurnal cycle of convective precipitation over land in a global model. Quart. J. R. Meteorol. Soc. 2004, 130, 3119–3137. [Google Scholar] [CrossRef]
- Dubois, C.; Somot, S.; Calmanti, S.; Carillo, A.; Déqué, M.; Dell’Aquilla, A.; Elizalde, A.; Gualdi, S.; Jacob, D.; L’Hévéder, B.; et al. Future projections of the surface heat and water budgets of the mediterranean sea in an ensemble of coupled atmosphere–ocean regional climate models. Clim. Dyn. 2012, 39, 1859–1884. [Google Scholar] [CrossRef]
- Melani, S.; Pasi, F.; Gozzini, B.; Ortolani, A. A four year (2007–2010) analysis of long-lasting deep convective systems in the mediterranean basin. Atmos. Res. 2013, 123, 151–166. [Google Scholar] [CrossRef]
- Levizzani, V.; Pinelli, F.; Pasqui, M.; Melani, S.; Laing, A.G.; Carbone, R.E. 10-year climatology of warm-season cloud patterns over europe and the mediterranean from meteosat ir observations. Atmos. Res. 2010, 97, 555–576. [Google Scholar] [CrossRef]
- Zampieri, M.; Giorgi, F.; Lionello, P.; Nikulin, G. Regional climate change in the northern adriatic. Phys. Chemist. Earth 2012, 40–41, 32–46. [Google Scholar] [CrossRef]
- Adler, R.F.; Huffman, G.J.; Chang, A.; Ferraro, R.; Xie, P.; Janowiak, J.; Rudolf, B.; Schneider, U.; Curtis, S.; Bolvin, D.; et al. The version-2 global precipitation climatology project (GPCP) monthly precipitation analysis (1979-present). J. Hydrometeorol. 2003, 4, 1147–1167. [Google Scholar] [CrossRef]
- Mehta, A.V.; Yang, S. Precipitation climatology over mediterranean basin from ten years of trmm measurements. Adv. Geosci. 2008, 17, 87–91. [Google Scholar] [CrossRef]
- Biasutti, M.; Yuter, S.E.; Burleyson, C.D.; Sobel, A.H. Very high resolution rainfall patterns measured by trmm precipitation radar: Seasonal and diurnal cycles. Clim. Dyn. 2012, 39, 239–258. [Google Scholar] [CrossRef]
- Chaboureau, J.-P.; Pantillon, F.; Lambert, D.; Richard, E.; Claud, C. Tropical transition of a mediterranean storm by jet crossing. Quart. J. R. Meteorol. Soc. 2012, 138, 596–611. [Google Scholar] [CrossRef]
- Flocas, H.A.; Simmonds, I.; Kouroutzoglou, J.; Keay, K.; Hatsali, M. Asimakopoulos, On cyclonic tracks over the eastern mediterranean. J. Clim. 2010, 23, 5243–5257. [Google Scholar] [CrossRef]
- Bartholy, J.; Pongracz, R.; Pattanyus-Abraham, M. Analyzing the genesis, intensity and tracks of western mediterranean cyclones. Theor. Appl. Climatol. 2009, 96, 133–144. [Google Scholar] [CrossRef]
- Campins, J.; Genoves, A.; Jansa, A.; Guijarro, J.A.; Ramis, C. A catalogue and a classification of surface cyclones for the western mediterranean. Int. J. Climatol. 2000, 20, 969–984. [Google Scholar] [CrossRef]
- Claud, C.; Alhammoud, B.; Funatsu, B.M.; Chaboureau, J.-P. Mediterranean hurricanes: Large-scale environment and convective and precipitating areas from satellite microwave observations. Nat. Hazard. Earth Syst. Sci. 2010, 10, 2199–2213. [Google Scholar] [CrossRef]
- Tous, M.; Romero, R. Meteorological environments associated with medicane development. Int. J. Climatol. 2013, 33, 1–14. [Google Scholar] [CrossRef]
- Xoplaki, E.; Gonzalez-Rouco, J.F.; Luterbacher, J.; Wanner, H. Wet season mediterranean precipitation variability: Influence of large-scale dynamics and trends. Clim. Dyn. 2004, 23, 63–78. [Google Scholar]
- Romanou, A.; Tselioudis, G.; Zerefos, C.S.; Clayson, C.A.; Curry, J.A.; Andersson, A. Evaporation–precipitation variability over the Mediterranean and the Black Seas from satellite and reanalysis estimates. J. Clim. 2010, 23, 5268–5287. [Google Scholar] [CrossRef]
- Kidd, C.; Bauer, P.; Turk, J.; Huffman, G.J.; Joyce, R.; Hsu, K.-L.; Braithwaite, D. Intercomparison of high-resolution precipitation products over Northwest Europe. J. Hydrometeorol. 2012, 13, 67–83. [Google Scholar] [CrossRef]
- Lionello, P.; Bhend, J.; Buzzi, A.; Della-Marta, P.M.; Krichak, S.O.; Jansa, A.; Maheras, P.; Sanna, A.; Trigo, I.F.; Trigo, R. Cyclones in the Mediterranean Region: Climatology and Effects on the Environment. In Mediterranean Climate Variability; Elsevier: Amsterdam, The Netherlands, 2006; pp. 325–372. [Google Scholar]
© 2014 by the authors; licensee MDPI, Basel, Switzerland. This article is an open access article distributed under the terms and conditions of the Creative Commons Attribution license (http://creativecommons.org/licenses/by/3.0/).