Abstract
A key component necessary to improve the performance of climate and weather forecasting models is understanding the physical mechanisms controlling tropical deep convection. In this study, the thermodynamic variables linked to deep convection within this equatorial sea-breeze convective regime are analyzed. A range of data sets are employed: GNSS-based PWV and surface precipitation data, lightning and daily radiosonde observations, and GOES-13/16 and GPM satellite products. Our results indicate that the convective indices of CAPE and CIN, often used as predictors of deep convection, do not clearly distinguish deep-convective and non-convective days. In contrast, the variables representative of the atmospheric water vapor content, PWV and vertical water vapor distribution as well as an entrainment-based buoyancy measure, are better markers of potential deep convection. For this region, however, the water vapor/deep convection relationship with precipitation does not appear as strong as over tropical oceans and tropical continental regions. Finally, our results show that there is no strong link between daily average precipitation intensity and daily lightning count. However, deep-convective days without lightning had higher water vapor at the beginning of the day, as compared to days with lightning, which resulted in convective showers earlier in the day.
1. Introduction
Deep atmospheric convection dominates the weather and climate of the tropics; however, identifying and understanding the physical processes which determine the evolution and intensity of convective activity remain a fundamental scientific challenge. A proper representation of convection in numerical models where convection is parameterized, such as Global Climate Models (GCMs), is critical since convective parameterization is recognized as causing bias and uncertainty in predicting atmospheric evolution [1,2,3,4,5]. Even though convective-resolving GCMs are on the horizon [6,7,8], complete elimination of convective parameterization is still far-off in the future [9]. Furthermore, in the context of anthropogenic warming, inaccurate representation of the numerous physical processes of deep convection extends this uncertainty into predicting and modeling future changes in global precipitation [10]. To assess the model’s performance with the goal of limiting this uncertainty associated with deep-convective activity in the tropics, metrics and critical variables derived from long-term observations are necessary [11,12,13,14,15,16].
Fundamentally, observationally based critical variables, indices, or metrics must elucidate, or be reflective of, the relationship between the frequency, intensity, and organization of deep-convective activity with respect to the atmospheric conditions in which it develops. Intrinsic to their utilization is a separation of spatial and temporal scales; that is, the convective-scale and the large-scale environment. Typically, the large-scale environment is represented by thermodynamic variables related to the vertical profile of water vapor and temperature or integrated instability/stability indices such as Convective Available Potential Energy (CAPE) or Convective Inhibition Energy (CIN). This separation of the convective-large scale environment framework is essentially that of quasi-equilibrium theory, which is the basis for most convective parameterization schemes in GCMs [17]. The quasi-equilibrium framework basically assumes that large-scale forcing (dynamical or thermodynamic) destabilizes the atmosphere, resulting in deep convection, which then simply acts to stabilize the atmosphere with no upscale effects on the larger-scale dynamics or circulation. Criticism of the quasi-equilibrium framework’s neglect of the upscale effects of deep convection are reviewed in [17]. On the other hand, in the context of climate change scenarios and expected changes in precipitation event intensity distribution in the tropics, [10] argued that the separation of thermodynamic and dynamic components related to moisture convergence associated with deep-convective precipitation is artificial.
Regardless of the intrinsic interplay between convection and its large-scale environment, there simply do not exist long-term (years to decades) purely observational data that directly represent dynamical terms associated with water vapor convergence, such as horizontal and vertical wind components. There have been campaigns employing radiosonde networks used to calculate moisture convergence (e.g., [18,19]), and indirect calculations of moisture convergence at the convective scale (~10 km) are possible (e.g., [11,12]), but this spatial scale is not representative of the “large-scale environment”. Likewise, to assess the shallow-to-deep-convective transition, high frequency measurements (<30 min) with spatial resolutions of kilometers would be necessary [11]. The closest available data for calculating water vapor convergence based primarily on observations would be, for example, ERA-5 reanalysis data, which provides data every hour and has a 0.25 × 0.25 degree grid [11]. Therefore, for the foreseeable future, thermodynamic variables related to the vertical profiles of temperature and humidity will have to be utilized to investigate the relationship between the large-scale environment and deep convection.
Within the tropics, column or precipitable water vapor (PWV) has been shown to provide a robust empirical relationship with convective precipitation temporal evolution and intensity [11,12,20,21,22,23,24,25,26]. However, many of the studies relating deep-convective precipitation to PWV have been carried out over oceans, often employing different satellite-derived measures of convective activity by way of cloud imagery (e.g., Geostationary Operational Environmental Satellite (GOES)) or precipitation (Tropical Rainfall Measuring Mission (TRMM) and Global Precipitation Measurement (GPM)). Over tropical continental regions, this precipitation/PWV has been explored less, although [14,27,28] have argued that the exponential relationship between water vapor and precipitation is similar to that observed over tropical oceans. Nevertheless, within continental regions of relative topographic homogeneity, such as the Amazon Basin, there is substantial variability of convective precipitation with respect to time of occurrence, intensity, cloud depth and associated cloud microphysical characteristics [29,30,31,32,33,34,35,36].
In addition to PWV, buoyancy-measures, like CAPE and CIN, have long been employed not only to represent the potential for convection, but also as a measure of its intensity [13,14,35,37,38,39]. As noted above, CAPE or similar indices underlie many convective parameterizations, where they act as a mass flux closure for deep convection [40,41,42,43,44,45]. Unlike PWV, however, CAPE and convective activity vary strongly by region, and often reveal an inverse relationship in the tropics, leading to negative correlations between CAPE and the convection [46,47,48,49], which has implications for model convective parameterizations. In addition to vertically integrated quantities such as PWV and CAPE, the actual vertical structure of water vapor has proven to be a determining factor in convective precipitation [28,49,50,51,52,53].
As previously mentioned, equatorial continental regions are not homogeneous in terms of convective precipitation and its relationship to thermodynamic variables such as PWV, CAPE or the water vapor vertical structure [13,14,28,46,47,49,50,51,52,53]. Therefore, given the need for variables and metrics representative of tropical deep-convective activity, it continues to be necessary to investigate PWV and CAPE and their relationship to the intensity of tropical deep convection for different convective regimes. In the context of the present study, we examine various thermodynamic variables and indices for the sea-breeze regime of Belém near the northern Atlantic coast of Brazil. Sea-breeze regimes around the globe, which are neither strictly oceanic nor truly continental, need to be assessed because this different topographical setting may exhibit distinct moisture structures, thermodynamic conditions, and convective activity [54,55,56]. For example, ref. [57] argue that PWV or even the vertical structure of water vapor is less influential on coastal tropical precipitation than what is observed over the ocean.
In addition to the diversity of convective regimes within the deep tropics, a somewhat different but equally challenging issue is how to identify deep-convective activity. Traditionally, precipitation has been the variable of interest given its role in the atmospheric hydrological cycle, the planetary energy balance, and simply being a critical variable for ecological systems and human society. However, basing deep convection on rainfall has its difficulties due to the spotty nature of precipitation. Furthermore, given the lack of long-term, surface-based precipitation measurements in much of the continental deep tropics, precipitation-based studies must often depend on remotely sensed data and derived products which can misidentify shallow or deep precipitating convection [58,59,60]. For example, ref. [36] found rather notable differences in peak-intensity rainfall in satellite-derived precipitation databases, particularly at diurnal timescales across the Amazon Basin.
Lightning strikes, however, have several unique advantages in representing convective activity and intensity. Firstly, lightning is clearly indicative of deep-convective activity, unlike precipitation in the tropics which may result from shallow cumulus, congestus, or stratiform clouds as pointed out above. Secondly, it can be detected continuously in both time and space, which is extremely advantageous compared to surface-based rainfall (a point measure) or the infrequency of satellite radar measures (e.g., ~3 h for TRMM). Moreover, unlike ground-based radars, blockage issues in complex topography do not exist with terrestrial lightning location systems data [60,61,62,63]. Thirdly, it has been shown to be linked to large-scale environmental variables/indices representative of convective evolution and intensity [29,60,64,65,66,67].
This present study is fundamentally motivated to assess which environmental thermodynamic variables behave in a similar fashion with respect to deep-convective activity based on precipitation and on lightning activity. Likewise, given the often-contrasting regional behavior of PWV, CAPE, and the water vapor vertical structure, we explore this topic for this equatorial coastal region. With this in mind, we compare these often-utilized environmental thermodynamic variables for convective activity occurring in Belém, near the coast of northern Brazil. Though the coastal regions of the Amazon are quite small relative to the Amazon Basin, they do play a role as an initiation point for long-lived squall lines that propagate on occasion all the way to Colombia [68,69,70,71,72]. Thus, we are motivated to assess whether lightning-based intensity provides a statistically similar or very distinct relationship from precipitation intensity for this region on annual and diurnal cycles.
2. Study Area, Data, and Methodology
2.1. Study Area
Tropical coastal precipitation reveals a distinct pattern when it is dominated by land–sea interaction [57], though this may be a function of the irregular topographic configuration, which may influence the sea-breeze circulation and resulting convective activity [73,74,75]. Differential daytime heating of the air over land and the ocean drives the sea-breeze as lower pressure forms over the warmer inland surface, and relatively cooler temperatures over the ocean result in locally higher pressure. The metropolitan area of Belém lies inland from the Atlantic coast approximately 100 km to the north/northeast. Near Belém, the terrain becomes more complex as it is bordered by the Guajará Bay, which splits off from the Marajó Bay, the latter penetrating inland more than 200 km from the Atlantic Ocean (see Figure 1). This topographic configuration also produces local “Bay breezes” [76]. Many studies in the Belém region have focused on squall lines [24,68,69,70,71,77,78]. Resulting from the coastal sea breeze, these squall lines can form along the coast near Belém in a narrow linear deep-convective band, often extending greater than 2000 km in length with propagation speeds greater than 50 km/h [68,69,70]. Ref. [68] estimated that 40% of the precipitation in the Amazon basin during the ABLE (Amazon Boundary Layer Experiment) 2B campaign was associated with coastal squall lines during the months of April and May. Similarly to the approach taken by [79], we focus on convective activity in the Belém region without distinguishing between non-local propagating convection, such as squall lines, and the more locally formed convective activity. A unique aspect of our study is distinguishing deep-convective events and their intensity by means of statistical distributions, based on daily precipitation totals and daily lightning flash totals. The strength of the relationship between the convective intensity, both precipitation-based and lightning-based are then correlated with different thermodynamic variables, discussed in detail below.
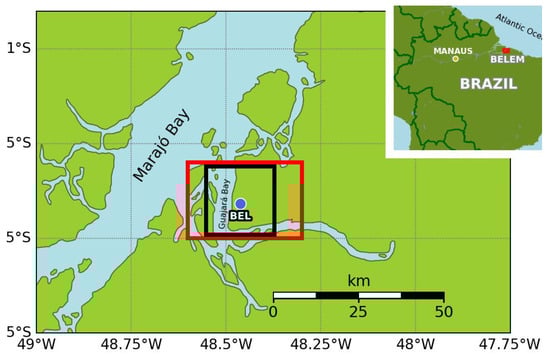
Figure 1.
The region of the study. It includes the 20 km by 20 km area of lightning detection (black box) and the 33 km by 22 km GPM data coverage area (red box) and the approximate location of the Belém (blue dot labeled “BEL”) GNSS/INMET/Radiosonde meteorological stations. We refer to these areas as the “Belém box”.
2.2. Data
2.2.1. Lightning
Lightning detection from different terrestrial-based networks such as long-range terrestrial Lightning Location System (LLS) data, which employ different sensors operating at Very Low/Low Frequencies (VLFs/LFs) up to Very High Frequencies (VHFs), essentially offer real-time lightning data globally [80,81]. Moreover, given the flash location accuracy of approximately 2 km [82] currently available, lightning data have proven useful in differentiating the convective and stratiform regions of mesoscale convective systems (MCSs) [83,84]. Here, we utilize Vaisala’s Global Lightning Detection Network (GLD360) data that provides the location, time of lightning flash, polarity, and peak current estimates. For this region of northern Brazil, cloud-to-ground strike detection efficiency is around 80% [85]. A more thorough description of this lightning network and data products is found in [86,87]. GLD360 data have been employed in previous studies to gauge the spatial and temporal distribution of convective activity [63], and to characterize the intensity/evolution of the convective diurnal cycle [88]. For this study, we use GLD360 data from 2014 to 2019 as a means of classifying the occurrence and intensity of convective activity as discussed below. The period from 2014 to 2019 is selected given the data availability of our various sources discussed below. In Figure 1, the area over which lightning flashes were recorded is approximately 20 km by 20 km, centered on our surface precipitation site in Belém. In 2016, the GLD360 detection was increased over the Amazon region [82,89], leading to a higher degree of detection of low-amplitude lightning [89]. To offset any bias in the unequal detection levels of the GLD360 data before and after 2016, any lightning flashes with an amplitude of 15 kA or less were eliminated, following the procedure previously carried out in a study by [90] with GLD360 data. Eliminating low-amplitude lightning strikes/flashes leads to a consistent distribution of the GLD360 cloud-to-ground lightning strikes/flashes per year over our study area. After eliminating low-amplitude flashes/strokes in 2014 and 2015, 57% and 61% of the total flashes/strikes remain, respectively. For 2016, 37% of the total flashes/strokes remain. Not unexpectedly, given the increase in detection rate, a much larger number of flashes/strokes is eliminated and only 28%, 26% and 24% remain for 2017, 2018, and 2019, respectively.
2.2.2. Radiosonde and Surface Meteorological Data
To analyze local environmental conditions, including stability indices, PWV, vertical water vapor profiles, and radiosondes were obtained from the University of Wyoming Atmospheric Sounding database (accessed on 11 August 2021 at http://weather.uwyo.edu/upperair/sounding.html). These sounding data for the WMO site 82193 SBBE Belém, Brazil, are typically collected twice daily at 0Z and 12Z UTC (Belém Local Time is UTC—3 h) and span from 2014 to 2019. Deep-convective events in the Belém area most frequently occur during the afternoon and early evening [78]. For example, 99% of reported lightning flashes employed in this study occurred after 10 am and before 9 pm local time. To minimize potentially stabilized soundings following a deep-convective event, our analysis only includes the 12Z (i.e., 9 am local time) soundings. Furthermore, prior to carrying out the analysis, soundings were subjected to a quality-control check following the methodology of [50]. Specifically, for a given pressure level, soundings with mixing ratios exceeding three standard deviations above the average value were flagged and inspected. If multiple levels were defective, they were eliminated. Soundings with few erroneous levels were maintained, but with the defective levels removed.
Hourly averages of surface meteorological variables, including pressure temperature, dewpoint, and wind speed and direction were obtained from the Brazilian Instituto Nacional de Meteorologia (INMET) station in Belém (A201) (accessed on 11 September 2021 from https://tempo.inmet.gov.br/TabelaEstacoes/A201). For this study, we employ hourly accumulated rainfall totals provided by this dataset to represent precipitation, without distinguishing between convective and stratiform precipitation.
2.2.3. GPM Precipitation Data
As explained previously, a problem that arose in this study is that only one surface meteorological station was available for precipitation data for a large area of study. To help alleviate this deficiency, GPM rainfall intensity data are also utilized, specifically, the IMERG Final Run dataset, which also includes satellite microwave precipitation estimates, rain gauge data for the Global Precipitation Climatological Center, and other sources of precipitation data available [91]. This product has a spatial resolution of 0.1° or approximately 10 km in the tropics; the temporal resolution used in this study was 30 min. The 30 min values used are the average rainfall intensity (mm/h) that occurred within the area of study. This daily average then serves for calculating convective intensity. The GPM data consists of six pixels closely centered over the surface meteorological station of Belém. The coverage area of 33 km by 22 km, slightly exceeds the 20 km by 20 km area lightning data area (see Figure 1).
2.2.4. GOES-13/GOES-16 Cloud-Top Temperatures
Another useful variable that is frequently employed for the detection and analysis of deep convection in the Amazon region is the cloud-top temperature (CTT) from GOESs. Refs. [11,12] employed the CTT value of 235 K (−38.15 °C) as indicative of deep convection over Manaus in the central Amazon, which is the value also employed in this study. Both GOES-13, decommissioned in 2017, and GOES-16 are utilized. For the period from 2014 to early October 2017, channel 4 data (10.70 µm) of the GOES-13 is employed, and for the remainder of 2017, 2018, and 2019, channel 13 data (10.3 µm) of the GOES-16 is used. The data utilized from GOES-13 is approximately 4 km by 4 km in resolution, provided every 30 min at the 15 and 45 min mark. On the other hand, the GOES-16 data has a resolution of 2 km by 2 km every 15 min. The area covered by both satellites is the 20 km by 20 km area of study, plus or minus 1 km.
2.2.5. GNSS Precipitable Water Vapor (PWV)
A GNSS meteorological station in Belém (see Figure 1) was employed. This station offers high frequency PWV (5 min) in all-weather conditions. Typical errors between GNSS and radiosonde PWV are 1 to 2 mm [92,93]. This data set is employed to examine the temporal evolution of PWV on a daily timescale during convective events of different intensities, following [11].
2.3. Methodology
To begin our analysis, as a first step, convective versus non-convective days are separated based on lightning occurrence and on precipitation accumulation, independently. Our daily analysis begins on the given day at 6 AM (LT) and concludes 24 h later at 6 AM (LT) the next day. If at least 1 lightning flash was reported over the area during this 24 h period, it is considered a convective day, while those with 0 flashes are considered non-convective days. With respect to precipitation, convective days reported precipitation, while non-convective reported no precipitation and no lightning. Histograms for the 6 years of data were created to provide a means for categorizing the intensity of the convective days based on daily lightning flash totals and daily accumulated precipitation or daily average precipitation intensity (when using the GPM data). Both the lightning and precipitation distributions are highly skewed (see Figure 2), like those observed in many other studies [94,95]. With these histograms, convective events are categorized into four intensity categories: the lowest 25% of the distribution represented “light” events, 25% to 75% were “moderate” events, 75% to 95% were “strong” events, and 95% and above represented “extreme” events. To ensure that these days qualify as deep-convective days based on either precipitation and lightning criteria, the average CTT over the 20 km by 20 km area of study surrounding the Belém meteorological and GNSS station is utilized. If the minimum value of average CTT over the study area falls below 235 K, the event is classified as deep convection following [11]. This CTT criterion is used to filter out all events, both precipitation- and lightning-based, that do not qualify as deep-convective events over our Belém box. For example, through visual analysis of animations of CTT images with imposed lightning strokes, convective cases based on lightning occurrence are eliminated when lightning strikes occur just within study area, but the deep-convective clouds do not pass directly over the entire box resulting in a CTT average well above 235 K. The convective days are then further filtered by eliminating all days without morning radiosondes, since the radiosondes are employed to obtain several thermodynamic parameters discussed further in the following paragraph. For the 6 years analyzed from 2014 to 2019 consisting of 2191 days total of possible data, 1822 days had radiosonde data. After applying the deep convection criteria to the days with radiosonde data, there were 1104 event days (deep-convective and non-convective) when using lightning data for categorization, and 1009 event days and 969 event days when using the BELE station precipitation data and GPM precipitation data, respectively, for categorization.
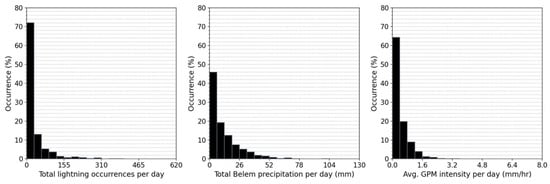
Figure 2.
A histogram of the distribution of percentage of days with convective events based on total lightning occurrences per day (left), total precipitation per day at Belém station (center), and total precipitation per day with GPM data (right).
The corresponding 12Z Belém radiosondes provide the stability indices, CAPE and CIN, PWV and vertical water vapor structure for all categories. The PWV was calculated using Equation (1) [11].
with being the liquid water density, is the mixing ration, is gravity, and is the pressure. For the other thermodynamic variables, studies show that assumptions about the thermodynamic path, reversible or pseudo-adiabatic, can impact the magnitude of CAPE and CIN in the tropics; for this reason, we calculated both variables with both thermodynamic paths to assess their impact for this region [96]. CAPE and CIN derived from reversible and pseudo-adiabatic ascent were calculated using the calcsound.f Fortran routine (accessed on 11 August 2021 from https://texmex.mit.edu/pub/emanuel/BOOK/). This study followed [97] to calculate CAPE, which used Equation (2).
where is the virtual temperature of the ambient air and the virtual temperature of the parcel. is defined using Equation (3). The limits of the integral are the Level of Free Convection (LFC) and the Level of Neutral Buoyancy (LNB).
where is the atmospheric mixing ratio and the ambient temperature. is defined two different ways depending on the type of ascent considered. For pseudoadiabatic ascent, where it is assumed that all condensation precipitates as soon as it appears, is defined with Equation (4).
where and are the parcel’s temperature and mixing ratio. For the second type of ascent, the reversible ascent that considers no loss of water vapor/condensation throughout the ascent, is defined in Equation (5),
with being the parcel’s total water content. Specifically, the first level of the soundings, typically near 1010 hPa, corresponds to the temperature and mixing ratio values of the lifted air parcel for the CAPE and CIN values utilized. Finally, CIN is defined in Equation (6), which is the same as Equation (2), but the integration limits are from the surface (surf) to the LFC.
For the vertical profiles of water vapor, mean values of the non-convective events are subtracted from means of the convective categories light, moderate, strong, and extreme.
Finally, the precipitation–buoyancy measurements (B) by [98,99] are also calculated. These buoyancy calculations take into consideration what [13,99] call the “deep-inflow”, where it is assumed that the entrainment of environmental air into the lifted parcel occurs in the lower free troposphere. These two layers, the boundary layer and lower free troposphere, are based on average profiles of equivalent potential temperature and its saturation value, thereby taking into account both the temperature and moisture characteristics of these two layers. Three respective weightings controlling the relative influence of the boundary layer air and the lower free troposphere air contribution to the overall buoyancy, based on these layer averaged values, are implemented for this study: 25%, 50%, and 75% denoted here as B_25%, B_50%, and B_75% (see Equations (1)–(4) of [99] and the corresponding section for a detailed discussion).
3. Results
3.1. Lightning and Precipitation Events
Beginning with Figure 3, the histogram distribution is displayed for each convective day category for both lightning- (denoted as LTN) and precipitation-based data (P-GPM and P-BEL for GPM and Belém local station data, respectively), as well as the total number of deep-convective and non-convective days from 2014 to 2019. In general, for the precipitation data, deep-convective days greatly outnumbered non-convective days, which is not unexpected, as Belém is an entry point to the Amazon Basin. Additionally, there is a small difference of less than 6% between the P-GPM and P-BEL events, which can be explained by the fact that P-BEL is a point measure that could miss precipitation occurring in areas inside the Belém box away from the meteorological station. On the contrary, there was a larger number of non-convective days than deep-convective cases for LTN, indicating that lightning is a less common phenomenon during deep-convective events, with only 31.8% of total deep-convective days (based on precipitation data) experiencing it. The general distribution pattern based on intensity categories shown in Figure 3 for both lightning- and precipitation-based categories is quite similar in the percentages of events.
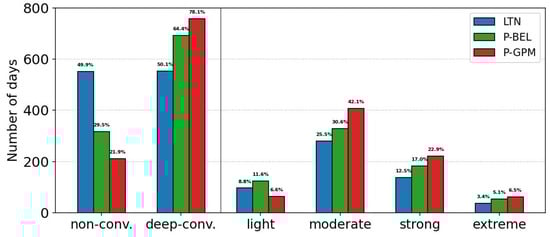
Figure 3.
The distribution of the percentage of days with radiosonde data per category of convection type and deep convection intensity using lightning (LTN), Belém local station precipitation (P-BEL), and GPM precipitation (P-GPM). Black line separates bar graphs of the convective type categories from the deep-convection intensity categories.
3.1.1. Monthly Distribution of Events
The seasonal distribution is of particular interest because environmental changes across seasons can stimulate, suppress, or modify convective activity and its intensity. When observing the monthly distributions for each convective versus non-convective event (Figure 4), one can see the general annual rainfall patterns for the Belém box. The dry season contains the most non-convective days, though rainfall is still frequent from June to November [100], while the largest number of deep-convective days falls within the wet season from December to May [100], particularly for the precipitation-based categorized days. The only month falling outside this seasonal pattern was April, but it has many more days lacking radiosonde data. The pattern of the number of convective days with notably less lightning than precipitation deep-convective days is quite similar for the rainy season, January to May, presumably for April as well. However, during the transition to the dry season starting in June, the distribution of the number of lightning and precipitation days changes, becoming more similar.
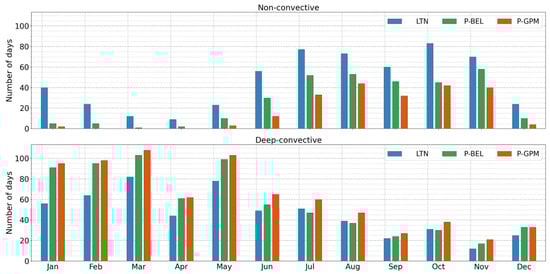
Figure 4.
The monthly distribution of non-convective and convective days using the different types of data to categorize the days. Only days with radiosonde data are included.
Continuing on with the analysis of monthly patterns in relation to the deep-convective intensity, some interesting results emerge (Figure 5). The results for precipitation-based days are as expected: moderate events dominate throughout the year, oscillating between 35% and 70% (see Figure 6), the percentage of light events increases during the dry season, and extreme and strong events tend to be the highest during the wet season. These results are in line with the decrease in water vapor content in the atmosphere during the dry season. As for lightning-based days, moderate and light days decrease in percentage during the dry season, while strong and extreme events increase, indicating that the deep-convective events with a high quantity of lightning tend to occur more during the dry season. These graphs alone do not reveal why this occurs, but the next set of results provides a clearer explanation for Figure 6.
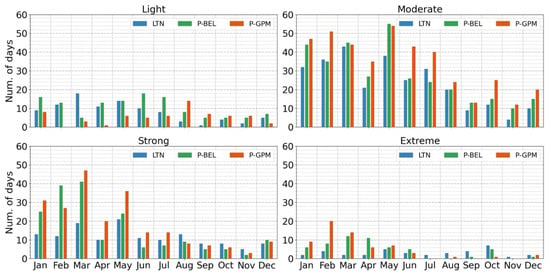
Figure 5.
The monthly distribution of the total days for the different intensities of deep convection using the different types of data to categorize the days. Only days with radiosonde data are included.
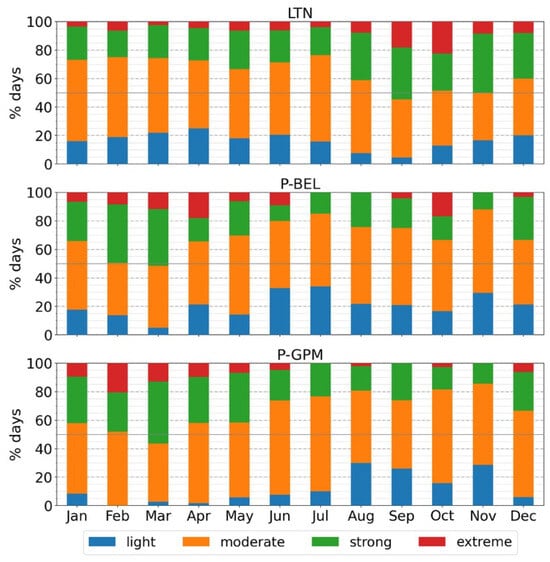
Figure 6.
The percentage of days that fall into each intensity of deep-convective days using the different types of data to categorize the days. Only days with radiosonde data are included.
3.1.2. Instability Indices and Vertical Water Vapor Distribution
To understand the difference between deep-convective and non-convective days for lightning- and precipitation-based categorized events, instability and water vapor indices are analyzed for the different categories. Starting with the instability indices of CAPE and CIN (Figure 7 and Table 1), in general, the calculated difference between convective and non-convective days is as expected: average CAPE is lower by 200–300 J/kg depending on the thermodynamic path used to calculate the variable, and average CIN is higher by 10–20 J/kg for non-convective days. The probability density of CAPE and CIN for all categories is presented in Figure 8, showing that CAPE values fall into a large range between 0 J/kg and 4000 J/kg. While the differences in averages between deep-convective and non-convective days are as expected, if we consider the probability distributions for all of the intensity categories, the distributions overlap too much between categories, making differentiation between deep-convective and non-convective days difficult if only CAPE and CIN are considered. The difference in CAPE_PA and CAPE_REV is as expected and very similar to that observed by [97,101], due to the nature of each type of CAPE. CAPE_PA considers the immediate precipitation of any water that condenses within the ascending parcel, but for CAPE_REV, the assumption is that the condensed water is conserved within the parcel, causing its virtual temperature (Equation (5)) to be lower than for CAPE_PA [97], and consequently, the final CAPE_REV value is also lower than CAPE_PA. For example, a significant amount of deep-convective and non-convective days had CAPE_PA between 1500 J/kg and 2000 J/kg, so if a day has CAPE_PA between these values, it would be difficult to determine if deep convection would occur based on CAPE_PA alone. This leads to the conclusion that CAPE and CIN are not ideal indicators for possible deep convection over the study region.
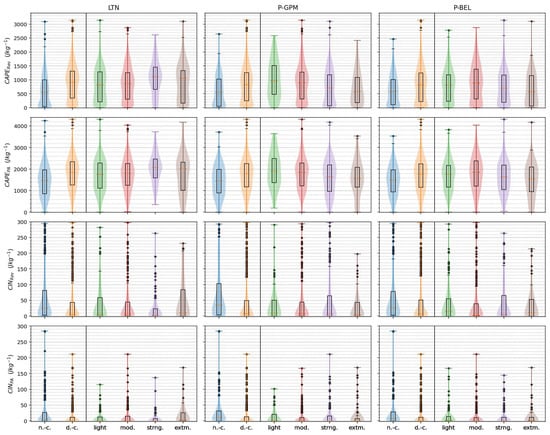
Figure 7.
Violin plots superimposed on box-and-whisker plots for the instability indices CAPE and CIN (both pseudo-adiabatic (PA) and reversible (REV)) per category of convection intensity, for LTN, P-GPM, and P-BEL. Dots indicate outliers of the box-and-whisker plot; the solid black lines separate the plots for non-convective events and deep-convective events from the plots of the various deep-convective intensities.

Table 1.
The average and the standard deviation (STD) of CAPE, CIN, and PWV for lightning- and precipitation-based non-convective events, deep-convective events, and each intensity category. REV and PA indicate the thermodynamic path (reversible or pseudo-adiabatic, respectively) used to calculate the CAPE and CIN.
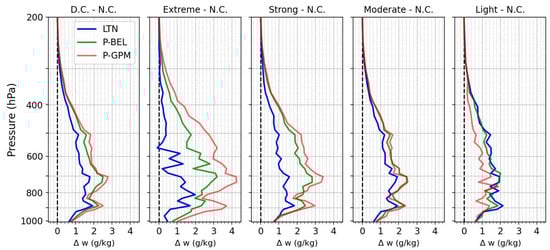
Figure 8.
Vertical profile of the mixing ratio (w), given as the difference between all of the convective intensity categories, including all deep-convective cases (D.C.) and the vertical profile for the non-convective cases (N.C.). The dashed lines indicate 0 g/kg difference.
Continuing our evaluation of convective events based on water vapor, the average vertical profile is calculated by obtaining the average of the radiosonde mixing ratio that occurs at every interval of 25 hPa starting from 1015 hPa to 200 hPa. From these values, the difference in the average mixing ratio between non-convective days and deep-convective days (Figure 8) shows a clear increase in water vapor throughout the whole column of the troposphere, indicating that the amount of water vapor is key to the development of convection and precipitation, which suggests consistent behavior with other tropical regions. While convective days have greater moisture in all the atmospheric column, the largest differences occur between the top of the boundary layer (approximately 950 hPa) and near 500 hPa, or the lower-to-mid troposphere. Not surprisingly, the difference in water vapor for precipitation-based events is larger than for lightning-based events. The differences in water vapor are directly proportional to the intensity of the convection based on precipitation. For lightning-based cases (LTN), there is actually a small decrease in the vertical distribution of water vapor with respect to increased lightning frequency (i.e., case intensity). This is most notable for the difference between extreme and non-convective days.
While employing radiosonde-calculated PWV and buoyancy in Figure 9 and Table 2, the results from these variables also show a relatively strong correlation between precipitation-based intensity events and total water vapor in the atmospheric column. Starting with PWV, this variable is higher for convective days than non-convective days, for all categories. Observing the probability distribution of the PWV in Figure 9 (top graphs), most non-convective days tend to fall between 35 mm and 45 mm, while the majority are above 55 mm for convective days. For precipitation-based events, PWV tends to increase with increasing convective intensity; however, for lightning-based categories, PWV decreases with increasing intensity, similar to the water vapor content of Figure 8.
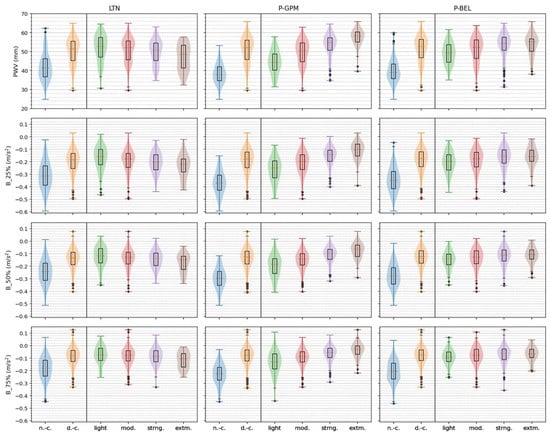
Figure 9.
Violin plots superimposed on box-and-whisker plots for PWV and the deep-inflow buoyancy with 25% (B_25%), 50% (B_50%), and 75% (B_75%) entrainment weights. The dots indicate outliers of the box-and-whisker plot; black lines separate the plots for non-convective events and deep-convective events from the plots of the various deep-convective intensities.
Table 2.
The average and the standard deviation (STD) of PWV, B_25%, B_50%, and B_75% for lightning- and precipitation-based non-convective events, convective events, and each intensity category.
Finally, the last variable analyzed is the deep-inflow mass-flux profile from [98,99]. Three buoyancy values are calculated with three different weights (B_25%, B_50%, and B_75%), indicating the relative contribution of the boundary layer air to that of the lower free tropospheric air due to entrainment. The results of the different weights indicate that the more air from the lower free-troposphere entrained, the greater the buoyancy. Similarly to PWV and the vertical distribution of water vapor, convective days have a higher buoyancy in general than non-convective days (see Figure 9), with the difference between the two types of days being larger than for PWV, since there is a smaller overlap between the density distribution of convective and non-convective days for this variable. It also increases with convective intensity for precipitation-based convective days. For lightning-based days, the buoyancy decreases slightly with convective intensity, consistent with PWV and water vapor column results. When considering all the results (PWV, vertical distribution of mixing ratio, and buoyancy results), they all suggest that a higher amount of water vapor in the atmosphere tends to inhibit lightning development. Further results in Section 3.2 offer an explanation for these observations.
Additionally, the results from these three variables indicate that the water vapor variable is a better marker for deep convection potential than the thermodynamic variables of CAPE and CIN. In the case of entrainment-weighted buoyancy, there is also a dependency on the temperature profile. However, the magnitude of the difference in temperature for all of the categories as shown in Figure 8 for water vapor is typically quite small, well less than 1 °C. Here, this buoyancy behavior diverges slightly from the observations and conclusions made by [13,52,98]. The results do indicate that low- and mid-level tropospheric water vapor, represented by the deep-inflow buoyancy, has a stronger relationship with deep convection than other variables, such as CAPE, and is a more ideal marker for deep-convective events. Given the highly skewed nature of the distributions of these variables, we calculated Spearman’s rank correlation coefficients () for each of the variables of interest and the intensity categories based on precipitation and lightning (Table 3). It is apparent from the values that PWV correlates most highly with both precipitation and lightning, though the strongest with precipitation ( > 0.60). However, each of the weighting categories (B_25%, B_50%, B_75%) for buoyancy has a slightly smaller (order of a few %) correlation than simply PWV. In terms of stability-based variables, CAPE and lightning correlate the strongest, while CIN rank correlation coefficients are very similar for the two precipitation datasets and lightning.
Table 3.
Spearman’s rank correlation () between each thermodynamic variable obtained with radiosonde data and the number of lightning occurrences per day (LTN daily values), the daily average precipitation intensity from the GPM satellite (P-GPM daily values), and the daily average hourly accumulated precipitation from the BEL meteorological station (P-BEL daily values).
3.2. Diurnal Cycle and Behavior Before and After Deep-Convective Development
Two important observations can be made from the previous results, the first being that water vapor distribution and quantity are good indicators of possible convective activity, and the second is that high water vapor content in the atmosphere appears to inhibit lightning development. To explore this, it is important to first see how water vapor, lightning, and convective activity developed throughout the day. The average diurnal cycle of the convective days for the PWV obtained with the GNSS station in Belém, the average CTT of the Belém box, lightning occurrences inside the Belém box, the Belém station precipitation total per hour, and the GPM precipitation intensity are calculated (see Figure 10). To clarify, the GNSS PWV values in this section are not the same as the radiosonde PWV from the previous section; these GNSS PWV values are calculated every 5 min. To smooth out the noise in these 5 min GNSS PWV data, we perform a 15 min running mean. The diurnal cycle graphs show that deep-convective activity starts after 14 h. local time, when the CTT starts to decrease, and the strongest convection occurred at the time of CTT minimum (referred to as CTT min). The PWV appears to reach its peak around the same time as the CTT min, a result that appears similar to that observed by [11] over Manaus, Brazil; however, further analysis reveals deviation from the behavior in Manaus in the central Amazon. Specifically, with the changes in CTT and the PWV with the time in Figure 11, one can clearly see that the PWV reached its peak approximately one hour after the CTT min, whereas [11] observed peak PWV occurring within the hour before the CTT min.
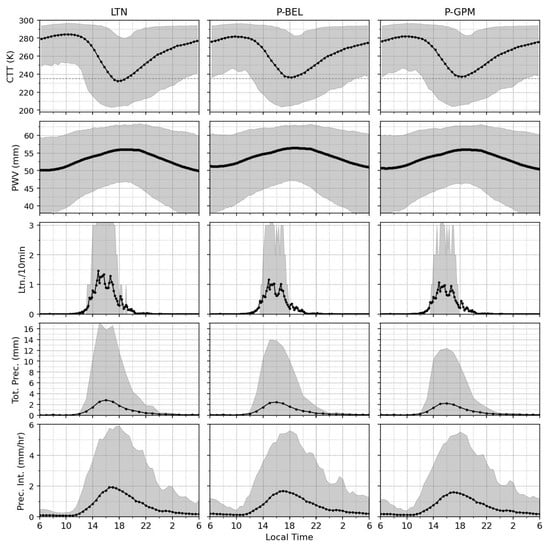
Figure 10.
The average diurnal cycle of CTT every 30 min, PWV every 5 min, lightning per 10 min, total hourly precipitation, and precipitation intensity every 30 min, with the shaded area signaling the cases between the 0.05 and 0.95 quantile for deep-convective events. The maximum shaded area for ltn./10 min was 8 ltn./10 min. The black dots on the black lines are representative of the temporal resolution of each data set. The dashed gray lines in top graphs mark the CTT threshold value of 235 K (CTT values less than 235 K signal deep convective clouds).
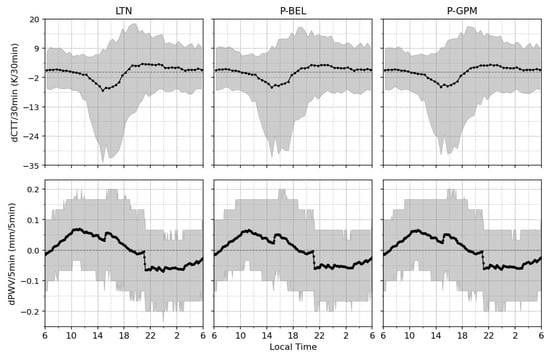
Figure 11.
The average diurnal cycle of change in CTT and PWV per interval of time indicated on the y-axis, with the shaded area signaling the cases between the 0.05 and 0.95 quantile for deep-convective events. The black dots on the black lines are representative of the temporal resolution of each data set. The dashed lines indicate 0 change per interval time.
Continuing with other observations, an interesting result stems from the lightning and precipitation average diurnal cycles. The graphs show that peak lightning and precipitation occurred around 1 h before the CTT minimum was reached. For precipitation, shallow convection can produce precipitation in this region; thus, this observation suggests that most precipitation events tend to occur during the shallow-to-deep transition of the convective events. For lightning, it also indicates that lightning precedes the deepest convection based on CTT. However, it should be noted that the vast majority of these convective events propagate over the Belém box already well-formed. This is confirmed with satellite CTT/lightning animations which reveal that for most lightning events, the lightning is at the front of the storm cells, often arriving to the Belém box before the deepest convective cells based on the lowest CTT reached.
As mentioned before, the PWV maximum occurs within 1 h after the CTT min. To reinforce this observation, the average of all the variables discussed are obtained relative to the CTT min; in other words, we obtain the variable averages in a period of 6 h before and 6 h after the CTT min (see Figure 12 and Figure 13). These graphs demonstrate differences from the observations made over Manaus [11], where there is a clear and sharp PWV peak very near the CTT min (see Figures 2 and 3 of [11]). Here, PWV reaches its maximum on average 1 h after the CTT min; additionally, it shows a steady near-linear rise that slows down 2 h before the CTT min and decreases slowly afterwards, instead of the rapid “ramp-up” observed in Manaus by [11]. However, another study, [24], briefly explored the behavior of PWV and CTT, similar to [11] and more importantly this study, for the region of Belém and Manaus, using two networks of GNSS stations, and found results consistent with the present study. However, it is important to mention that [24] only analyzed data from 25 May to 7 July 2011. The results presented were similar to those in Figure 10, with the PWV reaching its maximum average after the CTT min, indicating that the water vapor convergence continues on even after deep-convective cloud growth.
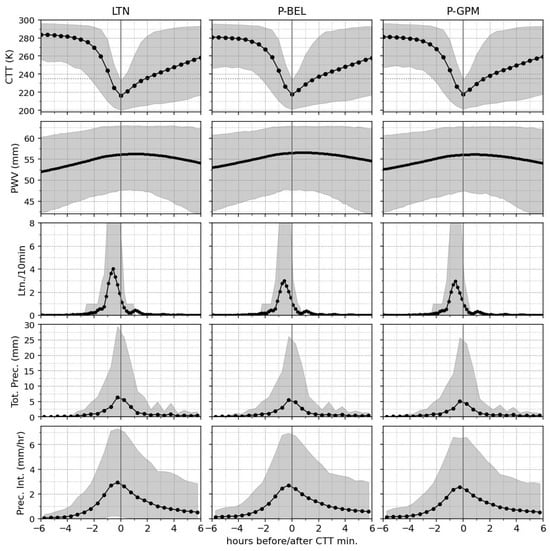
Figure 12.
The average values 6 h before and 6 h after the CTT min of CTT every 30 min, PWV every 5 min, lightning per 10 min, total hourly precipitation, and precipitation intensity every 30 min, with the shaded area signaling the cases between the 0.05 and 0.95 quantile for deep-convective events. The ltn/10 min maximum for LTN reached 23 ltn/10 min. The black dots on the black lines are representative of the temporal resolution of each data set. The solid gray lines represent the start of the event; the dashed gray lines in the top graphs mark the CTT threshold value of 235 K (CTT values less than 235 K signal deep convective clouds).
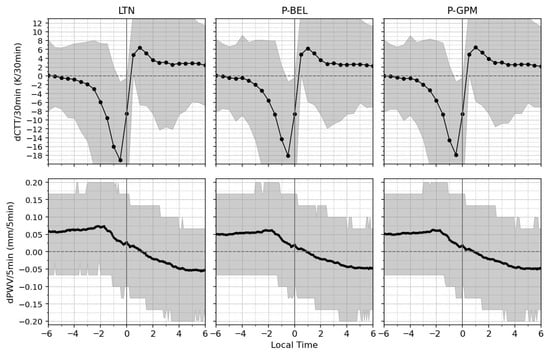
Figure 13.
The average of the change in CTT and PWV per the interval of time indicated on the y-axis for the 6 h before and 6 h after the CTT min, with the shaded area signaling the cases between the 0.05 and 0.95 quantile for deep-convective events. The black dots on the black lines are representative of the temporal resolution of each data set. The solid vertical black lines indicate the start of the event; the dashed lines indicate 0 change per interval of time.
Taking the analysis further, Figure 14 shows the distribution of the time before or after the maximum lightning strikes; precipitation and PWV occur with respect to the CTT min. This clearly indicates that the majority of lightning occurred within 1 or 1/2 h before the CTT min, while the precipitation often reached its maximum in the hour before both total precipitation and the GPM precipitation intensity. It is a different story when looking at the distribution for PWV. There is no clear pattern. The low percentages of cases for each bin, which represents a 5 min interval for the PWV, indicate that there is not an obvious relationship between convective development and water vapor convergence, i.e., d/dt (PWV), contrary to the relationship observed by [11]. The steady increase and decrease in the average behavior of PWV observed in Figure 12 can be explained by the fact that there is no clear, consistent PWV behavior for all events. When observing each event individually, the PWV reached its peak at various points throughout the 2 h before the CTT min and 6 h after the CTT min, indicating that maximum PWV does not occur at the same time as the development of deep convection, indicated by the CTT min.
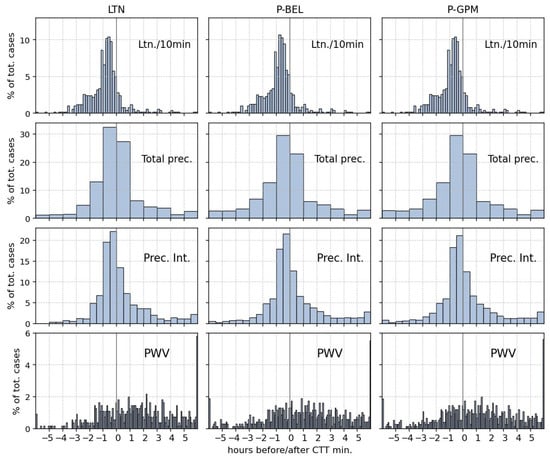
Figure 14.
The distribution of the percentage of days when the maximum for each variable indicated occurred before/after the CTT minimum.
As noted before, the PWV behavior throughout the day and with respect to the CTT min are not consistent with the observations of [11]. In their paper, they argued that the time-rate of change in PWV with time was a good approximation of water vapor convergence and could be used to obtain the time scales of the transition from shallow-to-deep convection. They observed two main characteristic time scales of water vapor convergence, one described as “quasi-linear” occurring around 12 h prior to maximum PWV, lasting 8 h; and a second one 4 h prior to maximum PWV, described as “rapid and non-linear”, which they associated with the transition of the convection from shallow-to-deep convection. This divergence in behavior most likely results from the different characteristic of this continental versus tropical sea-breeze regime. One key difference that is observed in Belém in comparison to Manaus is the fact that the large majority of the convective events that occur in the region of our Belém box were propagating events that formed outside, mostly to the east or north of Belém. The results from this study and the differences with the results from [11], as well as the PWV behavior, indicate that the process of the shallow-to-deep convection transition discussed in [11] is different for Belém. In other words, the PWV does not increase because there is local deep-convective development as in Manaus. Instead, the PWV increases as the deep-convective systems pass over the study site. Other GNSS PWV studies in much more complex tropical terrain, for example, near São José dos Campos in the São Paulo State also show deep-convective cloud temperature and PWV behavior similar to [11,102].
Lightning vs. No Lightning Deep-Convective Days
One of the main observations made so far has been that lightning tends to occur on less humid days. To verify this, the precipitation based deep-convective days are divided into two categories, precipitation days with and without lightning, and the same analysis is performed for each new category.
Figure 15 shows the radiosonde PWV and buoyancy, where, on average, deep-convective days precipitation days with lightning are less humid, but the overlap in probability densities and box-and-whisker plots between days with and without lightning and the averages in Table 4 indicate that the differences were not significant. The average daily vertical profile of the water vapor in Figure 16 shows that deep-convective precipitation days without lightning do have lower water vapor content than days with lightning, specifically above the boundary layer between 900 hPa and 400 hPa, peaking at 700 hPa. However, like the radiosonde PWV and the buoyancy, the differences are not as big as those observed in Figure 3 between deep-convective and non-convective days based solely on precipitation. However, when looking at the diurnal cycle of the GNSS PWV, the precipitation total, and average precipitation intensity, a clear explanation starts to emerge.
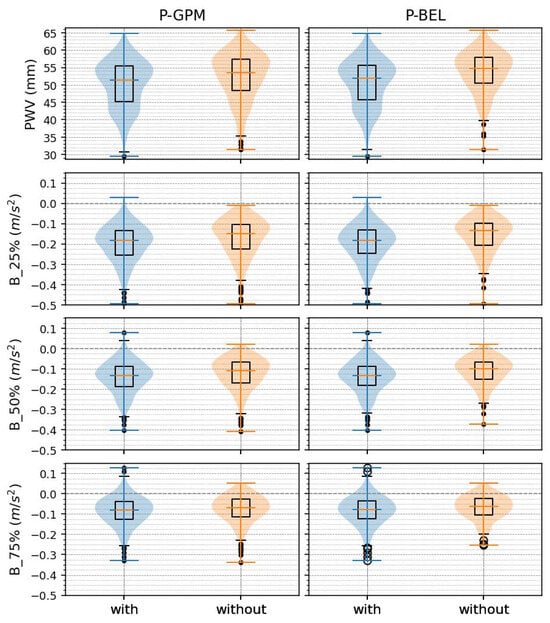
Figure 15.
Violin plots superimposed on box-and-whisker plots for deep-convective cases with lightning (marked “with”) and cases without lightning (marked “without”). Dots indicate outliers of the box-and-whisker plot; black lines separate the plots for non-convective events and deep-convective events from the plots of the various deep-convective intensities.
Table 4.
Average radiosonde PWV and buoyancy with the indicated entrainment weights for deep-convective days with lightning and without lightning for P-GPM and P-BEL.
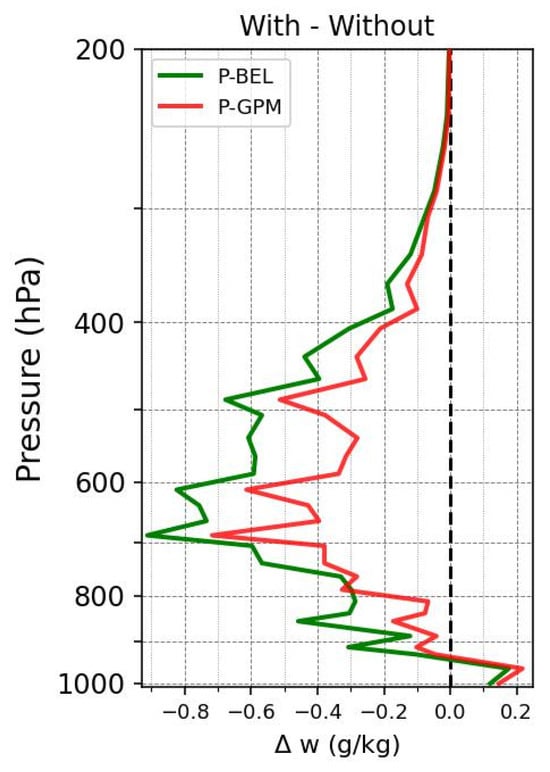
Figure 16.
The difference in average mixing ratio from the daily radiosondes (12Z) between deep-convective days with lightning and deep-convective days without lightning for P-BEL and P-GPM. The dashed line indicates 0 g/kg difference.
The difference in the diurnal cycle of deep-convective days with lightning and without lightning (Figure 17) indicate that the CTT does not decrease as much for days without lightning, meaning that the deep convection is stronger and deeper for days with lightning, perhaps as expected. The key observation, however, is related to PWV and precipitation. Both types of deep-convective precipitation days, with lightning and without lightning, reach approximately the same average PWV maximum at around the same time (18 h local time). However, the days without lightning have higher PWV throughout the whole day, increasing only 5 mm from the start of the day to the point of maximum PWV. The days with lightning started the day with lower PWV, experiencing a sharper increase of 10 mm to reach its maximum value. Additionally, the precipitation graphs indicate that days without lightning had rain showers before the development or propagation of deep convection in the Belém region. These results can be better observed in Figure 18, which shows the same results but relative to the CTT min. Here, one can see more clearly that the PWV before the deep convection is higher for days without lightning and light rain showers occurred in the 6 h prior to the day reaching the CTT min, which is not as low for days without lightning than for days with lightning, signaling that lightning days had deeper cloud growth than non-lightning days.
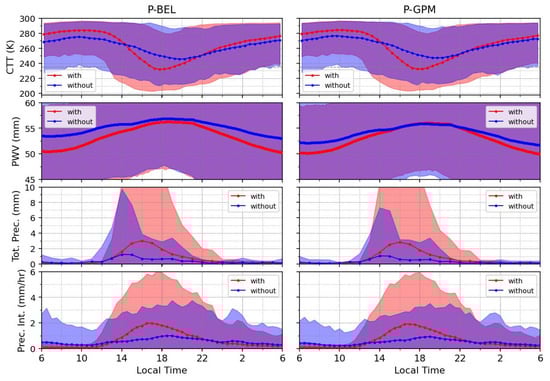
Figure 17.
The average diurnal cycle of CTT every 30 min, PWV every 5 min, total hourly precipitation, and precipitation intensity every 30 min, with the shaded area signaling the cases between the 0.05 and 0.95 quantile for deep-convective events with lightning (red lines) and without lightning (blue lines). The red and blue dots on the respective lines are representative of the temporal resolution of each data set. The dashed gray lines in the top graphs mark the CTT threshold value of 235 K (CTT values less than 235 K signal deep convective clouds).
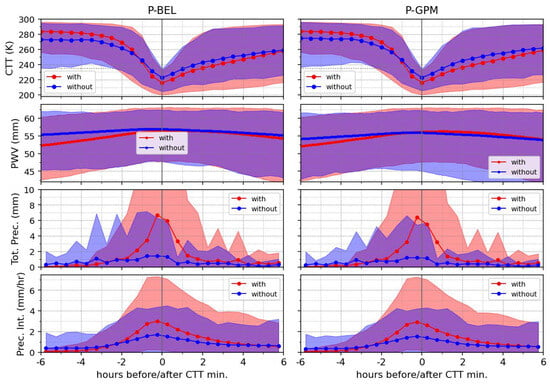
Figure 18.
The average values 6 h before and 6 h after the CTT min of CTT every 30 min, PWV every 5 min, lightning per 10 min, total hourly precipitation, and precipitation intensity every 30 min, with the shaded area signaling the cases between the 0.05 and 0.95 quantile for deep-convective events with lightning (red line) and without lightning (blue line). The red and blue dots on the respective lines are representative of the temporal resolution of each data set. The solid gray lines represent the start of the event; the dashed gray lines in the top graphs mark the CTT threshold value of 235 K (CTT values less than 235 K signal deep convective clouds).
When considering humidity and deep convection, one can assume that the greater the moisture content, the stronger the deep convection will be. Yet, in a very moist environment such as the Belém region, higher moisture content often leads to more shallow-convective rain showers that do not further develop vertically. The results presented in this study indicate that lightning is not inhibited by the humidity directly, instead, the high humidity during the start of the day results in shallow-convective rain showers in the early afternoon, eliminating the potential for the deep convection to form later in the day. This is also the likely reason as to why a larger percentage of deep-convective days during the day season are strong and extreme lightning days. During this period of the year, there is less humidity throughout the day than during the wet season, so when deep convection occurs, it is less likely to be preceded by shallow-convective precipitation earlier in the day that can take fuel away and develop deeper convection.
4. Summary and Discussion
To enhance the forecasting skill and the performance of climate models, it is essential to gain a deeper understanding of the physical mechanisms governing the initiation and development of deep convection in the tropics as noted in [1,3,4,9,15,20]. In this study, we investigate the thermodynamics of deep-convective systems within a sea-breeze dominated regime, employing a comprehensive dataset that includes ground and satellite-based precipitation measurements, GNSS-based PWV, lightning observations, and radiosonde and satellite cloud-top temperature data. Although convective indices such as CAPE and CIN have often been used as markers of deep-convective activity, our results show that both variables exhibit considerable variability and overlapping values on deep-convective and non-convective days, which makes it difficult to determine what category of day a radiosonde belongs to. In contrast, variables representing column water vapor content are better markers of potential deep convection as also noted in works over the central Amazon [13,15] and tropical regions in general [14]. The PWV derived from radiosondes and the deep-inflow buoyancy [99] shows a much clearer difference in values between deep-convective days and non-convective days, indicating that the water vapor content in the atmosphere has an important role in the development of deep convection in this region. However, it should also be noted that the PWV-precipitation and deep-inflow buoyancy/precipitation relationships do not appear as strong as observed over tropical oceans and tropical continental regions. This is consistent with the argument of [57], who stated that the critical PWV values above which precipitation increases greatly are not found in coastal tropical regimes.
The results of the diurnal cycle of PWV (derived from the GNSS data) and CTT from the GOES-13/16 indicate that PWV does not peak on average until after the development of deep convection (marked by the CTT min), a result that differs from the central Amazon results of [11]. Their results indicated a rapid, non-linear increase in the PWV 4 h before the CTT min, which they attributed to the transition from shallow convection to deep convection. In Belém, no such behavior is observed. This is explained by the fact that the vast majority of events that occurred in the area of study were already developed deep-convective systems, typically propagating from an easterly direction.
With regard to lightning and deep convection, the results demonstrate that there is not a strong link between daily precipitation intensity and daily lightning count. In other words, days with a high number of lightning strikes do not occur on the days with the most precipitation. This is consistent with [29], where wetter conditions lead to less lightning over regions of the Amazon. At first glance, this is somewhat surprising because lightning is associated with deep convection and intense rainfall. However, further investigation into the diurnal cycle of the precipitation, PWV derived from the GNSS meteorological station, and the CTT indicate that during the days when deep convection is observed without lightning, precipitation began six or more hours prior to the onset of deep convection, whereas in lightning deep-convective days, precipitation often starts within four hours prior to the deepest convection. This also explains the results that reveals lightning does not tend to occur when there is very high water-vapor content. Days with high water vapor content often coincide with shallower convective precipitation. These events could have used some of the “fuel” needed to develop stronger deep convection that can lead to lightning. This is also the reason why the percentage of deep-convective days that are strong or extreme lightning days is higher during the dry season, when the water vapor content in the atmosphere is lower.
5. Future Work
In a follow up study, we will adopt a similar approach, comparing thermodynamic variables with lightning and precipitation and cloud-top temperature; however, over a much more topographically complex regions within the Amazon, as well as the coastal regions of Colombia and Panamá. This allows for the possibility of making stronger statements on the nature of sea-breeze deep-convective versus continental convection and their relationship with stability and water vapor-based variables.
Author Contributions
Conceptualization, D.I.-F. and D.K.A.; methodology, D.I.-F. and D.K.A.; data acquisition, D.I.-F., D.K.A., R.M.S.F., and G.V.M.; data curation, investigation and formal analysis, D.I.-F. and D.K.A.; writing—original draft preparation, D.I.-F.; writing—review and editing, D.K.A., L.M.d.S.D., G.V.M. and R.M.S.F. All authors have read and agreed to the published version of the manuscript.
Funding
This research received no external funding.
Institutional Review Board Statement
Not applicable.
Informed Consent Statement
Not applicable.
Data Availability Statement
The datasets presented in this article are not readily available because of the restrictions applicable to the Vaisala GLD360 dataset. Requests to access the datasets (all except the Vaisala GLD360) should be directed to David Adams (david.adams@atmosfera.unam.mx). The Vaisala GLD360 datasets were obtained from Vaisala and are available at https://www.vaisala.com/en/products/systems/lightning/gld360 (accessed on 11 August 2021) with permission from the company.
Acknowledgments
The first author was supported in this project by Universidad Nacional Autónoma de México Postdoctoral Program (POSDOC). We want to thank Kathleen Schiro for her help with the “deep inflow” buoyancy code. Likewise, we thank Vaisala and Ron Holle for the GLD360 data employed in this study, and Larry Oolman, of the University of Wyoming, for organizing the radiosonde data.
Conflicts of Interest
The authors declare no conflicts of interest.
References
- Bony, S.; Stevens, B.; Frierson, D.M.W.; Jakob, C.; Kageyama, M.; Pincus, R.; Shepherd, T.G.; Sherwood, S.C.; Siebesma, A.P.; Sobel, A.H.; et al. Clouds, circulation and climate sensitivity. Nat. Geosci. 2015, 8, 261–268. [Google Scholar] [CrossRef]
- Stevens, B.; Bony, S. What are climate models missing? Science 2013, 340, 1053–1054. [Google Scholar] [CrossRef]
- Sherwood, S.C.; Bony, S.; Dufresne, J.-L. Spread in model climate sensitivity traced to atmospheric convective mixing. Nature 2014, 505, 37–42. [Google Scholar] [CrossRef]
- Maher, P.; Vallis, G.K.; Sherwood, S.C.; Webb, M.J.; Sansom, P.G. The impact of parameterized convection on climatological precipitation in atmospheric global climate models. Geophys. Res. Lett. 2018, 45, 3728–3736. [Google Scholar] [CrossRef]
- Weber, N.J.; Mass, C.F. Subseasonal weather prediction in a global convection-permitting model. Bull. Am. Meteorol. Soc. 2019, 100, 1079–1089. [Google Scholar] [CrossRef]
- Marotzke, J.; Jakob, C.; Bony, S.; Dirmeyer, P.A.; O’Gorman, P.A.; Hawkins, E.; Perkins-Kirkpatrick, S.; Quéré, C.L.; Nowicki, S.; Paulavets, K.; et al. Climate research must sharpen its view. Nat. Clim. Change 2017, 7, 89–91. [Google Scholar] [CrossRef]
- Satoh, M.; Stevens, B.; Judt, F.; Khairoutdinov, M.; Lin, S.-J.; Putman, W.M.; Düben, P. Global cloud-resolving models. Curr. Clim. Change Rep. 2019, 5, 172–184. [Google Scholar] [CrossRef]
- Palmer, T.; Stevens, B. The scientific challenge of understanding and estimating climate change. Proc. Natl. Acad. Sci. USA 2019, 116, 24390–24395. [Google Scholar] [CrossRef] [PubMed]
- Freitas, S.R.; Putman, W.M.; Arnold, N.P.; Adams, D.K.; Grell, G.A. Cascading toward a kilometer-scale GCM: Impacts of a scale-aware convection parameterization in the Goddard Earth Observing System GCM. Geophys. Res. Lett. 2020, 47, e2020GL087682. [Google Scholar] [CrossRef]
- Neelin, J.D.; Martinez-Villalobos, C.; Stechmann, S.N.; Ahmed, F.; Chen, G.; Norris, J.M.; Kuo, Y.-H.; Lenderink, G. Precipitation Extremes and Water Vapor. Curr. Clim. Change Rep. 2022, 8, 17–33. [Google Scholar] [CrossRef]
- Adams, D.K.; Gutman, S.I.; Holub, K.L.; Pereira, D.S. GNSS observations of deep convective time scales in the Amazon. Geophys. Res. Lett. 2013, 40, 2818–2823. [Google Scholar] [CrossRef]
- Adams, D.K.; Barbosa, H.M.J.; Gaitan De los Ríos, K.P. A spatiotemporal water vapor/deep convection correlation metric derived from the Amazon Dense GNSS Meteorological Network. Mon. Weather Rev. 2017, 145, 279–288. [Google Scholar] [CrossRef]
- Schiro, K.A.; Ahmed, F.; Giangrande, S.E.; Neelin, J.D. GoAmazon2014/5 campaign points to deep-inflow approach to deep convection across scales. Proc. Natl. Acad. Sci. USA 2018, 115, 4577–4582. [Google Scholar] [CrossRef]
- Schiro, K.A.; Sullivan, S.C.; Kuo, Y.-H.; Su, H.; Gentine, P.; Elsaesser, G.S.; Jiang, J.H.; Neelin, J.D. Environmental controls on tropical mesoscale convective system precipitation intensity. J. Atmos. Sci. 2020, 77, 4233–4249. [Google Scholar] [CrossRef]
- Wolding, B.; Dias, J.; Kiladis, G.; Ahmed, F.; Powell, S.W.; Maloney, E.; Branson, M. Interactions between moisture and tropical convection. Part I: The Coevolution of Moisture and Convection. J. Atmos. Sci. 2020, 77, 1783–1799. [Google Scholar] [CrossRef]
- Barber, K.A.; Burleyson, C.D.; Feng, Z.; Hagos, S.M. The influence of shallow cloud populations on transitions to deep convection in the Amazon. J. Atmos. Sci. 2022, 79, 723–743. [Google Scholar] [CrossRef]
- Tomassini, L. The Interaction between Moist Convection and the Atmospheric Circulation in the Tropics. Bull. Am. Meteorol. Soc. 2020, 101, E1378–E1396. [Google Scholar] [CrossRef]
- Mitovski, T.; Folkins, I. Anomaly patterns about strong convective events in the tropics and midlatitudes: Observations from radiosondes and surface weather stations. J. Geophys. Res. Atmos. 2014, 119, 385–406. [Google Scholar] [CrossRef]
- Chakraborty, S.; Schiro, K.A.; Fu, R.; Neelin, J.D. On the role of aerosols, humidity, and vertical wind shear in the transition of shallow-to-deep convection at the Green Ocean Amazon 2014/5 site. Atmos. Chem. Phys. 2018, 18, 11135–11148. [Google Scholar] [CrossRef]
- Zeng, X. The relationship among precipitation, cloud-top temperature, and precipitable water over the Tropics. J. Clim. 1999, 12, 2503–2514. [Google Scholar] [CrossRef]
- Bretherton, C.S.; Peters, M.E.; Back, L.E. Relationships between Water Vapor Path and Precipitation over the Tropical Oceans. J. Clim. 2004, 17, 1517–1528. [Google Scholar] [CrossRef]
- Neelin, J.D.; Peters, O.; Hales, K. The transition to strong convection. J. Atmos. Sci. 2009, 66, 2367–2384. [Google Scholar] [CrossRef]
- Peters, O.; Neelin, J.D.; Nesbitt, S.W. Mesoscale Convective Systems and Critical Clusters. J. Atmos. Sci. 2009, 66, 2913–2924. [Google Scholar] [CrossRef]
- Adams, D.K.; Fernandes, R.M.S.; Holub, K.L.; Gutman, S.I.; Barbosa, H.M.J.; Machado, L.A.T.; Calheiros, A.J.P.; Bennett, R.A.; Kursinski, E.R.; Sapucci, L.F.; et al. The Amazon Dense GNSS Meteorological Network: A New Approach for Examining Water Vapor and Deep Convection Interactions in the Tropics. Bull. Am. Meteorol. Soc. 2015, 96, 2151–2165. [Google Scholar] [CrossRef]
- Rushley, S.S.; Kim, D.; Bretherton, C.S.; Ahn, M.-S. Reexamining the nonlinear moisture-precipitation relationship over the tropical oceans. Geophys. Res. Lett. 2018, 45, 1133–1140. [Google Scholar] [CrossRef]
- Serrano-Vincenti, S.; Condom, T.; Campozano, L.; Escobar, L.A.; Walpersdorf, A.; Carchipulla-Morales, D.; Villacís, M. Harmonic Analysis of the Relationship between GNSS Precipitable Water Vapor and Heavy Rainfall over the Northwest Equatorial Coast, Andes, and Amazon Regions. Atmosphere 2022, 13, 1809. [Google Scholar] [CrossRef]
- Schiro, K.A.; Neelin, J.D.; Adams, D.K.; Lintner, B.R. Deep convection and column water vapor over tropical land versus tropical ocean: A comparison between the Amazon and the tropical western Pacific. J. Atmos. Sci. 2016, 73, 4043–4063. [Google Scholar] [CrossRef]
- Ahmed, F.; Schumacher, C. Geographical differences in the tropical precipitation-moisture relationship and rain intensity onset. Geophys. Res. Lett. 2017, 44, 1114–1122. [Google Scholar] [CrossRef]
- Williams, E.; Rosenfeld, D.; Madden, N.; Gerlach, J.; Gears, N.; Atkinson, L.; Dunnemann, N.; Frostrom, G.; Antonio, M.; Biazon, B.; et al. Contrasting convective regimes over the Amazon: Implications for cloud electrification. J. Geophys. Res. Atmos. 2002, 107, LBA 50-1–LBA 50-19. [Google Scholar] [CrossRef]
- Williams, E.R.; Mushtak, V.; Rosenfeld, D.; Goodman, S.; Boccippio, D. Thermodynamic conditions favorable to superlative thunderstorm updraft, mixed phase microphysics and lightning flash rate. Atmos. Res. 2005, 76, 288–306. [Google Scholar] [CrossRef]
- Machado, L.A.T.; Dias, M.A.F.S.; Morales, C.; Fisch, G.; Vila, D.; Albrecht, R.; Goodman, S.J.; Calheiros, A.J.P.; Biscaro, T.; Kummerow, C.; et al. The Chuva Project: How Does Convection Vary across Brazil? Bull. Am. Meteorol. Soc. 2014, 95, 1365–1380. [Google Scholar] [CrossRef]
- Tanaka, L.M.S.; Satyamurty, P.; Machado, L.A.T. Diurnal variation of precipitation in central Amazon Basin. Int. J. Climatol. 2014, 34, 3574–3584. [Google Scholar] [CrossRef]
- Saraiva, I.; Silva Dias, M.A.F.; Morales, C.A.R.; Saraiva, J.M.B. Regional Variability of Rain Clouds in the Amazon Basin as Seen by a Network of Weather Radars. J. Appl. Meteorol. Climatol. 2016, 55, 2657–2675. [Google Scholar] [CrossRef]
- Anselmo, E.M.; Machado, L.A.T.; Schumacher, C.; Kiladis, G.N. Amazonian mesoscale convective systems: Life cycle and propagation characteristics. Int. J. Climatol. 2021, 41, 3968–3981. [Google Scholar] [CrossRef]
- Biscaro, T.S.; Machado, L.A.T.; Giangrande, S.E.; Jensen, M.P. What drives daily precipitation over the central Amazon? Differences observed between wet and dry seasons. Atmos. Chem. Phys. 2021, 21, 6735–6754. [Google Scholar] [CrossRef]
- Sapucci, C.R.; Mayta, V.C.; da Silva Dias, P.L. Evaluation of diverse-based precipitation data over the Amazon Region. Theor. Appl. Climatol. 2021, 149, 1167–1193. [Google Scholar] [CrossRef]
- Giangrande, S.E.; Feng, Z.; Jensen, M.P.; Comstock, J.M.; Johnson, K.L.; Toto, T.; Wang, M.; Burleyson, C.; Bharadwaj, N.; Mei, F.; et al. Cloud characteristics, thermodynamic controls and radiative impacts during the Observations and Modeling of the Green Ocean Amazon (GoAmazon2014/5) experiment. Atmos. Chem. Phys. 2017, 17, 14519–14541. [Google Scholar] [CrossRef]
- Giangrande, S.E.; Wang, D.; Mechem, D.B. Cloud regimes over the Amazon Basin: Perspectives from the GoAmazon2014/5 campaign. Atmos. Chem. Phys. 2020, 20, 7489–7507. [Google Scholar] [CrossRef]
- Giangrande, S.E.; Biscaro, T.S.; Peters, J.M. Seasonal controls on isolated convective storm drafts, precipitation intensity, and life cycle as observed during GoAmazon2014/5. Atmos. Chem. Phys. 2023, 23, 5297–5316. [Google Scholar] [CrossRef]
- Arakawa, A.; Schubert, W.H. Interaction of a cumulus cloud ensemble with the large-scale environment, Part I. J. Atmos. Sci. 1974, 31, 674–701. [Google Scholar] [CrossRef]
- Kain, J.S.; Fritsch, J.M. Convective Parameterization for Mesoscale Models: The Kain-Fritsch Scheme. In The Representation of Cumulus Convection in Numerical Models, 1st ed.; Emanuel, K.A., Raymond, D.J., Eds.; Meteorological Monographs; American Meteorological Society: Boston, MA, USA, 1993; Volume 24, pp. 165–170. [Google Scholar] [CrossRef]
- Zhang, G.J.; McFarlane, N.A. Sensitivity of climate simulations to the parameterization of cumulus convection in the Canadian climate centre general circulation model. Atmos. Ocean. 1995, 33, 407–446. [Google Scholar] [CrossRef]
- Adams, D.K.; Rennó, N.O. Remarks on quasi-equilibrium theory. J. Atmos. Sci. 2013, 60, 178–181. [Google Scholar] [CrossRef]
- Yano, J.-I.; Bister, M.; Fuchs, Ž.; Gerard, L.; Phillips, V.T.J.; Barkidija, S.; Piriou, J.-M. Phenomenology of convection-parameterization closure. Atmos. Chem. Phys. 2013, 13, 4111–4131. [Google Scholar] [CrossRef]
- Bechtold, P.; Semane, N.; Lopez, P.; Chaboureau, J.-P.; Beljaars, A.; Bormann, N. Representing equilibrium and nonequilibrium convection in large-scale models. J. Atmos. Sci. 2014, 71, 734–753. [Google Scholar] [CrossRef]
- Sobel, A.H.; Yuter, S.E.; Bretherton, C.S.; Kiladis, G.N. Large-scale meteorology and deep convection during TRMM KWAJEX. Mon. Weather Rev. 2004, 132, 422–444. [Google Scholar] [CrossRef]
- Yano, J.I.; Chaboureau, J.P.; Guichard, F. A generalization of CAPE into potential-energy convertibility. Q. J. R. Meteorol. Soc. 2005, 131, 861–875. [Google Scholar] [CrossRef]
- Adams, D.K.; Souza, E.P. CAPE and convective events in the Southwest during the North American monsoon. Mon. Weather Rev. 2009, 137, 83–98. [Google Scholar] [CrossRef]
- Viscardi, L.A.M.; Torri, G.; Adams, D.K.; Barbosa, H.D.M.J. Environmental controls on isolated convection during the Amazonian wet season. Atmos. Chem. Phys. 2024, 24, 8529–8548. [Google Scholar] [CrossRef]
- Lintner, B.R.; Adams, D.K.; Schiro, K.A.; Stansfield, A.M.; Amorim Rocha, A.A.; Neelin, J.D. Relationships among climatological vertical moisture structure, column water vapor, and precipitation over the central Amazon in observations and CMIP5 models. Geophys. Res. Lett. 2017, 44, 1981–1989. [Google Scholar] [CrossRef]
- Zhuang, Y.; Fu, R.; Marengo, J.A.; Wang, H. Seasonal variation of shallow-to-deep convection transition and its link to the environmental conditions over the Central Amazon. J. Geophys. Res. Atmos. 2017, 122, 2649–2666. [Google Scholar] [CrossRef]
- Schiro, K.A.; Neelin, J.D. Deep convective organization, moisture vertical structure, and convective transition using deep-inflow mixing. J. Atmos. Sci. 2019, 76, 965–987. [Google Scholar] [CrossRef]
- Chakraborty, S.; Jiang, J.H.; Su, H.; Fu, R. Deep convective evolution from shallow clouds over the Amazon and Congo rainforests. J. Geophys. Res. Atmos. 2020, 125, e2019JD030962. [Google Scholar] [CrossRef]
- Kumar, V.V.; Protat, A.; May, P.T.; Jakob, C.; Penide, G.; Kumar, S.; Davies, L. On the effects of large-scale environment and surface types on convective cloud characteristics over Darwin, Australia. Mon. Weather Rev. 2013, 141, 1358–1374. [Google Scholar] [CrossRef]
- Louf, V.; Jakob, C.; Protat, A.; Bergemann, M.; Narsey, S. The relationship of cloud number and size with their large-scale environment in deep tropical convection. Geophys. Res. Lett. 2019, 46, 9203–9212. [Google Scholar] [CrossRef]
- Retsch, M.H.; Jakob, C.; Singh, M.S. Identifying relations between deep convection and the large-scale atmosphere using explainable artificial intelligence. J. Geophys. Res. Atmos. 2022, 127, e2021JD035388. [Google Scholar] [CrossRef]
- Bergemann, M.; Jakob, C. How important is tropospheric humidity for coastal rainfall in the tropics? Geophys. Res. Lett. 2016, 43, 5860–5868. [Google Scholar] [CrossRef]
- Stevens, B.; Brogniez, H.; Kiemle, C.; Lacour, J.L.; Crevoisier, C.; Kiliani, J. Structure and Dynamical Influence of Water Vapor in the Lower Tropical Troposphere. Surv. Geophys. 2017, 38, 1371–1397. [Google Scholar] [CrossRef]
- de Souza, V.A.S.; Moreira, D.M.; Rotunno Filho, O.C.; Rudke, A.P.; Andrade, C.D.; De Araujo, L.M.N. Spatio-temporal analysis of remotely sensed rainfall datasets retrieved for the transboundary basin of the Madeira River in Amazonia. Atmósfera 2021, 35, 39–66. [Google Scholar] [CrossRef]
- Hernandez-Deckers, D. Features of atmospheric deep convection in Northwestern South America obtained from infrared satellite data. Q. J. R. Meteorol. Soc. 2022, 148, 338–350. [Google Scholar] [CrossRef]
- Minjarez-Sosa, C.M.; Castro, C.L.; Cummins, K.L.; Krider, E.P.; Waissmann, J. Toward development of improved QPE in complex terrain using cloud-to-ground lightning data: A case study for the 2005 monsoon in southern Arizona. J. Hydrometeorol. 2012, 13, 1855–1873. [Google Scholar] [CrossRef]
- Minjarez-Sosa, C.M.; Castro, C.L.; Cummins, K.L.; Waissmann, J.; Adams, D.K. An improved QPE over complex terrain employing cloud-to-ground lightning occurrences. J. Appl. Meteorol. Climatol. 2017, 56, 2489–2507. [Google Scholar] [CrossRef]
- Holle, R.L.; Murphy, M.J. Lightning in the North American monsoon: An exploratory climatology. Mon. Weather Rev. 2015, 143, 1970–1977. [Google Scholar] [CrossRef]
- Etten-Bohm, M.; Yang, J.; Schumacher, C.; Jun, M. Evaluating the relationship between lightning and the large-scale environment and its use for lightning prediction in global climate models. J. Geophys. Res. Atmos. 2021, 126, e2020JD033990. [Google Scholar] [CrossRef]
- Zipser, E.J.; Cecil, D.J.; Liu, C.; Nesbitt, S.W.; Yorty, D.P. Where are the most intense thunderstorms on Earth? Bull. Am. Meteorol. Soc. 2006, 87, 1057–1072. [Google Scholar] [CrossRef]
- Albrecht, R.I.; Goodman, S.J.; Buechler, D.E.; Blakeslee, R.J.; Christian, H.J. Where are the lightning hotspots on Earth? Bull. Am. Meteorol. Soc. 2016, 97, 2051–2068. [Google Scholar] [CrossRef]
- Liu, N.; Liu, C.; Chen, B.; Zipser, E. What are the favorable large-scale environments for the highest-flash-rate thunderstorms on Earth? J. Atmos. Sci. 2020, 77, 1583–1612. [Google Scholar] [CrossRef]
- Greco, S.; Swap, R.; Garstang, M.; Ulanski, S.; Shipham, M.; Harriss, R.C.; Talbot, R.; Andreae, M.O.; Artaxo, P. Rainfall and surface kinematic conditions over central Amazonia during ABLE 2B. J. Geophys. Res. Atmos. 1990, 95, 17001–17014. [Google Scholar] [CrossRef]
- Garstang, M.; Massie, H.L., Jr.; Halverson, J.; Greco, S.; Scala, J. Amazon Coastal Squall Lines. Part I: Structure and Kinematics. Mon. Weather Rev. 1994, 122, 608–622. [Google Scholar] [CrossRef]
- Cohen, J.C.; Silva Dias, M.A.; Nobre, C.A. Environmental conditions associated with Amazonian squall lines: A case study. Mon. Weather Rev. 1995, 123, 3163–3174. [Google Scholar] [CrossRef]
- Alcântara, C.R.; Silva-Dias, M.A.F.; Souza, E.P.; Cohen, J.C.P. Verification of the role of the low level jets in Amazon Squall lines. Atmos. Res. 2011, 100, 36–44. [Google Scholar] [CrossRef]
- Campos, T.B.; Sapucci, L.F.; Eichholz, C.; Machado, L.A.T.; Adams, D.K. The Sensitivity of GPS Precipitable Water Vapor Jumps to Intense Precipitation Associated with Tropical Organized Convective Systems. Atmosphere 2023, 14, 262. [Google Scholar] [CrossRef]
- Mapes, B.E.; Warner, T.T.; Xu, M. Diurnal Patterns of Rainfall in Northwestern South America. Part III: Diurnal Gravity Waves and Nocturnal Convection Offshore. Mon. Weather Rev. 2003, 131, 830–844. [Google Scholar] [CrossRef]
- Ahmed, F.; Schumacher, C. Convective and stratiform components of the precipitation-moisture relationship. Geophys. Res. Lett. 2015, 42, 10,453–10,462. [Google Scholar] [CrossRef]
- Torri, G.; Adams, D.K.; Wang, H.; Kuang, Z. On the diurnal cycle of GPS-derived precipitable water vapor over Sumatra. J. Atmos. Sci. 2019, 76, 3529–3552. [Google Scholar] [CrossRef]
- Germano, M.F.; Oyama, M.D. Local circulation features in the Eastern Amazon: High-resolution simulations. J. Aerosp. Technol. Man. 2020, 12, e0820. [Google Scholar] [CrossRef]
- Kousky, V.E. Diurnal rainfall variation in northeast Brazil. Mon. Weather Rev. 1980, 108, 488–498. [Google Scholar] [CrossRef]
- Oliveira, F.P.; Oyama, M.D. Antecedent atmospheric conditions related to squall-line initiation over the northern coast of Brazil in July. Weather Forecast. 2015, 30, 1254–1264. [Google Scholar] [CrossRef]
- da Silva, L.M.; Santos da Mota, M.A. Thermodynamic analysis of convective events that occurred in Belém PA city. Atmósfera 2022, 35, 331–355. [Google Scholar] [CrossRef]
- Cummins, K.L.; Murphy, M.J. An overview of lightning locating systems: History, techniques, and data uses, with an in-depth look at the US NLDN. IEEE Trans. Electromagn. Compat. 2009, 51, 499–518. [Google Scholar] [CrossRef]
- Nag, A.; Murphy, M.J.; Schulz, W.; Cummins, K.L. Lightning locating systems: Insights on characteristics and validation techniques. Earth Space Sci. 2015, 2, 65–93. [Google Scholar] [CrossRef]
- Said, R.K.; Murphy, M. GLD360 upgrade: Performance analysis and applications. Extended Abstracts. In Proceedings of the 24th International Lightning Detection Conference and Sixth International Lightning Meteorology Conference, San Diego, CA, USA, 18–21 April 2016; p. 8. Available online: https://www.vaisala.com/sites/default/files/documents/Ryan%20Said%20and%20Martin%20Murphy.%20GLD360%20Upgrade%20Performance%20Analysis%20and%20Applications.pdf (accessed on 3 April 2025).
- Williams, E.; Weber, M.; Orville, R. The relationship between lightning type and convective state of thunderclouds. Geophys. Res. Atmos. 1989, 94, 13213–13220. [Google Scholar] [CrossRef]
- Mattos, E.V.; Machado, L.A.T. Cloud-to-ground lightning and Mesoscale Convective Systems. Atmos. Res. 2011, 99, 377–390. [Google Scholar] [CrossRef]
- Vagasky, C. (University of Wisconsin-Madison, Madison, WI, USA). Personal e-mail communication, 2022.
- Said, R.K.; Inan, U.; Cummins, K. Long-range lightning geolocation using a VLF radio atmospheric waveform bank. Geophys. Res. Atmos. 2010, 115, D23108. [Google Scholar] [CrossRef]
- Said, R.K.; Cohen, M.B.; Inan, U.S. Highly intense lightning over the oceans: Estimated peak currents from global GLD360 observations. J. Geophys. Res. Atmos. 2013, 118, 6905–6915. [Google Scholar] [CrossRef]
- Serra, Y.L.; Adams, D.K.; Minjarez-Sosa, C.; Moker, J.M., Jr.; Arellano, A.F.; Castro, C.L.; Quintanar, A.I.; Alatorre, L.; Granados, A.; Vazquez, G.E.; et al. The North American monsoon GPS transect experiment 2013. Bull. Am. Meteorol. Soc. 2016, 97, 2103–2115. [Google Scholar] [CrossRef]
- Hacker, B. (Xweather Technical Services, Vaisala, Vantaa, Finland). Personal e-mail communication, 2024.
- Eddy, A.J.; MacGorman, D.R.; Homeyer, C.R.; Williams, E. Intraregional comparisons of the near-storm environments of storms dominated by frequent positive versus negative cloud-to-ground flashes. Earth Space Sci. 2021, 8, e2020EA001141. [Google Scholar] [CrossRef]
- Huffman, G.J.; Adler, R.F.; Behrangi, A.; Bolvin, D.T.; Nelkin, G.G.; Ehsani, M.R. The new version 3.2 Global Precipitation Climatology Project (GPCP) monthly and daily precipitation products. J. Clim. 2023, 36, 7635–7655. [Google Scholar] [CrossRef]
- Mattioli, V.; Westwater, E.R.; Cimini, D.; Liljegren, J.S.; Lesht, B.M.; Gutman, S.I.; Schmidlin, F.J. Analysis of radiosonde and groud-based remotely sensed pwv data from the 2004 North Slope of Alaska Artic Winter Radiometric Experiment. J. Atmos. Ocean. Technol. 2007, 24, 415–431. [Google Scholar] [CrossRef]
- Leblanc, T.; Walsh, T.D.; McDermid, I.S.; Toon, G.C.; Blavier, J.-F.; Haines, B.; Read, W.G.; Herman, B.; Fetzer, E.; Sander, S.; et al. Measurements of Humidity in the Atmosphere and Validation Experiments (MOHAVE)-209: Overview of campaign operations and results. Atmos. Meas. Tech. 2011, 4, 2579–2605. [Google Scholar] [CrossRef]
- Cho, H.-K.; Bowman, K.P.; North, G.R. A Comparison of Gamma and Lognormal Distributions for Characterizing Satellite Rain Rates from the Tropical Rainfall Measuring Mission. J. Appl. Meteorol. Clim. 2004, 43, 1586–1597. [Google Scholar] [CrossRef]
- Martinez-Villalobos, C.; Neelin, J.D. Why do precipitation intensities tend to follow Gamma distributions? J. Atmos. Sci. 2019, 76, 3611–3631. [Google Scholar] [CrossRef]
- Williams, E.; Renno, N. An analysis of the conditional instability of the tropical atmosphere. Mon. Weather Rev. 1991, 121, 21–36. [Google Scholar] [CrossRef]
- Roff, G.R.; Yano, J.-I. Tropical convective variability in the CAPE phase space. Q. J. R. Meterol. Soc. 2002, 128, 2317–2333. [Google Scholar] [CrossRef]
- Ahmed, F.; Neelin, J.D. Reverse Engineering the Tropical Precipitation–Buoyancy Relationship. J. Atmos. Sci. 2018, 75, 1587–1608. [Google Scholar] [CrossRef]
- Ahmed, F.; Adames, A.F.; Neelin, J.D. Deep convective adjustment of temperature and moisture. J. Atmos. Sci. 2020, 77, 2163–2186. [Google Scholar] [CrossRef]
- Mendoza, R.R.; Mota, M.A.S. Analysis of precipitation in Belém-PA city (period 1967–2016). Int. J. Hydro. 2018, 2, 312–317. [Google Scholar] [CrossRef]
- Edwards, R.; Thompson, R.L. Reversible CAPE in tropical cyclone tornado regimes. In Proceedings of the 27th Conference on Severe Local Storms, Madison, WI, USA, 3–7 November 2014; p. 88. Available online: https://ams.confex.com/ams/27SLS/webprogram/Paper254328.html (accessed on 3 January 2025).
- Sapucci, L.F.; Machado, L.A.T.; Menezes de Souza, E.; Campos, T.B. GPS-PWV jumps before intense rain events. Atmos. Meas. Tech. 2016. preprint. [Google Scholar] [CrossRef]


Disclaimer/Publisher’s Note: The statements, opinions and data contained in all publications are solely those of the individual author(s) and contributor(s) and not of MDPI and/or the editor(s). MDPI and/or the editor(s) disclaim responsibility for any injury to people or property resulting from any ideas, methods, instructions or products referred to in the content. |
© 2026 by the authors. Licensee MDPI, Basel, Switzerland. This article is an open access article distributed under the terms and conditions of the Creative Commons Attribution (CC BY) license.