Article

Spatiotemporal Analysis of Air Pollutants in Thessaloniki, Greece

by
Anthi Chatzopoulou
* and
Ilias Mavroidis
Waste Management, School of Science and Technology, Hellenic Open University, 263 35 Patras, Greece
*
Author to whom correspondence should be addressed.
Atmosphere 2025, 16(9), 1057; https://doi.org/10.3390/atmos16091057
Submission received: 31 July 2025 / Revised: 31 August 2025 / Accepted: 4 September 2025 / Published: 8 September 2025
(This article belongs to the Special Issue Air Quality in Metropolitan Areas and Megacities (Second Edition))

Abstract

This study investigates the variability of major air pollutants, such as nitrogen oxides (NOx, including nitric oxide (NO) and nitrogen dioxide (NO2)), ozone (O3), and particulate matter with a diameter ≤ 10 µm (PM10), in Thessaloniki over the period 2001–2022, highlighting their evolution in response to vehicle technology adoption and the COVID-19 pandemic. Four monitoring stations representing urban traffic, urban background, urban industrial, and suburban industrial environments were analyzed. PM10 concentrations generally decreased until 2015 but rose thereafter, mainly due to increased petrol car usage, with the highest levels recorded at the urban traffic station during colder months, influenced by domestic heating and local wind patterns. NO and NO2 concentrations peaked at urban traffic and industrial sites, closely linked to vehicle emissions and industrial activities, respectively, with notable reductions during the 2020 COVID-19 lockdown. O3 levels showed steady trends with diurnal and seasonal variability inversely related to NOx concentrations and positively correlated with temperature. Despite some pollutant reductions, air quality issues persist in Thessaloniki. The findings emphasize the need for robust governmental policies promoting cleaner heating alternatives; two policy scenarios are presented in this respect with the corresponding air pollutant concentrations estimates up to 2035.

1. Introduction

According to the World Health Organization (WHO), air pollution is defined as the infection of the indoor or outdoor environment with any chemical, biological, or physical substance that causes modifications in the natural characteristics of the atmosphere. Indoor and outdoor air pollution are responsible for the premature death of 7 million people annually [1]. Some of the main air pollutants are the ozone (O3), nitrogen oxides (NOx), i.e., the sum of nitric oxide (NO) and nitrogen dioxide (NO2), and particulate matter with a diameter ≤ 10 µm (PM10) [2]. Exposure to polluted atmospheric environments has countless impacts, leading to severe health problems and significant changes to ecosystems (e.g., [3,4,5]).
The main air pollutants examined in this study, i.e., NOx, O3, and PM10, arise from both anthropogenic and natural sources [3]. In urban areas like Thessaloniki, Greece, NOx emissions predominantly originate from fossil fuel combustion, especially road transport and industrial activity, while natural sources mainly include soil emissions and the lighting [6,7,8]. Air pollutants released directly in the atmosphere, such as for example CO and NO are called primary air pollutants, while others that are formed as oxidized products photochemically, are called secondary pollutants [9,10]. O3 is a secondary pollutant, formed photochemically through the interaction of NOx and volatile organic compounds (VOCs) under sunlight [11,12,13]. The tropospheric concentrations of O3 and NO2 are strongly interlinked with a negative correlation, meaning that when NO2 has high concentrations, O3 is at its lowest levels and vice versa. Other studies have shown that in urban cities with heavy traffic, the ratio of ΝO2/ΝOx is higher in comparison with other regions with less traffic [14,15]. PM10 emissions in urban areas stem from vehicle exhaust, road dust resuspension, non-exhaust sources such as brake and tire wear, and central domestic heating [16,17].
Meteorological factors such as wind speed and temperature strongly influence the dispersion and formation of these pollutants [18]. The correlation between PM and wind has been investigated in many cities, including also Thessaloniki, showing that when wind speed increases, primary air pollutants (including PM) decrease [18,19]. Other studies have shown that there is a correlation among O3 concentrations and temperature. Increases in temperature are linked with increases in rates of chemical reactions [20,21,22] and the production of O3. Temperature changes influence O3 levels also indirectly through changes in the O3 precursors [23].
Air pollution is a significant environmental problem worldwide. Data showed that each year around 300,000 persons die prematurely in Europe, due to polluted air [24]. So far, transport-related emission decreased across European countries during the period from 1990 to 2022. Concerning PM10 and NOx compounds, the reductions were almost 50% (46% and 51%, respectively). During the COVID-19 pandemic, emissions were even lower (i.e., pollutants reduction was higher), as transport activities were minimized [25]. Some countries, especially in western Europe, have already replaced vehicles with advanced technology catalytic vehicles, a measure which improves air quality more in terms of NOx emissions [25,26]. In the case of PM10, despite a general reduction in emissions, these continue to contribute significantly to air pollution due to releases from non-exhaust sources. Studies have shown that PM10 emissions from non-exhaust processes increased from 45% in 2010 to 69% in 2020 [27]. A study conducted in a region of Germany showed that nearly 80% of PM emissions from vehicles originated from abrasion [13]. In the coming years, it will be highly challenging to monitor whether reduced emissions will persist, particularly as car ownership and usage continue to rise, especially in developing countries and Eastern Europe [26]. In addition, there are concerns regarding whether the new technologies in diesel vehicles, which aim to reduce PM10 emissions, will contribute to an increase in NOx emissions, and consequently to higher NO2 emissions in urban areas [28].
This study aims to analyze the long-term trends of PM10, NO, NO2, and O3 in the domestic region of Thessaloniki, Greece, from 2001 to 2022, in order to estimate their evolution in terms of adoption of new vehicle technologies as well as under the impact of the COVID-19 pandemic. In addition, the study explores the NO2/NOx ratio, the correlation of the meteorological effects with PM10 and O3 concentrations, as well as future projections up to 2035 under two distinct emission scenarios. Air quality issues in Thessaloniki, a major urban area in Greece with air quality challenges. become more pronounced during winter, due to a significant increase in PM10 emissions from domestic heating, combined with year-round emissions from vehicles [26,27]. The present study uses updated air pollution data, emphasizing also the inter-variability of the air pollutants and the meteorological parameters. Additionally, this study explores future policy pathways that remain only partially reflected in current legislative frameworks.

2. Study Area, Data, and Methodology

2.1. Study Area

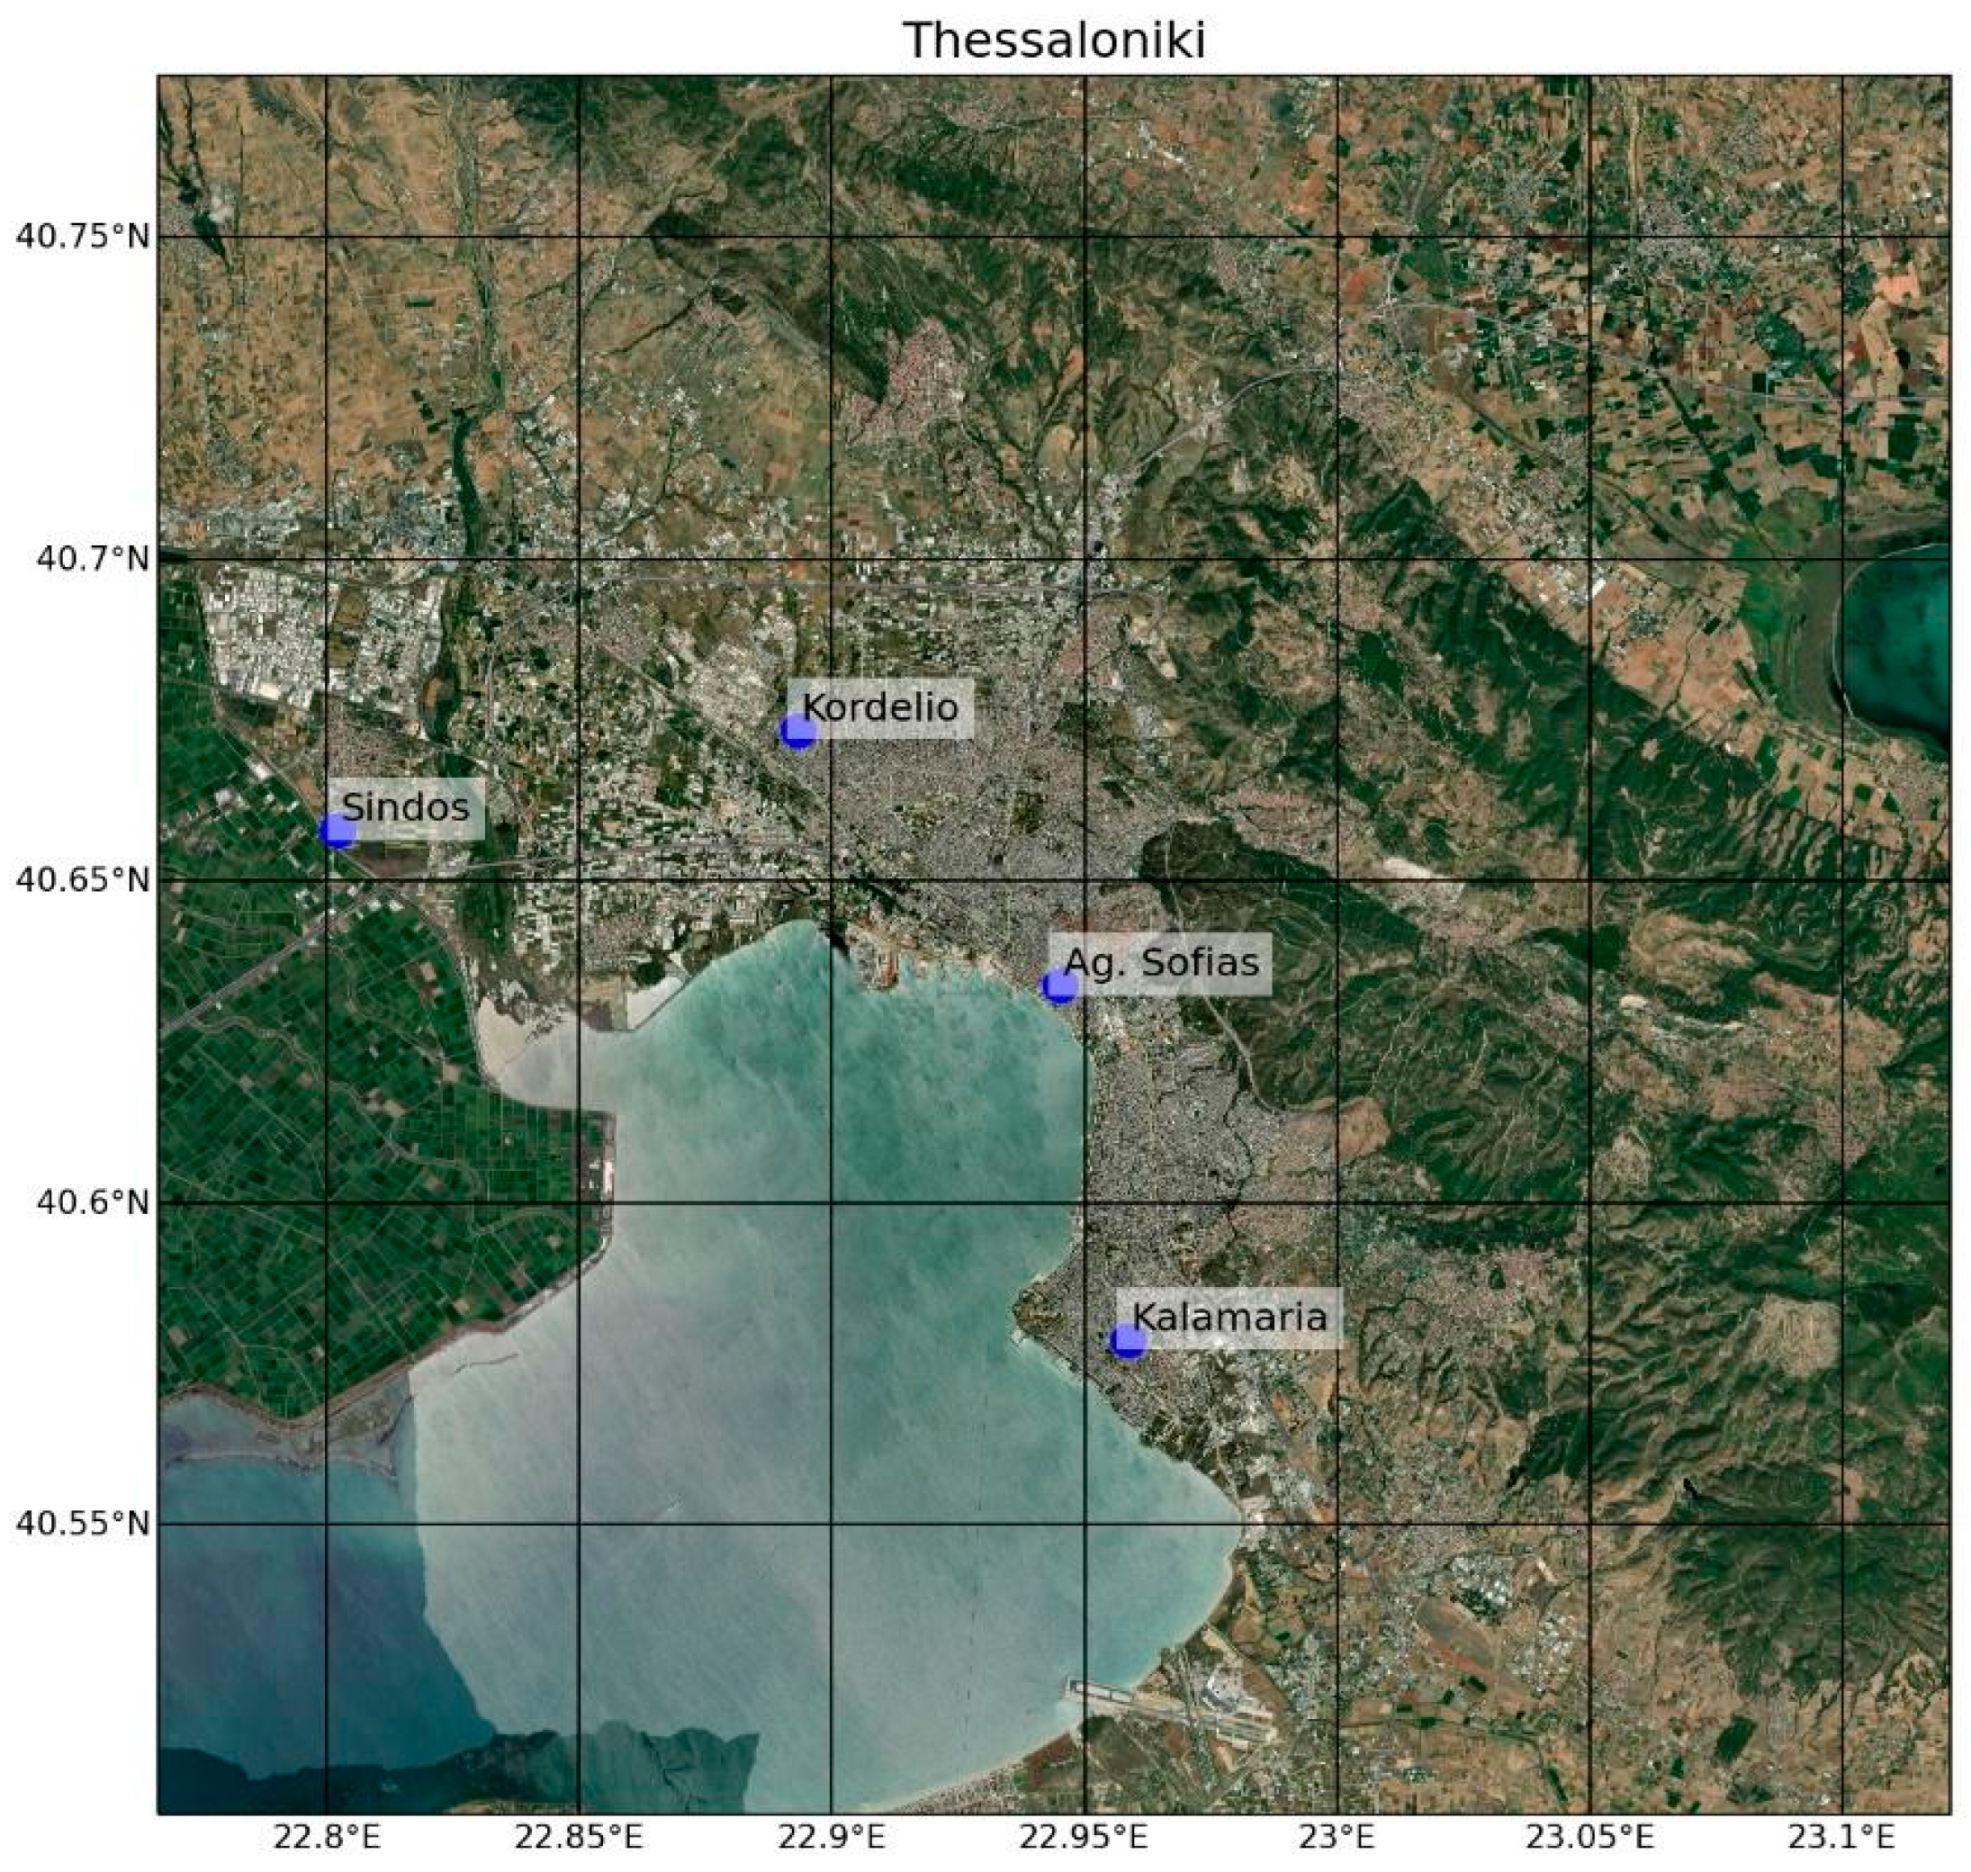
The study area is the geographical region of Thessaloniki, the second-largest city of Greece, located in the Northern part of the country with 1,092,919 inhabitants (i.e., approximately the 10% of the total population of Greece) [29]. The Thermaikos Gulf stretches across the region of Thessaloniki and hosts the large port of Thessaloniki as it is illustrated on the map of Figure 1. This port serves as a natural maritime gateway, strategically located to facilitate trade between the Balkan Peninsula and the rest of the world.
Thessaloniki has large industrial activity, with the industrial sector of the prefecture accounting for up to the 17% of the country’s total activity [30]. The air quality in Thessaloniki, apart from the emissions from the ships in the harbor, is affected by the road transport. According to the most recent census of the Hellenic Statistical Authority [29] in the region, around half of the population in Thessaloniki own at least one car, while around 20% have two, and only around 30% do not own a car. Another pollution source is domestic heating during the cold months. The majority of the houses (97.6%) have a heating system, with approximately 78% having a central heating supply, while the remaining 20% rely on individual heating sources [29]. The financial crisis (2009–2018) led to intense air pollution episodes during the winter months, due to lower quality of combustion material/biomass [31]. During the financial crisis, the air pollution problem was greater from the biomass burning not only in the city center, but also in the residential areas, exposing a large number of citizens in high toxic PM concentrations [32]. Finally, another significant contributor to air pollution in Thessaloniki is industrial activity, which is mainly located in the western part of the city [32]. The main industrial units in the city suburbs are dealing with oil, steel, petrochemicals, textiles, machinery, flour, cement, pharmaceuticals, and liquor.

2.2. Data and Methodology

The Ministry of Environment and Energy of Greece has established a network of in situ stations for the monitoring of air quality [33]. For the purposes of the present study, four stations in the district of Thessaloniki were chosen (Figure 1). The stations were selected according to data availability and with the criteria of including different types of monitoring stations and of covering a large spatial area. Table 1 presents the names, types, and coordinates of the air pollution stations.
The pollutants analyzed here are NO, NO2, PM10, and O3, as their concentrations are of high interest for the region. The period considered spans from 2001 to 2022 and the data used are hourly mean values, except for PM10, when daily mean values are used. For each station and each pollutant, the annual mean concentrations were calculated as time-series, as well as the monthly mean concentrations averaged across all years. For NOx and O3, also the diurnal variability of the pollutants is presented. Additionally, to provide some insights about the emissions sources, we calculated the ratio of NO2/NOx (low values of the ratio are indicative of high-traffic regions [14]). The correlation between O3 and NO2 concentrations is also presented. However, data were not available for all years during the period under consideration, resulting in some discontinuities in the time-series for certain stations (see also Table A1 in Appendix A).
Regarding meteorological data, four stations located close to the air pollution monitoring stations were selected, as described in Table 1. The stations’ coordinates, elevations, and distances (as straight lines based on the Euclidean approximation) from the corresponding air quality sites are included to demonstrate their spatial representativeness. The data are obtained from the National Observatory of Athens (NOA) website (https://meteosearch.meteo.gr/data/index.cfm (accessed on 16 November 2023)). The year used for the meteorological data is 2022, chosen because it is a recent year for which complete datasets for all stations throughout the year exist. It was a year without extreme weather phenomena, making it representative of normal conditions. The meteorological variables used are wind speed, wind direction, and temperature, given as daily mean values. Wind data were used to investigate the effect of winds on PM10 concentrations, while the covariance of temperature and ozone concentrations is also analyzed. The proximity of the selected stations (ranging from 1.1 to 5.5 km from the air pollution sites) ensures that the meteorological data generally reflect the conditions affecting pollutant dispersion and transformation in the study area, although small-scale urban effects and geometries (e.g., street canyon or building-induced turbulence) may introduce some uncertainties.
The last part of our work deals with the future trends of PM10 and NOx up to 2035, developing two future potential scenarios based on the implementation of different policies which aim to minimize these emissions.
According to studies, the road sector contributes to the 47% of the NOx concentrations and 38% of PM10, while the residential heating is responsible for the 62% of the PM10 concentrations as annual contribution [34,35,36]. The first scenario assumes the replacement of vehicles with zero-emission vehicles (hereafter namely Scenario A) aiming at the reduction of both NOx and PM10, while the second scenario is based on the first scenario with the addition of an upgrade of the residential heating systems (hereafter namely Scenario B) aiming to a further reduction of PM10. In addition, a base scenario is also used, based on the current trends of emissions of air pollutants, extrapolated up to 2035.
These scenarios reflect potential outcomes under moderate and ambitious air quality improvement strategies. So far, some measures and actions for the reduction of the air pollutants have been taken, such as the ban of diesel vehicles of older design, the replacement of public transport vehicles with electric vehicles, and the construction of an underground metro. However, these measures have not resolved the air pollution problem from traffic although they have contributed to improve air quality.
Regarding residential heating, governments have introduced a comprehensive set of policies and initiatives aligned with broader climate goals. These include energy efficiency renovation programs, the promotion of heat pumps, and financial incentives for use of cleaner fuel. Despite their positive impact, these measures alone are not enough to eliminate or substantially reduce emissions from heating systems. Therefore, in Scenario B, a complete upgrade of heating systems is assumed, through the adoption of advanced, low-emission technologies.
Although the scenarios are adjusted to reflect full sectoral coverage, the real-world implementation of such scenarios remains partial and this is reflected here. Scenario A is expected to be applied in approximately 50% of the cases, while Scenario B is expected to be applied in approximately 55% of the cases [37,38]. At this point, it should be noted that air pollutant emissions do not directly determine the concentrations measured. Several dynamic factors, such as weather conditions, atmospheric dispersion, and chemical reactions, significantly influence pollutant concentrations [39]. Therefore, the emission-to-concentration conversion factor for both NOx and PM10 is set at 60%, reflecting that these pollutants are primarily emitted at the local level and mostly exist as primary air pollutants. Table 2 presents these considerations for the two air pollutants, as they have been estimated for the two sectors under study, namely transport and central heating.
Table 3 shows the estimated reductions in PM10 and NOx concentrations in 2035 following the implementation of the measures set out in the two scenarios. These values have been calculated by taking into account each sector’s contribution to these pollutants’ emissions, the percentage of citizens who have adopted the measure, and the emission-to-concentration conversion factor of Table 2. Since PM10 emissions originate from both transport and heating, the 33% reduction in Scenario B of Table 2 reflects the combined impact of these two sectors, while NOx emissions are generated solely by the transport sector so they remain the same in both scenarios.

3. Results

The diagrams presented at this section describe the daily or monthly variability of the air pollutants, as well as their trends as annual means. In addition, the covariance of various nitrogen compounds is presented, along with the correlated variation of NO2 with O3 concentrations. Finally, the correlation between PM10 concentrations and wind is examined, as well as the annual variability of O3 with temperature.

3.1. PM10

Figure 2 presents the measurements of PM10 concentrations per station over the region of Thessaloniki. The left diagram of the Figure shows the annual mean concentrations of PM10 for the years 2001–2022, as they have been calculated from the daily mean measurements provided for the four stations. The right side illustrates the mean monthly values of the pollutant from the whole period of study.
From the diagram with the annual means, it is shown that the stations exhibit a downward trend over the years until 2015, when concentrations increase, to drop again after 2018. Notably high concentrations are recorded at Agias Sofia urban–traffic station (22.1–70.8 μg/m3) and then at Kordelio urban–industrial station (27.2–68.8 μg/m3). In certain years (i.e., 2011, 2015, 2016), Sindos suburban–industrial station records the highest concentrations, probably due to the low concentrations recorded at the other stations coupled with increased industrial activity at Sindos industrial area. Kalamaria urban–background station records low concentrations ranging from 24.04 μg/m3 to 46.64 μg/m3 for the years with available data.
The diagram with the monthly variability of PM10 concentrations (Figure 2b) depicts that the highest PM10 concentrations are observed in the colder months of the year, with the maximum observed in November. The standard deviation of these averaged values is higher in stations with higher concentrations such as Agias Sofias and Kordelio, while the values are more enhanced during October and November, where concentrations are also higher (see also Table A2 and Figure A1 in Appendix A). According to other studies, this seasonal variability is typical for the region (e.g., [40]) and for other sites of Greece as well (e.g., [41]). This increase in PM10 during the colder months is linked with the emissions from domestic heating, which are one of the main contributors of PM10 [42], coupled with increased traffic and adverse meteorological conditions. In addition, the financial crisis (especially during the period 2009–2018), led many households to burn lower-quality wooden material, a practice that led to increased pollutant emissions, including PM10 particles [32,43].
While PM10 concentrations of Kordelio and Sindos stations are mainly attributed to industrial activities and household heating, the concentrations of Agias Sofia station primarily originate from vehicle emissions. Around 2015, the adoption of petrol cars increased rapidly, and from that year onward, the concentrations recorded at Agias Sofias station also increased [44], while after 2018 they started decreasing, probably due to measures taken coupled with the COVID-19 pandemic.

3.2. NOx

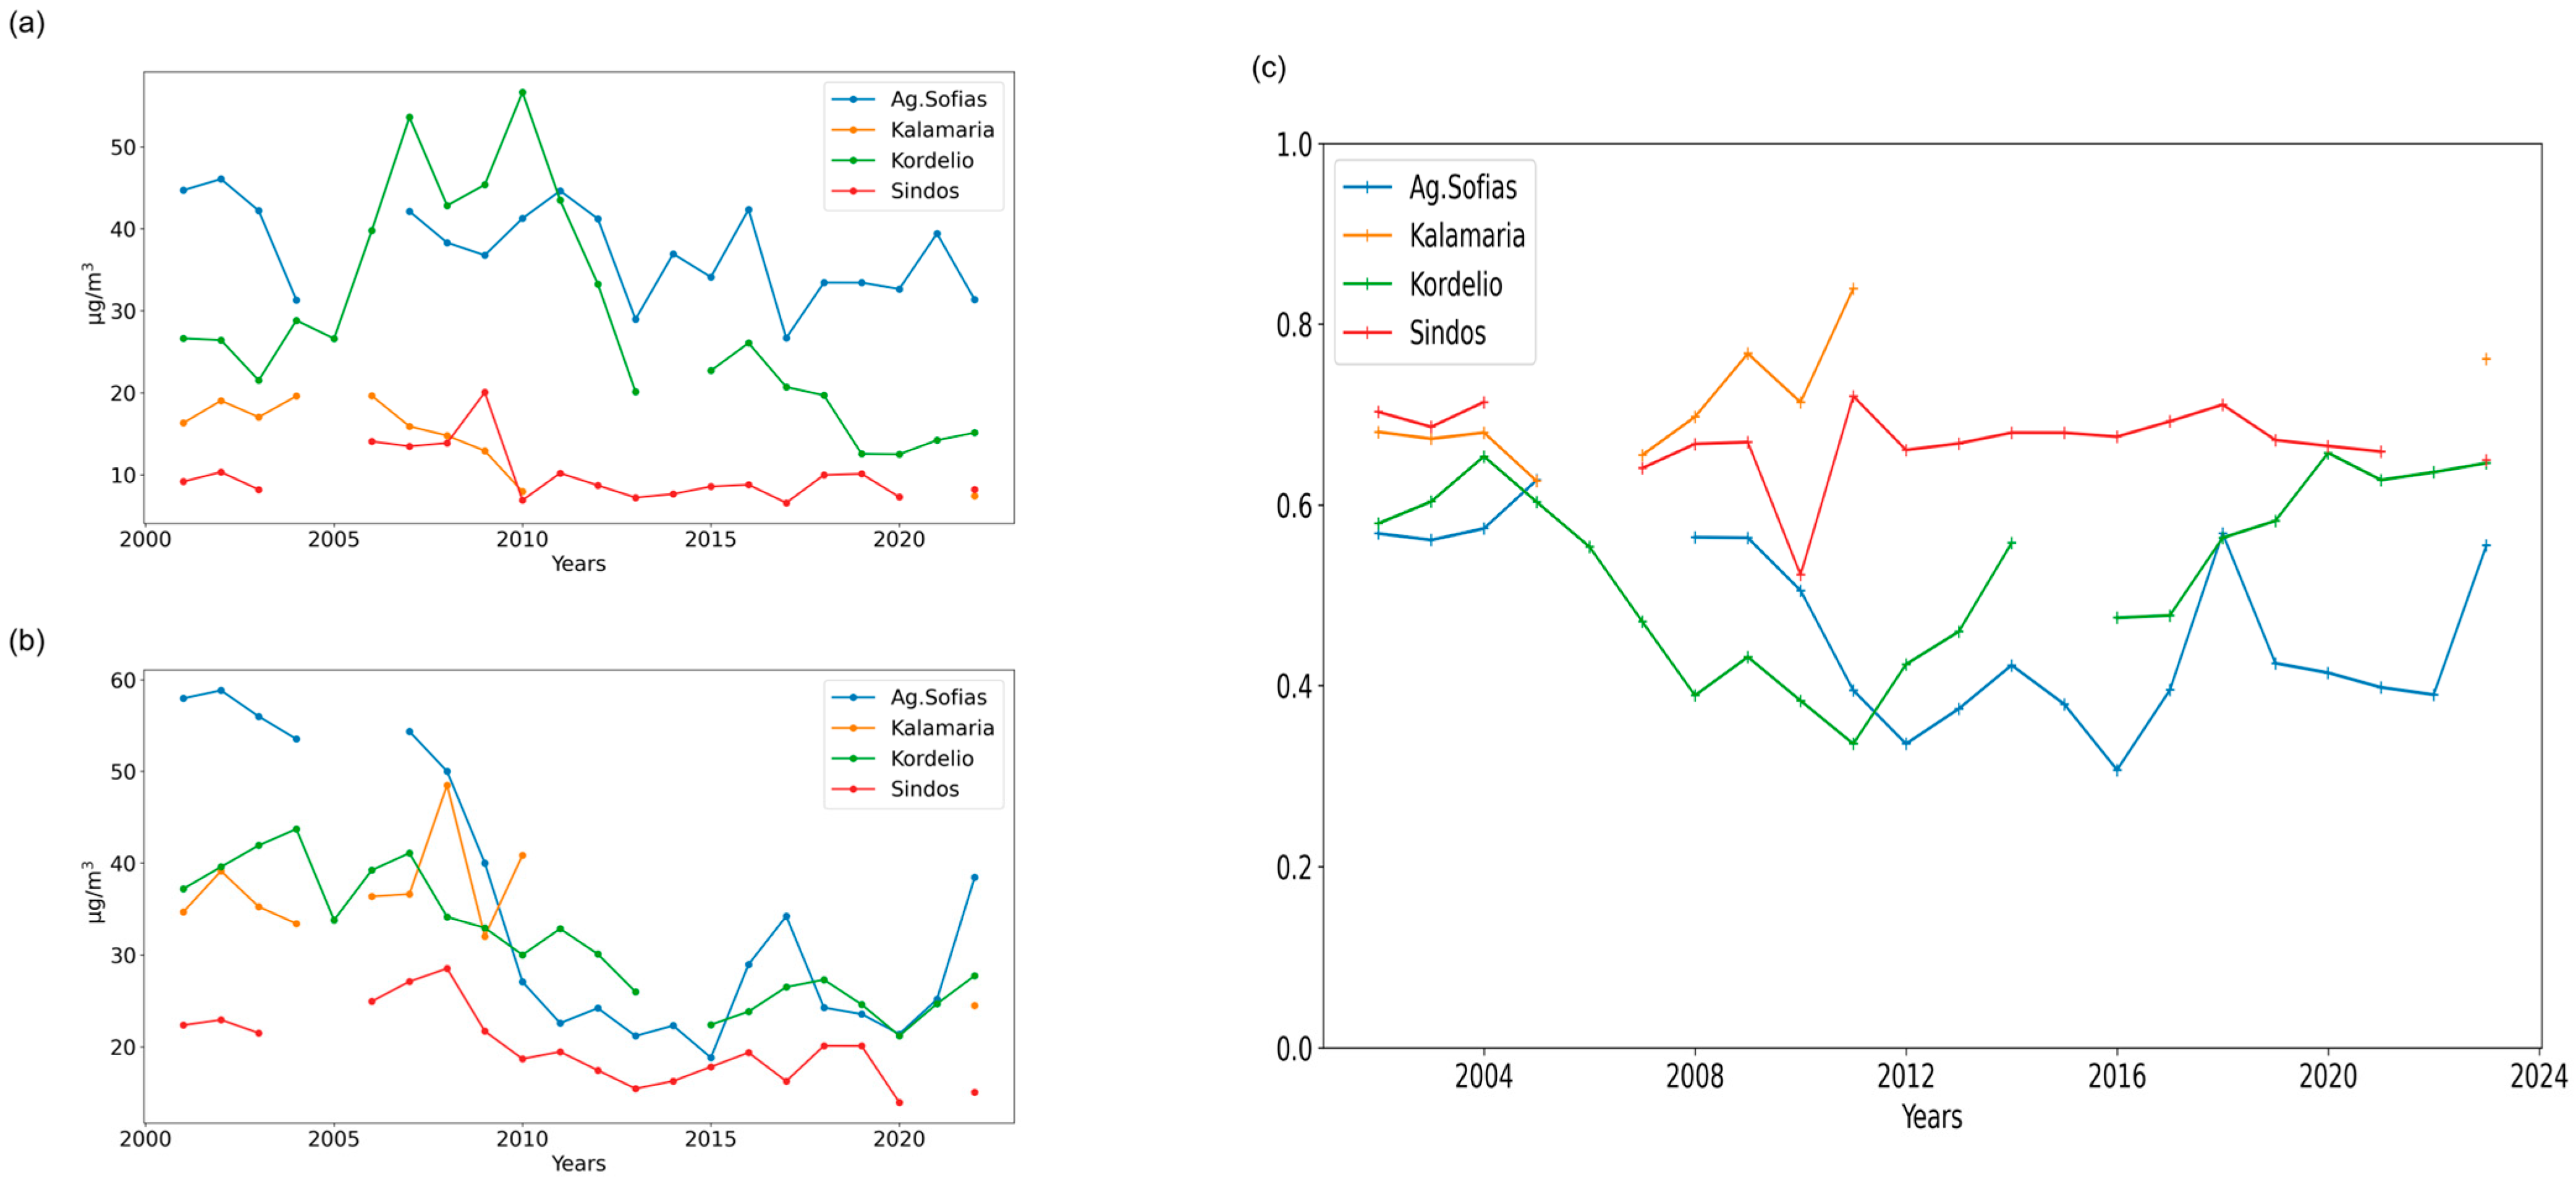
In Figure 3, the annual mean time-series of NO and NO2 for the period 2001–2022 are presented, as well as the time-series of the NO2/NOx ratio. The stations with the highest NO concentrations are Kordelio and Agias Sofias stations. Kordelio station has the highest concentrations during 2006–2010, while from 2011 to 2022, the highest concentrations are observed only in Agias Sofias station (26.7–46 μg/m3). A significant role in this shift was played also by the allowance of diesel cars in Thessaloniki and Athens in November 2011, which are responsible for the enhanced release of NO. The next station in NO concentration levels is Kalamaria (7.4–19.7 μg/m3), while the lowest NO concentrations are recorded in Sindos station (ranging from 6.6 μg/m3 to 13.9 μg/m3). The emissions of NO are mainly attributed to the transport sector. The first three stations are urban stations, with high traffic emissions, and consequently the concentrations they record are proportional to the vehicle circulation in the vicinity of each station.
The bottom left diagram of Figure 3 shows the NO2 concentrations. Similarly to NO, the highest concentrations have been measured in Agias Sofias station, ranging from 53.5 to 58.8 μg/m3. The concentrations in Kordelio station range from 37.2 to 43.7 μg/m3, while the lowest concentrations have been recorded in Sindos station (21.5–22.9 μg/m3).
Finally, the right side of Figure 3 exhibits the time-series of NO2/NOx ratio. For the years with available data, the highest values are spotted in the urban–background station of Kalamaria, reaching up to 0.84 in 2011. The lowest values are observed in Kordelio and Agias Sofias stations, with averages from all years of 0.52 and 0.47, respectively. In Agias Sofias station, the ratio decreases, compatible with an NO2 decrease up to 2016, while afterwards it increases, showing that NO2 decreases but at a smaller rate than NOx. The increase is comparable with other studies performed for other regions of Greece (e.g., [14,15]), which showed that the highest ratio is observed in urban–background stations, and stations with high traffic have the lowest values due to the direct emission of NO by vehicles. At roadside traffic stations, the yearly average concentrations of NO2 tend to be lower than at background locations for the same NOx levels. This is primarily because NO has less time to oxidize into NO2 near the road and O3 levels are typically lower in those environments [14]. At the suburban–industrial station of Sindos, the NO2/NOx ratio has shown a slight but consistent decline since 2011. Given that O3 concentrations in the area remain relatively high, providing favorable conditions for the oxidation of NO to NO2, the decreasing ratio suggests an increase in primary NO emissions, likely from traffic or industrial activities. This also implies that NO is entering the atmosphere at a rate that exceeds the capacity of available O3 to convert it fully into NO2, resulting in a lower proportion of NO2 within total NOx.
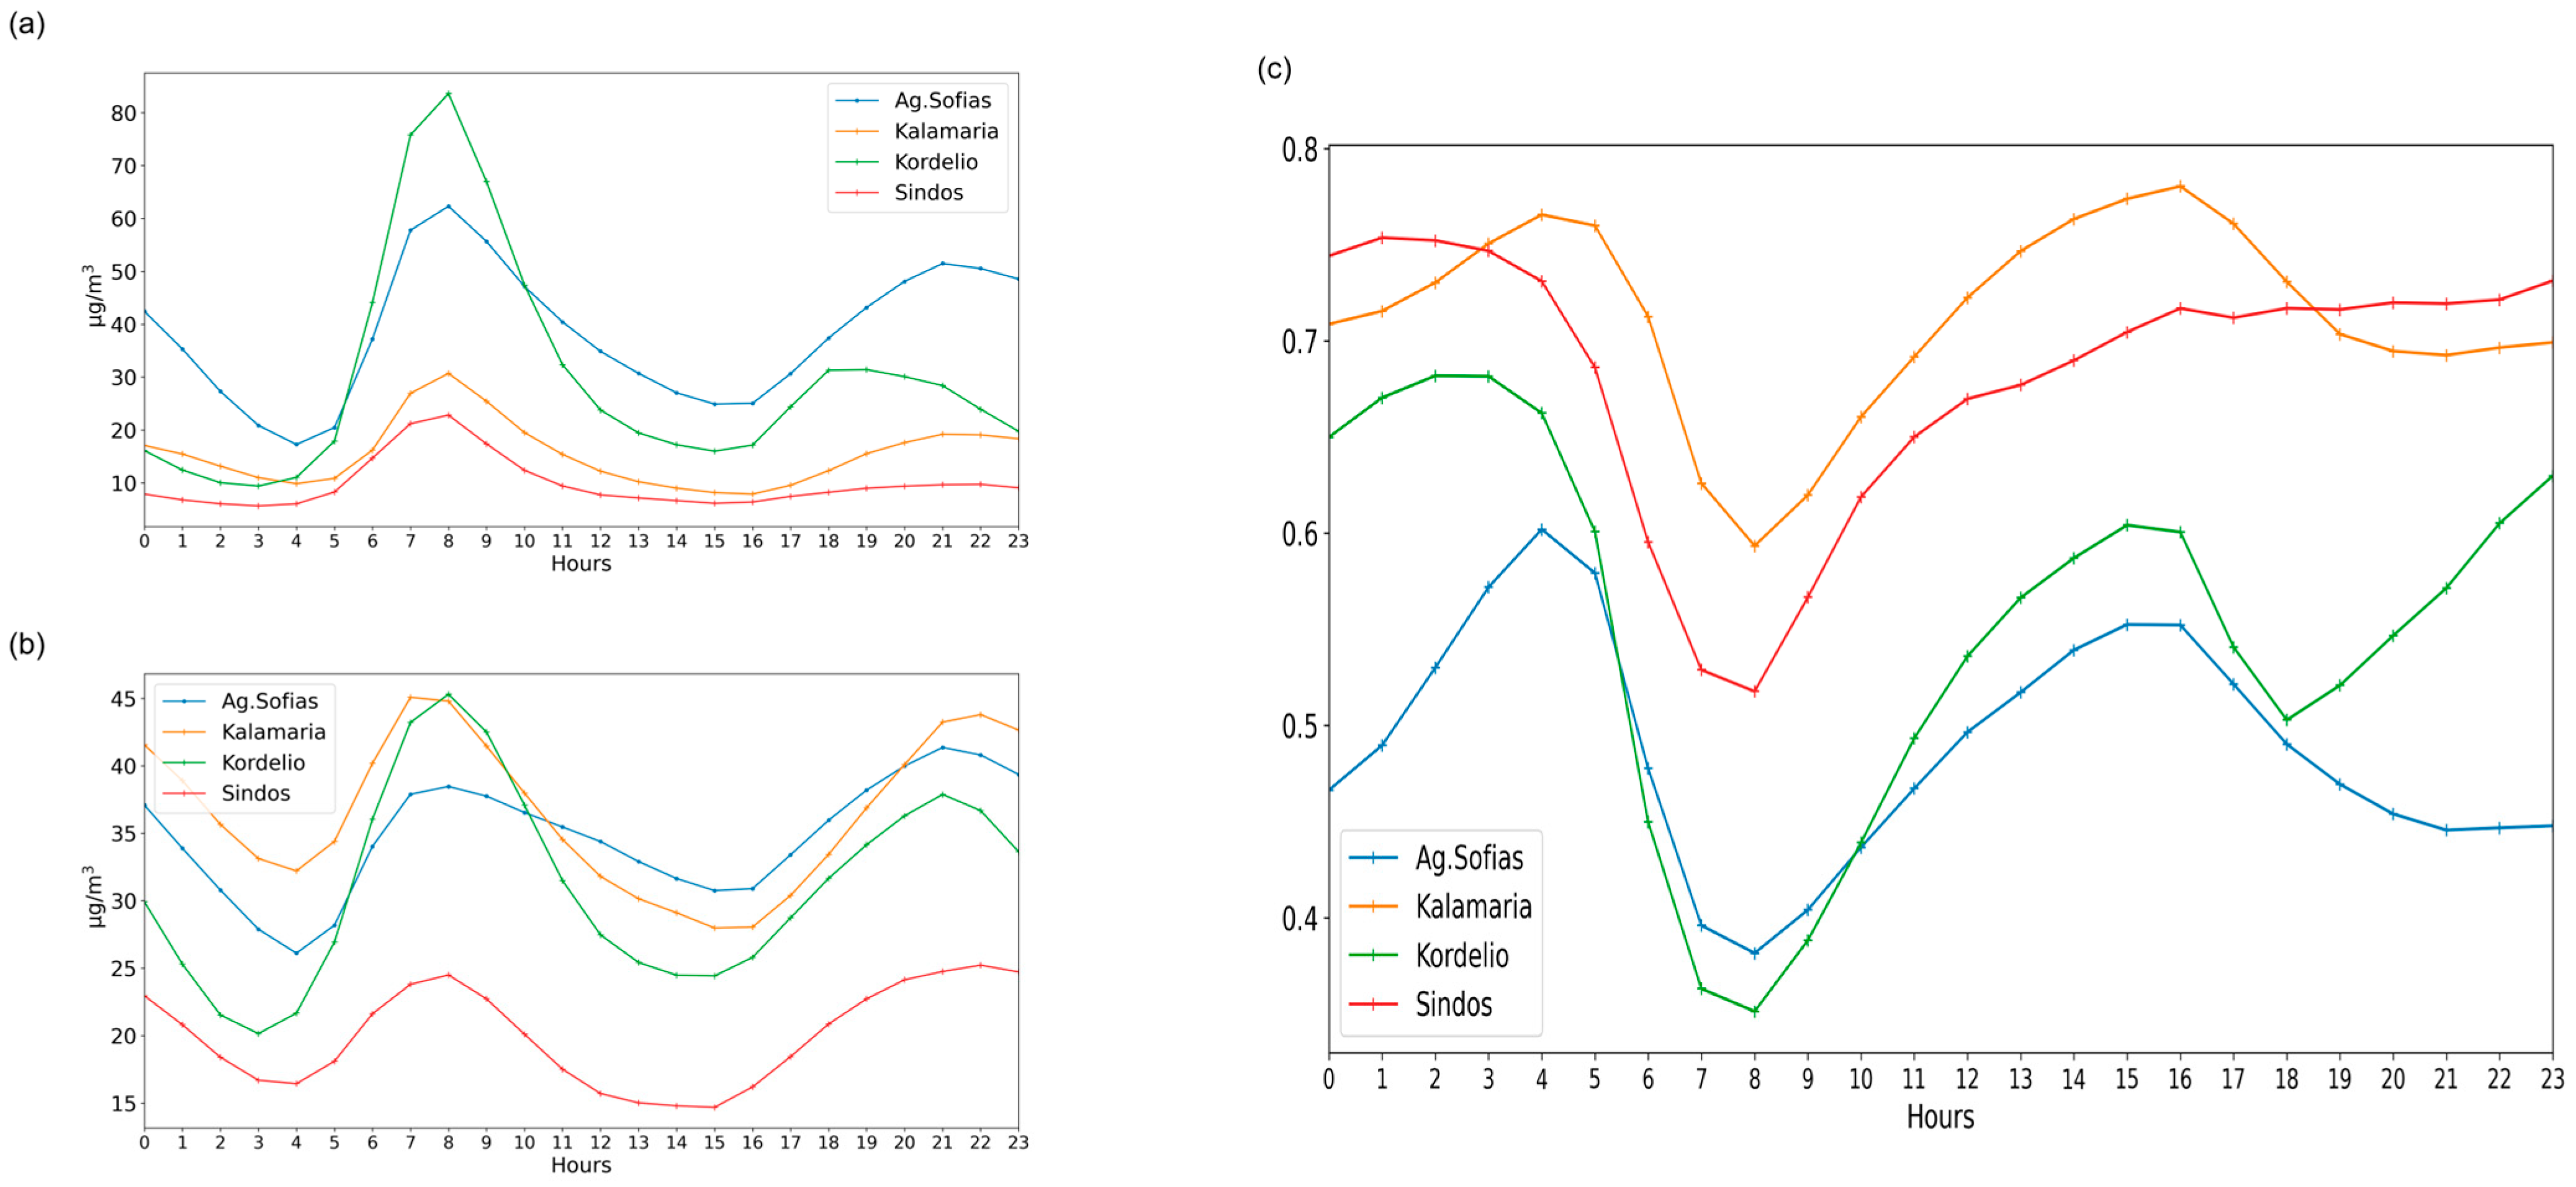
Figure 4 presents the diurnal concentrations for NOx: on the left side NO and NO2 concentrations and on the right side the NO2/NOx ratio. The diagrams were created based on the available data (see also Table A1 in Appendix A), so not all stations have the same number of years considered for the annual mean concentrations, which may introduce some uncertainties in the trends. Both pollutants exhibit similar diurnal variability. The first peak is observed in the morning at around 7–8 am, and afterwards the concentrations decrease. The morning peak is linked with emissions from vehicle exhausts during the rush hours, due to transport to work [15]. During the day, NO2 is photolyzed as the radiation increases, and as a result their concentrations are decreasing. From the late afternoon (at around 4 pm), concentration starts rising again mainly attributed to vehicle emissions, which are increasing when people are returning home after working hours. In addition, and as NOx are photochemically active compounds, the absence of high levels of solar radiation favors the increase in nitrogen compounds which are not involved into O3 formation.
In the case of NO diurnal variability, there are some discrepancies between different stations concerning the time of the second peak. More specifically, Kordelio station has the second peak at around 6 pm, while the other three stations have the second maximum of the day at around 9 pm. The earlier occurrence of the second peak at Kordelio station, relative to the later peaks observed at Agias Sofias, Kalamaria, and Sindos, may reflect a complex interplay of factors including variations in industrial work schedules, distinct commuting patterns, localized lifestyle rhythms, and potentially differing public transport services. It is worth mentioning that Sindos station has a very low second peak, slightly larger than the afternoon concentrations of the station. This possibly occurs because Sindos is a suburban–industrial station, with lower traffic emissions in comparison to the other stations. Furthermore, as Sindos is an industrial region, emissions from industrialization rise more during the day and less in the evening. Overall, in the stations with less traffic, i.e., Sindos and Kalamaria, concentrations have smaller diurnal variability than in the case of the other two stations, i.e., Agias Sofias and Kordelio, where the traffic is higher resulting in increased vehicle emissions. The findings of the present study are compatible with the findings of Anttila et al. [45], who found that the morning and evening peaks of NOx are associated with the traffic exhaust emissions.
Finally, regarding the ratio of NO2/NOx according to Table 4, Kalamaria station has the highest values, while the lowest have been measured in Agias Sofias station and Kordelio station. The low values of the ratio are linked with the direct emissions of NO from vehicle exhausts or from industrial activities (in Kordelio station) which results in higher NO peaks, also since NO has not oxidized yet to NO2, while the higher the values, the greater the distance from the sources [14]. Chouloulakou et al. [46] have developed a criterion for the characterization of the stations based on the annual mean concentrations of NO and NO2. The table below presents the mean NO2/NOx ratios for the four stations. Our findings are in agreement with those of Mavroidis et al. [14] on the ratios that correspond to different types of stations, with the highest ratio observed at Kalamaria (0.71), an urban background station, showing very similar values for such stations in both studies. The lowest ratio (0.47) was found at the Agias Sofias station, which is also close to the value reported by Mavroidis et al. [14] for an urban traffic station in Athens (0.44).

3.3. O3

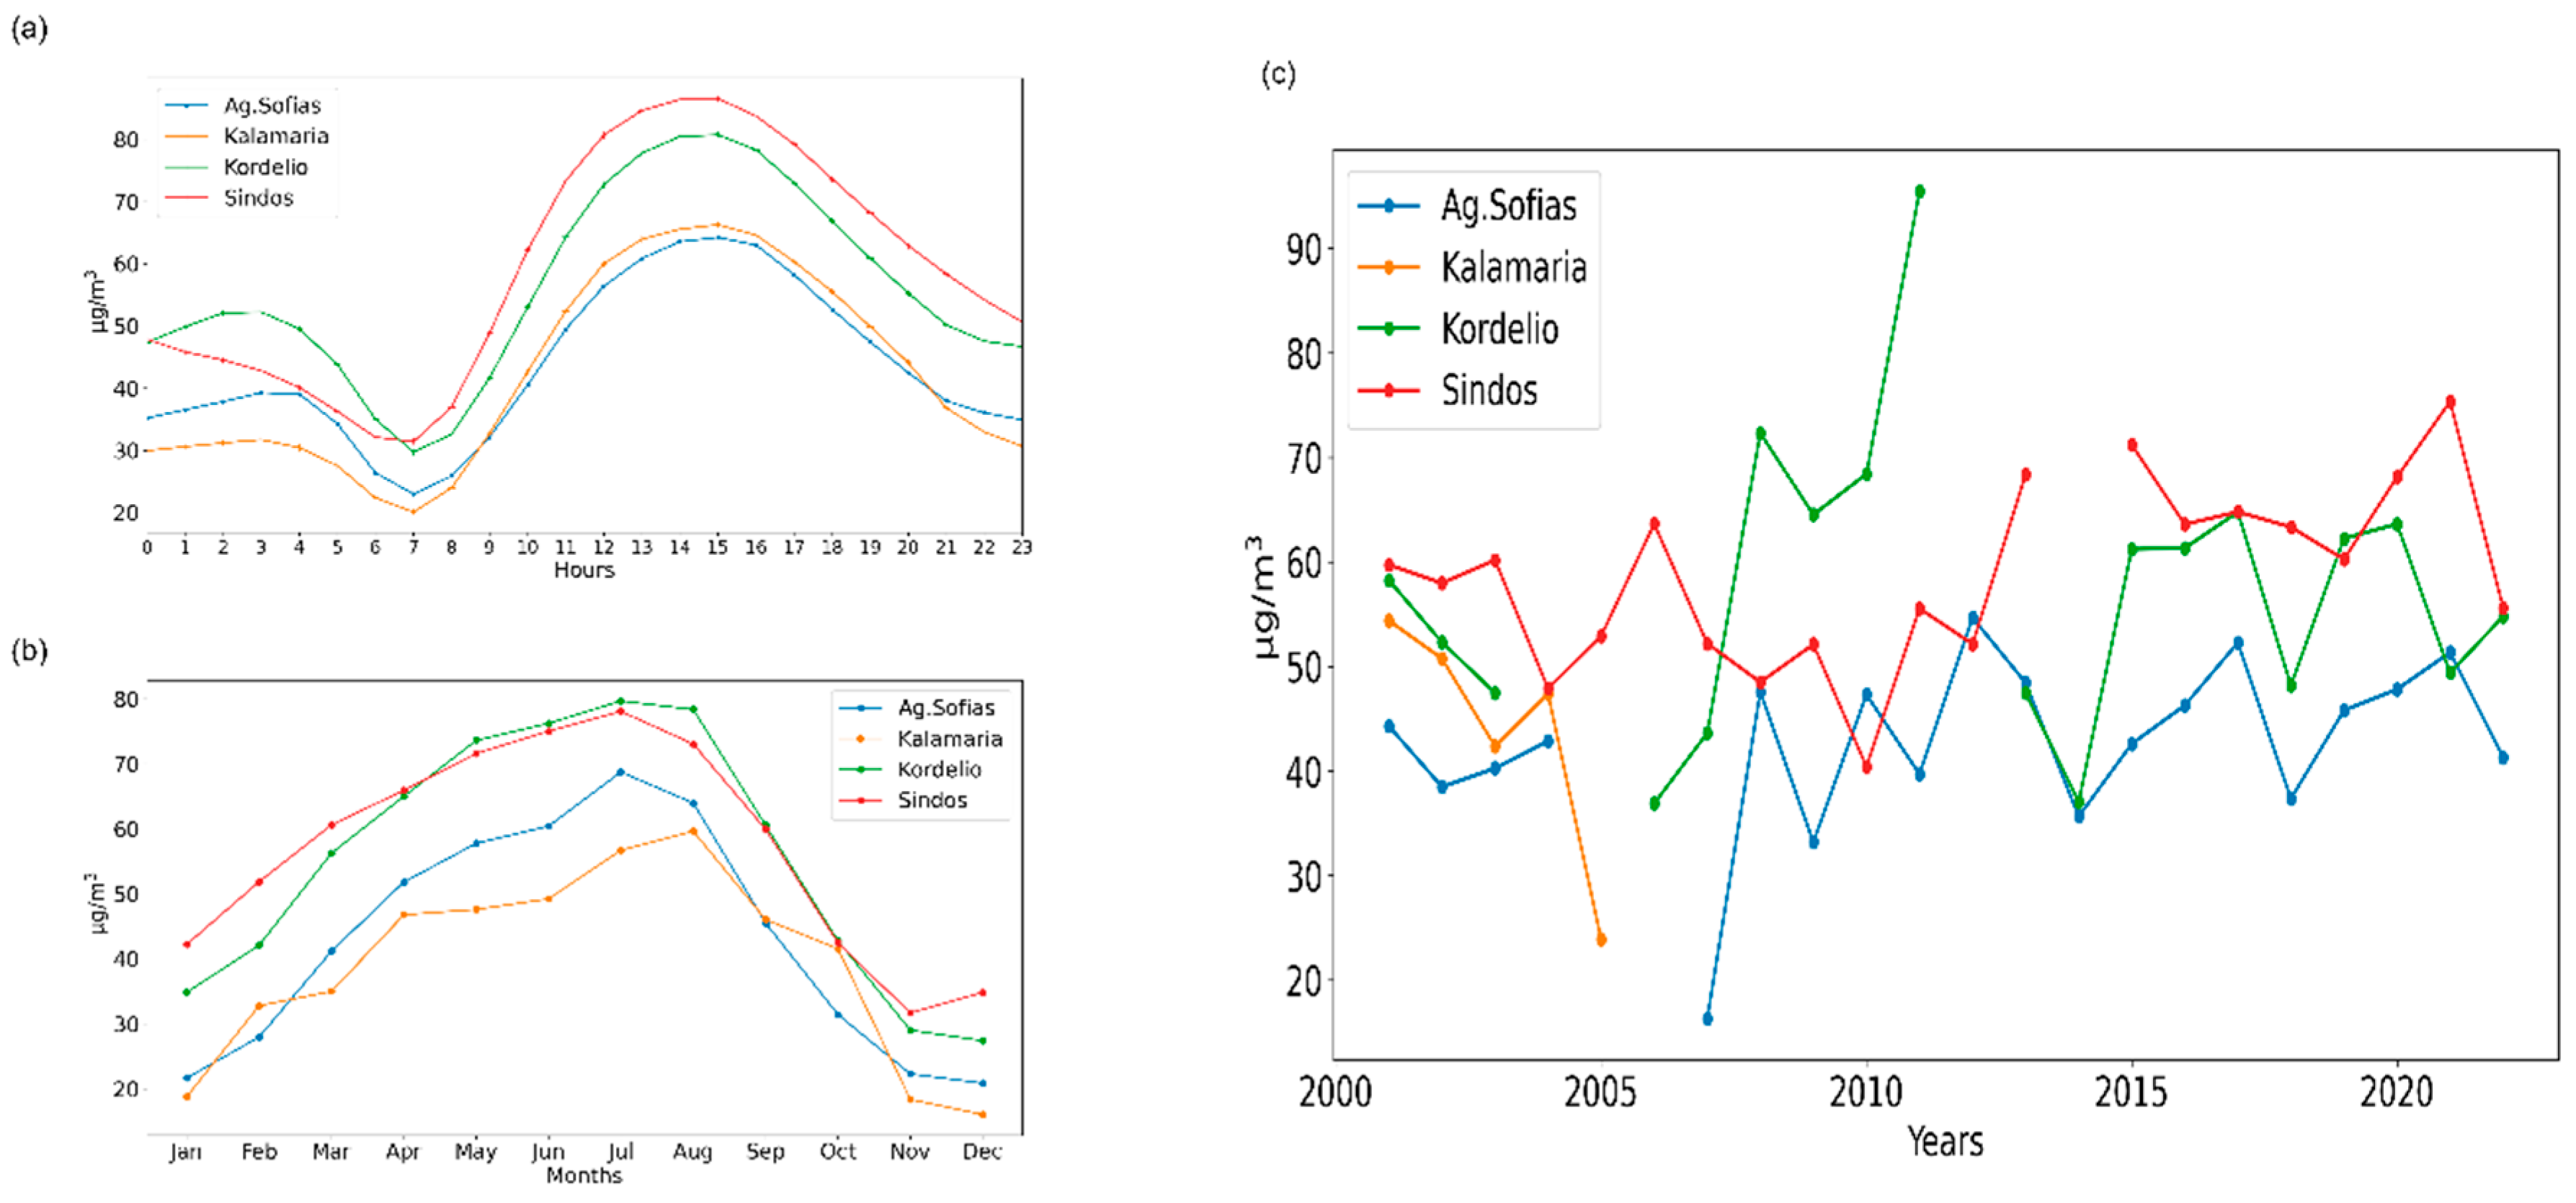
Figure 5 exhibits the ozone trends as annual mean time-series, as well as their monthly and diurnal variability. Focusing on the trends of O3 from the annual mean time-series, the stations with the highest concentrations are Kordelio and Sindos stations. In 2008–2011, Kordelio had surprisingly increased concentrations, while afterwards they reduced to the values in line with the previous levels at this station. During this period, there was also a rise in NO concentrations, while NO2 remained stable. This may indicate that less O3 was being removed through chemical reactions with NO. As a result, more O3 could accumulate in the area. In general, O3 has steady trends without a clear tendency to increase or decrease throughout the years.
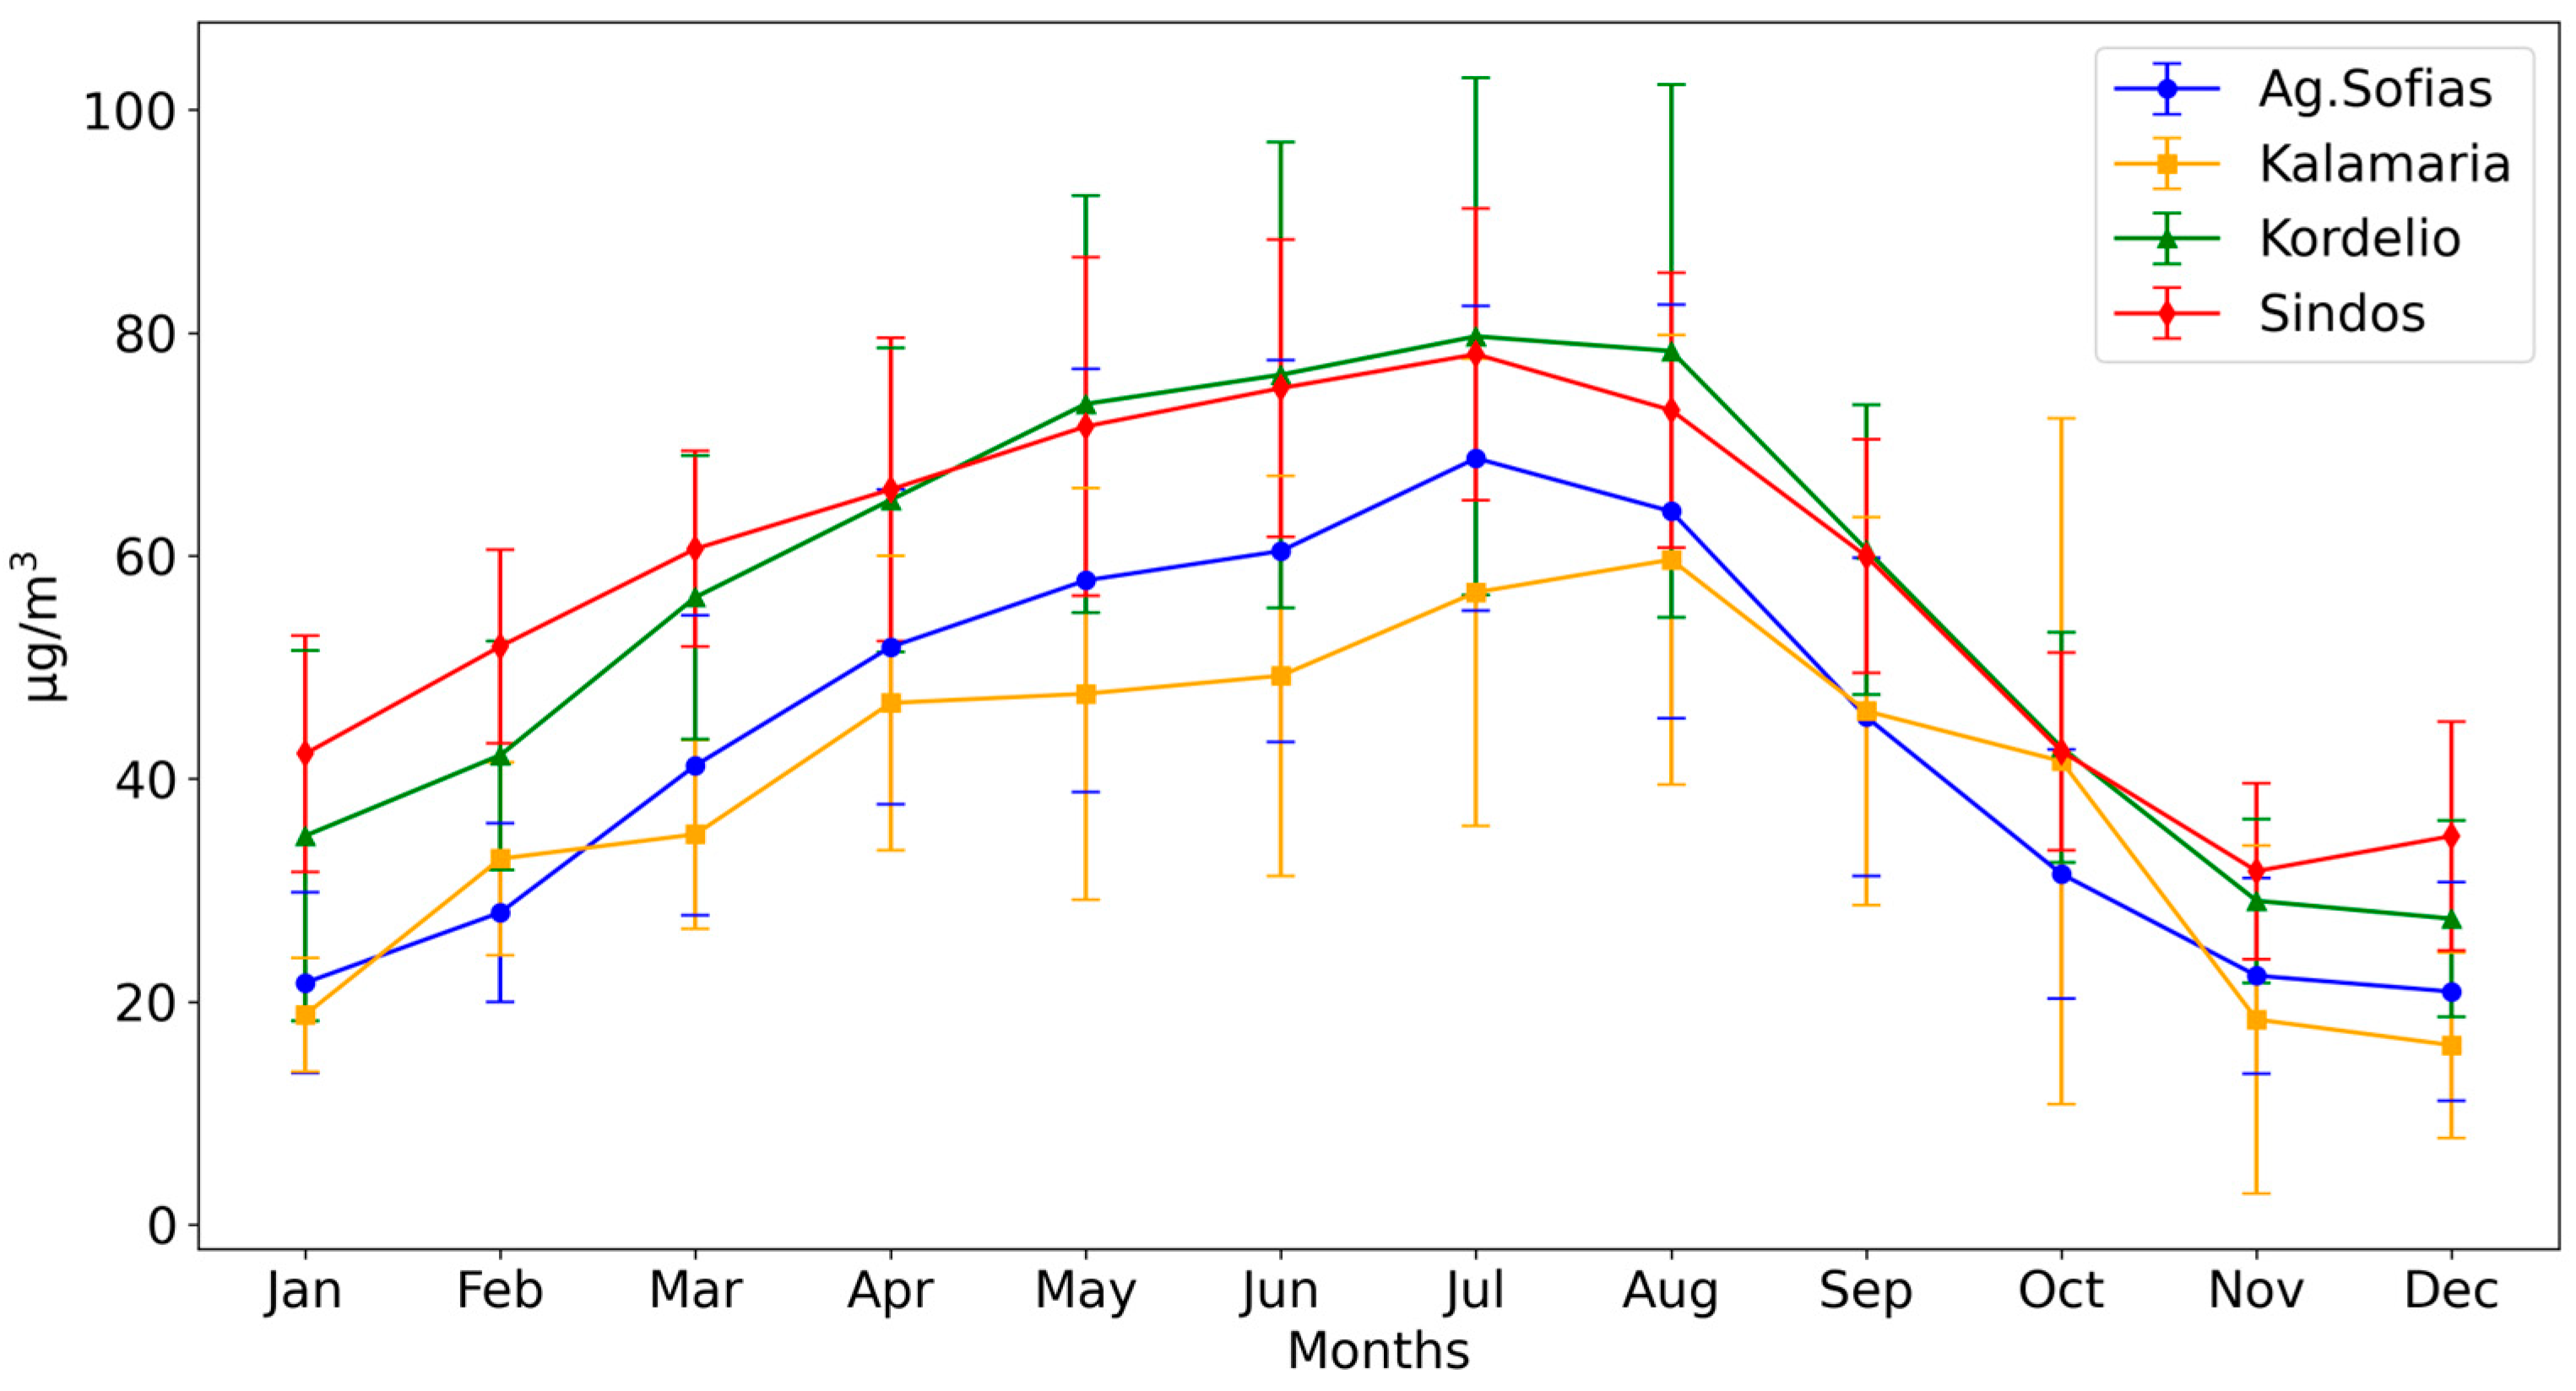
Concerning the monthly variability of O3, the maximum concentrations are observed during the hotter months of the year, i.e., July to August, exhibiting higher standard deviations as well (see also Table A3 and Figure A2 in Appendix A). Due to the photochemical character of O3, the production of O3 is enhanced under higher solar radiation levels, explaining the higher O3 levels during the hotter (and sunnier) months.
Regarding interstation variability, the stations of Kordelio and Sindos are industrial and urban–suburban stations. O3 in the troposphere is produced through photochemical reactions between NOx and VOCs. VOCs also have natural sources of origin, and in suburban and industrial areas VOC concentrations may be higher. Therefore, Sindos station, which is outside the city, has the highest percentage of natural emissions of VOCs compared to the rest of the stations under study and, by extension, their presence contributes to the formation of O3.
Finally, concerning the diurnal variability of O3, the diagram shows that the higher concentrations are observed during early afternoon. Since the production of O3 is favored by the presence of NOx, which reach their maxima in the morning, and by solar radiation, the gradual production of O3 starts after the morning traffic peak and the O3 concentrations increase; as a result, the maximum O3 concentrations are observed in all stations in the early afternoon (1–2 pm), while later the concentrations start falling.

3.4. Interrelations Between NO2 and O3

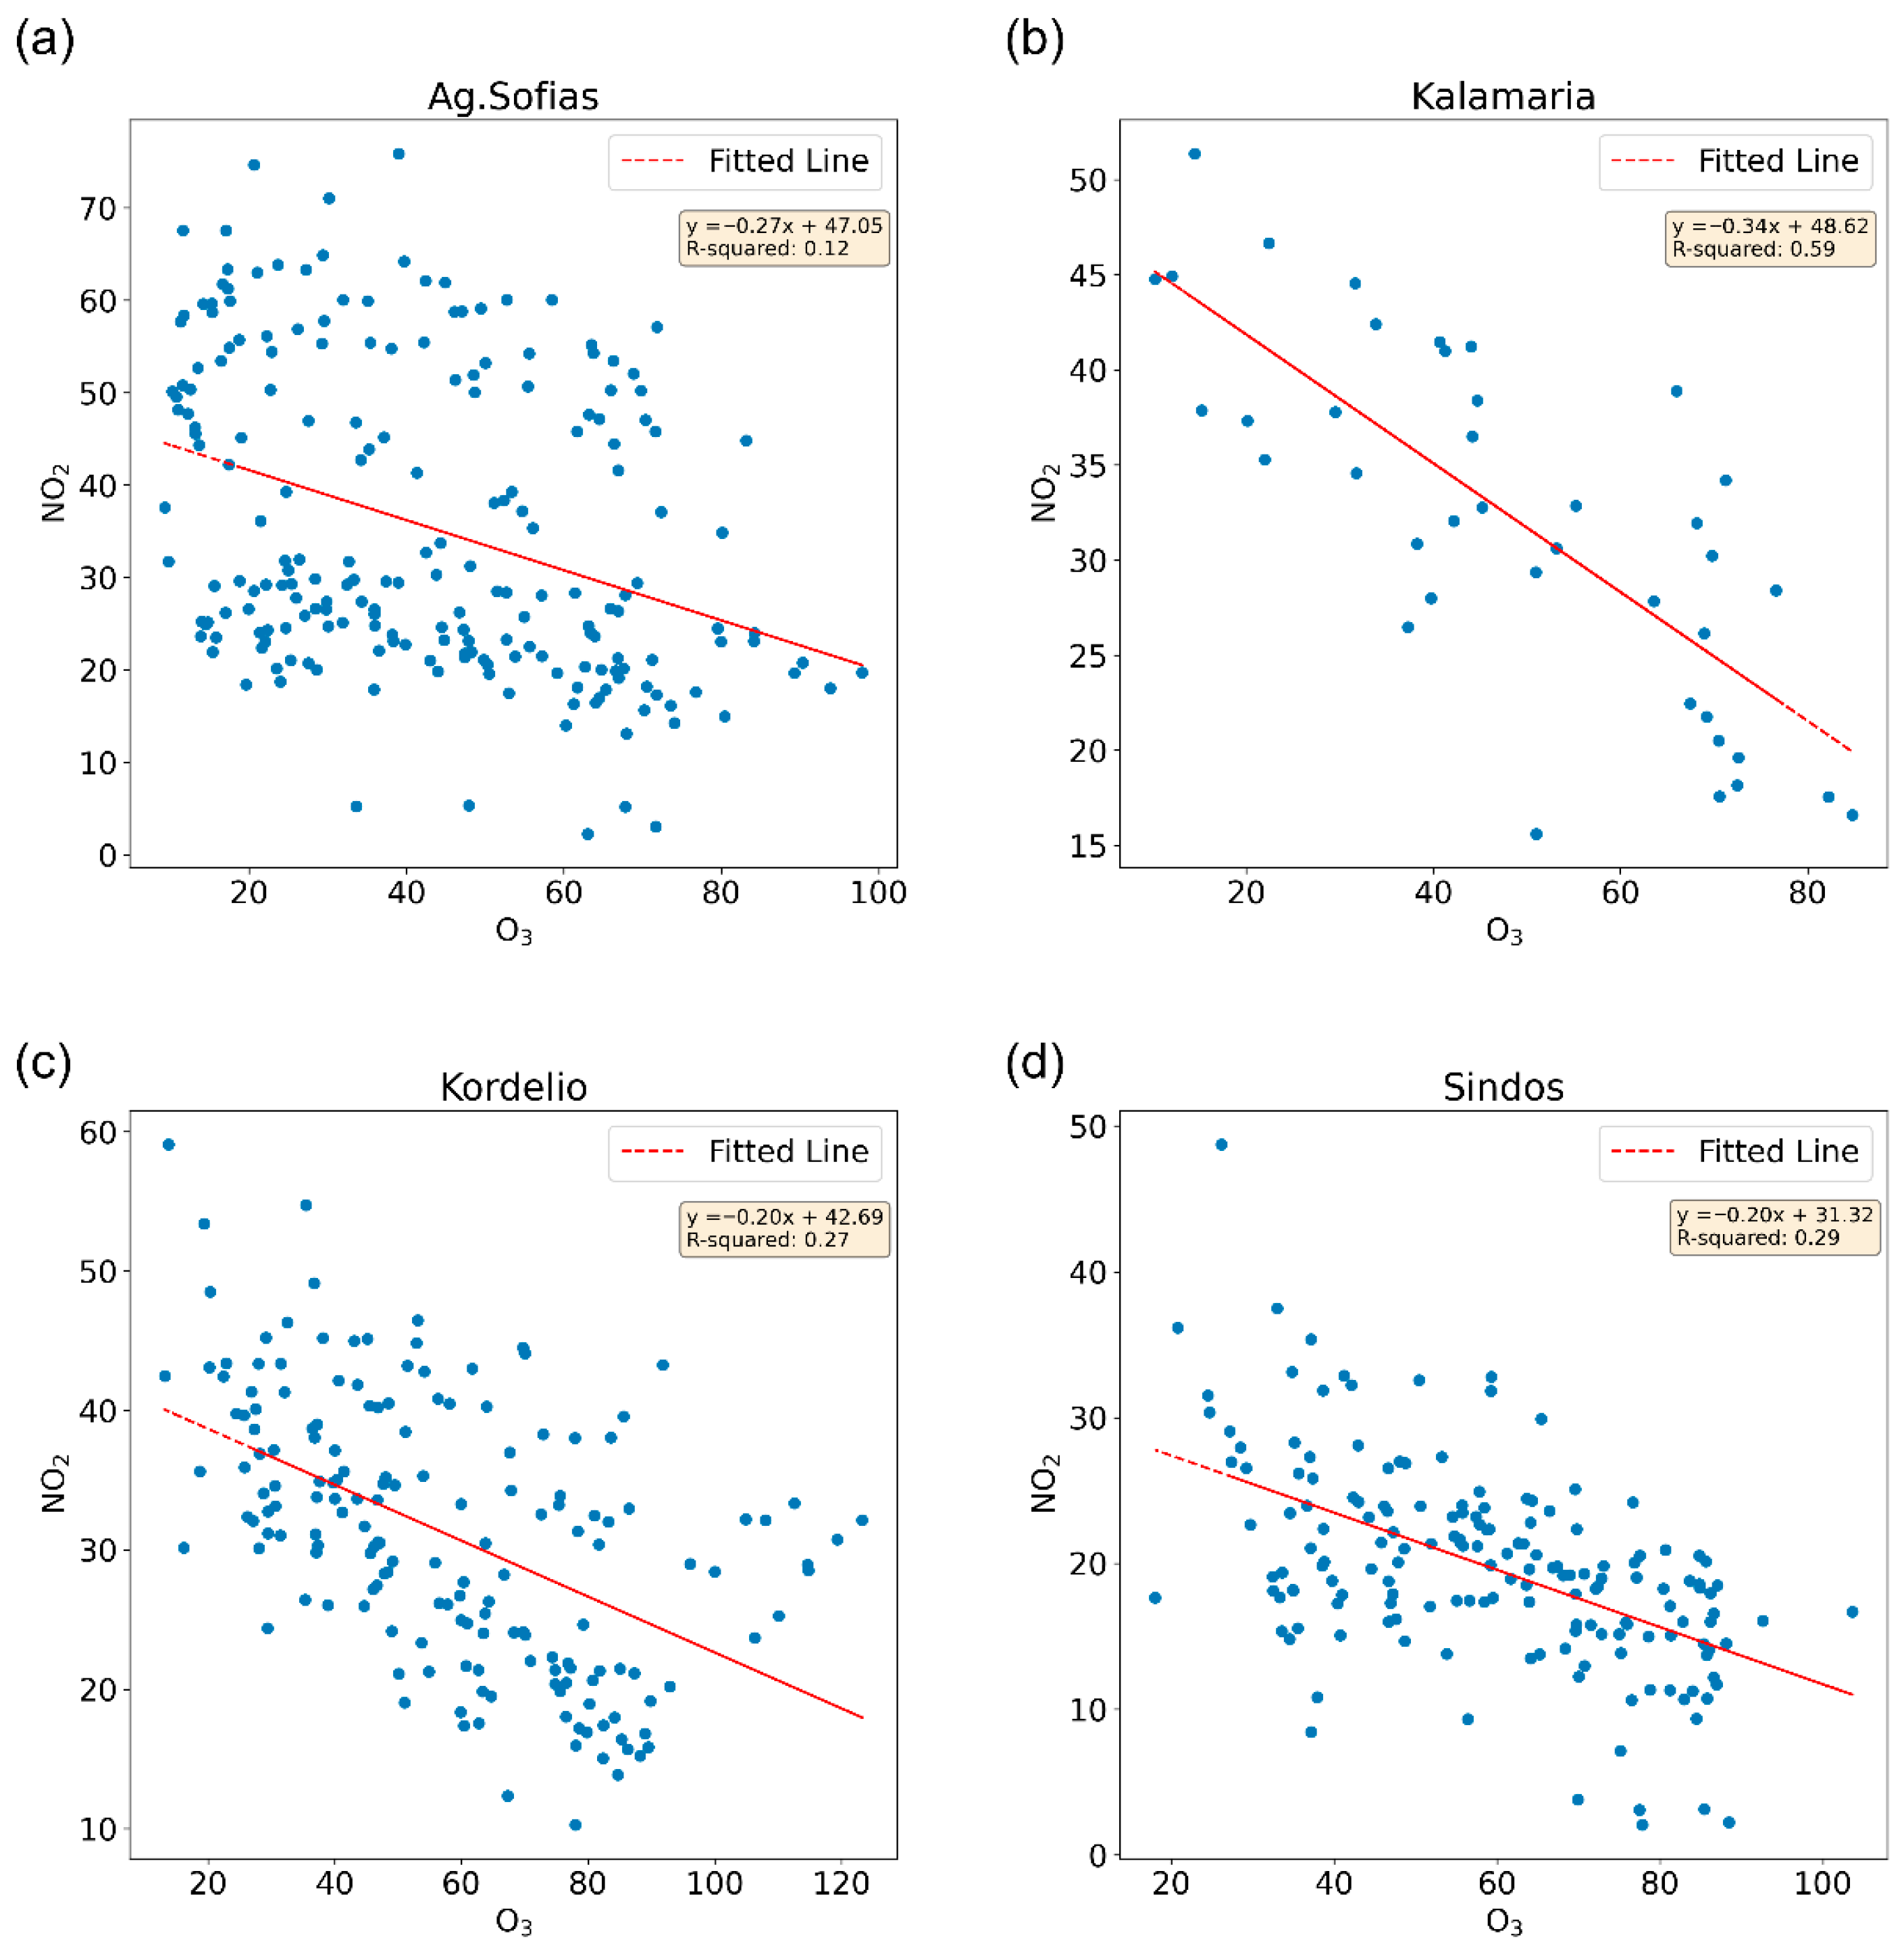
The scatter plots of Figure 6 illustrate the correlation between NO2 and O3 for the four stations under study. At all stations, the least squares line has a negative slope and the concentrations of these two pollutants are inversely proportional, which is in agreement with other research on pollutant partitioning (e.g., [14]). The R2 values are quite low in most stations, showing the level of variance. The best fit is at the Kalamaria urban–background station (R2 = 0.59), which is not directly influenced by pollutant emissions (traffic or industry) and therefore the photochemical reactions are the main factor, while the worst fit (lower R2) is at the Agias Sofias urban–traffic station, where the direct emissions from vehicles in the vicinity of the station are directly influencing the NO2-O3 relation. High NO concentrations can reduce O3 through the reaction:
NO + O3 → NO2 + O2,
resulting in a low correlation between NO2 and O3. In the areas of Kordelio and Sindos, NO emissions are also influenced by industrial activity, which leads to discrepancies in the NO2-O3 correlation due to the greater complexity of the emissions.

3.5. The Impact of Meteorological Parameters on Concentration of Pollutants: The Case of 2022

In this section, the relation between air pollution data and meteorological parameters is examined. The effect of wind on PM10 concentrations is shown in Figure 7 and the effect of temperature on O3 concentrations in Figure 8. The year of study was 2022, since it is a very recent year with very good data availability. As no severe events occurred this year, it may be considered as representative of the conditions in Thessaloniki.
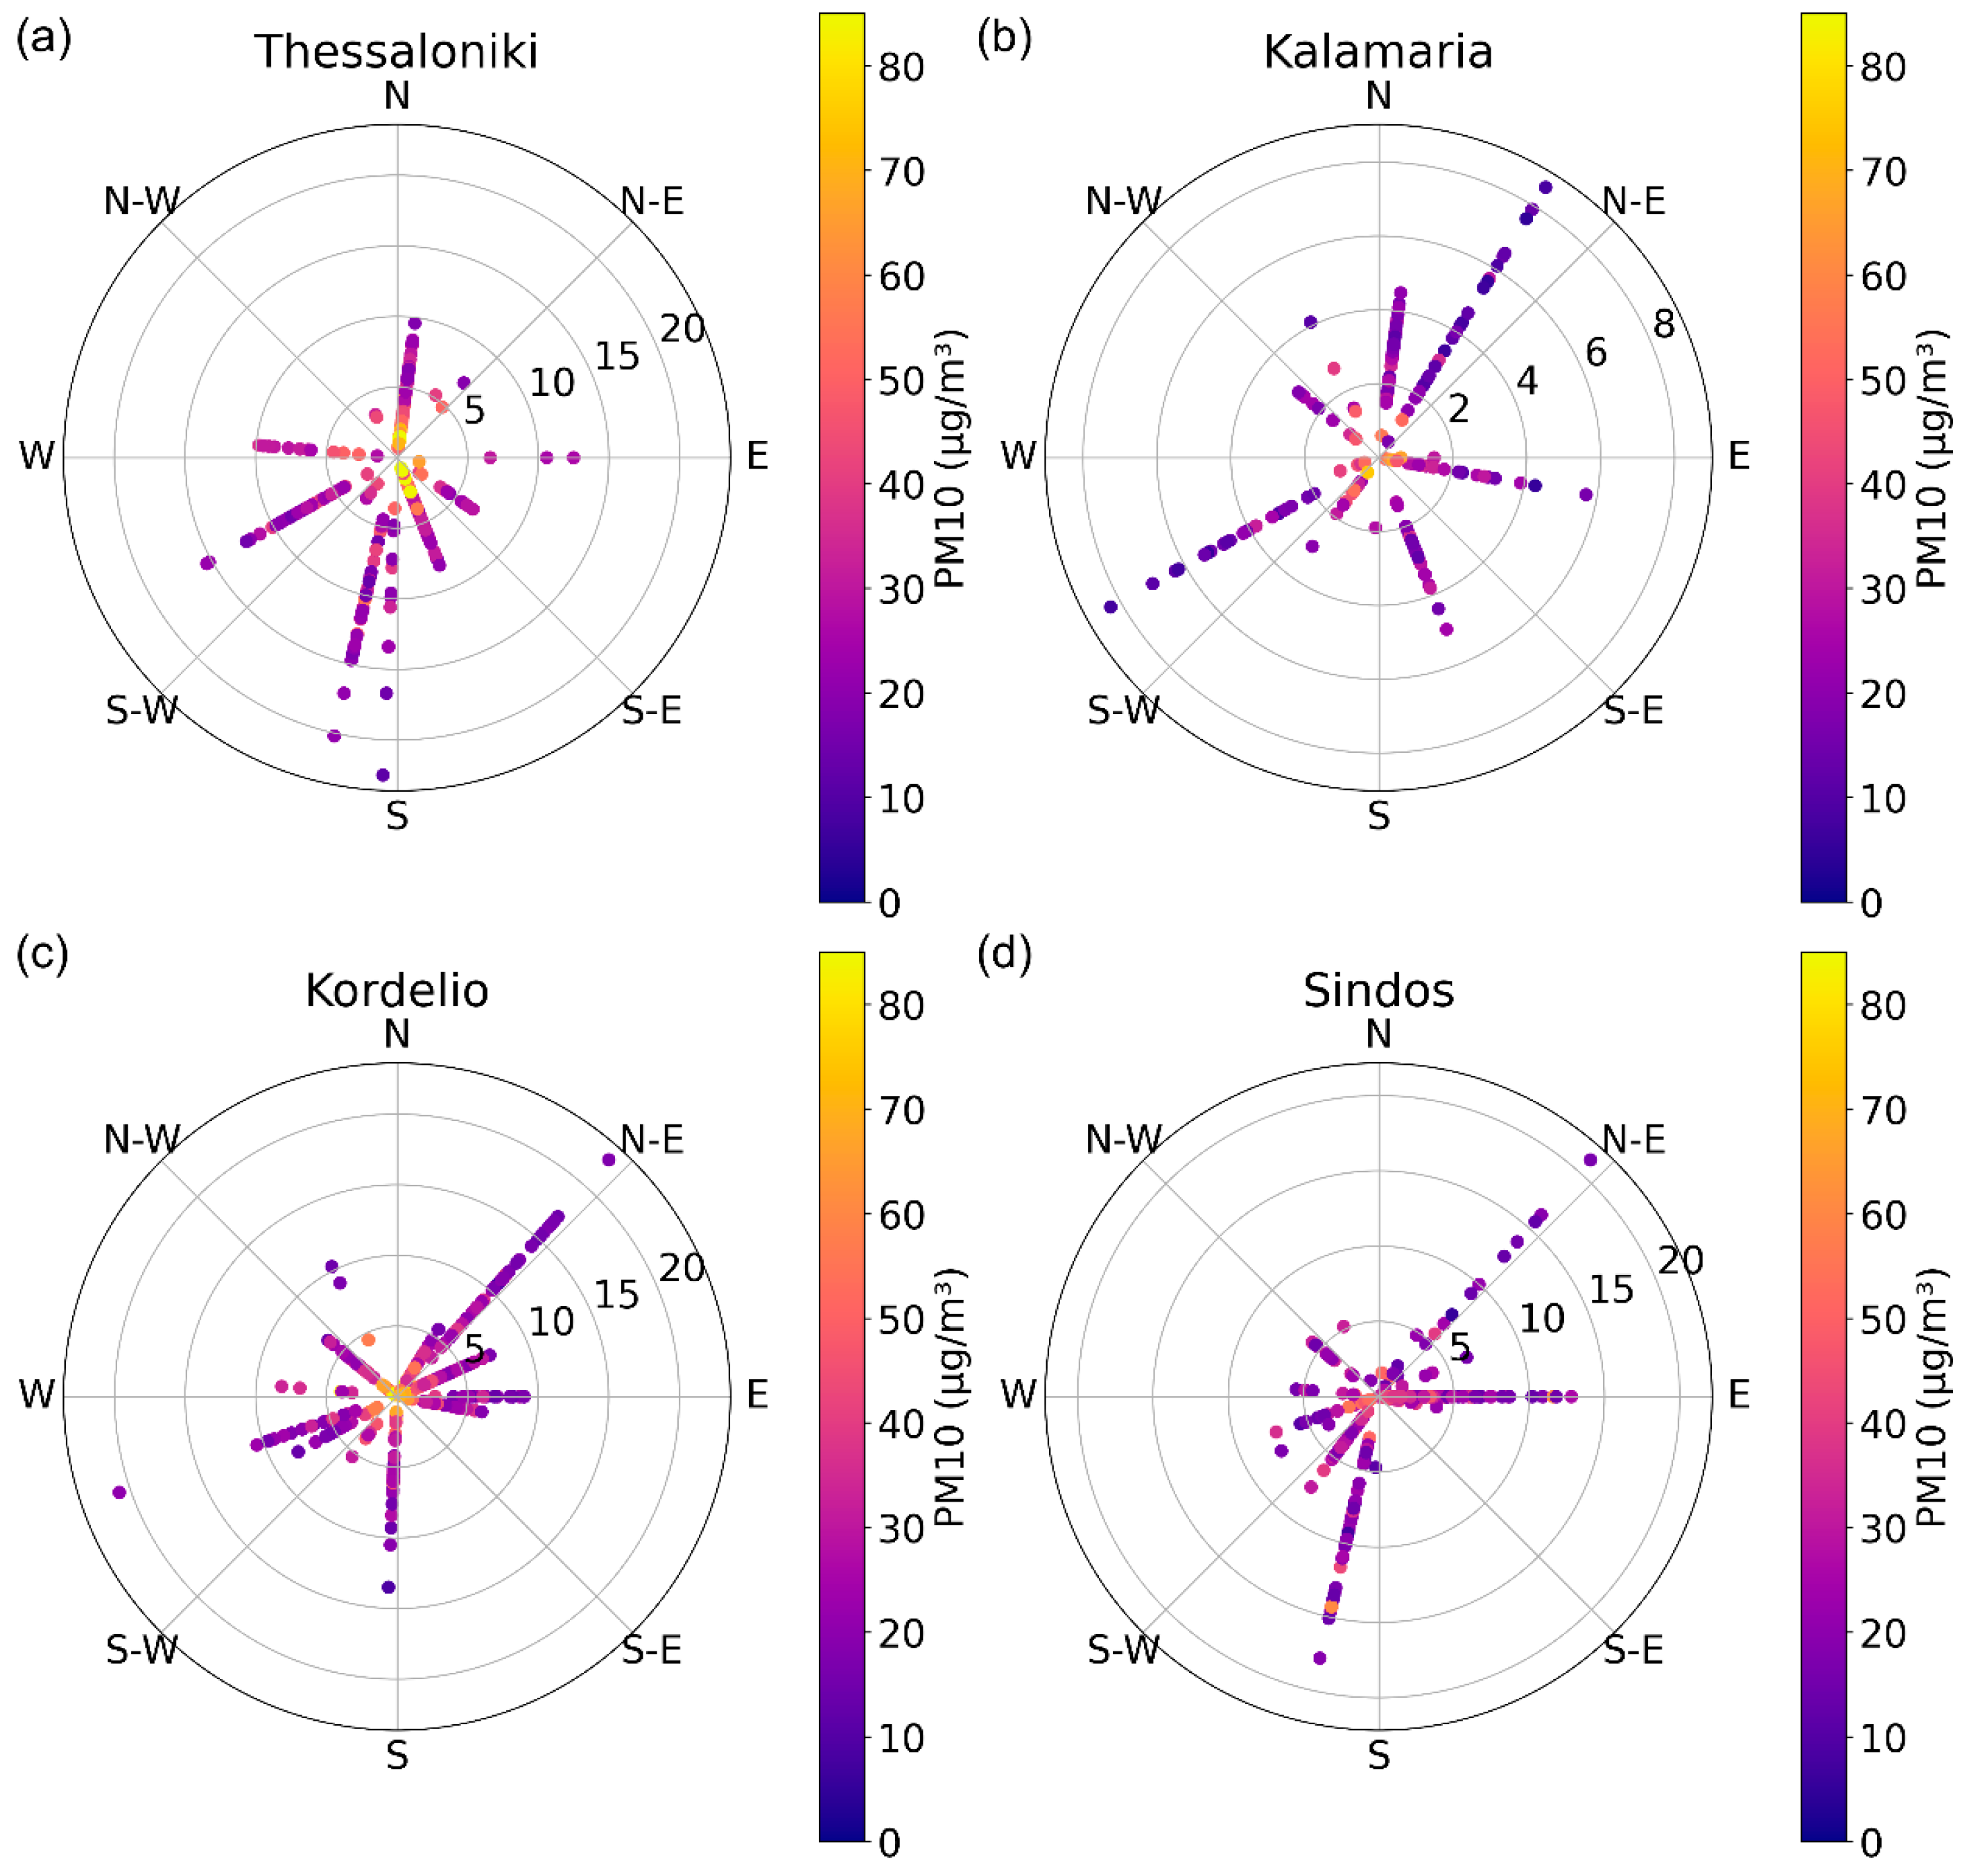
Figure 7 shows the daily mean concentrations of PM10 and the corresponding daily mean wind speed and direction for the four stations under study. Concerning the Agias Sofias station located in the city center, the maximum concentrations of PM10 are observed in the south-southeast direction, and secondly in north-northeast direction. In these two directions wind speed is relatively low (up to 10 km/h). The highest PM10 concentrations (up to 50 μg/m3) are observed for wind speeds which do not exceed 5 km/h. In higher wind speeds, as those observed for the south-southwest wind direction, the concentrations of PM10 are low (<20 μg/m3).
At Kalamaria station, the wind directions for which the highest speeds are observed are North-Northeast and West-Southwest. Kalamaria area is in the eastern part of Thessaloniki and is influenced by the Thermaikos Gulf; therefore, the sea and land breeze are dominant meteorological features. The maximum PM10 concentrations (around 75 μg/m3) are observed for the south-southwest direction for which moderate wind speeds prevail, which do not exceed 2 km/h. In general, Kalamaria is the area with the lowest wind speeds as compared to the other three stations.
Concerning the Kordelio area, the highest wind speeds (around 18 km/h) are observed for northeast winds, which are associated with low PM10 concentrations. The highest PM10 concentrations are depicted in winds of lower velocities, which are coming from all the directions. Finally, in Sindos the highest wind speeds are observed for northeast, east and south-southwest wind directions. In the case of northeastern winds, the concentrations are relatively low for wind speeds greater than 10 km/h, while the other two wind directions are characterized by higher PM10 concentrations (around 65 μg/m3). Lower wind speeds result in increased PM10 concentrations since the pollutants are not transported further outside the city. However, PM10 concentrations do not exceed 75 μg/m3.
These findings showcase the inverse relationship between wind speed and PM10 concentrations, since increased wind speeds are associated with lower PM10 levels, while the highest concentrations are observed when wind speeds fall below 5 km/h. The enhanced PM10 concentrations observed for southern winds, as well as for southeastern and southwestern winds, are associated also with the presence of the sea in the south and of mountains on the north. PM10 particles are also originating from the port in the south/southwestern part of the city, but also from other sources in Thessaloniki, including domestic heating and transport emissions. Local emissions of PM10 from industrial activities in the western part of the city are recirculated over the area of Thessaloniki with the aid of the sea breeze during the day, which comes from the southwest and southeast thought the year, transferring them over the terrestrial territories of central Macedonia. During the night, the land breeze is favored and the pollutants are transported toward the sea.
In addition to studying the relationship between wind and PM10, the covariance between O3 concentrations and temperature was also investigated. Figure 8 shows the annual variability of O3 and temperature as monthly mean values for the city center and the Sindos area. Overall, the trends were similar across all four stations; however, for brevity, results are presented here only for the urban and industrial stations.
Both temperature values and O3 concentrations rise as the seasons change from winter to summer, exhibiting a seasonal pattern. The maximum O3 concentrations are observed in April, when increased solar radiation favors O3 production reactions involving volatile organic compounds and NOx, while traffic is not reduced yet as in the summer months. The O3 concentrations remain high until July, when they start dropping, initially due to the summer holiday period of August and then due to the decreased solar radiation in autumn and winter.
The levels of O3 and temperature demonstrate an overall positive correlation, with the increase in O3 concentrations starting a bit earlier in the year than the increase in temperatures. In Mediterranean coastal regions such as the Thessaloniki area, which are characterized by high levels of solar radiation throughout the year—particularly during the summer months—such co-variability between temperature and O3 concentrations is expected and well-documented [46,47].

4. Projections of Air Pollutants

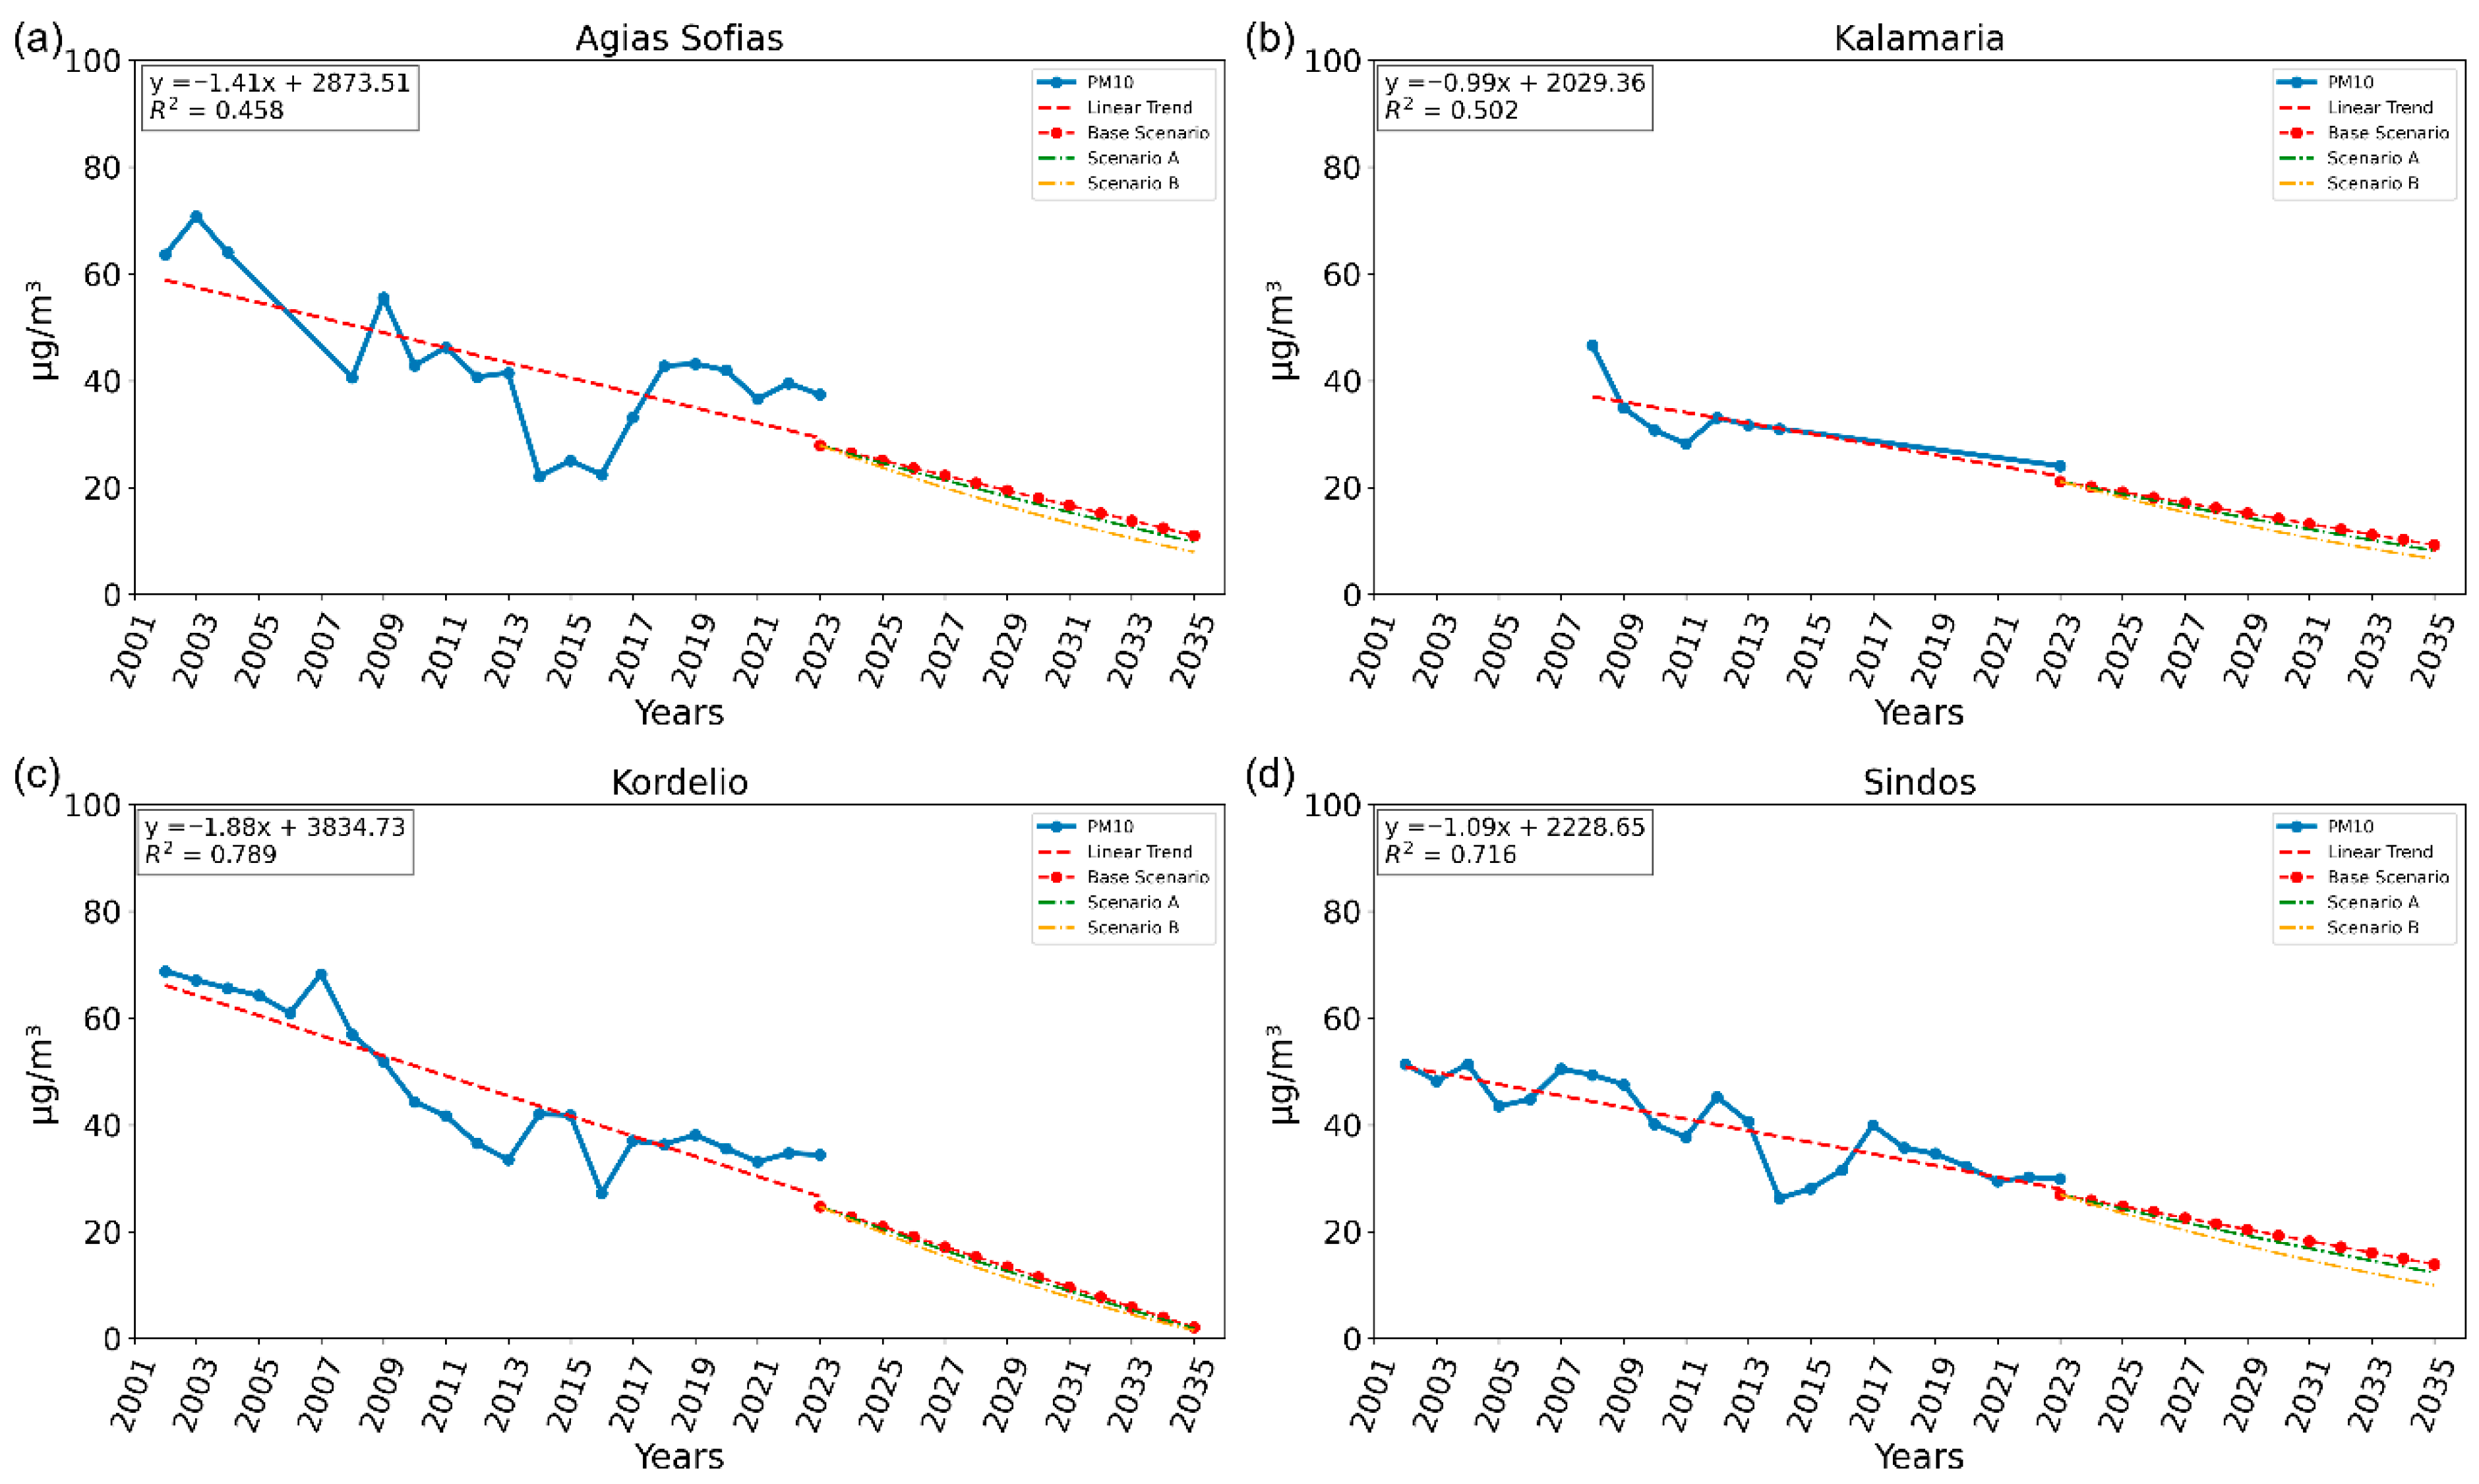
The major sources of air pollution in Thessaloniki are the transport sector, domestic heating, as well as industrial activities, mostly concentrated in the western part of the city [48,49]. Especially during the colder period of the year, many exceedances of daily mean PM10 concentrations are observed [40]. This section explores how the trends of PM10 and NOx—two of the major pollutants which are linked with the above activities—will evolve up to 2035. As illustrated in Figure 9, the annual mean concentrations of PM10 from 2001 to 2035 are presented for the four stations of interest, Agias Sofias, Kalamaria, Kordelio, and Sindos. The blue dots (connected by a blue line) represent the measured annual mean values of the air pollutants, whilst the red dashed lines illustrate the linear trend with the corresponding equations for the period when concentrations exist. Τhe linear trends of the air pollutants from 2023 up to 2035 were calculated and presented in the same figure, with consideration given to the two scenarios. The green line signifies the trends of Scenario A, whilst the yellow line denotes those of Scenario B. The red line, in turn, reflects the continuation of the linear trend of the pre-existing values.
Regarding Scenario A, the results show that the reduction in concentrations is almost negligible up to 2035 in all stations. On the other hand, if Scenario B is applied, this would result in a considerable reduction in PM10 concentrations. The more substantial reductions in PM10 concentrations are observed at Agias Sofias and Sindos stations. Agias Sofias station is located in a highly populated region; therefore, upgrades of heating systems, which contribute to more than 70% of the PM10 emissions, have a greater impact. In contrast, Sindos station is a suburban–industrial station, characterized by significant levels of traffic, primarily consisting of vehicles with petrol catalytic converters. Consequently, a shift toward zero-emission vehicles in this region is expected to significantly improve air quality by reducing PM10 concentrations. Although Kalamaria and Kordelio stations are also affected by the proposed measures, the reductions are less pronounced due to their suburban character and the influence of additional sectors such as construction and light industry, which are not fully addressed in the two scenarios.
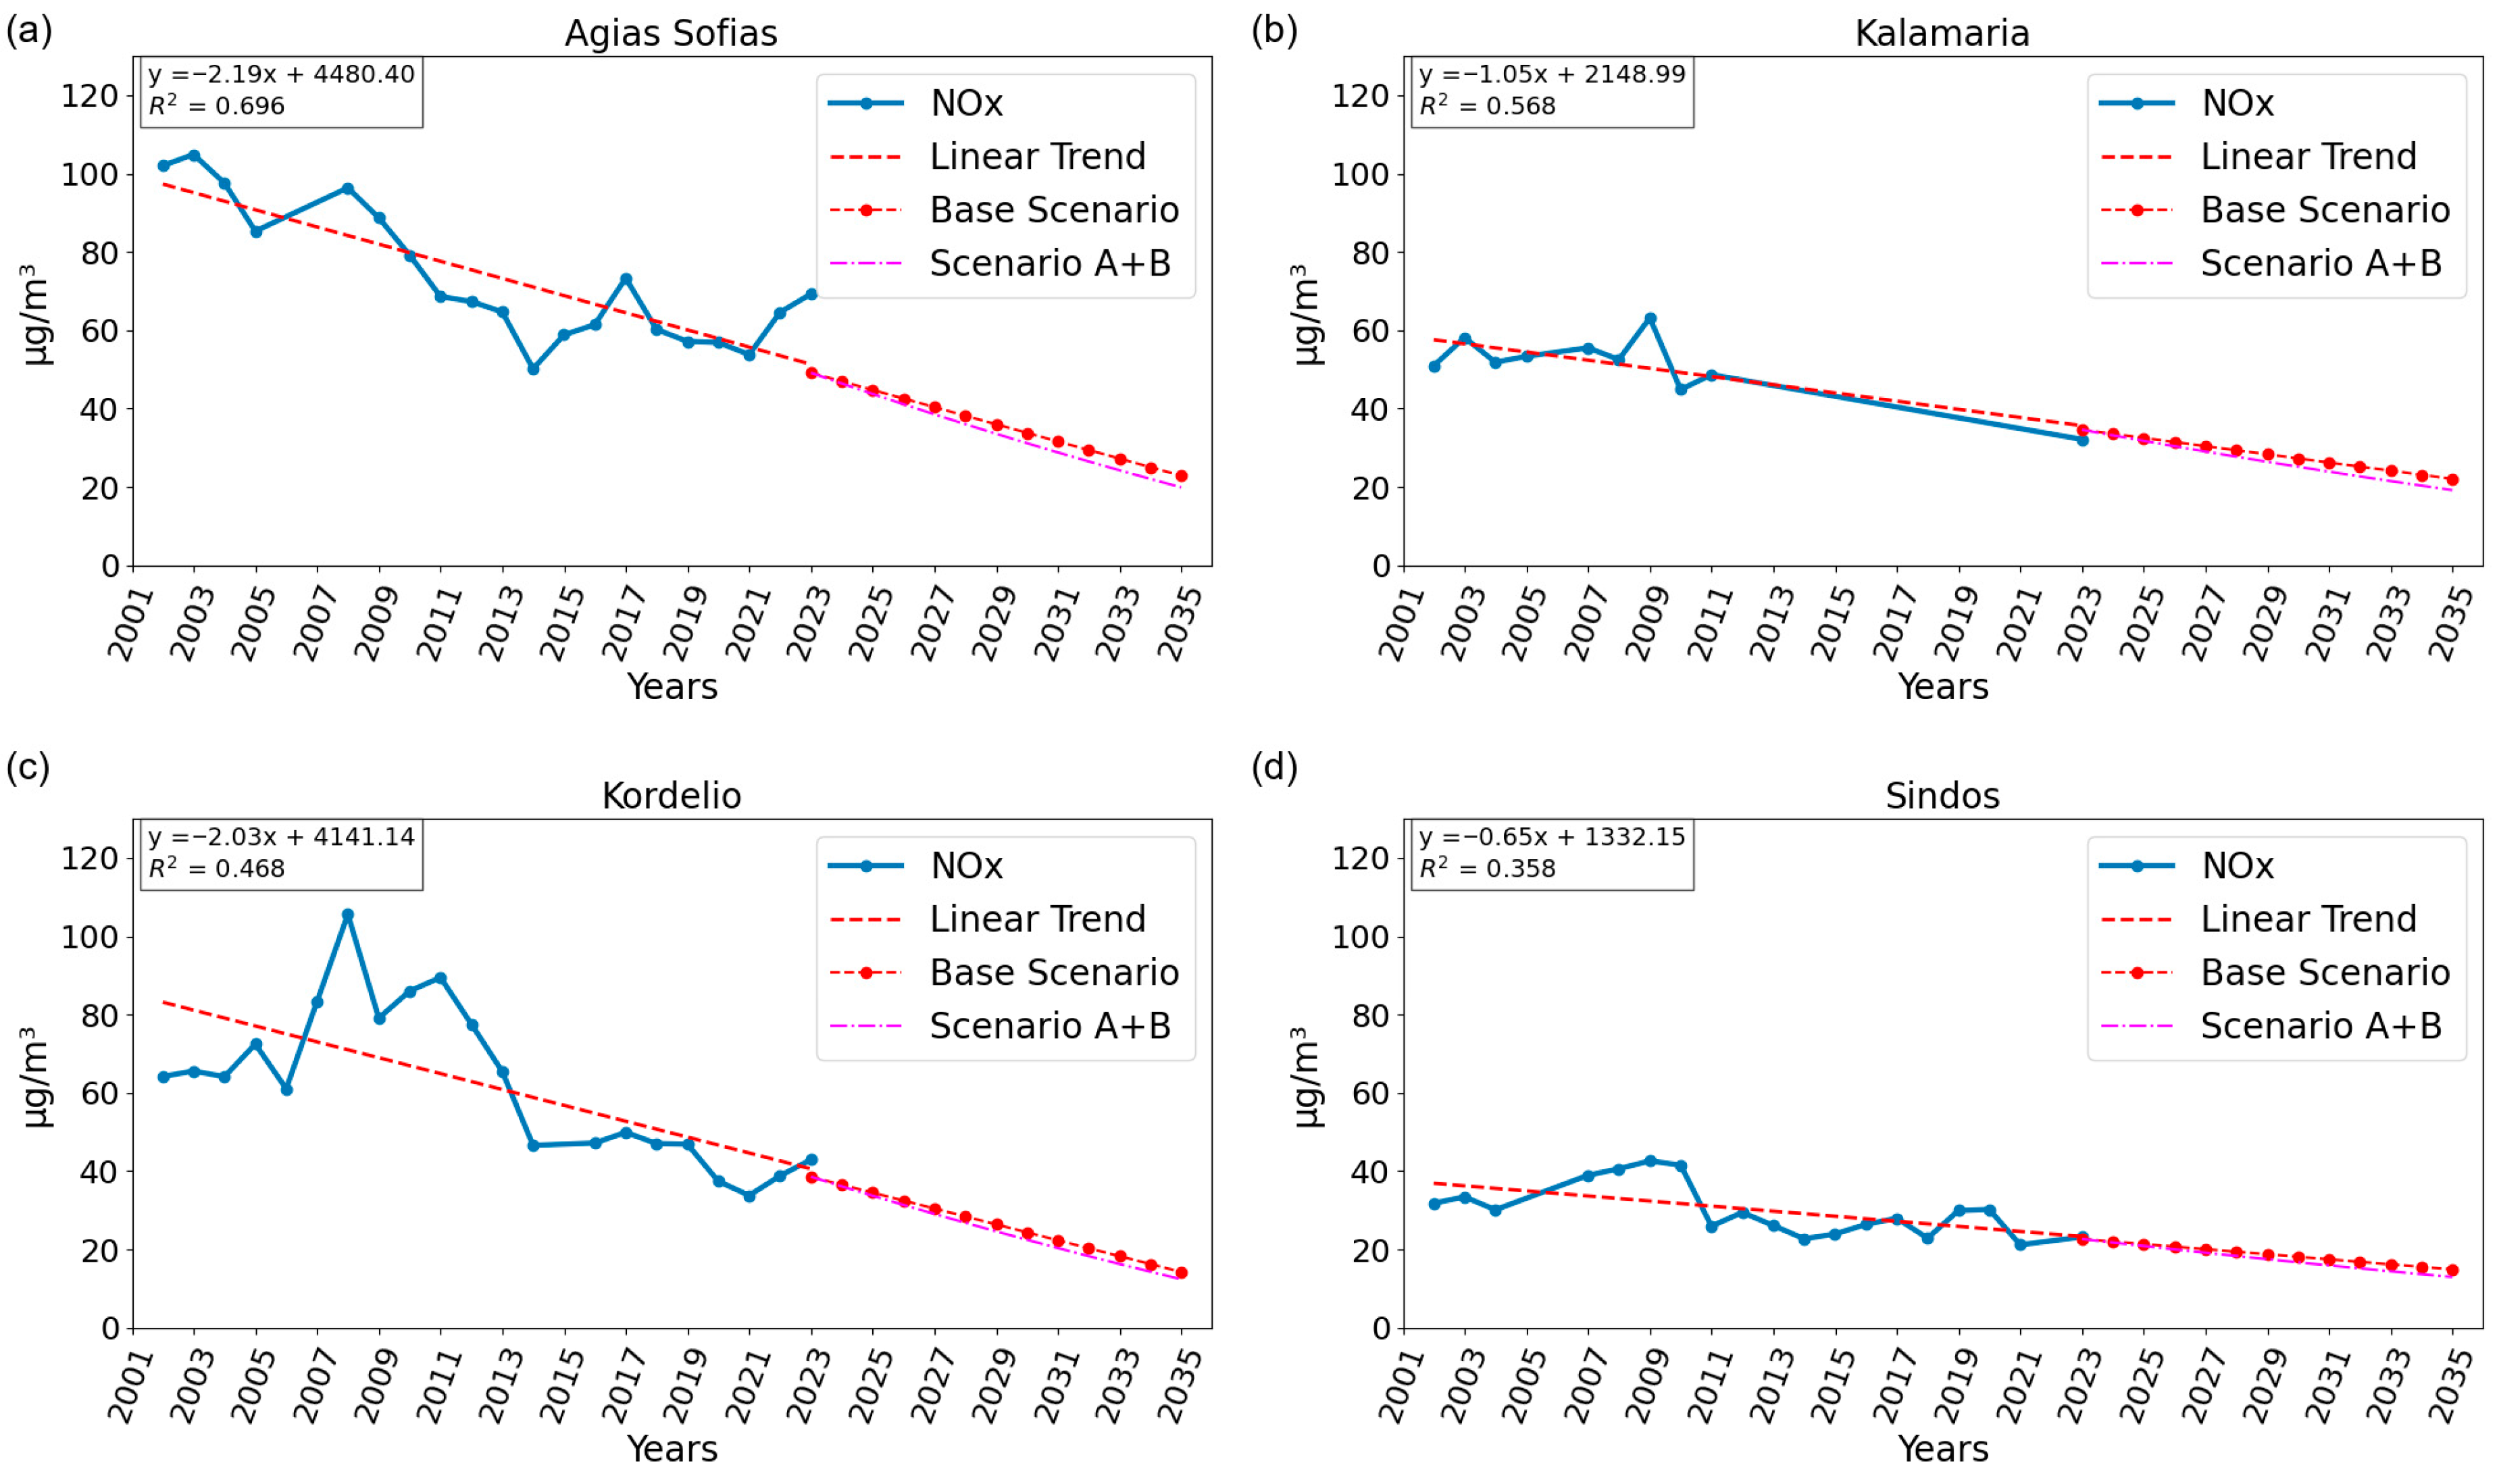
Figure 10 shows the annual mean concentrations of NOx from the four stations, along with the estimated projections up to 2035. The impact of traffic on NOx emissions is a primary concern. In the two scenarios under consideration, it is anticipated that the reduction in NOx emissions will be similar, as illustrated by the magenta line. A greater reduction is evident in the Agias Sofias station since this is an urban–traffic station with the highest number of vehicles in its vicinity; therefore, the adoption of zero-emissions vehicles will have the greatest impact on the NOx concentrations at this station. The reductions are much smaller at the other stations and almost minimal when compared to the base scenario (i.e., the absence of any measure).
Overall, the most significant impact of the measures is observed at Agias Sofias station, for both NOx and PM10 concentrations. Sindos is projected to experience a substantial reduction in PM10 levels under Scenario B, primarily due to its characterization as a suburban–industrial area with heavy traffic and considerable heating-related emissions. Although Sindos is not among the most densely populated regions, its location outside the main urban area limits access to natural gas infrastructure. As a result, many households rely on lower-quality heating fuels such as wood and pellets, which emit higher amounts of PM10. Finally, in the cases of Kalamaria and Kordelio stations, both PM10 and NOx concentrations are expected to decline but to a much lower extent. Due to the suburban nature of these areas, pollutant levels may also be influenced by additional sources, which may reduce the relative impact of the measures.

5. Summary and Conclusions

This study examines the air pollution variability in Thessaloniki over a 20-year period, focusing on the main air pollutants and how they evolved, also considering the adoption of new vehicle technologies and the impact of COVID-19. To provide an overview of the region, four monitoring stations were selected, each representing a different type of station: Agias Sofias, as a typical urban–traffic station; Kalamaria as an urban–background station; Kordelio, as an urban–industrial station; and Sindos as a suburban–industrial station. The air pollutants studied were NOx (NO and NO2), O3, and PM10. In addition, the synergy between meteorological conditions and air quality levels was examined.
PM10 concentrations showed a decreasing trend over the years until 2015, when an increase in PM emissions was observed, at least partially, due to the use of petrol private vehicles in Thessaloniki, which was allowed since the end of 2011. The analysis of the NO concentrations at the four stations showed that the highest concentrations were recorded at Agias Sofias station, linked to vehicle emissions, and Kordelio station, attributed mainly to emissions from industrial activities. However, in 2020, due to the COVID-19 mitigation measures, including lockdowns, NO concentrations decreased compared to the preceding and subsequent years. NO2 concentrations show a similar overall variability; however, the higher concentrations have been recorded in Kalamaria and Kordelio stations, due to the fact that NO2 is primarily a secondary pollutant. The NO2/NOx ratio provides significant insights into station types, with Agias Sofias and Kordelio stations having the lowest values, which are characteristic of the urban stations, as they are influenced by direct NO vehicle emissions. The O3 levels exhibit relatively steady trends over the years, with slight positive or negative fluctuations. Finally, concerning the impact of the meteorological parameters on air pollutants concentrations, the rose diagrams of PM10 concentrations with winds showed that local atmospheric circulation conditions significantly influence the concentrations. The analysis of temperature and O3 indicates that O3 concentrations rise with increasing temperatures, a finding also supported by Hatzianastassiou et al. [50].
Finally, future projections of PM10 and NOx up to 2035 showed that concentrations at Agias Sofias station appear to be most impacted, due to its central location in the city where emissions from both sectors (transport and household/central heating) are significant. Similar reductions, though less pronounced, are observed at the other three stations. From the overall results, it is suggested that either these measures should be more widely adopted by the majority of citizens or supplemented with additional policies to enhance their effectiveness.
Air pollution in the region of Thessaloniki remains an unresolved issue, albeit the measures taken to date. While some pollutants have shown a decreasing trend, others persist at concerning levels. During the COVID-19 pandemic, concentrations temporarily declined due to reduced activity, but rose again post-pandemic. The financial crisis of the previous decade (2009–2018) also contributed to increased emissions, particularly from residential heating, as many households turned to cheaper, more polluting fuels. On the other hand, the gradual adoption of cleaner vehicle technologies and stricter environmental measures has had a positive impact on air quality. To effectively address the problem, the government must take more decisive action, supporting the replacement of polluting heating systems, promoting public transportation, and incentivizing the shift to low-emission vehicles.

Author Contributions

Conceptualization, A.C. and I.M.; methodology, A.C.; software, A.C.; formal analysis, A.C.; investigation, A.C.; data curation, A.C.; writing—original draft preparation, A.C.; writing—review and editing, I.M.; visualization, A.C.; supervision, I.M. All authors have read and agreed to the published version of the manuscript.

Funding

This research received no external funding.

Institutional Review Board Statement

Not applicable.

Informed Consent Statement

Not applicable.

Data Availability Statement

The air pollution data are publicly available from the Greek Ministry of Environment and Energy (https://ypen.gov.gr/) and the meteorological data are also publicly available from the National Observatory of Athens (https://meteosearch.meteo.gr/data/index.cfm (accessed on 16 November 2023)).

Conflicts of Interest

The authors declare no conflicts of interest.

Appendix A

Table A1. Detected discontinuities in air quality records at Agias Sofias, Kalamaria, Kordelio, and Sindos stations for PM10, NO2, NO, and O3 during 2001–2022.
Agias SofiasKalamariaKordelioSindos
NONO2O3PM10NONO2O3PM10NONO2O3PM10NONO2O3PM10
Years2001-
2002-
2003-
2004-----
2005----------
2006------
2007-
2008-
2009-
2010-
2011---
2012----
2013---
2014-------
2015----
2016----
2017----
2018----
2019----
2020----
2021------
2022
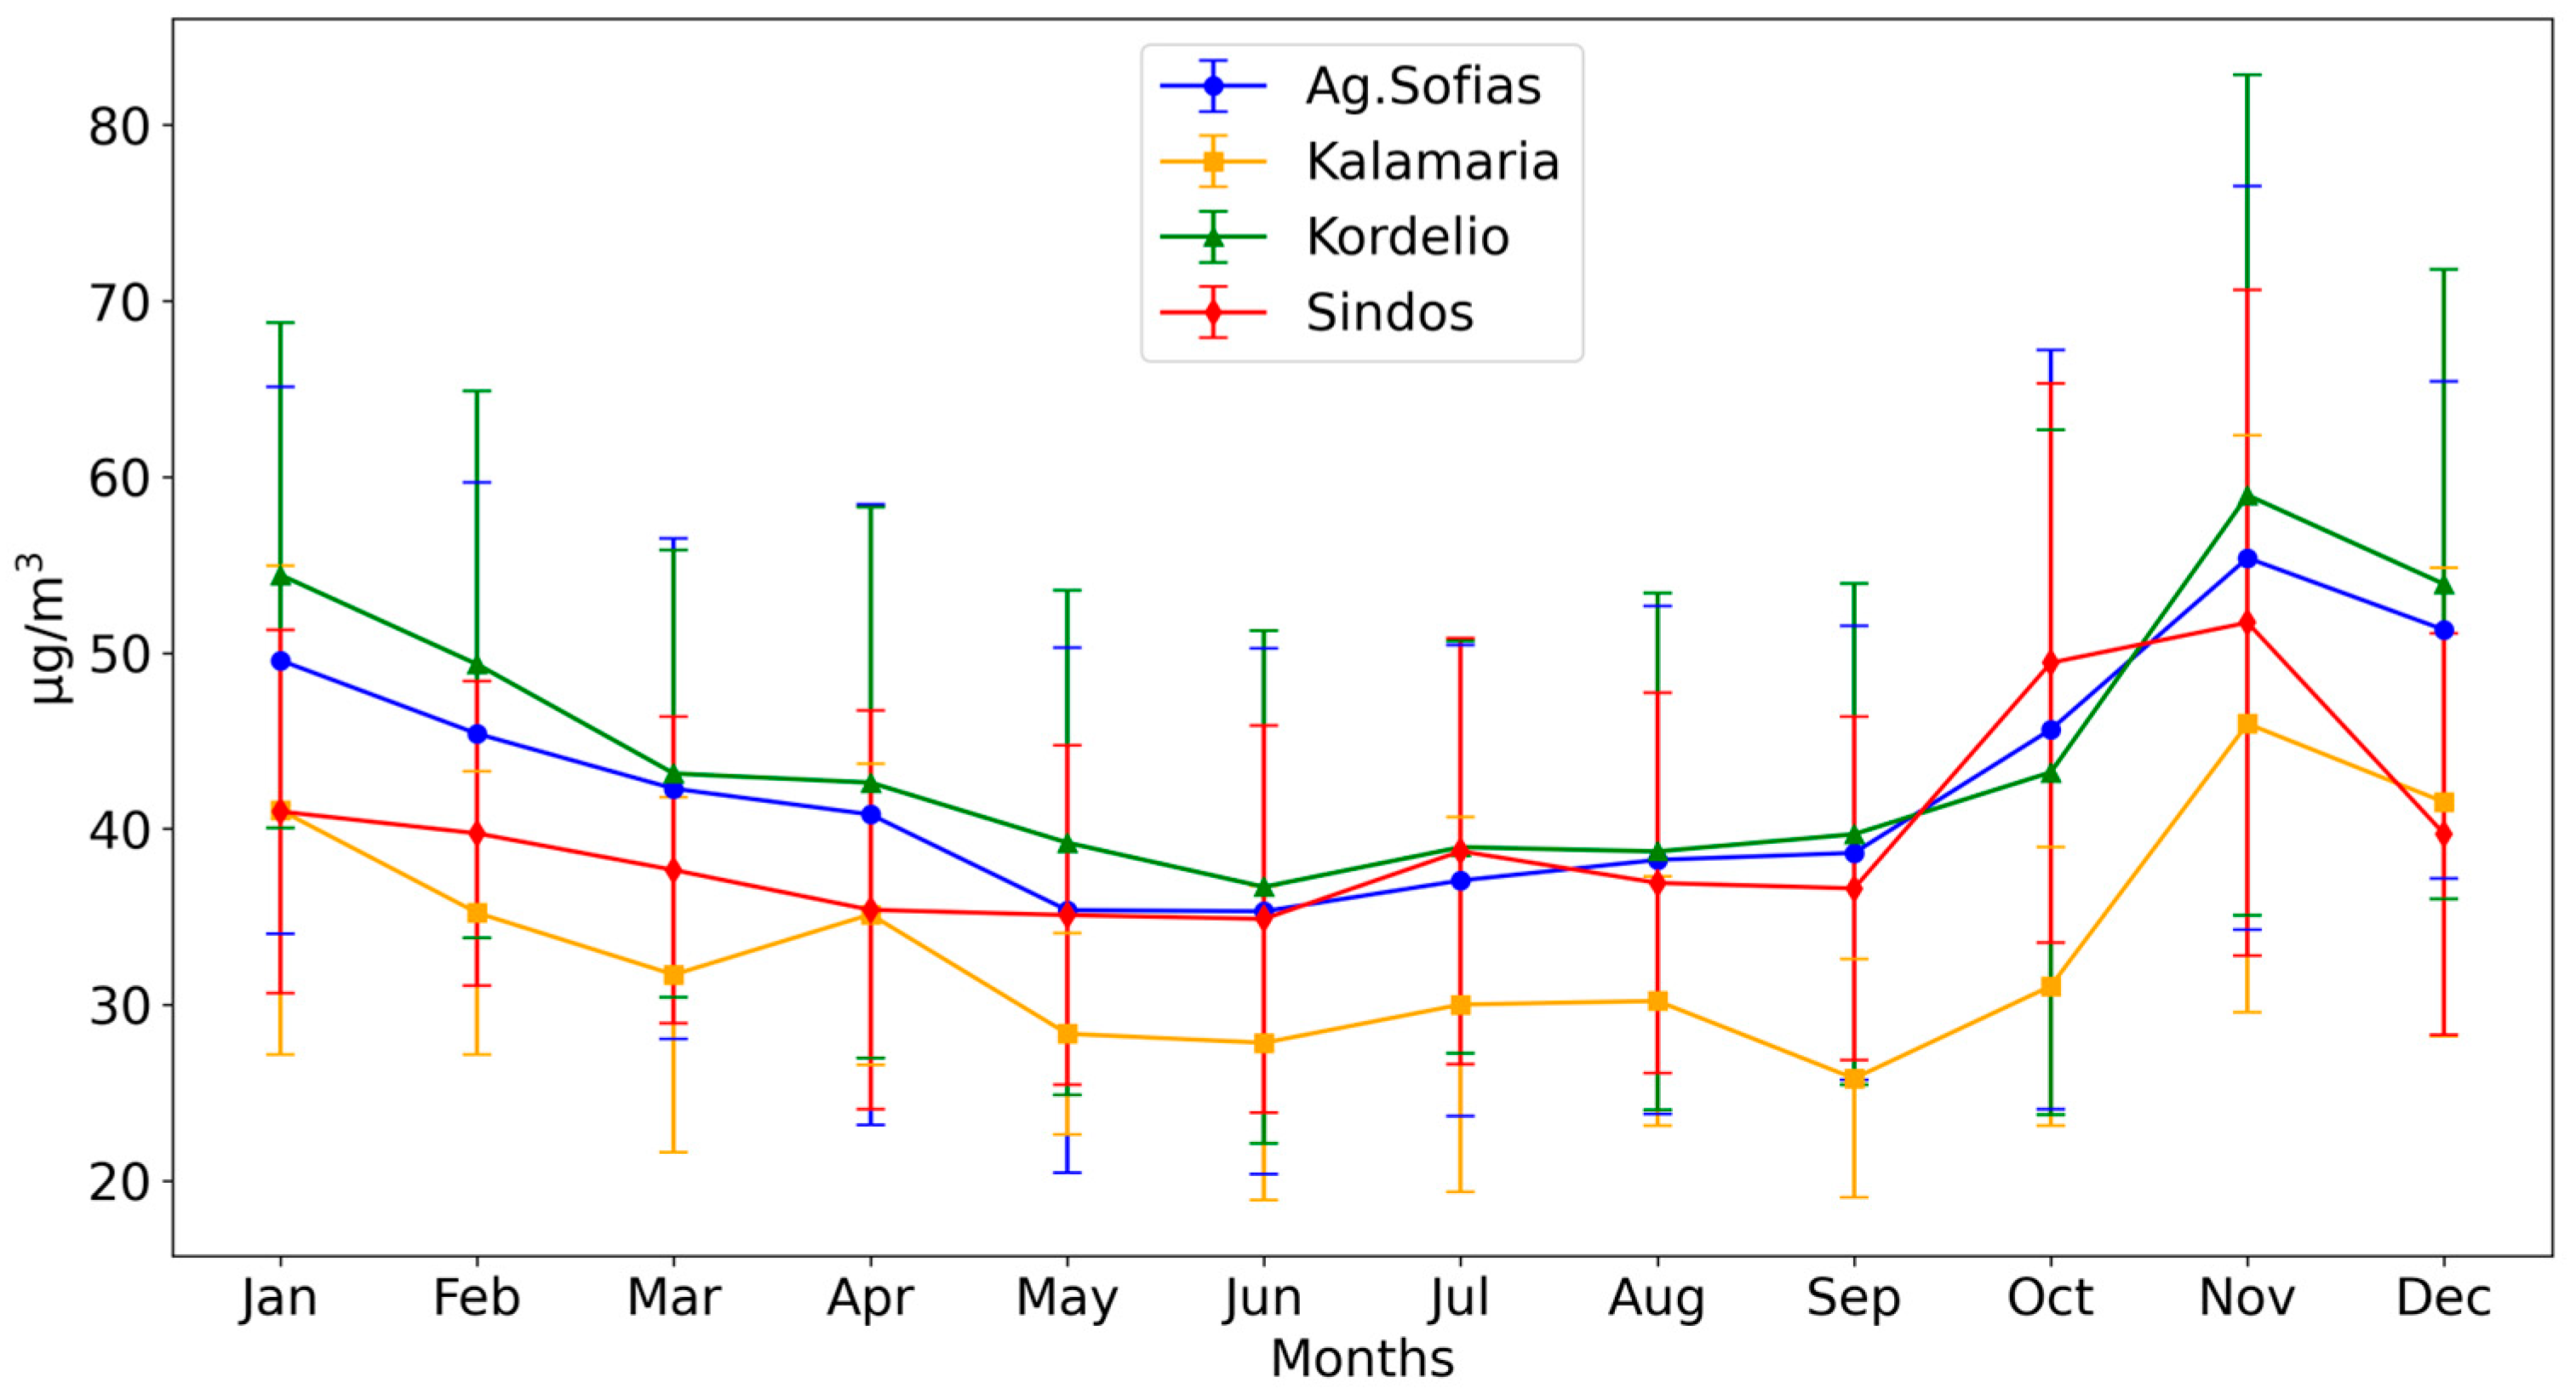
Figure A1. Monthly mean PM10 concentrations throughout the year for each station (blue: Ag. Sofias, orange: Kalamaria, green: Kordelio, red: Sindos), along with their standard deviations for each calendar month.
Atmosphere 16 01057 g0a1
Table A2. Standard deviation of PM10 concentrations for each calendar month, calculated across all available years at the four monitoring stations.
Agias SofiasKalamariaKordelioSindos
January15.613.914.410.3
February14.38.015.58.6
March14.210.112.78.7
April17.68.615.711.3
May14.95.714.49.6
June14.98.914.611.0
July13.410.611.712.1
August14.47.114.710.8
September12.96.814.29.8
October21.67.919.515.9
November21.116.423.918.9
December14.113.317.911.4
Figure A2. Monthly mean O3 concentrations throughout the year for each station (blue: Ag. Sofias, orange: Kalamaria, green: Kordelio, red: Sindos), along with their standard deviations for each calendar month.
Atmosphere 16 01057 g0a2
Table A3. Standard deviation of O3 concentrations for each calendar month, calculated across all available years at the four monitoring stations.
Agias SofiasKalamariaKordelioSindos
January8.15.116.610.6
February8.08.610.18.7
March13.58.512.78.8
April14.113.213.613.6
May19.018.518.715.2
June17.118.020.913.3
July13.720.923.213.1
August18.620.223.912.3
September14.317.413.010.5
October11.230.810.38.9
November8.815.67.47.9
December9.88.38.810.3

References

  1. World Health Organization. Air Quality. Available online: https://www.who.int/health-topics/air-pollution#tab=tab_1 (accessed on 31 October 2024).
  2. Sheoran, K.; Siwal, S.S.; Kapoor, D.; Singh, N.; Saini, A.K.; Alsanie, W.F.; Thakur, V.K. Air Pollutants Removal Using Biofiltration Technique: A Challenge at the Frontiers of Sustainable Environment. ACS Eng. Au 2022, 2, 378–396. [Google Scholar] [CrossRef] [PubMed]
  3. Manisalidis, I.; Stavropoulou, E.; Stavropoulos, A.; Bezirtzoglou, E. Environmental and Health Impacts of Air Pollution: A Review. Front. Public Health 2020, 8, 14. [Google Scholar] [CrossRef]
  4. Chen, F.; Zhang, W.; Mfarrej, M.F.B.; Saleem, M.H.; Khan, K.A.; Ma, J.; Raposo, A.; Han, H. Breathing in Danger: Understanding the Multifaceted Impact of Air Pollution on Health Impacts. Ecotoxicol. Environ. Saf. 2024, 280, 116532. [Google Scholar] [CrossRef]
  5. Ghorani-Azam, A.; Riahi-Zanjani, B.; Balali-Mood, M. Effects of Air Pollution on Human Health and Practical Measures for Prevention in Iran. J. Res. Med. Sci. 2016, 21, 65. [Google Scholar] [CrossRef]
  6. Nikolis, D.; Bais, A.; Karagkiozidis, D.; Koukouli, M.-E.; Balis, D. Direct Sun Total NO2 Column Measurements at Thessaloniki, Greece with Two DOAS Systems and Comparisons with S5P/TROPOMI. Atmos. Environ. 2025, 352, 121161. [Google Scholar] [CrossRef]
  7. Karagkiozidis, D.; Koukouli, M.-E.; Bais, A.; Balis, D.; Tzoumaka, P. Assessment of the NO2 Spatio-Temporal Variability over Thessaloniki, Greece, Using MAX-DOAS Measurements and Comparison with S5P/TROPOMI Observations. Appl. Sci. 2023, 13, 2641. [Google Scholar] [CrossRef]
  8. Jin, X.; Zhu, Q.; Cohen, R.C. Direct Estimates of Biomass Burning NOx Emissions and Lifetimes Using Daily Observations from TROPOMI. Atmos. Chem. Phys. 2021, 21, 15569–15587. [Google Scholar] [CrossRef]
  9. Jenkin, M.E.; Clemitshaw, K.C. Ozone and Other Secondary Photochemical Pollutants: Chemical Processes Governing Their Formation in the Planetary Boundary Layer. Atmos. Environ. 2000, 34, 2499–2527. [Google Scholar] [CrossRef]
  10. Kuebler, J.; Van Den Bergh, H.; Russell, A.G. Long-Term Trends of Primary and Secondary Pollutant Concentrations in Switzerland and Their Response to Emission Controls and Economic Changes. Atmos. Environ. 2001, 35, 1351–1363. [Google Scholar] [CrossRef]
  11. Wood, E.C.; Herndon, S.C.; Onasch, T.B.; Kroll, J.H.; Canagaratna, M.R.; Kolb, C.E.; Worsnop, D.R.; Neuman, J.A.; Seila, R.; Zavala, M.; et al. A Case Study of Ozone Production, Nitrogen Oxides, and the Radical Budget in Mexico City. Atmos. Chem. Phys. 2009, 9, 2499–2516. [Google Scholar] [CrossRef]
  12. Chapman, S. XXXV. On Ozone and Atomic Oxygen in the Upper Atmosphere. Lond. Edinb. Dublin Philos. Mag. J. Sci. 1930, 10, 369–383. [Google Scholar] [CrossRef]
  13. Breuer, J.L.; Samsun, R.C.; Peters, R.; Stolten, D. The Impact of Diesel Vehicles on NOx and PM10 Emissions from Road Transport in Urban Morphological Zones: A Case Study in North Rhine-Westphalia, Germany. Sci. Total Environ. 2020, 727, 138583. [Google Scholar] [CrossRef]
  14. Mavroidis, I.; Ilia, M. Trends of NOx, NO2 and O3 Concentrations at Three Different Types of Air Quality Monitoring Stations in Athens, Greece. Atmos. Environ. 2012, 63, 135–147. [Google Scholar] [CrossRef]
  15. Mavroidis, I.; Chaloulakou, A. Long-Term Trends of Primary and Secondary NO2 Production in the Athens Area. Variation of the NO2/NOx Ratio. Atmos. Environ. 2011, 45, 6872–6879. [Google Scholar] [CrossRef]
  16. Harrison, R.M.; Deacon, A.R.; Jones, M.R.; Appleby, R.S. Sources and Processes Affecting Concentrations of PM10 and PM2.5 Particulate Matter in Birmingham (U.K.). Atmos. Environ. 1997, 31, 4103–4117. [Google Scholar] [CrossRef]
  17. Liora, N.; Kontos, S.; Parliari, D.; Akritidis, D.; Poupkou, A.; Papanastasiou, D.K.; Melas, D. “On-Line” Heating Emissions Based on WRF Meteorology—Application and Evaluation of a Modeling System over Greece. Atmosphere 2022, 13, 568. [Google Scholar] [CrossRef]
  18. Kourtidis, K.A.; Ziomas, I.; Zerefos, C.; Kosmidis, E.; Symeonidis, P.; Christophilopoulos, E.; Karathanassis, S.; Mploutsos, A. Benzene, Toluene, Ozone, NO2 and SO2 Measurements in an Urban Street Canyon in Thessaloniki, Greece. Atmos. Environ. 2002, 36, 5355–5364. [Google Scholar] [CrossRef]
  19. Anusasananan, P.; Suwanarat, S.; Thangprasert, N. The Effect of Meteorological Parameters on Air Particulate Matter. J. Phys. Conf. Ser. 2023, 2653, 012068. [Google Scholar] [CrossRef]
  20. Coates, J.; Mar, K.A.; Ojha, N.; Butler, T.M. The Influence of Temperature on Ozone Production under Varying NOx Conditions–A Modelling Study. Atmos. Chem. Phys. 2016, 16, 11601–11615. [Google Scholar] [CrossRef]
  21. Chen, B.; Zhen, L.; Wang, L.; Zhong, H.; Lin, C.; Yang, L.; Xu, W.; Huang, R.-J. Revisiting the Impact of Temperature on Ground-Level Ozone: A Causal Inference Approach. Sci. Total Environ. 2024, 953, 176062. [Google Scholar] [CrossRef]
  22. Yoshikado, H. Correlation between Air Temperature and Surface Ozone in Their Extreme Ranges in the Greater Tokyo Region. Asian J. Atmos. Environ. 2023, 17, 9. [Google Scholar] [CrossRef]
  23. Wang, J.; Li, J.; Li, X.; Wang, D.; Fang, C. Relationship between Ozone and Air Temperature in Future Conditions: A Case Study in Sichuan Basin, China. Environ. Pollut. 2024, 343, 123276. [Google Scholar] [CrossRef]
  24. European Council, Council of the European Union. Air Pollution in the EU: Facts and Figures. Available online: https://www.consilium.europa.eu/en/infographics/air-pollution-in-the-eu/#0 (accessed on 4 November 2024).
  25. European Environmental Agency. Emissions of Air Pollutants from Transport in Europe. 2024. Available online: https://www.eea.europa.eu/en/analysis/indicators/emissions-of-air-pollutants-from?activeAccordion=ecdb3bcf-bbe9-4978-b5cf-0b136399d9f8 (accessed on 9 November 2024).
  26. Colvile, R.N.; Hutchinson, E.J.; Mindell, J.S.; Warren, R.F. The Transport Sector as a Source of Air Pollution. Atmos. Environ. 2001, 35, 1537–1565. [Google Scholar] [CrossRef]
  27. Giechaskiel, B.; Grigoratos, T.; Dilara, P.; Karageorgiou, T.; Ntziachristos, L.; Samaras, Z. Light-Duty Vehicle Brake Emission Factors. Atmosphere 2024, 15, 97. [Google Scholar] [CrossRef]
  28. IARC Working Group on the Evaluation of Carcinogenic Risks to Humans 1.2. Sources of Air Pollutants. In Outdoor Air Pollution; IARC Monographs on the Evaluation of Carcinogenic Risks to Humans: Lyon, France, 2016; Volume 109, ISBN-13: 978-9283201472.
  29. Hellenic Statistical Authority. Resident Population Census. 2024. Available online: https://www.statistics.gr/documents/20181/18409455/population_VORIA_ELLADA_GR.pdf/f58eadef-d65a-86c4-db62-f1ad87e0ecf0 (accessed on 15 November 2024).
  30. Moussiopoulos, N.; Vlachokostas, C.; Tsilingiridis, G.; Douros, I.; Hourdakis, E.; Naneris, C.; Sidiropoulos, C. Air Quality Status in Greater Thessaloniki Area and the Emission Reductions Needed for Attaining the EU Air Quality Legislation. Sci. Total Environ. 2009, 407, 1268–1285. [Google Scholar] [CrossRef]
  31. Saffari, A.; Daher, N.; Samara, C.; Voutsa, D.; Kouras, A.; Manoli, E.; Karagkiozidou, O.; Vlachokostas, C.; Moussiopoulos, N.; Shafer, M.M.; et al. Increased Biomass Burning Due to the Economic Crisis in Greece and Its Adverse Impact on Wintertime Air Quality in Thessaloniki. Environ. Sci. Technol. 2013, 47, 13313–13320. [Google Scholar] [CrossRef]
  32. Vouitsis, I.; Amanatidis, S.; Ntziachristos, L.; Kelessis, A.; Petrakakis, M.; Stamos, I.; Mitsakis, E.; Samaras, Z. Daily and Seasonal Variation of Traffic Related Aerosol Pollution in Thessaloniki, Greece, during the Financial Crisis. Atmos. Environ. 2015, 122, 577–587. [Google Scholar] [CrossRef]
  33. Ministry of Energy and Environment Annual Air Quality Report 2023. 2024. Available online: https://ypen.gov.gr/wp-content/uploads/2024/08/%CE%95%CE%9A%CE%98%CE%95%CE%A3%CE%97-2023.pdf (accessed on 15 November 2024).
  34. Progiou, A.; Liora, N.; Sebos, I.; Chatzimichail, C.; Melas, D. Measures and Policies for Reducing PM Exceedances through the Use of Air Quality Modeling: The Case of Thessaloniki, Greece. Sustainability 2023, 15, 930. [Google Scholar] [CrossRef]
  35. Scerri, M.M.; Weinbruch, S.; Delmaire, G.; Mercieca, N.; Nolle, M.; Prati, P.; Massabò, D. Exhaust and Non-Exhaust Contributions from Road Transport to PM10 at a Southern European Traffic Site. Environ. Pollut. 2023, 316, 120569. [Google Scholar] [CrossRef] [PubMed]
  36. European Environmental Agency. Greece–Air Pollution Country Fact Sheet. 2024. Available online: https://www.eea.europa.eu/en/topics/in-depth/air-pollution/air-pollution-country-fact-sheets-2024/greece-air-pollution-country-fact-sheet-2024 (accessed on 24 June 2025).
  37. Christodoulaki, R.; Drosou, V.; Papadopoulos, A. Political, Economic, Social, Technical, Environmental and Legal Analysis of the Hellenic Heating and Cooling Sector. Energies 2024, 17, 3902. [Google Scholar] [CrossRef]
  38. Mpoi, G.; Milioti, C.; Mitropoulos, L. Factors and Incentives That Affect Electric Vehicle Adoption in Greece. Int. J. Transp. Sci. Technol. 2023, 12, 1064–1079. [Google Scholar] [CrossRef]
  39. Many Factors Contribute to Air Pollution Concentration Levels. 2013. Available online: https://www.eea.europa.eu/en/analysis/maps-and-charts/many-factors-contribute-to-air-1?activeTab=570bee2d-1316-48cf-adde-4b640f92119b (accessed on 24 June 2025).
  40. Tsiaousidis, D.T.; Liora, N.; Kontos, S.; Poupkou, A.; Akritidis, D.; Melas, D. Evaluation of PM Chemical Composition in Thessaloniki, Greece Based on Air Quality Simulations. Sustainability 2023, 15, 10034. [Google Scholar] [CrossRef]
  41. Sindosi, O.A.; Hatzianastassiou, N.; Markozannes, G.; Rizos, E.C.; Ntzani, E.; Bartzokas, A. PM10 Concentrations in a Provincial City of Inland Greece in the Times of Austerity and Their Relationship with Meteorological and Socioeconomic Conditions. Water. Air. Soil Pollut. 2021, 232, 77. [Google Scholar] [CrossRef]
  42. Triantafyllou, E.; Biskos, G. Overview of the Temporal Variation of PM10 Mass Concentrations in the Two Major Cities in Greece: Athens and Thessaloniki. Glob. NEST J. 2013, 14, 431–441. [Google Scholar] [CrossRef]
  43. Valavanidis, A.; Vlachogianni, T.; Loridas, S.; Fiotakis, C. Atmospheric Pollution in Urban Areas of Greece and Economic Crisis. Trends in Air Quality and Atmospheric Pollution Data, Research and Adverse Health Effects. 2015. Available online: https://www.semanticscholar.org/paper/Atmospheric-Pollution-in-Urban-Areas-of-Greece-and-Athanasios-Vlachogianni/fd4f2f3ad41614c5a090f323499736b0cabf8f74 (accessed on 20 November 2024).
  44. Spyropoulos, G.C.; Nastos, P.T.; Moustris, K.P.; Chalvatzis, K.J. Transportation and Air Quality Perspectives and Projections in a Mediterranean Country, the Case of Greece. Land 2022, 11, 152. [Google Scholar] [CrossRef]
  45. Anttila, P.; Tuovinen, J.-P.; Niemi, J.V. Primary NO2 Emissions and Their Role in the Development of NO2 Concentrations in a Traffic Environment. Atmos. Environ. 2011, 45, 986–992. [Google Scholar] [CrossRef]
  46. Chaloulakou, A.; Mavroidis, I.; Gavriil, I. Compliance with the Annual NO2 Air Quality Standard in Athens. Required NOx Levels and Expected Health Implications. Atmos. Environ. 2008, 42, 454–465. [Google Scholar] [CrossRef]
  47. Im, U.; Markakis, K.; Poupkou, A.; Melas, D.; Unal, A.; Gerasopoulos, E.; Daskalakis, N.; Kindap, T.; Kanakidou, M. The Impact of Temperature Changes on Summer Time Ozone and Its Precursors in the Eastern Mediterranean. Atmos. Chem. Phys. 2011, 11, 3847–3864. [Google Scholar] [CrossRef]
  48. Pyrgou, A.; Hadjinicolaou, P.; Santamouris, M. Enhanced Near-Surface Ozone under Heatwave Conditions in a Mediterranean Island. Sci. Rep. 2018, 8, 9191. [Google Scholar] [CrossRef] [PubMed]
  49. Katragkou, E.; Kazadzis, S.; Amiridis, V.; Papaioannou, V.; Karathanasis, S.; Melas, D. PM10 Regional Transport Pathways in Thessaloniki, Greece. Atmos. Environ. 2009, 43, 1079–1085. [Google Scholar] [CrossRef]
  50. Hatzianastassiou, N.; Katsoulis, B.D.; Antakis, B. Extreme Nitrogen Oxide and Ozone Concentrations in Athens Atmosphere in Relation to Meteorological Conditions. Environ. Monit. Assess. 2007, 128, 447–464. [Google Scholar] [CrossRef] [PubMed]
Figure 1. Map of Thessaloniki with the air pollution stations used in the present study.
Atmosphere 16 01057 g001
Figure 2. (a) Annual mean PM10 concentrations at the four monitoring stations. (b) Monthly mean PM10 concentrations throughout the year for each station (blue: Ag. Sofias, orange: Kalamaria, green: Kordelio, red: Sindos).
Atmosphere 16 01057 g002
Figure 3. Time-series of annual mean concentrations of (a) NO, (b) NO2, and (c) the NO2/NOx ratio. Station colors are consistent with Figure 2 (blue: Ag. Sofias, orange: Kalamaria, green: Kordelio, red: Sindos).
Atmosphere 16 01057 g003
Figure 4. Diurnal variation of (a) NO, (b) NO2, and (c) the NO2/NOx ratio. Station colors are consistent with Figure 2 (blue: Ag. Sofias, orange: Kalamaria, green: Kordelio, red: Sindos).
Atmosphere 16 01057 g004
Figure 5. (a) Diurnal and (b) annual variation of O3 concentrations at the four stations. (c) Time-series of annual mean O3 concentrations. Station colors are consistent with Figure 2 (blue: Ag. Sofias, orange: Kalamaria, green: Kordelio, red: Sindos).
Atmosphere 16 01057 g005
Figure 6. Scatter plots of NO2 and O3 concentrations at the four stations: (a) Agias Sofias, (b) Kalamaria, (c) Kordelio, and (d) Sindos.
Atmosphere 16 01057 g006
Figure 7. Rose diagrams showing wind speed and direction and PM10 concentrations at the four stations: (a) City Centers, (b) Kalamaria, (c) Kordelio, and (d) Sindos.
Atmosphere 16 01057 g007
Figure 8. Annual variability of O3 concentrations (blue dotted line) and temperature (red line) at (a) the urban city center Agias Sofias station and (b) the industrial Sindos station.
Atmosphere 16 01057 g008
Figure 9. Annual mean PM10 concentrations (μg/m3) from 2001 to 2035 at the four stations: (a) Agias Sofias, (b) Kalamaria, (c) Kordelio, and (d) Sindos. Solid lines show measured values; red dashed lines represent linear trend extrapolations up to 2035. Two future scenarios illustrate exponential annual reductions starting from the end of the observation period: Scenario 1 (1% reduction, green) and Scenario 2 (2.75% reduction, orange).
Atmosphere 16 01057 g009
Figure 10. Annual mean NOx concentrations (μg/m3) from 2001 to 2035 at the four stations: (a) Agias Sofias, (b) Kalamaria, (c) Kordelio, and (d) Sindos. Solid lines represent measured values; red dashed lines show linear trend extrapolations up to 2035. One future scenario is illustrated with an exponential annual reduction of 1.17% (magenta), starting from the end of the observation period.
Atmosphere 16 01057 g010
Table 1. Air pollution and meteorological stations in Thessaloniki selected for the present study.
Air Pollution Monitoring StationTypeLat (° N)Lon (° E)Meteorological StationLat (° N)Lon (° E)Elevation (m)Distance (km)
Agias SofiasUrban–Traffic40.6322.95HELEXPO40.6222.95291.1
KalamariaUrban–Background40.5822.96Kalamaria40.6022.90335.5
KordelioUrban–Industrial40.6722.89Kordelio40.7022.90243.4
SindosSuburban–Industrial40.6622.80Sindos40.7022.8064.4
Table 2. Estimated source contribution, policy reach, and emission-to-concentration factor for PM10 and NOx concentrations based on the two future scenarios.
Air PollutantSource Contribution (%)Policy Reach (%)Emission-to-Concentration Factor (%)Real Reduction (%)
TransportNOx47%50%60%14%
PM1038%50%60%12%
HeatingPM1062%55%60%20%
Table 3. Estimated reductions in PM10 and NOx concentrations in 2035, based on the two scenarios.
PM10NOx
Scenario A12%14%
Scenario B30%14%
Table 4. The mean NO2/NOx concentration ratios for the period 2001–2022, for each monitoring site.
Monitoring SiteClassificationNO2/NOx (2001–2022)
Agias SofiasUrban–Traffic0.47
KalamariaUrban–Background0.71
KordelioUrban–Industrial0.53
SindosSuburban–Industrial0.67
Disclaimer/Publisher’s Note: The statements, opinions and data contained in all publications are solely those of the individual author(s) and contributor(s) and not of MDPI and/or the editor(s). MDPI and/or the editor(s) disclaim responsibility for any injury to people or property resulting from any ideas, methods, instructions or products referred to in the content.