Abstract
Gross primary productivity (GPP) is a key carbon flux in the global carbon cycle, and understanding the inhibitory effects of drought on GPP and its underlying mechanisms is crucial for understanding carbon–climate feedback. However, current research has not sufficiently addressed the threshold dynamics and regional differentiation of GPP responses to the synergistic effects of meteorological drought (MD) and soil moisture drought (SD), particularly in the drought-sensitive Mongolian Plateau. This study focuses on the Mongolian Plateau from 1982 to 2021, using the standardized precipitation index (SPI) and standardized soil moisture index (SSI) to characterize MD and SD, respectively. The study combines the three-threshold run theory, cross-wavelet analysis, Spearman correlation analysis, and copula models to systematically investigate the variation characteristics, propagation patterns, and the probability and thresholds for triggering GPP loss under different time scales (monthly, seasonal, semi-annual, and annual). The results show that (1) both types of droughts exhibited significant intensification trends, with SD intensifying at a faster rate (annual scale SSI12 trend: −0.34/10a). The intensification trend strengthened with increasing time scales. MD exhibited high frequency, short duration, and low intensity, while SD showed the opposite characteristics. The most significant aridification occurred in the central region. (2) The average propagation time from MD to SD was 11.22 months. The average response time of GPP to MD was 10.46 months, while the response time to SD was significantly shorter (approximately 2 months on average); the correlation between SSI and GPP was significantly higher than that between SPI and GPP. (3) The conditional probability of triggering mild GPP loss (e.g., <40th percentile) was relatively high for both drought types, and the probability of loss increased as the time scales extended. Compared to MD, SD was more likely to induce severe GPP loss. Additionally, the drought intensity threshold for triggering mild loss was lower (i.e., mild drought could trigger it), while higher drought intensity was required to trigger severe and extreme losses. Therefore, this study provides practical guidance for regional drought early-warning systems and ecosystem adaptive management, while laying an important theoretical foundation for a deeper understanding of drought response mechanisms.
1. Introduction
Gross primary productivity (GPP) represents the largest flux in the global carbon cycle, characterizing the capacity of vegetation to fix atmospheric carbon dioxide (CO2) through photosynthesis. It plays a critical role in offsetting anthropogenic carbon emissions and mitigating global warming [1]. As a core indicator of ecosystem health and carbon cycle dynamics, GPP is highly sensitive to climate fluctuations, particularly extreme climatic events [2]. Drought, as one of the most destructive extreme climate phenomena, significantly suppresses vegetation GPP [3,4,5]. Water stress directly constrains plant photosynthesis, with its impact mechanisms primarily manifesting in two aspects [6,7,8,9]: (i) plant physiological responses (e.g., reduced photosynthetic enzyme activity, decreased stomatal conductance) inhibit carbon assimilation; and (ii) vegetation structural changes (e.g., reduced growth or mortality) weaken the carbon sink function of ecosystems. Research indicates that the negative impacts of drought on GPP are becoming increasingly frequent and severe, potentially even offsetting the potential GPP increase induced by global warming [10,11]. For instance, the severe 2003 European drought caused a sharp regional GPP reduction of approximately 30%, releasing substantial carbon back into the atmosphere and reversing the carbon sequestration achieved over the previous four years [12]. Therefore, in-depth investigation into the mechanisms of drought impacts on GPP and the vegetation response process is crucial for understanding the complex feedback between the carbon cycle and climate change.
Although the physiological and ecological mechanisms by which drought affects vegetation are understood, accurately predicting its specific impact on gross primary productivity (GPP) remains challenging. Studies reveal that drought onset does not necessarily trigger immediate vegetation loss [13]. Factors including plant physiological adaptation, soil moisture buffering effects, and CO2 fertilization may cause drought impacts to exhibit lagged or cumulative characteristics, with negative effects often only triggered when drought intensity exceeds a critical threshold [14,15,16]. Therefore, identifying the critical threshold for drought-induced vegetation loss is essential for defining impaired ecosystem functional states and understanding drought impact mechanisms. Notably, drought impacts typically originate from meteorological drought (MD), which progressively propagates to soil moisture drought (SD) that directly affects vegetation roots [15,17,18]. MD characterizes atmospheric water deficit, while SD directly reflects vegetation-available water status [19]. These two drought types exhibit fundamental differences in their pathways and intensities of impact on GPP, and their coupling may exacerbate comprehensive vegetation stress. Although existing research has addressed drought–GPP response mechanisms, significant limitations persist in multiscale synergistic analysis. For instance, Guo et al. [20] used a copula model to reveal the threshold characteristics of MD-triggered GPP loss at monthly scales without exploring dynamic changes at longer time scales (e.g., seasonal, annual); Deng et al. [21] identified negative response patterns of LAI and GPP to MD but did not contrast these with SD impacts; Li et al. [22] identified critical drought thresholds affecting Mongolian Plateau vegetation but failed to analyze the contribution weights of both drought types across different time scales. These limitations have led to fragmented academic understanding of the cross-scale propagation mechanism in the “MD-SD-GPP loss” cascade: at monthly scales, MD may rapidly alter surface soil moisture to affect transient photosynthetic efficiency [23], whereas at annual scales, the cumulative effects of SD are more likely to suppress interannual productivity through deep-root water stress [24]. However, current research lacks systematic comparisons of threshold characteristics between both drought types across different time scales and fails to elucidate their regional differentiation patterns in drought-sensitive areas like the Mongolian Plateau. Against the backdrop of global warming, where multiscale characteristics of drought events are becoming increasingly prominent, studies confined to single scales or drought types cannot support precise assessments of ecosystem carbon sink functionality.
The Mongolian Plateau, as a globally significant temperate arid and semi-arid region, serves as a typical area for studying the impact of drought on vegetation productivity [14]. Located deep in the interior of the continent, the plateau features a dry climate, scarce and highly variable precipitation, and an ecologically fragile environment, rendering it extremely sensitive to climate change. In recent years, both the frequency and intensity of drought events on the Mongolian Plateau have shown an increasing trend, posing severe threats to regional grassland ecosystems and water resource security [17]. Concurrently, the plateau’s vegetation, dominated by grasslands but also including deserts, shrubs, and forests, exhibits high dependence on limited water availability and responds rapidly and significantly to drought stress. As a critical ecological barrier connecting East Asia and North Asia, changes in the vegetation status of the Mongolian Plateau not only affect regional carbon cycling and soil water conservation but also hold significant trans-regional environmental implications. Therefore, a deep understanding of the thresholds for triggering GPP loss by meteorological drought (MD) and soil moisture drought (SD) across different vegetation types within this region is crucial for assessing ecosystem resilience, predicting future ecological responses, and formulating effective conservation strategies.
To fill the above research gaps, the Mongolian Plateau, a key ecological barrier area sensitive to climate change, was selected as the study area in this study. Based on the run theory and copula function modeling, we focused on meteorological drought (MD) and soil drought (SD), aiming to quantify the extent of the effects of these two drought types on the gross primary productivity (GPP) of the growing season at different time scales. To this end, we formulated the following research hypotheses: (1) there is a longer lag time in the response of GPP to MD than to SD; and (2) SD has a greater effect on GPP than MD at seasonal time scales.
2. Materials and Methods
2.1. Study Area
The Mongolian Plateau (88°43′–126°04′ E, 37°24′–53°23′ N) spans the entire territory of Mongolia and China’s Inner Mongolia Autonomous Region, encompassing a total area of approximately 2.75 million km2. Its topography exhibits a distinct gradient: the northwestern region is dominated by high mountains, transitioning to hills and plains in the central and eastern parts, while the southwestern area is characterized by extensive Gobi Desert landscapes (Figure 1a). Governed by this topographic pattern, vegetation cover displays a northeast-to-southwest decreasing gradient, sequentially supporting forest, meadow steppe, typical steppe, desert steppe, and desert ecosystems (Figure 1b). The region experiences a typical temperate continental climate, with a mean annual temperature of 1.9 °C and mean annual precipitation of only 233 mm. Over the past decade, extreme drought events have occurred frequently. This persistent drought stress has triggered ecological crises, including pasture degradation, biodiversity loss, and expansion of desertified areas, seriously jeopardizing the livelihoods of nomadic herders and the function of the regional ecological security barrier.
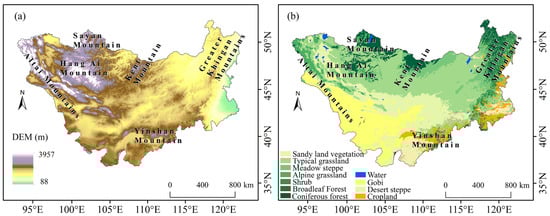
Figure 1.
(a) Digital elevation model (DEM) and (b) vegetation types of the Mongolian Plateau.
2.2. Data Processing
This study utilized the ERA5-Land reanalysis dataset [23] (monthly scale, 0.1° spatial resolution) released by the European Centre for Medium-Range Weather Forecasts (ECMWF) as the source for meteorological and hydrological data. Based on ERA5-Land precipitation and soil moisture data, the standardized precipitation index (SPI) and standardized soil moisture index (SSI) were calculated to characterize meteorological drought (MD) and soil moisture drought (SD) conditions, respectively. Gross primary productivity (GPP) data were sourced from the AVHRR-based GLASS GPP product (1981–2018) with a spatial resolution of 0.05°. To maximize the utilization of available dataset information and extend the time series, we fused the GLASS GPP data with GOSIF GPP data (monthly scale, 0.05°) using a pixel-wise linear regression model. This generated an extended GLASS GPP dataset covering the period 1982–2021. To ensure spatial consistency and accuracy for subsequent analyses, all datasets (ERA5-Land derived drought indices, original and extended GLASS GPP) were uniformly resampled to a spatial resolution of 0.1°.
2.3. Research Methods
2.3.1. General Framework
The methodological framework of this study is presented in three parts, as shown in Figure 2. Part 1: This section involves calculating the standardized precipitation index (SPI) and standardized soil moisture index (SSI) at different time scales using standardized methods. These indices are then combined with the three-threshold run theory to extract the drought characteristics and spatiotemporal distribution of SPI and SSI. This approach helps to identify the key drought features, such as drought intensity, duration, and frequency, across multiple time scales (monthly, seasonal, half-year, and annual). Part 2: The study uses cross-wavelet analysis and Spearman rank correlation analysis to examine the sequence in which MD and SD occur across different time scales and further determines the time lag between MD and SD. Part 3: In the final part, the study investigates the impact of MD and SD on gross primary productivity (GPP) across various time scales. It includes an analysis of GPP response time, the probability of GPP loss, and the threshold values for GPP loss at different drought severity levels.
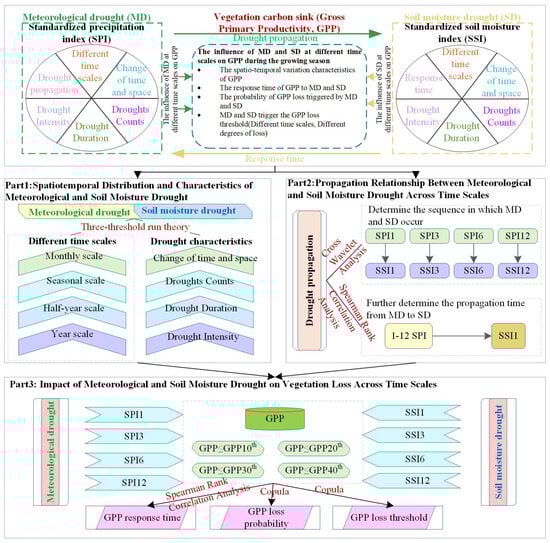
Figure 2.
General framework.
2.3.2. Evaluation of Different Drought Types
This study employed the standardized precipitation index (SPI) and standardized soil moisture index (SSI) to characterize meteorological drought (MD) and soil moisture drought (SD) conditions across specific temporal scales. Recognized for computational simplicity and interpretational clarity, SPI and SSI have been extensively utilized as drought detection indicators in diverse global regions [7]. The SPI methodology involves modeling monthly precipitation as a random variable and fitting the precipitation time series to an appropriate probability distribution. Similarly, SSI computation applies an identical analytical framework to soil moisture time series. Established research confirms the gamma distribution as a commonly employed model for precipitation and runoff series, with its probability density function expressed as:
where is the shape parameter, and is the scale parameter. The parameters and can be estimated using the method of maximum likelihood estimation.
The cumulative probability at a given time is calculated as follows:
In hydrological applications, precipitation values may include zero measurements, whereas the gamma distribution is undefined at . To address this limitation, the cumulative probability is modified as follows:
where is the probability of , calculated as the ratio of the total number of occurrences of zero precipitation to the length of the precipitation time series. The cumulative probability is then transformed to the standard normal distribution function using the following approximation:
where ≈ 2.5, ≈ 0.80, ≈ 0.01, ≈ 1.43, ≈ 0.19, and ≈ 0.001.
2.3.3. Extraction of Drought Characteristics Using Three-Threshold Run Theory
Run theory effectively characterizes the persistence and continuity traits of drought events by statistically analyzing run-length alternations within continuous symbol sequences. This approach is particularly well suited for describing long-term water deficit processes [24]. Its core strength lies in utilizing multi-level thresholds of meteorological and soil moisture drought indices to precisely delineate the onset, persistence, and termination stages of drought events, thereby significantly enhancing identification accuracy. Compared to conventional methods, run theory provides a more robust quantitative framework for drought identification due to its ability to capture drought continuity features and precisely characterize temporal dynamics and to its broad applicability. Accordingly, this study extracts the three-dimensional characteristics of meteorological drought (MD) and soil moisture drought (SD): frequency, duration, and intensity. Given that drought is inherently a persistent water deficit process, multi-level thresholds are essential to fully characterize its life cycle. Extensive research in arid/semi-arid regions demonstrates that employing the threshold sequence R0 = 0.5, R1 = 0, R2 = −0.5 effectively captures the initiation, development, and mitigation processes of drought [19,24]. Furthermore, in areas sensitive to vegetation productivity and soil moisture, drought events identified using this threshold combination exhibit a high degree of alignment with actual ecological response patterns. Therefore, this study adopts this descending threshold sequence (R0 > R1 > R2) to partition drought stages: where R0 signifies a state of mild moisture recovery or critical moisture status, R1 demarcates normal moisture conditions, and R2 indicates the onset of mild drought. The specific rules are as follows (Figure 3):
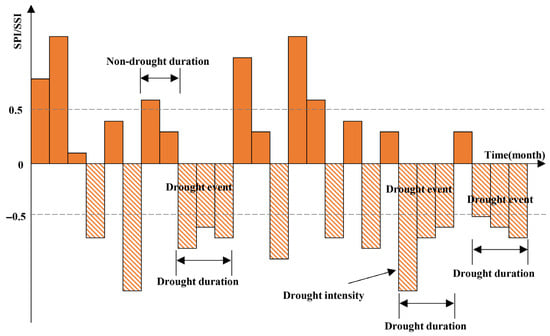
Figure 3.
Schematic diagram of the three-threshold run theory.
2.3.4. Sen’s Trend Analysis and Mann–Kendall (M–K) Test
This study applied the Theil–Sen median method (Sen’s slope estimator) to quantify meteorological drought (MD) and soil moisture drought (SD) trends [25]. As a robust non-parametric approach, Sen’s estimator calculates the median slope across all pairwise combinations of data points to determine trend magnitude. This method offers distinct advantages: computational efficiency and strong resistance to measurement errors and outliers. To assess statistical significance, we implemented the Mann–Kendall (M–K) test—a non-parametric technique requiring no distributional assumptions and exhibiting outlier insensitivity, making it ideal for non-normal hydrological and meteorological time series. The M–K test evaluates trend significance through a standardized Z-statistic. The integrated application of these methods systematically characterizes MD and SD spatiotemporal evolution through complementary dimensions: trend magnitude (Sen’s estimator) and statistical reliability (M–K test).
2.3.5. Cross-Wavelet Analysis
Cross-wavelet transform (XWT) is a joint time–frequency analysis technique evolved from conventional wavelet analysis. This method facilitates concurrent assessment of correlation and phase relationships between two time series across the time–frequency domain [17]. In this study, XWT was applied to quantify coupling characteristics and temporal propagation patterns between meteorological drought (MD) and soil moisture drought (SD). Given two time series and , their cross-wavelet transform is defined as =*, where * denotes the complex conjugate. The cross-wavelet power spectrum is given by . The complex argument represents the local phase difference between and . Assuming the background power spectra of the two series are and , respectively, the theoretical distribution of the cross-wavelet power is described as follows:
where (⋅) denotes the distribution function, represents the confidence level associated with probability from the probability distribution function (PDF), defined as the square root of the product of two distributions, and is the degrees of freedom.
2.3.6. Spearman Rank Correlation Analysis
This study established a drought propagation pathway framework based on temporal threshold prioritization. Using the Spearman rank correlation coefficient [26], a non-parametric association measure, we quantified correlations between SPI (1–12-month scales) and SSI (1-month scale). To identify the optimal MD-to-SD propagation lag, the maximum correlation time scale was first selected. Guided by propagation timeliness criteria, pathways with shorter durations were prioritized. Propagation time was subsequently determined through dynamic adaptation of secondary-stage time thresholds to the primary pathway. The optimal time scale corresponds to the maximum Spearman correlation coefficient:
where is the time scale corresponding to the maximum Spearman rank correlation coefficient, is the difference in ranks between the SPI (at scale ) and SSI (at 1-month scale) for the -th sample point. is the number of sample points (i.e., the length of the time series). is the time scale (ranging from 1 to 12 months).
2.3.7. Drought-Triggered GPP Loss Based on Copula
To isolate drought impacts on vegetation productivity while controlling confounding factors that may bias threshold identification, we implemented pixel-wise linear detrending of GPP data. The copula function [27] was then employed to quantify meteorological drought (MD) and soil moisture drought (SD) thresholds triggering GPP loss. Copulas construct bivariate joint distributions between drought indices (SPI/SSI) and GPP by coupling heterogeneous marginal distributions. Accounting for vegetation’s lagged response to climatic/hydrological drivers, analysis focused exclusively on growing-season drought stress (April–October). Within a Bayesian framework, pixel-level GPP was matched with SPI/SSI series across multiple temporal scales (1/3/6/12 months) to establish drought–GPP joint distributions:
where represents the drought index (SPI or SSI) at the specific response time scale corresponding to each pixel. is the joint cumulative distribution function (CDF). and are the marginal CDFs of the drought index (SPI or SSI) and GPP series, respectively. denotes the copula function. Clayton, Frank, Gumbel, Gaussian, and t-copula functions were selected as candidate joint distribution models in this study. Two types of candidate distributions (normal distribution, generalized extreme value distribution) were fitted to the GPP series. The optimal marginal distribution was selected based on the Kolmogorov–Smirnov test (K-S test) and the root mean square error (RMSE). The normal distribution was used to fit SPI and SSI indices, as they are inherently standardized to follow a standard normal distribution. The goodness of fit for the copula functions was then evaluated using the squared Euclidean distance (SED). The copula function yielding the minimum SED was deemed the optimal joint distribution.
The goodness of fit of the normal distribution assumption to the actual data was comprehensively evaluated using the Kolmogorov–Smirnov test (K-S test) combined with the root mean square error (RMSE). The K-S test was employed to determine whether the difference between the sample distribution and the theoretical normal distribution was statistically significant, while the RMSE quantitatively measured the magnitude of the fitting deviation. Ultimately, the distribution that passed the K-S test and exhibited the smallest RMSE value was selected as the optimal marginal distribution. Within this study, the standardized index data largely conformed to the normal distribution assumption. For each pair of drought indices (e.g., SPI-GPP and SSI-GPP), the five copula functions were fitted separately. Their parameters were estimated using the maximum likelihood estimation (MLE) method. A critical step involves selecting the optimal joint distribution model from the candidate copula families.
This study adopted the squared Euclidean distance () criterion as the primary metric for evaluating goodness of fit. Its formula is:
where ) represents the value of the theoretical copula function at point ); represents the value of the empirical copula function at point ); a smaller SED value indicates that the theoretical copula model provides a better fit to the empirical joint distribution (i.e., the dependence structure actually exhibited by the data). Consequently, the copula function corresponding to the minimum SED value was chosen as the optimal model for describing the joint distribution between that pair of drought indices. The SED criterion was chosen primarily based on its sensitivity to discrepancies in the fit of the copula function across the entire distribution domain, including the tail regions. This sensitivity enables the SED to effectively discriminate between different copula models in their ability to capture the actual underlying dependence structure.
Leveraging the copula-based joint and conditional distribution equations, this study calculated the probability of GPP loss under different drought stress levels. The impact of drought stress on GPP loss was analyzed across monthly, seasonal, semi-annual, and annual scales. Vegetation productivity loss scenarios were defined using the percentile method: GPP loss was categorized into four types corresponding to GPP values less than or equal to the 10th, 20th, 30th, and 40th percentiles (GPP10th, GPP20th, GPP30th, GPP40th). The conditional probability of GPP loss occurring given a specific drought stress interval was calculated as follows:
where and are the lower and upper bounds, respectively, of the specified interval for the drought index (Dro). represents a specific GPP loss percentile threshold (e.g., GPP10th, GPP20th, etc.).
To identify the drought thresholds triggering GPP loss, the same four GPP loss types were used, defined as GPP less than or equal to the 10th, 20th, 30th, and 40th percentiles (GPP10th, GPP20th, GPP30th, GPP40th). The drought index (Dro: SPI or SSI) was iterated starting from −0.5, with increments of 0.1. By integrating the GPP loss probability assessment model with a trial algorithm, the conditional probability corresponding to each iteration step was estimated. The Dro interval where the conditional probability became greater than or equal to 0.5 was identified. The left bound of this interval was taken as the threshold for triggering GPP loss, representing the Dro value corresponding to the induction of GPP loss. A lower trigger threshold (more negative Dro value) indicates that a more severe drought is required to cause the specified level of GPP loss, signifying greater vegetation resistance to drought. Conversely, a higher trigger threshold (less negative Dro value) indicates that a less severe drought is sufficient to trigger GPP loss. The conditional probability for each iteration interval was calculated as:
In the formula, is the joint cumulative distribution function (CDF) of the drought index (Dro) and GPP. is the marginal CDF of the drought index (Dro). represents the upper bound of the current Dro iteration interval. represents the lower bound of the current Dro iteration interval (i.e., the upper bound minus the 0.1 increment).
3. Results
3.1. Spatiotemporal Distribution and Characteristics of Meteorological and Soil Moisture Drought
To accurately quantify the impact of drought on GPP loss across different time scales, this study utilized the standardized precipitation index (SPI) and standardized soil moisture index (SSI) at 1-month (SPI1/SSI1), 3-month (SPI3/SSI3), 6-month (SPI6/SSI6), and 12-month (SPI12/SSI12) scales over the Mongolian Plateau from 1982 to 2021, characterizing meteorological drought (MD) and soil moisture drought (SD) at monthly, seasonal, semi-annual, and annual scales, respectively. The results indicate that droughts across all time scales exhibited significant intensifying trends over the past 40 years (Figure 4), with the aridification rate systematically increasing as the drought time scale extended. Specifically: SPI series decreased at rates of SPI1 (−0.09/a), SPI3 (−0.13/a), SPI6 (−0.17/a), and SPI12 (−0.25/a); SSI series demonstrated faster declines: SSI1 (−0.30/a), SSI3 (−0.31/a), SSI6 (−0.32/a), and SSI12 (−0.34/a). This reveals that the Mongolian Plateau has experienced progressively severe compound drought pressure across multiple scales (monthly, seasonal, semi-annual, annual) during the past four decades, with the most pronounced intensification rate observed for annual-scale drought (SPI12 and SSI12).
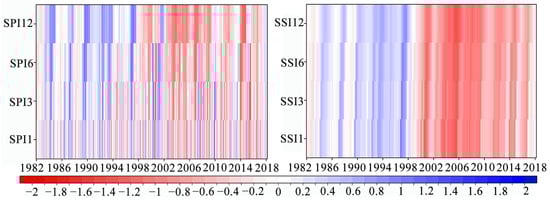
Figure 4.
Interannual variations in SPI and SSI at monthly, seasonal, semi-annual, and annual scales over the Mongolian Plateau from 1982 to 2021.
The drought evolution across the Mongolian Plateau during 1982–2021 exhibited significant spatiotemporal heterogeneity (Figure 5). Meteorological drought (MD) showed drying trends in >70% of the area, with the highest proportion of aridification at the monthly scale (97.40%) and the lowest at the annual scale (71.52%). In contrast, soil moisture drought (SD) displayed wetting trends across most regions (≥59.86%), though annual-scale SD remained dominated by drying (>90% of the area). This indicates that the Mongolian Plateau has primarily experienced compound stress from short-term MD and long-term SD over the past four decades. Notably, both MD and SD across all time scales exhibited significant drying trends (p < 0.05) in the central region, highlighting substantially higher ecological vulnerability in this area compared to surrounding regions.
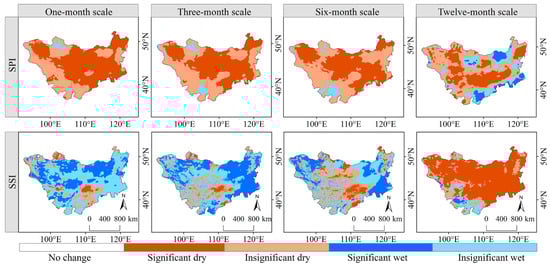
Figure 5.
Spatial evolution trends of SPI and SSI at monthly, seasonal, semi-annual, and annual scales over the Mongolian Plateau from 1982 to 2021.
Based on run theory, this study extracted key characteristics of MD and SD, including occurrence frequency, duration, and intensity (Figure 5). The results demonstrate that MD across the Mongolian Plateau exhibited high-frequency, short-duration, and low-intensity features, whereas SD displayed the opposite pattern. Specifically, SPI1, SPI3, and SPI6 characterized MD with ≥20 occurrences covering >96% of the region, significantly higher than SD characterized by SSI1, SSI3, and SSI6 (0–23% coverage; Figure 6a). Concurrently, MD durations were predominantly concentrated within 0–20 months, while SD durations generally exceeded 20 months (Figure 6b). Regarding drought intensity, areas with MD intensity > −1 accounted for 0.05%, 32%, 35%, and 55% at the four time scales, respectively, generally lower than SD (11%, 44%, 46%, 50%) except at the annual scale (Figure 6c). Additionally, as temporal scales extended from monthly to annual, both MD and SD manifested consistent evolutionary patterns: decreased frequency, prolonged duration, and enhanced intensity. Spatially, drought intensities for both types exhibited a “high-periphery, low-interior” distribution, indicating more severe drought conditions in peripheral mountainous and forested areas (e.g., eastern Greater Khingan Mountains and northwestern highlands) compared to the central steppe region.
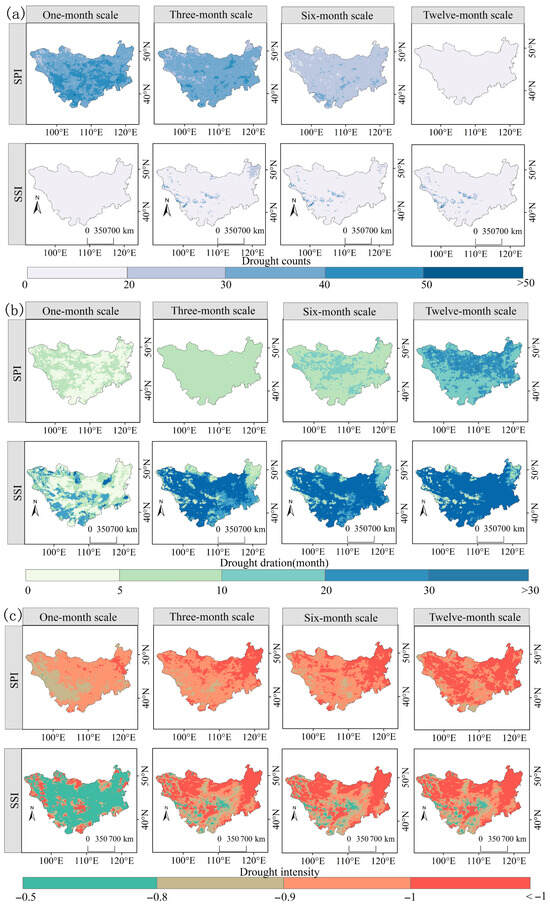
Figure 6.
Spatial distributions of (a) drought frequency, (b) drought duration, and (c) drought intensity for MD and SD across different time scales over the Mongolian Plateau (1982–2021).
3.2. Propagation Relationship Between Meteorological and Soil Moisture Drought Across Time Scales
This study investigated the propagation relationship between MD (characterized by SPI) and SD (characterized by SSI) over the Mongolian Plateau using cross-wavelet analysis. The results indicate significant resonant periods between SPI and SSI series across all time scales (Figure 7). Specifically, SPI1 and SSI1 exhibited significant resonances during 1984–1989 (30–38 months), 2000–2003 (60–65 months), and 2013–2015 (30–35 months); SPI3 and SSI3 showed significant resonances in 1983–1992 (28–40 months), 1998–2005 (60–66 months), and 2011–2017 (18–38 months); SPI6 and SSI6 demonstrated significant resonances at 8–65-month periods during 1982–2008 and 2012–2021; SPI12 and SSI12 displayed significant resonances at 14–90-month periods throughout the study period (1982–2021). Notably, as the drought characterization scale extended from monthly (SPI1/SSI1) to annual (SPI12/SSI12), the range of significant resonant periods between MD and SD exhibited a marked expansion. Furthermore, across all analyzed time scales, dominant phase arrows consistently pointed to the lower-right quadrant (fourth quadrant), unequivocally revealing a significant positive correlation between SPI and SSI with consistent lagged responses of SSI behind SPI, aligning with the physical process of MD propagating as the initial driver to SD.
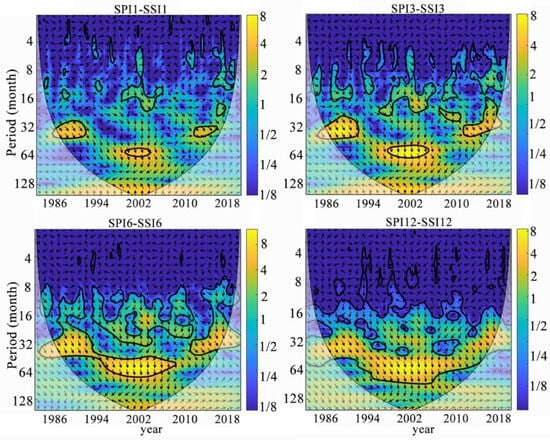
Figure 7.
Cross-wavelet transform of SPI and SSI across different time scales.
In addition, Spearman correlation analysis quantified the spatial association strength between MD (SPI) and SD (SSI), with the month scale of strongest correlation identified as the propagation time (Figure 8). The results show that SPI and SSI exhibited significant positive correlations overall (mean coefficient: 0.66), with spatially increasing correlation gradients from west to east. Moreover, the propagation time from MD to SD was prolonged, averaging 11.22 months across the region; most areas (>50%) had propagation times concentrated within 10–12 months. This extended lag time directly confirms MD as the initial driver regulating soil moisture through hydrological processes (particularly the lagged response of precipitation-to-soil moisture conversion), ultimately inducing SD occurrence.
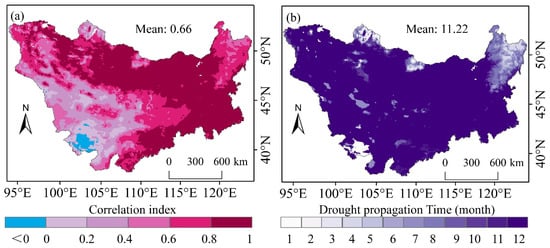
Figure 8.
(a) Maximum correlation coefficients and (b) propagation time from MD to SD across the Mongolian Plateau.
3.3. Impact of Meteorological and Soil Moisture Drought on GPP Loss Across Time Scales
3.3.1. Response Time of GPP to Meteorological and Soil Moisture Drought
During 1982–2021, gross primary productivity (GPP) across the Mongolian Plateau exhibited a distinct spatial pattern characterized by higher values in the east and lower values in the west (Figure 9). High carbon sink areas (GPP > 800 g C m−2) occupied 44.27% of the region, predominantly concentrated in eastern forested zones (e.g., Greater Khingan Mountains) and northern mountainous areas (e.g., Sayan Mountains). However, 52.92% of the region displayed declining GPP trends, with 21.29% showing statistically significant reductions. Notably, these significantly degraded areas spatially overlapped with high carbon sink zones, particularly in northern and eastern regions. This spatial correspondence clearly indicates that the core ecological areas with the highest productivity and carbon sequestration capacity are experiencing significant functional decline, posing potential risks to regional carbon balance.
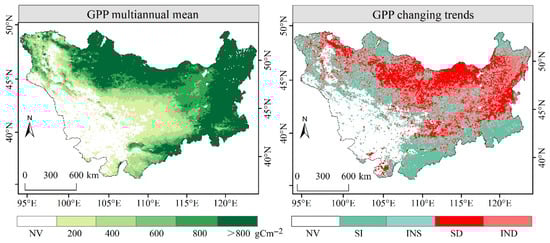
Figure 9.
Spatiotemporal distribution characteristics and evolution trends of GPP over the Mongolian Plateau (1982–2021). NV: non-vegetated areas; SI: significant increase; INS: non-significant increase; SD: significant decrease; IND: non-significant decrease.
This study analyzed the gross primary productivity (GPP) during the growing season (April to October). Using the Spearman rank correlation method, GPP was correlated pixel by pixel with the standardized precipitation index (SPI, representing meteorological drought, MD) and the standardized soil moisture index (SSI, representing soil drought, SD) across different time scales (1–12 months). The time scale corresponding to the maximum correlation coefficient was defined as the response time to water stress (Figure 10). The results demonstrate positive correlations between both SPI/SSI and GPP, indicating enhanced vegetation carbon sink capacity with improved moisture conditions. Crucially, the SSI-GPP correlations were significantly stronger than the SPI-GPP correlations, confirming the dominant role of direct soil moisture constraints on vegetation productivity. Regionally, the GPP response time to SPI averaged 10.46 months, with 43.84% of areas concentrated at 12-month lags (with prolonged responses occurring in the southeastern and northwestern highlands). In contrast, the response times to SSI were substantially shorter, averaging −2 months in 45.98% of the region; extended SD response times (≥9 months) were observed only in alpine zones (e.g., Sayan Mountains and Greater Khingan Mountains). These findings reveal that vegetation productivity (GPP) in the Mongolian Plateau is highly sensitive to both long-term precipitation deficits (MD) and short-term soil moisture deficits (SD).
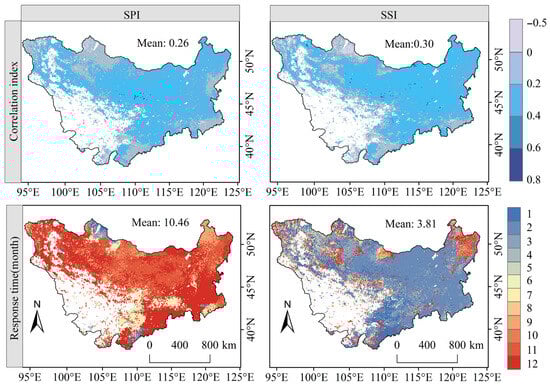
Figure 10.
Response time of GPP to MD and SD.
3.3.2. Probability of Triggering GPP Loss
Based on the copula function model, this study quantified the conditional probability of gross primary productivity (GPP) loss (below the 10th, 20th, 30th, and 40th percentiles) under drought (SPI/SSI) at different time scales (Figure 11). The results indicate that lower-level GPP losses (e.g., GPP < 40th percentile) consistently exhibited significantly elevated loss probabilities (mean > 40%) across all time scales, revealing a gradual response pattern of GPP loss to drought stress: mild GPP loss represents the initial manifestation stage. Furthermore, as the drought characterization scales extended from monthly to annual, conditional probabilities for all GPP loss levels generally increased, highlighting significantly intensified inhibition of vegetation productivity by long-term cumulative water deficits. Notably, drought type influence displayed scale dependence: MD-triggered GPP loss probabilities slightly exceeded SD at the monthly and annual scales, while the opposite pattern (SD > MD) prevailed at the seasonal and semi-annual scales.
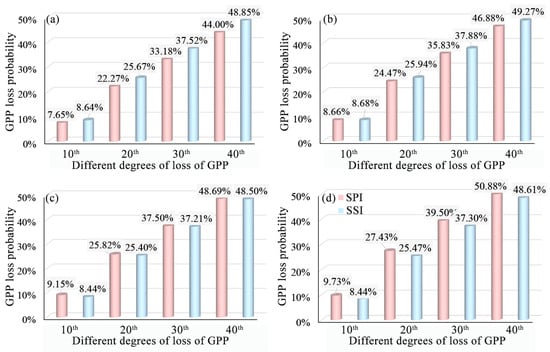
Figure 11.
Probability of MD- and SD-triggered GPP loss at varying severity levels for (a) monthly, (b) seasonal, (c) semi-annual, and (d) annual scales over the Mongolian Plateau (1982–2021).
3.3.3. Thresholds for Triggering GPP Loss
This study quantified critical thresholds for MD and SD to trigger ecosystem gross primary productivity (GPP) loss (Table 1). These thresholds serve as core indicators of vegetation drought vulnerability, with lower values indicating stronger drought tolerance. Under mild (−0.5 to −1) and extreme (≤−1.5) drought, MD triggered GPP loss across larger areas than SD, while the opposite occurred under other drought intensities, revealing fundamentally distinct stress mechanisms between drought types (Figure 12). Crucially, the drought intensity required to trigger low-level GPP loss (e.g., 40th percentile) was substantially lower than that for high-level loss. When thresholds ranged from −0.5 to −1, >80% of the study area experienced 40th-percentile loss, whereas <15% triggered 10th-percentile loss under identical drought intensity (consistent for both MD and SD), demonstrating the universal pattern that high-intensity drought induces severe GPP loss. Additionally, drought characterization scales significantly influenced vegetation response: as the scales extended from 1 to 12 months, the proportion of areas with extreme thresholds (≤−1.5) triggering severe loss (10th percentile) systematically decreased. Specifically, the areas requiring thresholds ≤−1.5 to trigger 10th-percentile loss decreased from 76% (1-month scale) to 63% (12-month scale) for MD and from 64% to 53% for SD, confirming significantly greater tolerance to long-term cumulative drought than to short-term events.

Table 1.
The area proportion of the GPP loss threshold triggered by MD and SD at different time scales varies.
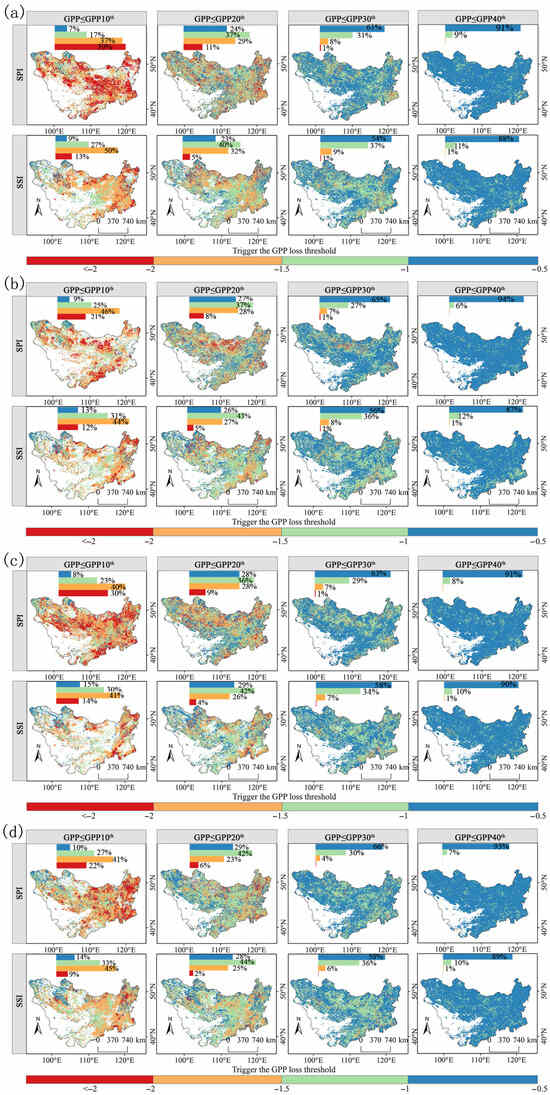
Figure 12.
Thresholds for MD- and SD-triggered GPP loss at different severity levels for (a) monthly, (b) seasonal, (c) semi-annual, and (d) annual scales over the Mongolian Plateau (1982–2021).
4. Discussion
This study systematically analyzed the impacts of meteorological drought (MD) and soil moisture drought (SD) on gross primary productivity (GPP) across monthly, seasonal, semi-annual, and annual scales over the Mongolian Plateau (1982–2021) by integrating standardized drought indices (SPI and SSI) with three-threshold run theory and copula models. The results reveal significant intensifying trends for both drought types across all time scales, with soil moisture drought exhibiting the fastest acceleration rate (−0.34/a), indicating heightened sensitivity and responsiveness of soil moisture systems to climate change. This finding aligns closely with documented warming–drying trends in the region (Figure 13). Furthermore, intensification rates for both drought types increased with longer assessment scales, consistent with the fundamental principle of drought accumulation effects [28]. Notably, the most pronounced aridification occurred in the central plateau, which was attributable to its lower elevation [29] and dominance by grasslands and croplands. These ecosystems feature shallow root systems (e.g., steppe grasses) or high evapotranspiration demands (e.g., crops), constraining water access capacity and lowering moisture stress thresholds [30,31]. Coupled with inherently fragile environmental conditions and limited buffering capacity against precipitation/temperature fluctuations [32], this central vulnerable zone exhibits weak resilience to extreme climate events (e.g., heatwaves, prolonged rainfall deficits). These synergistic factors establish the central region as the epicenter of drought intensification, corroborating findings by Mei et al. [17].
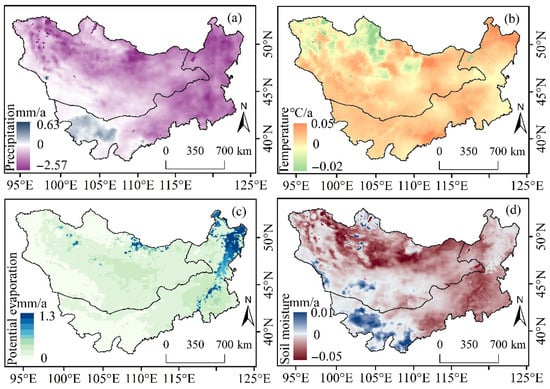
Figure 13.
Trends in (a) precipitation, (b) temperature, (c) potential evapotranspiration, and (d) soil moisture over the Mongolian Plateau (1982–2021).
Furthermore, SD across the Mongolian Plateau exhibited distinct “low-frequency, long-duration, high-intensity” characteristics. This phenomenon likely stems from dual mechanisms: slow recharge processes in deep soil layers and intensified vegetation transpiration, collectively amplifying soil moisture system vulnerability [33]. Specifically, precipitation inputs must first satisfy canopy interception, surface evaporation, and shallow root uptake before residual moisture gradually percolates to replenish deep soil reservoirs [5,34]. Consequently, even episodic rainfall events are rapidly consumed by surface processes and shallow-rooted vegetation, failing to effectively recharge deep soil storage and prolonging SD persistence post-precipitation [35]. In contrast, MD displayed typical “high-frequency, short-duration” features, reflecting the high sensitivity of atmospheric precipitation to short-term climate fluctuations [36]. As the drought assessment scales extended from monthly to annual, both MD and SD exhibited consistent evolutionary patterns: reduced frequency, prolonged duration, and enhanced intensity. This occurs because long-term drought indices (e.g., annual SPI/SSI) integrate and smooth short-term climatic noise and minor moisture variations, thereby capturing persistent, high-impact moisture deficits while filtering transient, low-severity drought signals. This scaling behavior, aligning with findings by Luo et al. [37] in the Lancang-Mekong River Basin, fundamentally reflects the time-scale dependence of drought events and corresponds to intrinsic drought accumulation–recovery dynamics [38,39].
This study reveals a significant propagation relationship between meteorological drought (MD) and soil moisture drought (SD) on the Mongolian Plateau, with an average propagation time of approximately 11 months. As a typical arid/semi-arid region, precipitation constitutes the absolute dominant source of soil moisture replenishment on the Mongolian Plateau [40]. Following precipitation deficits, water resources fail to meet the immediate demands of vegetation transpiration and surface evaporation, leading to rapid depletion of shallow soil moisture [35]. However, the replenishment of deep soil moisture depends on the continuous infiltration of precipitation through the unsaturated zone. This process experiences substantial delays on the Mongolian Plateau due to multiple factors, including soil physical properties, vegetation effects, seasonal frozen ground, and low initial soil moisture [34]. This finding aligns with global drought propagation research: Li et al. [1] demonstrated significant geographical variation in critical soil moisture anomaly thresholds, noting that forested areas exhibit longer drought response lags (>15 months) due to deep-root buffering capacity. In contrast, the Mongolian Plateau—dominated by shallow-rooted grasslands—shows a propagation time (11 months) within the typical range for global semi-arid ecosystems, highlighting the crucial regulatory role of vegetation functional types in water stress transmission. Consequently, a significant MD event (e.g., sustained multi-month precipitation deficit) requires nearly a full hydrological cycle for its impacts to be fully manifested as substantial deficits in deep soil water storage, ultimately forming SD [40].
This study demonstrates significant temporal differences in the vegetation gross primary productivity (GPP) response to meteorological drought (MD) versus soil moisture drought (SD) on the Mongolian Plateau, with average response times of 10 months and 2 months, respectively. This divergence stems from fundamental distinctions in water stress propagation pathways and physiological responses: MD originates from precipitation deficits, and its impacts propagate through a cascading process of “reduced atmospheric precipitation → decline in surface soil moisture → gradual depletion of deep soil moisture → restriction of root water uptake → decreased leaf stomatal conductance → inhibition of photosynthetic carbon assimilation” [41,42,43]. Plateau vegetation can further delay GPP losses through short-term tolerance mechanisms such as mobilizing non-structural carbohydrate reserves and enhancing water use efficiency. Coupled with the inherent lag in drought signal transmission through the soil profile (~11 months), this collectively extends the response time [8,31,44]. Notably, this response pattern corresponds with global patterns of vegetation drought sensitivity: Li et al. [1] identified that vegetation shifts from a resistant to a vulnerable phase when soil moisture falls below biome-specific thresholds (e.g., ~14.4th percentile for grassland ecosystems). The rapid GPP response to SD within 2 months observed on the Mongolian Plateau exemplifies the lower drought tolerance thresholds characteristic of semi-arid vegetation. SD, conversely, directly reflects real-time water availability in the root zone. Once soil moisture drops below species-specific thresholds, vegetation promptly initiates stomatal closure mechanisms to reduce transpirational water loss, directly impairing CO2 diffusion and carboxylation efficiency. Shallow-rooted herbaceous communities (e.g., Stipa steppe) exhibit particular sensitivity to this stress, resulting in GPP losses manifesting rapidly within 2 months [22]. It must be acknowledged that this study did not quantify the influence of co-occurring stressors like atmospheric pollution. Recent global research (Wu et al. [45]) indicates that PM2.5 pollution can impair photosynthetic capacity by blocking stomata and reducing radiation. In the industrial zones and frequent dust corridors of the Mongolian Plateau, such additional pressures may further lower drought thresholds and accelerate GPP losses, warranting future multi-factor coupling studies.
Remarkably, under scenarios of low-magnitude GPP loss (e.g., <40th percentile), both drought types induced significantly elevated loss probabilities across the study region (average >40%). This reflects the inherent vulnerability of semi-arid vegetation to mild water stress—conservative survival strategies compel vegetation to sacrifice photosynthetic efficiency to maintain tissue viability even under moderate drought conditions, leading to widespread occurrence of high-frequency, low-intensity productivity suppression events [43,46]. Further analysis revealed a distinct time-scale dependency in drought-triggered GPP loss probabilities: At monthly and annual scales, MD exhibited slightly higher triggering probabilities than SD. This is attributed to the instantaneous impact of abrupt precipitation shortages captured by monthly MD on shallow soil moisture and short-cycle vegetation [22,46], and the cross-annual ecological degradation induced by persistent climatic drought represented by annual MD through long-term depletion of soil water reservoirs and vegetation carbon reserves. Conversely, during seasonal and semi-annual scales, SD’s triggering probability surpassed that of MD. This primarily occurs because these periods coincide with critical phenological stages (e.g., green-up, stem elongation, grain filling), where sustained soil moisture deficits directly constrain root water uptake and cell turgor pressure, severely inhibiting biomass accumulation [43]. Meanwhile, the impact of MD at these scales has not yet fully translated into deep soil moisture stress [20]. This scale-dependent characteristic aligns with the complexity of global drought impact assessments: Li et al. [1] emphasized that drought threshold detection necessitates comprehensive consideration of temporal scales. Our multiscale probability analysis elucidates the non-linear dynamics of vegetation response on the Mongolian Plateau, providing a basis for precise regional drought mitigation.
When triggering high-magnitude GPP losses (10th/20th percentile), SD demonstrated stronger stress effects than MD, underscoring its higher risk of inducing severe vegetation productivity decline. As the direct physiological regulator, soil moisture deficit inflicts irreversible damage on photosynthetic machinery through the dual mechanisms of “hydraulic failure-carbon starvation.” Furthermore, the slow recovery dynamics of deep soil moisture prolong stress duration, exceeding vegetation physiological tolerance limits. In contrast, part of MD’s impact can be buffered by soil water reservoirs, providing a temporal window for vegetation adaptation (e.g., root deepening) [20,47]. Additionally, the time scale used to characterize drought significantly modulated vegetation response: As the scale extended from 1 month to 12 months, the spatial extent requiring a stronger threshold (≤−1.5) to trigger 10th-percentile high losses decreased for both MD and SD. This occurs because short-term drought indices are sensitive to single extreme events, and vegetation can buffer transient stress by mobilizing carbohydrate reserves. Consequently, even mild drought may trigger high losses [31,43]. Conversely, long-term indices smooth climatic fluctuations through cumulative calculation; their anomalies reflect persistent water imbalance. Vegetation, having exhausted reserves and activated deep dormancy or other survival strategies, requires more intense and sustained drought signals to reach comparable loss levels. This illustrates the interaction between ecosystem adaptation to chronic stress and the statistical properties of drought indices [43,48]. This finding holds direct implications for rangeland management on the Mongolian Plateau: Given SD’s strong predictive power for high-loss GPP, we recommend integrating deep soil moisture monitoring into drought early-warning systems. Dynamic grazing prohibition thresholds should be set during critical phenophases, alongside promoting rotational grazing systems to enhance grassland resilience.
5. Conclusions
This study characterized meteorological drought (MD) and soil moisture drought (SD) using the standardized precipitation index (SPI) and standardized soil moisture index (SSI), respectively. Through integrated application of three-threshold run theory, Sen’s trend analysis, Mann–Kendall test, cross-wavelet analysis, Spearman correlation, and copula models, we systematically investigated the variation characteristics, propagation patterns, and thresholds/probabilities for triggering gross primary productivity (GPP) loss under MD and SD across monthly, seasonal, semi-annual, and annual scales over the Mongolian Plateau (1982–2021). The principal conclusions are as follows:
- (1)
- Both MD and SD exhibited significant intensifying trends across all time scales during 1982–2021, with accelerating rates at longer temporal scales. MD manifested high-frequency, short-duration, low-intensity characteristics, whereas SD displayed inverse features. Spatially, the most pronounced aridification occurred in central regions (p < 0.05). Significant positive correlations existed between MD and SD, with MD acting as the primary driver of SD propagation at an average lag of 11.22 months. Propagation durations concentrated within 10–12 months in >50% of the study area, with correlation coefficients demonstrating an increasing eastward gradient.
- (2)
- GPP response time averaged 10.46 months for MD but shortened significantly to −2 months for SD. Conditional probabilities for triggering mild GPP loss (e.g., GPP < 40th percentile) remained consistently high (>40% average) across the scales. As the temporal scales extended from monthly to annual, the probabilities for all GPP loss levels generally increased.
- (3)
- The drought intensity required to trigger mild loss (<40th percentile) was substantially lower than that for severe loss (<10th, <20th percentiles). When the SPI/SSI values ranged from −0.5 to −1, over 80% of the region experienced mild loss, whereas under identical drought intensity, less than 15% of the area incurred severe loss. Furthermore, as temporal scales extended, the proportion of areas requiring extreme thresholds (≤−1.5) to trigger GPP10th loss systematically decreased.
Author Contributions
Conceptualization, H.C. and M.W.; methodology, H.C.; software, F.M.; validation, H.C., M.W. and C.S.; formal analysis, H.C.; investigation, F.M.; resources, F.M.; data curation, M.L.; writing—original draft preparation, H.C.; writing—review and editing, F.M.; visualization, W.C.; supervision, F.M.; project administration, S.C.; funding acquisition, F.M. All authors have read and agreed to the published version of the manuscript.
Funding
This research was funded by the National Natural Science Foundation of China (Grant No. 42261079, 42361024, and 42461021), the Natural Science Foundation of Inner Mongolia Autonomous Region of China (Grant No. 2024MS03048 and No. 2025MS04024), Inner Mongolia Key Research and Achievement Transformation Program (Grant No. 2025YFDZ0003), the Central Guidance for Local Scientific and Technological Development Fund (Grant 2025ZY0005 and No. 2024XY0035), the First-Class Discipline Research Special Project (Grant No. YLXKZX-NSD-033 and YLXKZX-NSD-029), and the 2023 Postgraduate Research Innovation Fund of Inner Mongolia Normal University (Grant No. CXJJB25007). The authors are grateful to the editors and the reviewers for their insightful comments and suggestions.
Institutional Review Board Statement
Not applicable.
Informed Consent Statement
Not applicable.
Data Availability Statement
The original contributions presented in this study are included in the article. Further inquiries can be directed to the corresponding author.
Conflicts of Interest
The authors declare no conflicts of interest.
References
- Li, X.; Piao, S.; Huntingford, C.; Peñuelas, J.; Yang, H.; Xu, H.; Chen, A.; Friedlingstein, P.; Keenan, T.F.; Sitch, S.; et al. Global variations in critical drought thresholds that impact vegetation. Natl. Sci. Rev. 2023, 10, nwad049. [Google Scholar] [CrossRef]
- Zhou, L.; Wang, S.; Chi, Y.; Ju, W.; Huang, K.; Mickler, R.; Wang, M.; Yu, Q. Changes in the Carbon and Water Fluxes of Subtropical Forest Ecosystems in South-Western China Related to Drought. Water 2018, 10, 821. [Google Scholar] [CrossRef]
- Huang, J.; Zheng, F.; Dong, X.; Wang, X.C. Exploring the complex trade-offs and synergies among ecosystem services in the Tibet autonomous region. J. Clean. Prod. 2023, 384, 135483. [Google Scholar] [CrossRef]
- Kang, Y.; Guo, E.; Wang, Y.; Bao, Y.; Zhao, S.; A, R. Spatiotemporal Variation in Compound Dry and Hot Events and Its Effects on NDVI in Inner Mongolia, China. Remote Sens. 2022, 14, 3977. [Google Scholar] [CrossRef]
- Zhao, X.; Luo, M.; Meng, F.; Sa, C.; Bao, S.; Bao, Y. Spatiotemporal changes of gross primary productivity and its response to drought in the Mongolian Plateau under climate change. J. Arid. Land 2024, 16, 46–70. [Google Scholar] [CrossRef]
- Chen, J.; Fan, Y.; Zhang, Y.; Peng, J.; Zhang, J.; Cao, C. Comprehensive propagation characteristics between paired meteorological and hydrological drought events: Insights from various underlying surfaces. Atmos. Res. 2024, 299, 107193. [Google Scholar] [CrossRef]
- Geng, G.; Zhang, B.; Gu, Q.; He, Z.; Zheng, R. Drought propagation characteristics across China: Time, probability, and threshold. J. Hydrol. 2024, 631, 130805. [Google Scholar] [CrossRef]
- Liu, Y.; Shan, F.; Yue, H.; Wang, X. Characteristics of drought propagation and effects of water resources on vegetation in the karst area of Southwest China. Sci. Total Environ. 2023, 891, 164663. [Google Scholar] [CrossRef]
- Shi, X.; Chen, F.; Shi, M.; Ding, H.; Li, Y. Construction and application of Optimized Comprehensive Drought Index based on lag time: A case study in the middle reaches of Yellow River Basin, China. Sci. Total Environ. 2023, 857, 159692. [Google Scholar] [CrossRef]
- Liu, Y.; Shan, F.; Yue, H.; Wang, X.; Fan, Y. Global analysis of the correlation and propagation among meteorological, agricultural, surface water, and groundwater droughts. J. Environ. Manag. 2023, 333, 117460. [Google Scholar] [CrossRef]
- Ma, F.; Yuan, X. Vegetation Greening and Climate Warming Increased the Propagation Risk from Meteorological Drought to Soil Drought at Subseasonal Timescales. Geophys. Res. Lett. 2024, 51, e2023GL107937. [Google Scholar] [CrossRef]
- Liu, J.F.; Arend, M.; Yang, W.J.; Schaub, M.; Ni, Y.Y.; Gessler, A.; Jiang, Z.P.; Rigling, A.; Li, M.H. Effects of drought on leaf carbon source and growth of European beech are modulated by soil type. Sci. Rep. 2017, 7, 42462. [Google Scholar] [CrossRef] [PubMed]
- Wang, C.; Chen, J.; Xiong, L.; Tong, S.; Xu, C.Y. Trigger thresholds and their dynamics of vegetation production loss under different atmospheric and soil drought conditions. Sci. Total Environ. 2024, 950, 175116. [Google Scholar] [CrossRef] [PubMed]
- Han, W.; Zheng, J.; Guan, J.; Liu, Y.; Liu, L.; Han, C.; Li, J.; Li, C.; Mao, X.; Tian, R. Assessment of Vegetation Drought Loss and Recovery in Central Asia Considering a Comprehensive Vegetation Index. Remote Sens. 2024, 16, 4189. [Google Scholar] [CrossRef]
- Luo, M.; Lau, N.; Liu, Z.; Wu, S.; Wang, X. An Observational Investigation of Spatiotemporally Contiguous Heatwaves in China from a 3D Perspective. Geophys. Res. Lett. 2022, 49, e2022GL097714. [Google Scholar] [CrossRef]
- Wu, C.; Zhong, L.; Yeh, P.J.F.; Gong, Z.; Lv, W.; Chen, B.; Zhou, J.; Li, J.; Wang, S. An evaluation framework for quantifying vegetation loss and recovery in response to meteorological drought based on SPEI and NDVI. Sci. Total Environ. 2024, 906, 167632. [Google Scholar] [CrossRef]
- Mei, L.; Tong, S.; Yin, S.; Bao, Y.; Wang, Y.; Guo, E.; Li, F.; Huang, X.; Alateng, T.; Liu, D.; et al. Assessing water use efficiency reactivity to meteorological, hydrological, and agricultural droughts on the Mongolian Plateau. Int. J. Digit. Earth 2024, 17, 2398056. [Google Scholar] [CrossRef]
- Zhou, K.; Wang, Y.; Chang, J. Attribution mechanism of drought propagation time with changes in climate and underlying surface. J. Hydrol. Reg. Stud. 2024, 56, 102041. [Google Scholar] [CrossRef]
- Zhu, Y.; Yang, P.; Xia, J.; Huang, H.; Chen, Y.; Li, Z.; Sun, K.; Song, J.; Shi, X.; Lu, X. Drought propagation and its driving forces in central Asia under climate change. J. Hydrol. 2024, 636, 131260. [Google Scholar] [CrossRef]
- Guo, W.; Huang, S.; Huang, Q.; Leng, G.; Mu, Z.; Han, Z.; Wei, X.; She, D.; Wang, H.; Wang, Z.; et al. Drought trigger thresholds for different levels of vegetation loss in China and their dynamics. Agric. For. Meteorol. 2023, 331, 109349. [Google Scholar] [CrossRef]
- Deng, Y.; Wang, X.; Wang, K.; Ciais, P.; Tang, S. Responses of vegetation greenness and carbon cycle to extreme droughts in China. Agric. For. Meteorol. 2021, 298–299, 108307. [Google Scholar] [CrossRef]
- Li, H.; Hu, Y.; Ao, Z. Identification of critical drought thresholds affecting vegetation on the Mongolian Plateau. Ecol. Indic. 2024, 166, 112507. [Google Scholar] [CrossRef]
- Guo, W.; Huang, S.; Huang, Q.; She, D.; Shi, H.; Leng, G.; Li, J.; Cheng, L.; Gao, Y.; Peng, J. Precipitation and vegetation transpiration variations dominate the dynamics of agricultural drought characteristics in China. Sci. Total Environ. 2023, 898, 165480. [Google Scholar] [CrossRef]
- Wu, Y.; Sun, J.; Blanchette, M.; Rousseau, A.N.; Xu, Y.J.; Hu, B.; Zhang, G. Wetland mitigation functions on hydrological droughts: From drought characteristics to propagation of meteorological droughts to hydrological droughts. J. Hydrol. 2023, 617, 128971. [Google Scholar] [CrossRef]
- Ren, J.; Guo, X.; Tong, S.; Bao, Y.; Bao, G.; Huang, X. Risk posed to vegetation net primary productivity by drought on the Mongolian Plateau. J. Geogr. Sci. 2023, 33, 2175–2192. [Google Scholar] [CrossRef]
- Chen, H.; Meng, F.; Sa, C.; Luo, M.; Bao, Y.; Liu, T. A three-dimensional perspective on how land use/cover change reshapes drought propagation under climate change? J. Hydrol. Reg. Stud. 2025, 60, 102478. [Google Scholar] [CrossRef]
- Wang, H.; Li, Y.P.; Huang, G.H.; Zhang, Q.; Ma, Y.; Li, Y.F. Quantifying multidimensional drought propagation risks under climate change: A vine-copula Bayesian factorial analysis method. J. Hydrol. 2024, 637, 131396. [Google Scholar] [CrossRef]
- Zhen, N.; Yao, R.; Sun, P.; Zhang, Q.; Ge, C.; Shen, H. Triggering thresholds and influential factors in the propagation of meteorological drought to hydrological drought. J. Hydrol. Reg. Stud. 2025, 57, 102184. [Google Scholar] [CrossRef]
- Yuan, B.; Guo, S.; Zhang, X.; Mu, H.; Cao, S.; Xia, Z.; Pan, X.; Du, P. Quantifying the drought sensitivity of vegetation types in northern China from 1982 to 2022. Agric. For. Meteorol. 2024, 359, 110293. [Google Scholar] [CrossRef]
- Tong, S.; Bao, G.; Bao, Y.; Huang, X. Monitoring of long-term vegetation dynamics and responses to droughts of various timescales in Inner Mongolia. Ecosphere 2023, 14, e4415. [Google Scholar] [CrossRef]
- Zhao, A.; Xu, R.; Zou, L.; Zhu, X. Response of Grassland Vegetation Growth to Drought in Inner Mongolia of China from 2002 to 2020. Atmosphere 2023, 14, 1613. [Google Scholar] [CrossRef]
- Gao, S.; Huang, S.; Singh, V.P.; Deng, X.; Duan, L.; Leng, G.; Guo, W.; Li, Y.; Zhang, L.; Han, Z.; et al. Dynamic response of vegetation to meteorological drought and driving mechanisms in Mongolian Plateau. J. Hydrol. 2025, 650, 132541. [Google Scholar] [CrossRef]
- Luo, M.; Meng, F.; Wang, Y.; Sa, C.; Duan, Y.; Bao, Y.; Liu, T. Quantitative detection and attribution of soil moisture heterogeneity and variability in the Mongolian Plateau. J. Hydrol. 2023, 621, 129673. [Google Scholar] [CrossRef]
- Meng, F.; Luo, M.; Sa, C.; Wang, M.; Bao, Y. Quantitative assessment of the effects of climate, vegetation, soil and groundwater on soil moisture spatiotemporal variability in the Mongolian Plateau. Sci. Total Environ. 2022, 809, 152198. [Google Scholar] [CrossRef]
- Rina, W.; Bao, Y.; Guo, E.; Tong, S.; Huang, X.; Yin, S. Lagged feedback of peak season photosynthetic activities on local surface temperature in Inner Mongolia, China. Environ. Res. 2023, 236, 116643. [Google Scholar] [CrossRef]
- Kang, Y.; Guo, E.; Wang, Y.; Bao, Y.; Bao, Y.; Mandula, N. Monitoring Vegetation Change and Its Potential Drivers in Inner Mongolia from 2000 to 2019. Remote Sens. 2021, 13, 3357. [Google Scholar] [CrossRef]
- Luo, X.; Luo, X.; Ji, X.; Ming, W.; Wang, L.; Xiao, X.; Xu, J.; Liu, Y.; Li, Y. Meteorological and hydrological droughts in the Lancang-Mekong River Basin: Spatiotemporal patterns and propagation. Atmos. Res. 2023, 293, 106913. [Google Scholar] [CrossRef]
- Chang, S.; Isaev, E.; Chen, H.; Wu, B.; Yan, N.; Ma, Z.; Meng, J. Exploring the Linkages Between Different Types of Drought and Their Impacts on Crop Production in Kyrgyzstan. IEEE J. Sel. Top. Appl. Earth Obs. Remote Sens. 2024, 17, 4566–4580. [Google Scholar] [CrossRef]
- Du, W.; Hao, Z.; Bai, M.; Zhang, L.; Zhang, C.; Wang, Z.; Xing, P. Spatiotemporal Variation in the Meteorological Drought Comprehensive Index in the Beijing–Tianjin–Hebei Region during 1961–2023. Water 2023, 15, 4230. [Google Scholar] [CrossRef]
- Bao, C.; Yong, M.; Bueh, C.; Bao, Y.; Jin, E.; Bao, Y.; Purevjav, G. Analyses of the Dust Storm Sources, Affected Areas, and Moving Paths in Mongolia and China in Early Spring. Remote Sens. 2022, 14, 3661. [Google Scholar] [CrossRef]
- Han, Z.; Huang, S.; Zhao, J.; Leng, G.; Huang, Q.; Zhang, H.; Li, Z. Long-chain propagation pathways from meteorological to hydrological, agricultural and groundwater drought and their dynamics in China. J. Hydrol. 2023, 625, 130131. [Google Scholar] [CrossRef]
- Feng, G.; Chen, Y.; Mansaray, L.R.; Xu, H.; Shi, A.; Chen, Y. Propagation of Meteorological Drought to Agricultural and Hydrological Droughts in the Tropical Lancang–Mekong River Basin. Remote Sens. 2023, 15, 5678. [Google Scholar] [CrossRef]
- Li, Y.; Huang, Y.; Li, Y.; Zhang, H.; Deng, Q.; Fan, J.; Wang, X. Temporal and Spatial Propagation Characteristics of the Meteorological, Agricultural and Hydrological Drought System in Different Climatic Conditions within the Framework of the Watershed Water Cycle. Water 2023, 15, 3911. [Google Scholar] [CrossRef]
- Zhao, P.; Xie, B.; Huang, X.; Qu, B. The dynamic change of propagation from meteorological drought to hydrological drought at the basin scale: A case study from the Weihe River Basin, China. Front. Environ. Sci. 2022, 10, 1054975. [Google Scholar] [CrossRef]
- Wu, C.; Hua, H.; Wang, J.; Dong, L.; Zohner, C.; Penuelas, J.; Wang, Y.; Zhou, Y.; Peng, S.; Zhu, Z.; et al. Air pollution weakens global spring greening. Biol. Sci. 2024; in review. [Google Scholar] [CrossRef]
- Li, C.; Zhang, X.; Yin, G.; Xu, Y.; Hao, F. Evaluation of Drought Propagation Characteristics and Influencing Factors in an Arid Region of Northeast Asia (ARNA). Remote Sens. 2022, 14, 3307. [Google Scholar] [CrossRef]
- Yuan, Y.; Bao, A.; Chang, C.; Jiang, L.; Zheng, G.; Yu, T.; Jiang, P. Divergent impacts of seasonal precipitation deficiency on grassland growth in drylands of Central Asia. Environ. Res. Lett. 2024, 19, 104027. [Google Scholar] [CrossRef]
- Li, S.; He, S.; Xu, Z.; Liu, Y.; Von Bloh, W. Desertification process and its effects on vegetation carbon sources and sinks vary under different aridity stress in Central Asia during 1990–2020. CATENA 2023, 221, 106767. [Google Scholar] [CrossRef]
Disclaimer/Publisher’s Note: The statements, opinions and data contained in all publications are solely those of the individual author(s) and contributor(s) and not of MDPI and/or the editor(s). MDPI and/or the editor(s) disclaim responsibility for any injury to people or property resulting from any ideas, methods, instructions or products referred to in the content. |
© 2025 by the authors. Licensee MDPI, Basel, Switzerland. This article is an open access article distributed under the terms and conditions of the Creative Commons Attribution (CC BY) license (https://creativecommons.org/licenses/by/4.0/).