Abstract
Understanding precipitation variability is essential for assessing climate dynamics and their impacts on agriculture, water resources, and infrastructure. This study analyzes subseasonal precipitation patterns in Rio Grande do Sul, Brazil, using 45-day accumulated intervals over a 17-year period (2006–2022), a timescale critical for understanding drivers of extreme events like the catastrophic floods of 2024. A total of 138 precipitation fields were generated from 670 spatial points. Spatial analysis revealed median precipitation values ranging from 130 to 329 mm/45 days, with the northeast showing the highest accumulations and the southwest showing the driest conditions. Temporal variability was marked by abrupt anomalies, with median peaks up to 462 mm and minima of 33 mm. Significant temporal autocorrelation (lag-1, 45 days) was identified in the central and northern regions, while lag-2 (90 days) showed inverse patterns in the south (correlation coefficient ≈ −0.45). Principal component analysis (KMO = 0.909; Bartlett’s χ2 = 187,990.945; p < 0.05) identified seven dominant modes, with PC1 explaining 26% of total variance and highlighting extremely wet anomalies (e.g., SPI > 2.0). Correlation with the Oceanic Niño Index revealed heterogeneous responses to ENSO phases, with strong El Niño episodes (2009, 2015–2016) associated with precipitation peaks up to 966 mm/45 days. These results underscore the importance of subseasonal scales for understanding climate anomalies and support the development of regional forecast strategies and water management policies under increasing climate variability.
1. Introduction
Understanding precipitation patterns is fundamental to interpreting climate dynamics and their implications for environmental systems, socioeconomic development, and risk management [1]. The growing frequency and intensity of extreme precipitation events, largely driven by global climate change, pose a significant challenge to societal resilience. Southern Brazil, particularly the state of Rio Grande do Sul (RS), has emerged as a “hotspot” of climate vulnerability, as evidenced by the catastrophic May 2024 floods, which affected over 2.3 million people and caused unprecedented economic and human losses. This disaster, attributed to the combination of a strong El Niño, climate-induced ocean warming, and an atmospheric blocking pattern, underscores the urgent need for refined precipitation analyses at intermediate timescales. As a key climate variable, precipitation directly influences agricultural productivity, water resources, energy generation, and urban infrastructure [1,2]. Accurate assessments of its spatial and temporal distribution are crucial for anticipating extreme events and designing effective mitigation and adaptation strategies [3].
The frequency and intensity of extreme precipitation events have increased in recent decades, largely driven by global climate change [4,5]. Southern Brazil, particularly the state of Rio Grande do Sul (RS), stands out in climate research due to its environmental importance and economic significance [6,7]. The region hosts major watersheds (e.g., Jacuí and Uruguai rivers) and plays a central role in national crop production, including soybeans, rice, and corn. However, its susceptibility to climate variability and extreme events—such as the recent floods—underscores the urgency of refined precipitation analyses at intermediate timescales [8,9].
Subseasonal-to-seasonal (S2S) prediction, especially in the 2–8-week range, has emerged as a valuable bridge between weather forecasting and seasonal climate outlooks, filling what is often termed the “predictability desert” [10,11,12]. However, the skill of S2S forecast models for precipitation in South America remains limited, often decaying rapidly after the first month, though predictability for “long memory” variables like soil moisture can extend up to three months [11]. This highlights the importance of diagnostic studies, such as the present one, that characterize the inherent patterns of subseasonal variability.
In this context, fixed 45-day precipitation accumulation windows offer a promising methodological approach [12]. This timescale aligns well with the periodicity of the Madden–Julian Oscillation (MJO), a dominant source of intraseasonal variability with 30 to 70 days cycles [5,13]. The MJO is a key modulator of mid-latitude precipitation, and recent research distinguishes between weak and “extreme” MJO events, with the latter inducing more intense and spatially extensive rain anomalies in South America, thereby increasing predictability [14,15].
While the impacts of MJO, El Niño–Southern Oscillation (ENSO), and the Antarctic Oscillation (AAO) on precipitation are relatively well documented globally [16], comprehensive investigations of their combined effects on subseasonal scales remain rare in South America [12,17]. In RS, only a handful of studies have applied fixed 45-day windows to assess correlations between precipitation and climate indices such as Niño3.4, PDO, and SASH [7] This points to a significant research gap regarding subseasonal variability in the region [18].
The choice of fixed 45-day windows in this study was chosen for its alignment with MJO periodicity and for its practical relevance, including its overlap with critical phenological stages of crops such as maize [18]. The combination of time series, autocorrelation, and spatial analysis techniques enhances the detection of spatiotemporal patterns and regional mechanisms influencing precipitation [19,20]. High-resolution datasets like CHIRPS and IMERG further strengthen the robustness of these assessments [21].
Given this context, the objective of this study is to investigate the spatiotemporal characteristics of precipitation in southern Brazil using fixed 45-day windows. The specific objectives are to (i) characterize spatial and temporal variations in precipitation; (ii) analyze temporal autocorrelation patterns; and (iii) explore potential spatiotemporal relationships between precipitation anomalies and large-scale climate drivers.
Considering the recent climate-related disasters and the state’s strategic role in Brazil’s economy, this research is expected to contribute valuable insights for climate adaptation, water management, and disaster risk reduction policies in southern Brazil.
2. Material and Methods
2.1. Area Characterization
The state of Rio Grande do Sul (Figure 1) covers approximately 282,000 km2 and is subdivided into 497 municipalities, presenting a striking geographic diversity [22]. Located between 27 °S and 33 °S latitude and 49 °W to 58 °W longitude, the state includes biomes such as the Pampa and transitional zones of the Atlantic Forest. Its topographic variability—including plains, plateaus, and mountain ranges—directly influences precipitation distribution through orographic effects, especially in elevated regions such as the Serra Gaúcha [7,22].
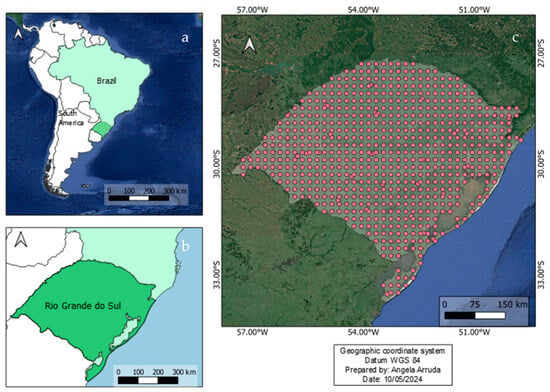
Figure 1.
Geographical representation of the study area. (a) South America, highlighting Brazil; (b) The State of Rio Grande do Sul, located in southern Brazil; (c) Spatial distribution of the 670 precipitation points used in this study, derived from CHIRPS gridded data (0.05° resolution). These points correspond to pixel centroids where 45-day precipitation accumulation values were extracted, representing local rainfall behavior during the study period.
The Rio Grande do Sul has a predominantly humid subtropical climate (Cfa), with cooler high-altitude areas classified as Cfb under the Köppen classification [23]. Its seasonal climate variability, affected by phenomena like ENSO and regional circulation systems, has major socioeconomic implications, particularly for rainfed agriculture in the southern half of the state [8]. A total of 670 sampling points were used in this study, consisting of 28 conventional rain gauges and 642 gridded data points from CHIRPS v2.0. The 28 pluviometric stations were obtained from the HidroWeb database of the Brazilian National Water Agency (ANA), selected based on the continuity and quality of their daily data series between 2006 and 2022.
The remaining 642 points correspond to regular grid points from CHIRPS, a quasi-global gridded precipitation dataset that blends infrared satellite imagery with in situ station data using interpolation algorithms [21]. These grid points were systematically extracted from Google Earth Engine using an even spacing of approximately 0.05° (~5.5 km), ensuring full spatial coverage across RS. The CHIRPS was selected over other satellite products such as GPM or TRMM due to its longer historical coverage, better spatial resolution for continental regions, and stronger validation performance over South America in similar studies. Although cross-validation between CHIRPS and ground stations would ideally be conducted, it was not feasible in this study due to the limited number of operational rain gauges with consistent and complete data in certain areas, particularly in mountainous regions like Serra Gaúcha.
All precipitation data were aggregated into non-overlapping 45-day periods, yielding 138 intervals for each point from 2006 to 2022. This interval was chosen for its alignment with the typical periodicity of the Madden–Julian Oscillation (30 to 70 days), as well as its relevance to agricultural phenological stages in southern Brazil.
2.2. Methodology
2.2.1. Descriptive Analysis
Descriptive spatial and temporal statistics (mean, median, max, min, coefficient of variation) were calculated for each 45-day interval. Given that precipitation data are well known to exhibit non-normal distributions, the analysis prioritized non-parametric statistics like the median, which is more robust to extreme values than the mean. Consequently, formal tests of normality, such as the Shapiro–Wilk test, were not applied as a prerequisite for the primary analyses, though results are presented for descriptive context.
2.2.2. Spatial Analysis and Oceanic Niño Index
To evaluate the relationship between large-scale ocean–atmosphere interactions and regional precipitation variability, this study examined the Oceanic Niño Index (ONI) and its influence on 45-day accumulated precipitation in Rio Grande do Sul. The ONI is calculated as the three-month running mean of sea surface temperature (SST) anomalies in the Niño 3.4 region (5 °N–5 °S, 170 °E–120 °W), based on a 30-year climatological mean. It is the official indicator used by NOAA to classify El Niño, La Niña, and neutral conditions.
Before the correlation analysis, the seasonal cycle was removed from the precipitation time series by subtracting the long-term climatology of each period. This step ensured that resulting anomalies reflected interannual variability rather than seasonal trends. A simple linear regression model was then applied to investigate the relationship between ONI values and precipitation anomalies across the 670 sampling points. Equation (1) expresses the regression model used:
where
Y = β0 + β1X + ε
- Y is the precipitation anomaly;
- X is the ONI value;
- β0 is the intercept;
- β1 is the slope (regression coefficient);
- ε is the residual error.
The regression analysis was conducted independently for each grid point. The results, including regression coefficients (β1), correlation values (r), and significance levels (p-values), were mapped to identify spatial patterns in the response of precipitation to ENSO phases. Although direct correlation maps are not show summarizes the spatial distribution of precipitation patterns during El Niño, La Niña, and Neutral periods, highlighting the regions most sensitive to oceanic forcing.
2.2.3. Temporal Autocorrelation Analysis
The temporal autocorrelation of precipitation was analyzed at each of the 670 sampling points using the autocorrelation function (ACF) applied to the 45-day time series. The goal was to detect memory or periodicity in rainfall behavior.
The analysis focused exclusively on temporal autocorrelation, and each lag corresponds to a 45-day interval. For example, lag 1 refers to the correlation between precipitation at time t and t + 1 (i.e., the next 45-day period). While lag-2 refers to the correlation with the period 90 days later. This analysis quantifies the ‘memory’ in the precipitation series, which is crucial for assessing subseasonal predictability. No spatial interpretation of lag distance was made.
The autocorrelation coefficient (r) and the corresponding p-value for each lag were calculated and summarized. Significant positive autocorrelation (p < 0.05) was interpreted as indicative of persistence or recurrence in rainfall patterns, which could reflect influences from slow-acting climate mechanisms like soil moisture feedbacks or oceanic oscillations.
2.2.4. Spatial-Temporal Multivariate Analysis and SPI
To explore spatial-temporal variability in precipitation across the 670 sample points, a combination of multivariate and climatological indices was applied, structured in three stages: data suitability testing, dimensionality reduction via principal component analysis (PCA), and the application of the standardized precipitation index (SPI).
Stage 1: Suitability Testing—Bartlett and KMO
Before applying PCA, the dataset was evaluated using Bartlett’s test of sphericity and the Kaiser–Meyer–Olkin (KMO) measure to verify the appropriateness of performing factor extraction. Bartlett’s test of sphericity tests whether the correlation matrix is significantly different from an identity matrix, ensuring that there are sufficient inter-variable correlations for PCA. The test statistics are computed as Equation (2).
where
- is the number of observations;
- is the number of variables;
- is the determinant of the correlation matrix.
A p-value < 0.05 indicates that the variables are sufficiently correlated to justify the application of factor analysis. KMO sampling adequacy measure: In addition, the KMO measure assesses the adequacy of the sample for factor analysis. It is calculated by Equation (3).
where
- is the correlation coefficient of the correlation matrix;
- is the coefficient of the partial correlation matrix.
A KMO value above 0.6 was used as a cutoff to confirm sampling adequacy. Both tests were applied to the correlation matrix derived from the 45-day accumulated precipitation anomalies across all grid points.
Stage 2: Principal Component Analysis (PCA)
After confirming suitability, PCA was used to reduce the dimensionality of the precipitation anomaly dataset. PCA identifies uncorrelated linear combinations (principal components) of the original variables that explain the majority of variance in the data. The transformation is defined as Equation (4).
where
- is the principal component matrix;
- is the matrix of eigenvectors (principal components);
- is the original data matrix.
- PCA allowed the identification of dominant spatial modes of precipitation variability across Rio Grande do Sul, and the first few components (typically those explaining >70% of the variance) were retained for exploratory interpretation. Loadings and scree plots were analyzed to define the number of relevant components.
- The PCA was implemented using the prcomp() function in R, with scaling enabled to ensure the equal weight of all input variables. Spatial patterns associated with the first components were mapped to detect regional rainfall regimes or transitions in anomaly behavior.
Stage 3: Standardized Precipitation Index (SPI)
To complement the multivariate analysis and quantify precipitation anomalies, the standardized precipitation index (SPI) was computed for all points. Unlike generic anomaly indices, the SPI accounts for local climatology by standardizing precipitation using its mean and standard deviation. The SPI is calculated by Equation (5).
where
- is the observed precipitation;
- is the average precipitation;
- is the standard deviation of precipitation.
SPI values allow classification of dry and wet events as
- SPI < −1.5: Severe drought;
- −1.5 < SPI < −1: Moderate drought;
- −1 < SPI < 1: Normal;
- 1 < SPI < 1.5: Moderate wetness;
- SPI > 1.5: Severe wetness.
The SPI classification followed the guidelines of [24], as described by [25]. The SPI was preferred over generic precipitation anomaly indices for its ability to standardize precipitation across different spatial and temporal contexts, allowing a comparison across the 670 locations and the 13,845-day intervals. Together, the PCA and SPI analyses enabled the identification of dominant precipitation modes and the characterization of hydrometeorological extremes at a sub-seasonal scale. These tools contributed to the interpretation of spatially heterogeneous responses to climate variability across the complex topography of Rio Grande do Sul.
The Google Earth Engine (GEE) script used to extract the CHIRPS precipitation time series is provided in Appendix B for transparency and reproducibility.
3. Results and Discussion
3.1. Spatial Descriptive Analysis
The analysis of accumulated precipitation in subseasonal intervals of 45 days during the period 2006–2022, reveals distinct spatial distribution patterns across the state of Rio Grande do Sul (Figure 2). Median precipitation values ranged from 130 to 164 mm/45 days in the southernmost and western regions, while the highest values (235–329 mm/45 days) were concentrated in the northeastern areas of the state.
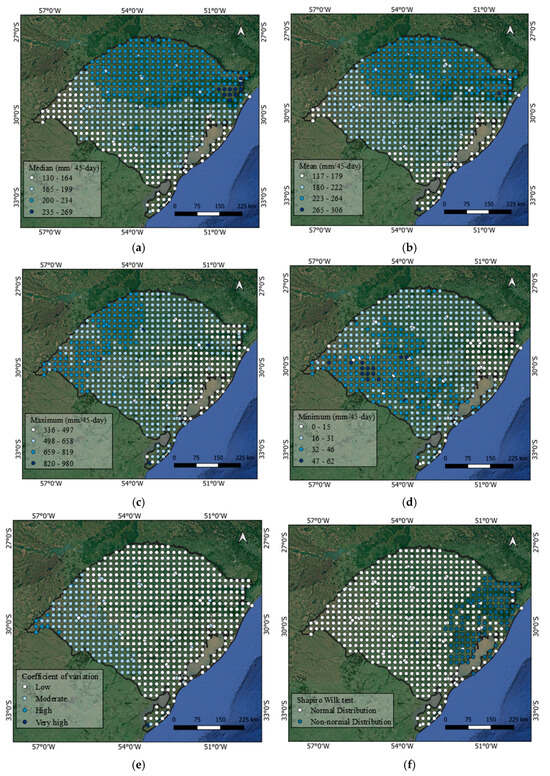
Figure 2.
Spatial descriptive analysis of accumulated subseasonal precipitation for the 45 days, distributed from 2006 to 2022, based on the series analyzed (a–f).
These spatial differences can be explained by the interplay of large-scale atmospheric circulation and regional topography. The pronounced precipitation maximum in the northeast is primarily a consequence of orographic lift, where the Serra Gaúcha mountain range forces moist air masses moving inland from the Atlantic Ocean to ascend, cool adiabatically, and release significant rainfall. The sustained flow of moisture required for this process is largely governed by the circulation around the South Atlantic Subtropical High (SASH), whose northeasterly winds on its western flank serve as the primary conveyor of maritime humidity to the continent. Therefore, the observed wet conditions in the northeast are not merely a local phenomenon but are dynamically linked to the interaction between the quasi-permanent SASH and the fixed topography of the Serra Gaúcha. Seminal work by has established the critical role of the SASH in modulating weather and climate across Brazil, with its seasonal position and intensity dictating moisture transport pathways. In contrast, the drier conditions in the west and south can be attributed to their greater distance from this primary Atlantic moisture source and their position in a relative rain shadow, influenced by both the Andes to the far west and the subsidence associated with continental high-pressure systems.
The regions between the north and center of the state presented intermediate values (200 to 234 mm/45 days), revealing an irregular spatial distribution pattern. These regional discrepancies have direct implications for agriculture, water availability, and land-use management.
Such findings agree with the broader understanding that precipitation variability must be analyzed across multiple scales. [10] emphasize the importance of spatial scale in understanding precipitation variability, showing that different mechanisms dominate at different scales.
Studies focusing on daily or pentadal data often highlight different dominant processes, including intraseasonal modes like the Madden–Julian Oscillation (MJO), which modulates rainfall. Additionally, the South Atlantic Convergence Zone (SACZ) and the southern annular mode (SAM/AAO) significantly affect rainfall distribution by modulating the entry and persistence of frontal systems and convective clusters over southern Brazil.
A discrepancy was also observed between the mean values (265 to 306 mm/45 days) and medians, indicating the occurrence of extreme events that increase the mean. This asymmetry suggests that the exclusive use of the mean may lead to the underestimation of critical events, highlighting the importance of joint analysis with the median. The extreme values further illustrate these spatial contrasts. Maximum values were concentrated in the central-west region, while minimum values (0–62 mm/45 days) predominated in the southwest, reflecting episodes of drought. These patterns are important for water resource planning and risk mitigation.
The coefficient of variation (Figure 2e) indicates greater rainfall predictability in the center-east and increasing variability toward the west. This pattern of increasing variability westward reinforces the interpretation of a more tenuous and less reliable moisture supply in those regions, making them more susceptible to drought when large-scale atmospheric patterns are unfavorable. These patterns suggest that regions differ in their susceptibility to irregular rainfall events, which is essential for crop planning and infrastructure design. Variability in predictability has also been linked to intraseasonal phenomena such as the MJO and the SACZ, as noted by [4,13]
These climate drivers interact with topography and modulate regional rainfall regimes. Warming sea surface temperatures, especially in the South Atlantic and equatorial Pacific, further influence these systems, potentially intensifying hydrometeorological extremes under anthropogenic climate change. It is also worth noting that while high-resolution gridded datasets like CHIRPS are invaluable for capturing such spatial gradients, they can sometimes smooth the peaks of extreme, localized rainfall compared to point-based rain gauge measurements. This suggests that the absolute magnitudes of the most extreme events might be even higher than reported here, further emphasizing the region’s vulnerability.
The Shapiro–Wilk test (Figure 2f) indicated near-normal distributions in most regions, except in the far east, where deviations suggest the presence of extreme events or skewed distributions. This finding calls for location-specific statistical treatments.
3.2. Temporal Descriptive Analysis
Over the 17-year period, subseasonal precipitation showed high temporal variability (Figure 3). Median values ranged from 33 mm to 462 mm per 45-day period. The highest median occurred between 27 October and 10 December 2009, followed by a peak in late 2015.
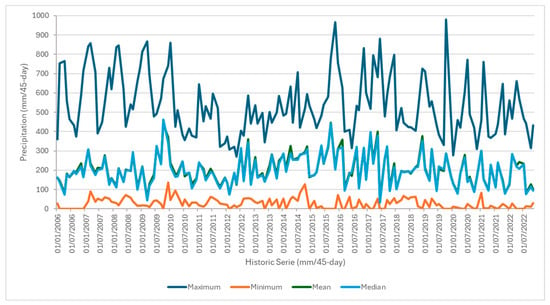
Figure 3.
Descriptive statistical analysis of 45-day subseasonal precipitation, distributed from 2006 to 2022, based on the series analyzed.
This temporal resolution of 45-day accumulations allows the identification of subseasonal extremes potentially modulated by intraseasonal oscillations, such as the Madden–Julian Oscillation (MJO), as discussed by leading authorities in the field such as [4,5,13]. The MJO, with its 30–70-day cycle, acts as a powerful organizer of tropical convection, and its teleconnections are known to significantly influence precipitation patterns in the South American subtropics.
Moreover, studies by [10,25,26] and highlight how precipitation anomalies vary depending on the temporal scale of analysis and how intraseasonal variability interacts with larger-scale climate modes such as ENSO and the MJO.
The abrupt oscillations throughout the time series, with pronounced peaks and valleys, are the signature of these powerful, transient modulations. An active (wet) phase of the MJO passing over the continent can create a large-scale environment conducive to widespread, heavy rainfall, while a suppressed (dry) phase can lead to extended breaks in precipitation, even during the climatologically wet season.
The analysis of the maximum values shows relatively stable behavior between 2006 and 2010, followed by a trend of greater variability from 2016 onwards. These results are consistent with findings from [10], who emphasized the influence of tropical–extratropical interactions and their variable impacts depending on the temporal scale analyzed. This complexity further supports the integration of subseasonal variability, such as that linked to the MJO, in regional precipitation studies [20]. These fluctuations reinforce the need for adaptation strategies, especially in sectors such as agriculture and water resources, which are highly sensitive to subseasonal climate variability.
3.3. Relationship Between Precipitation Patterns and Oceanic Niño Index
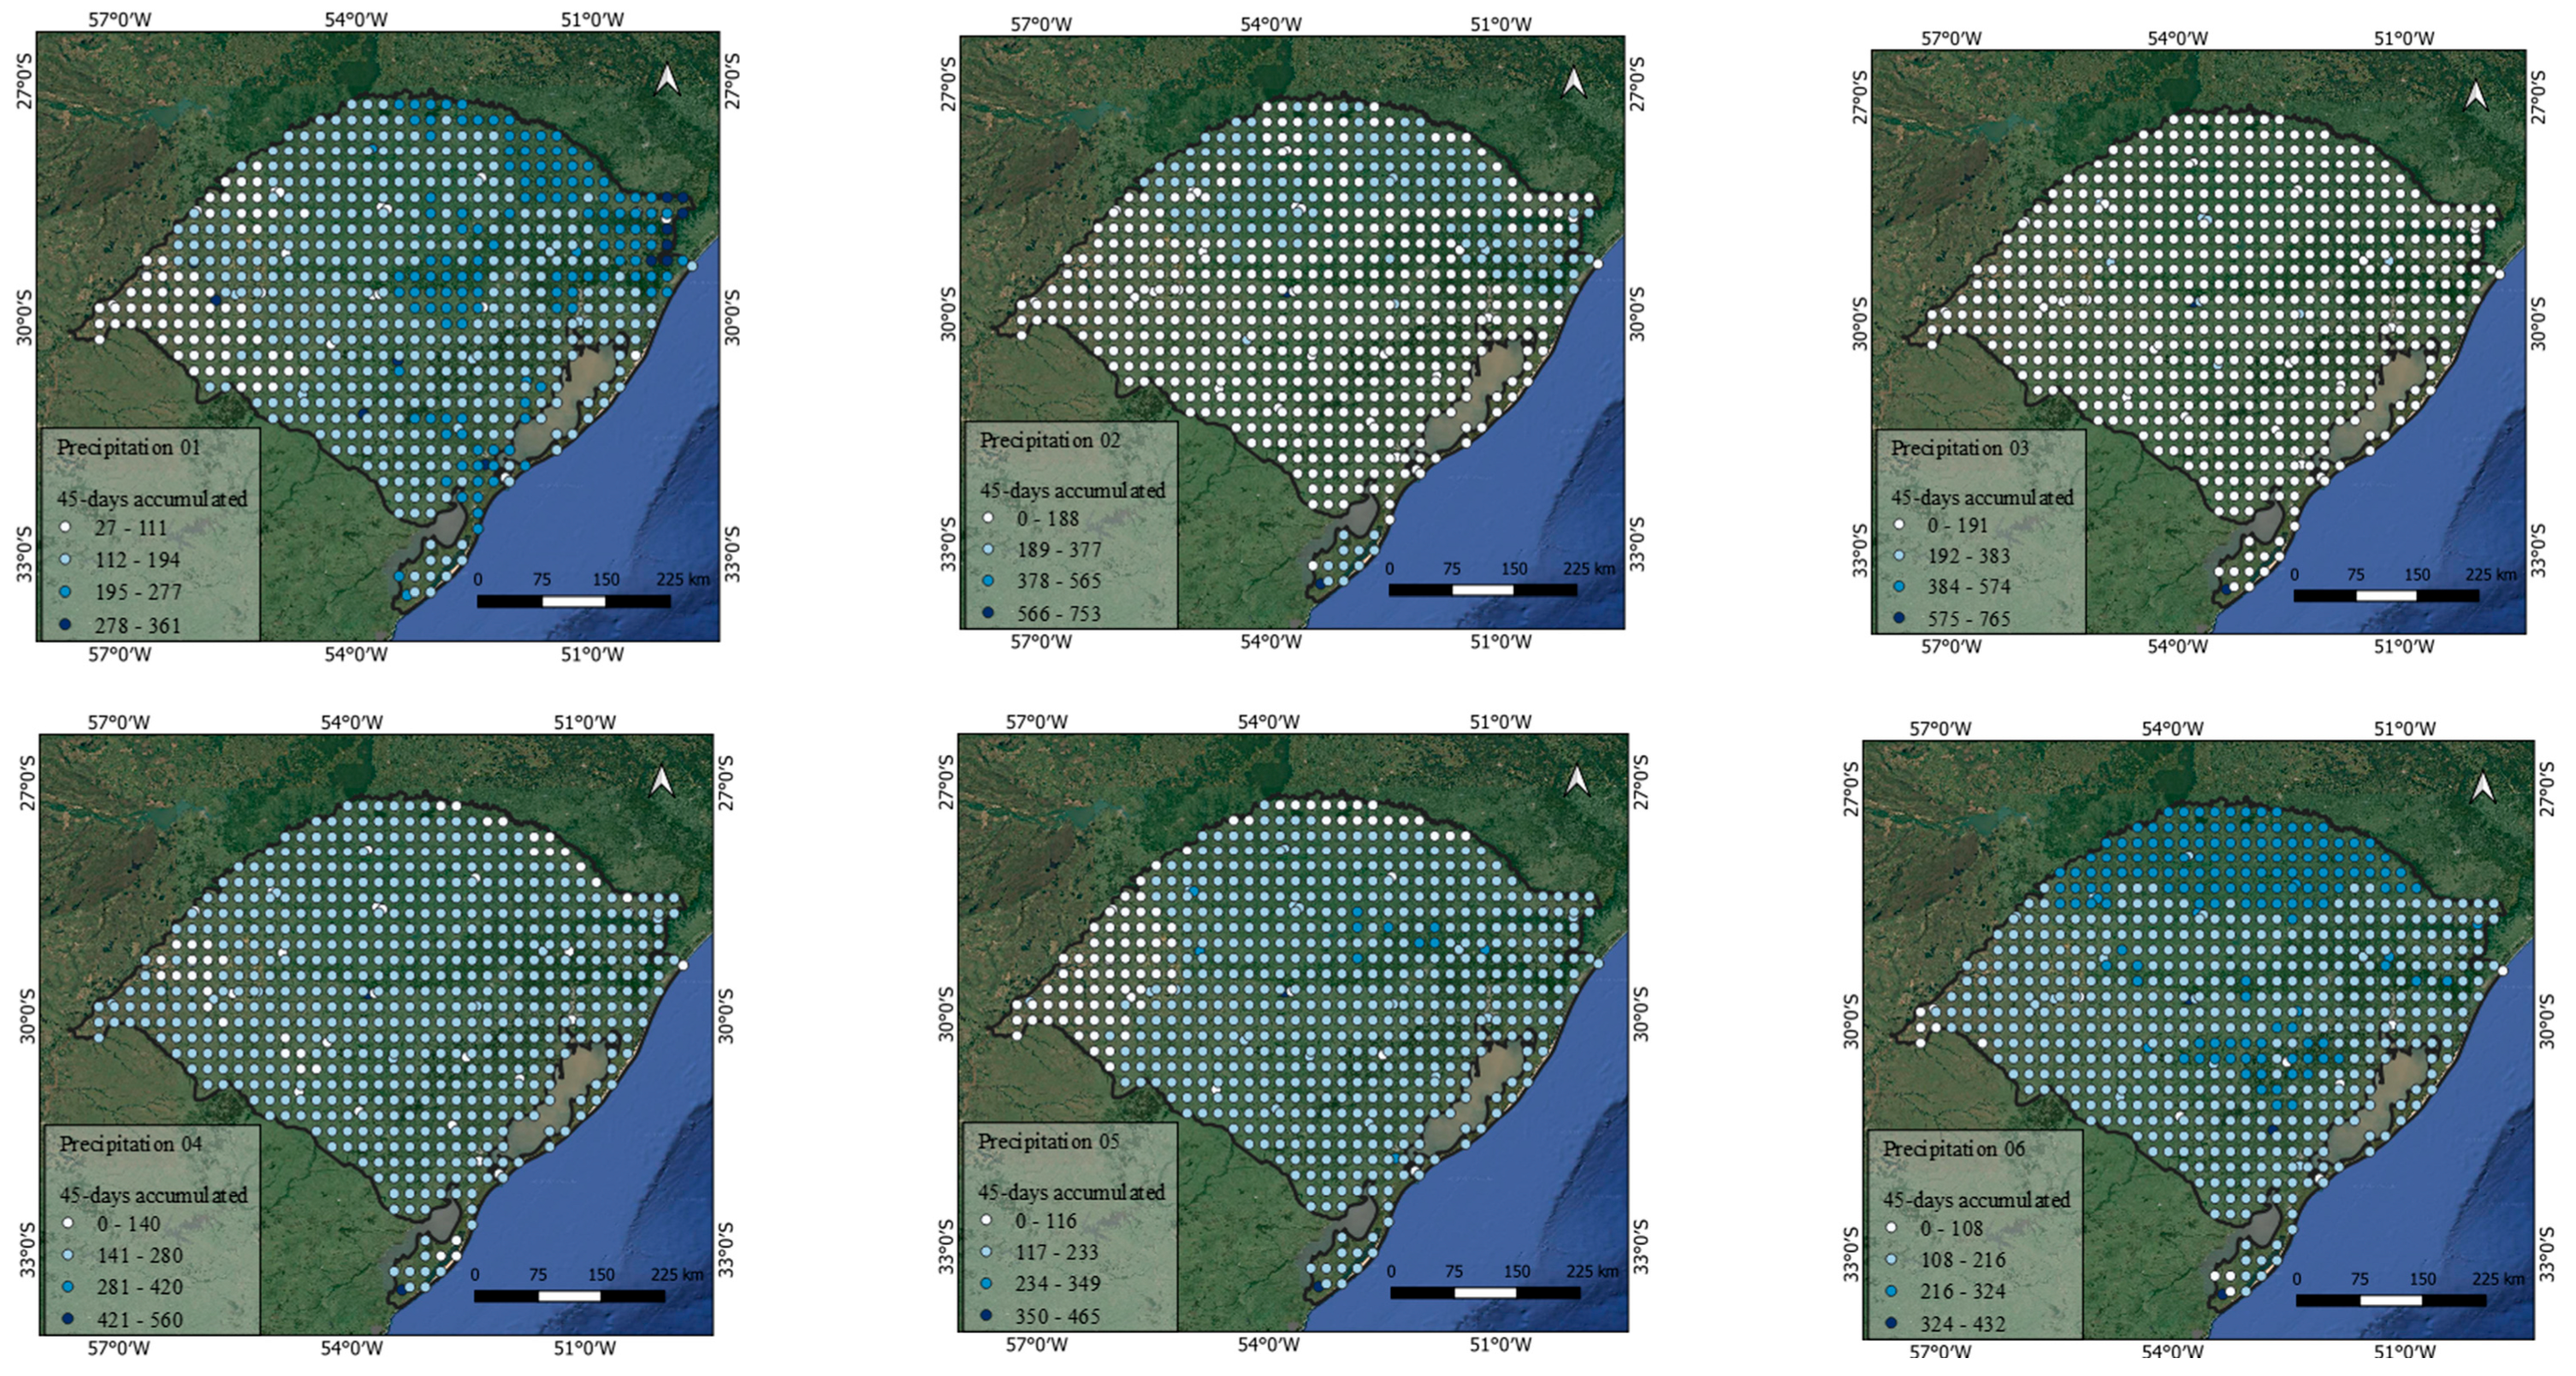
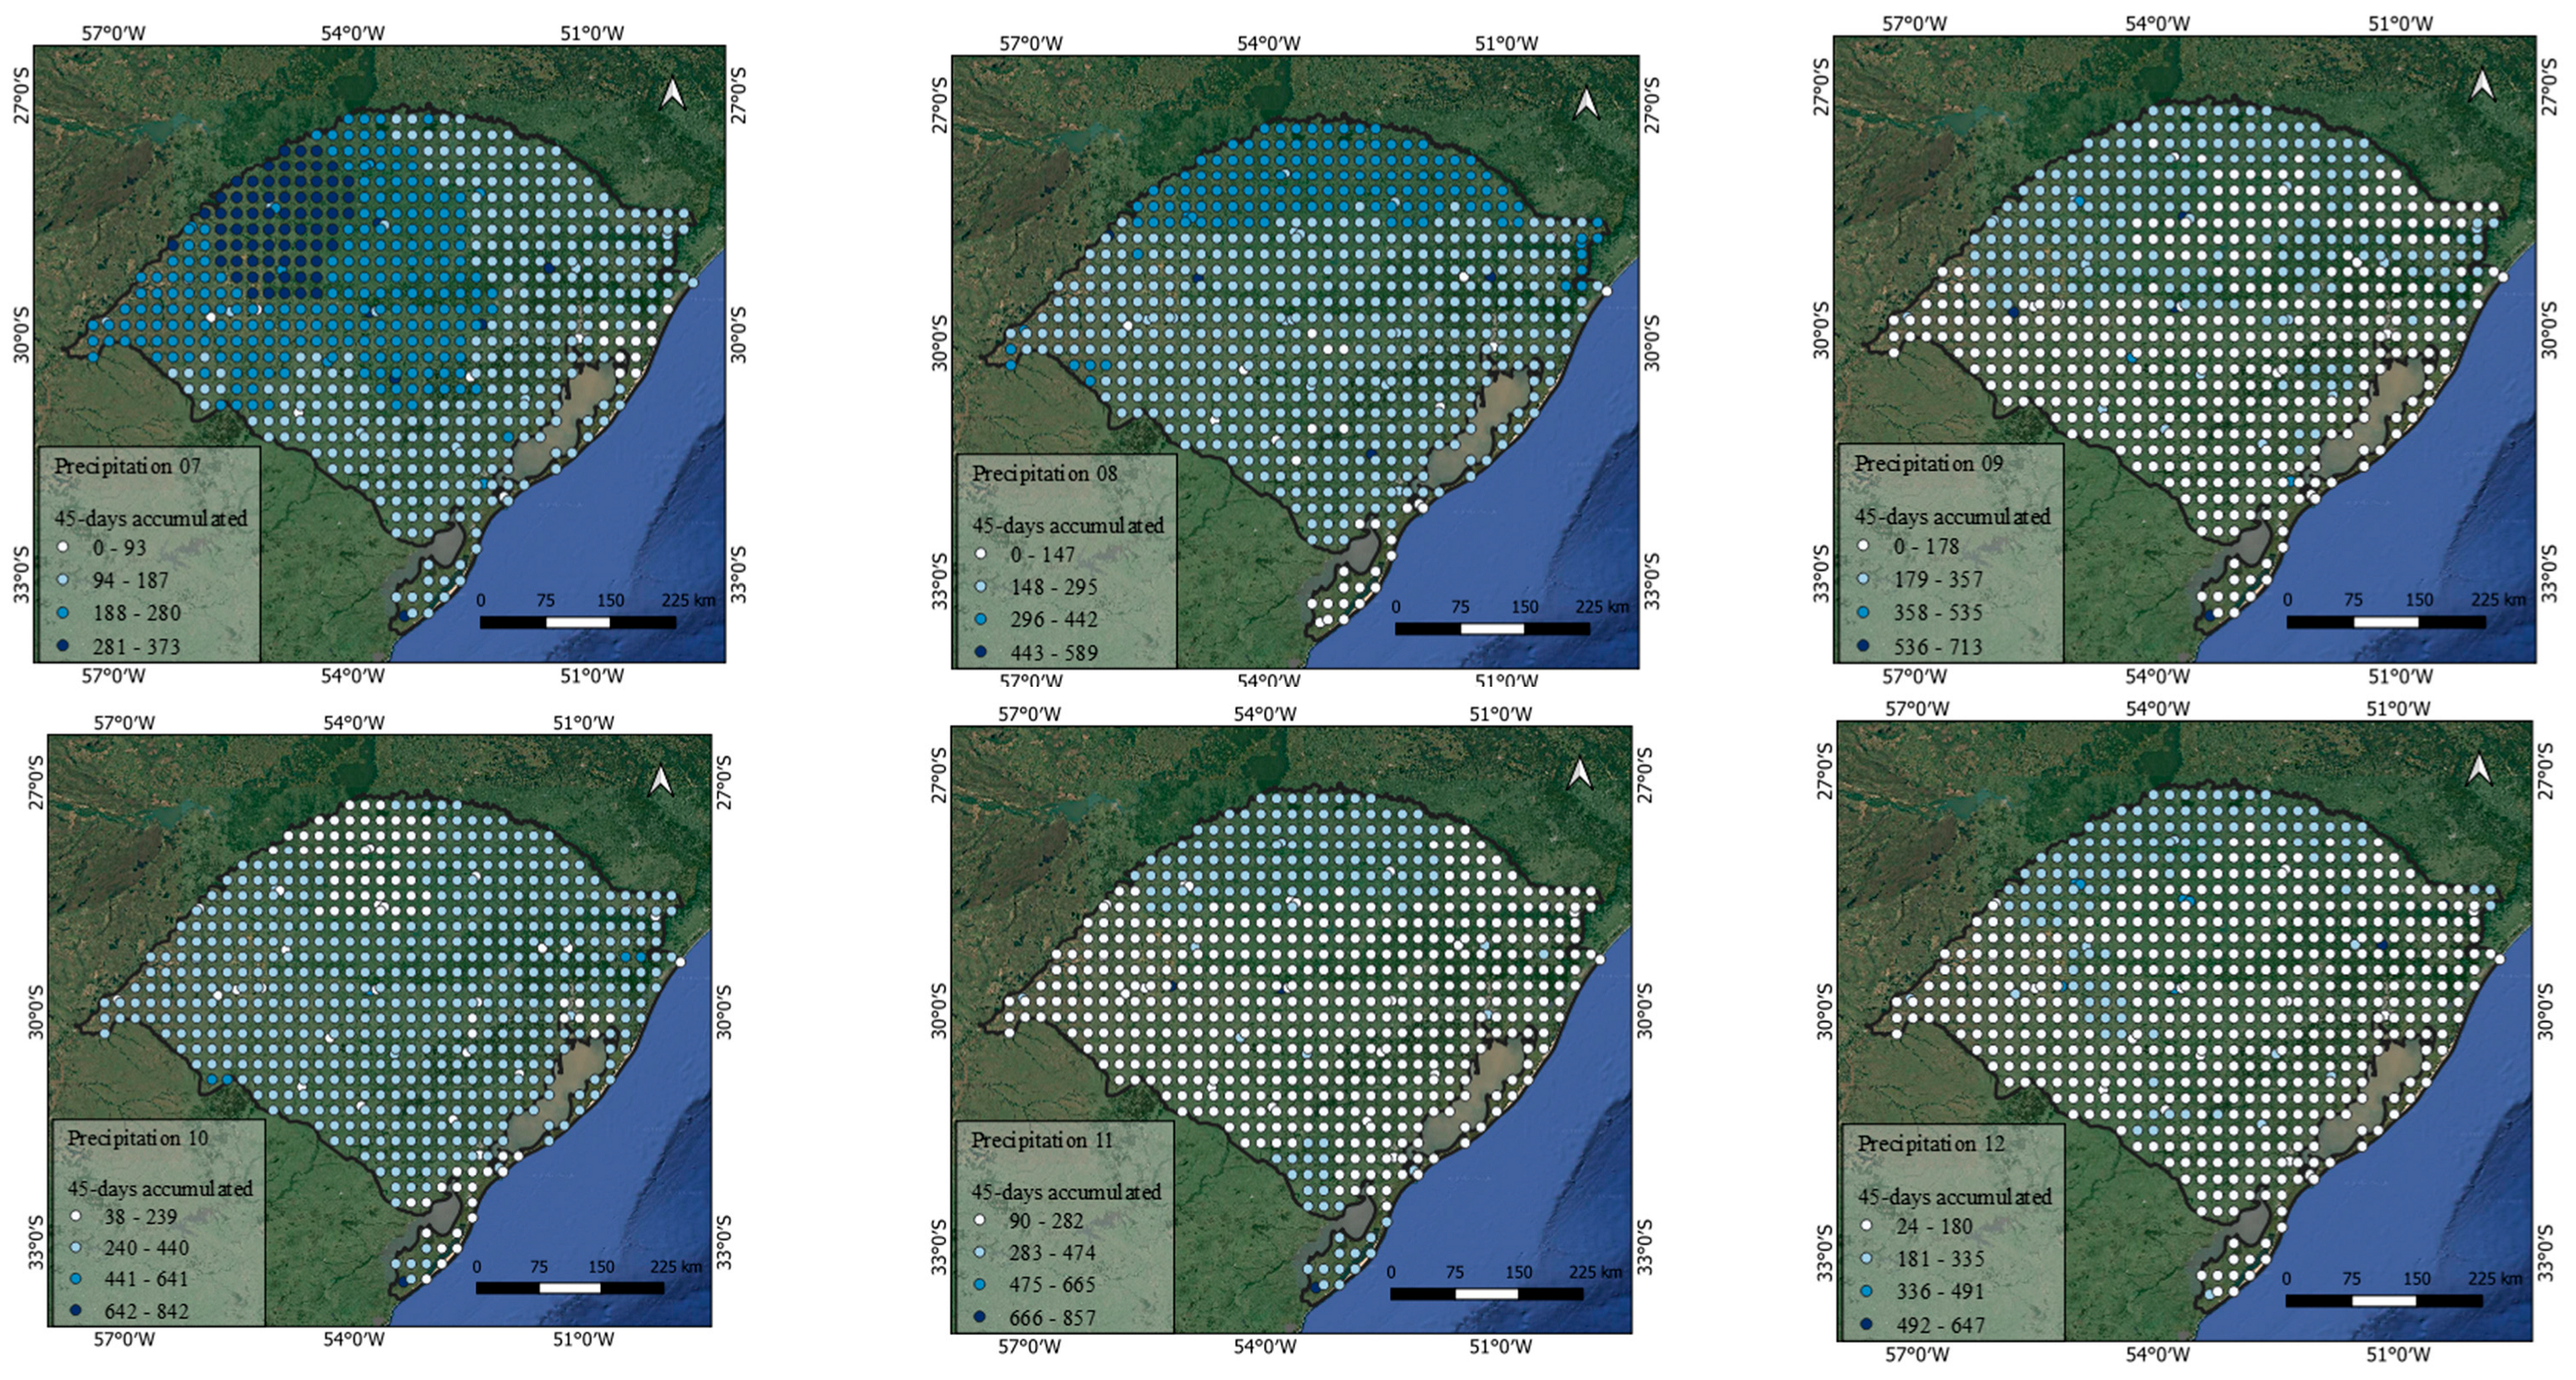
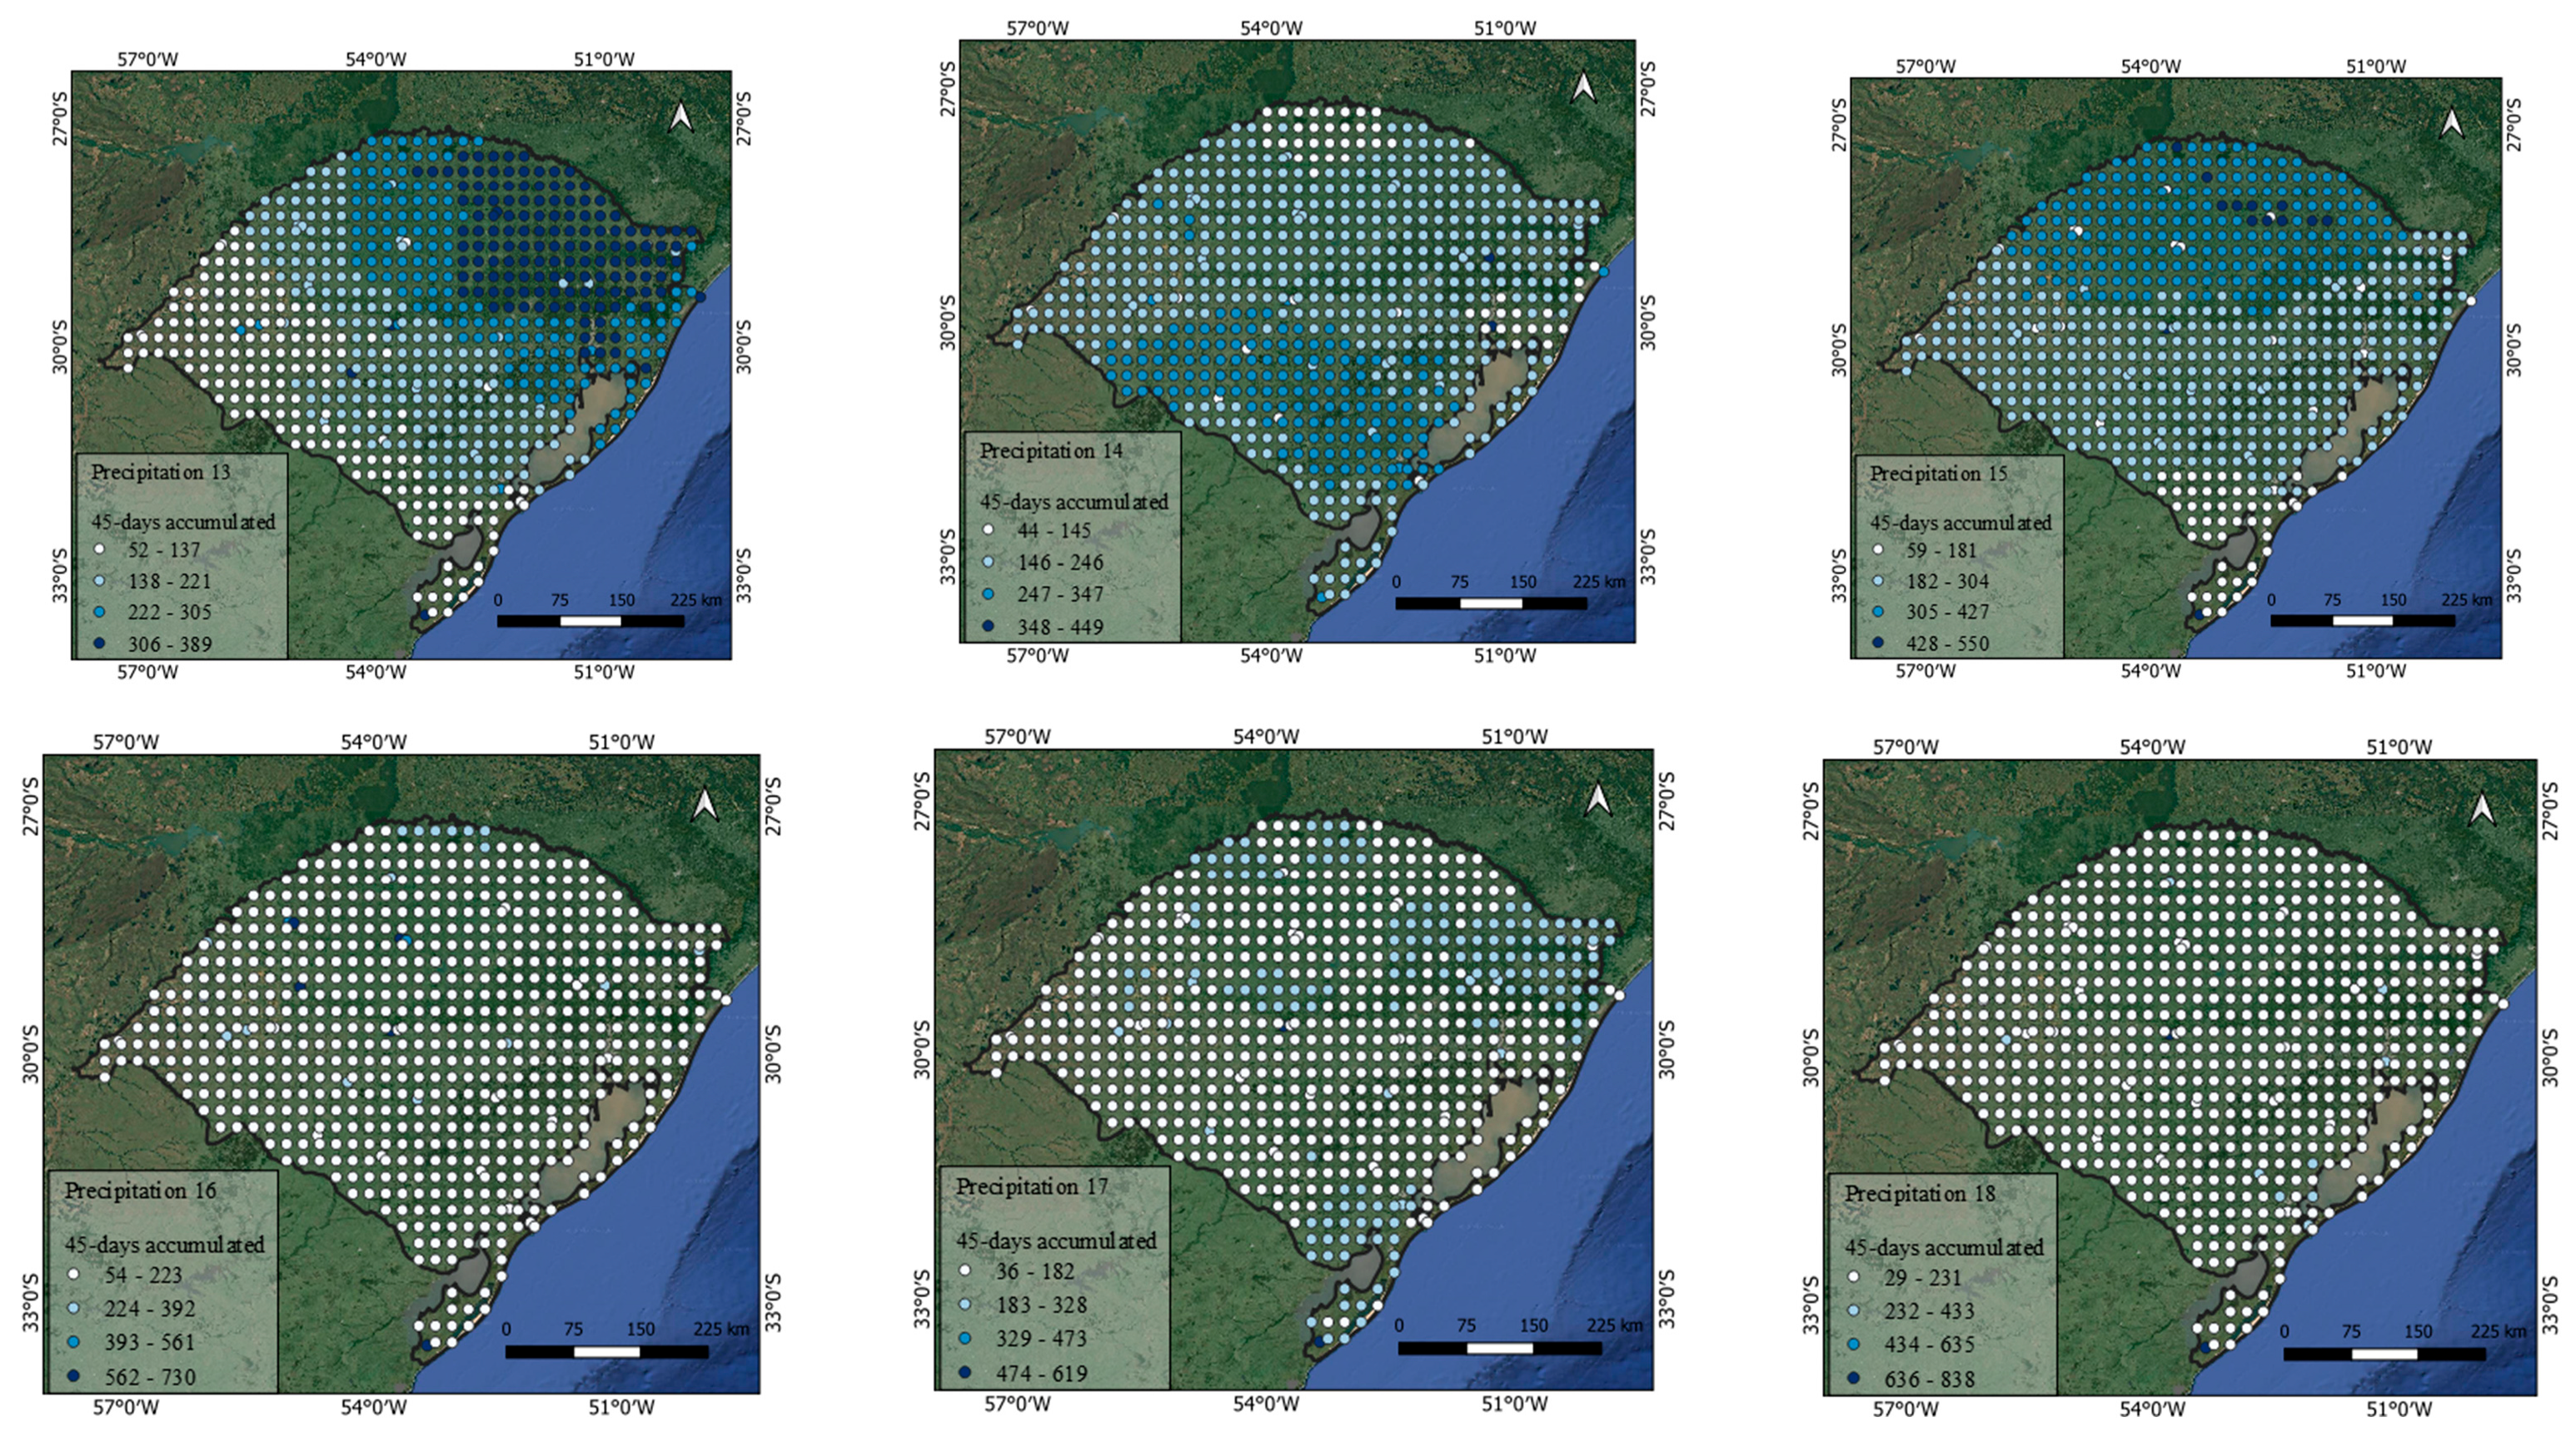
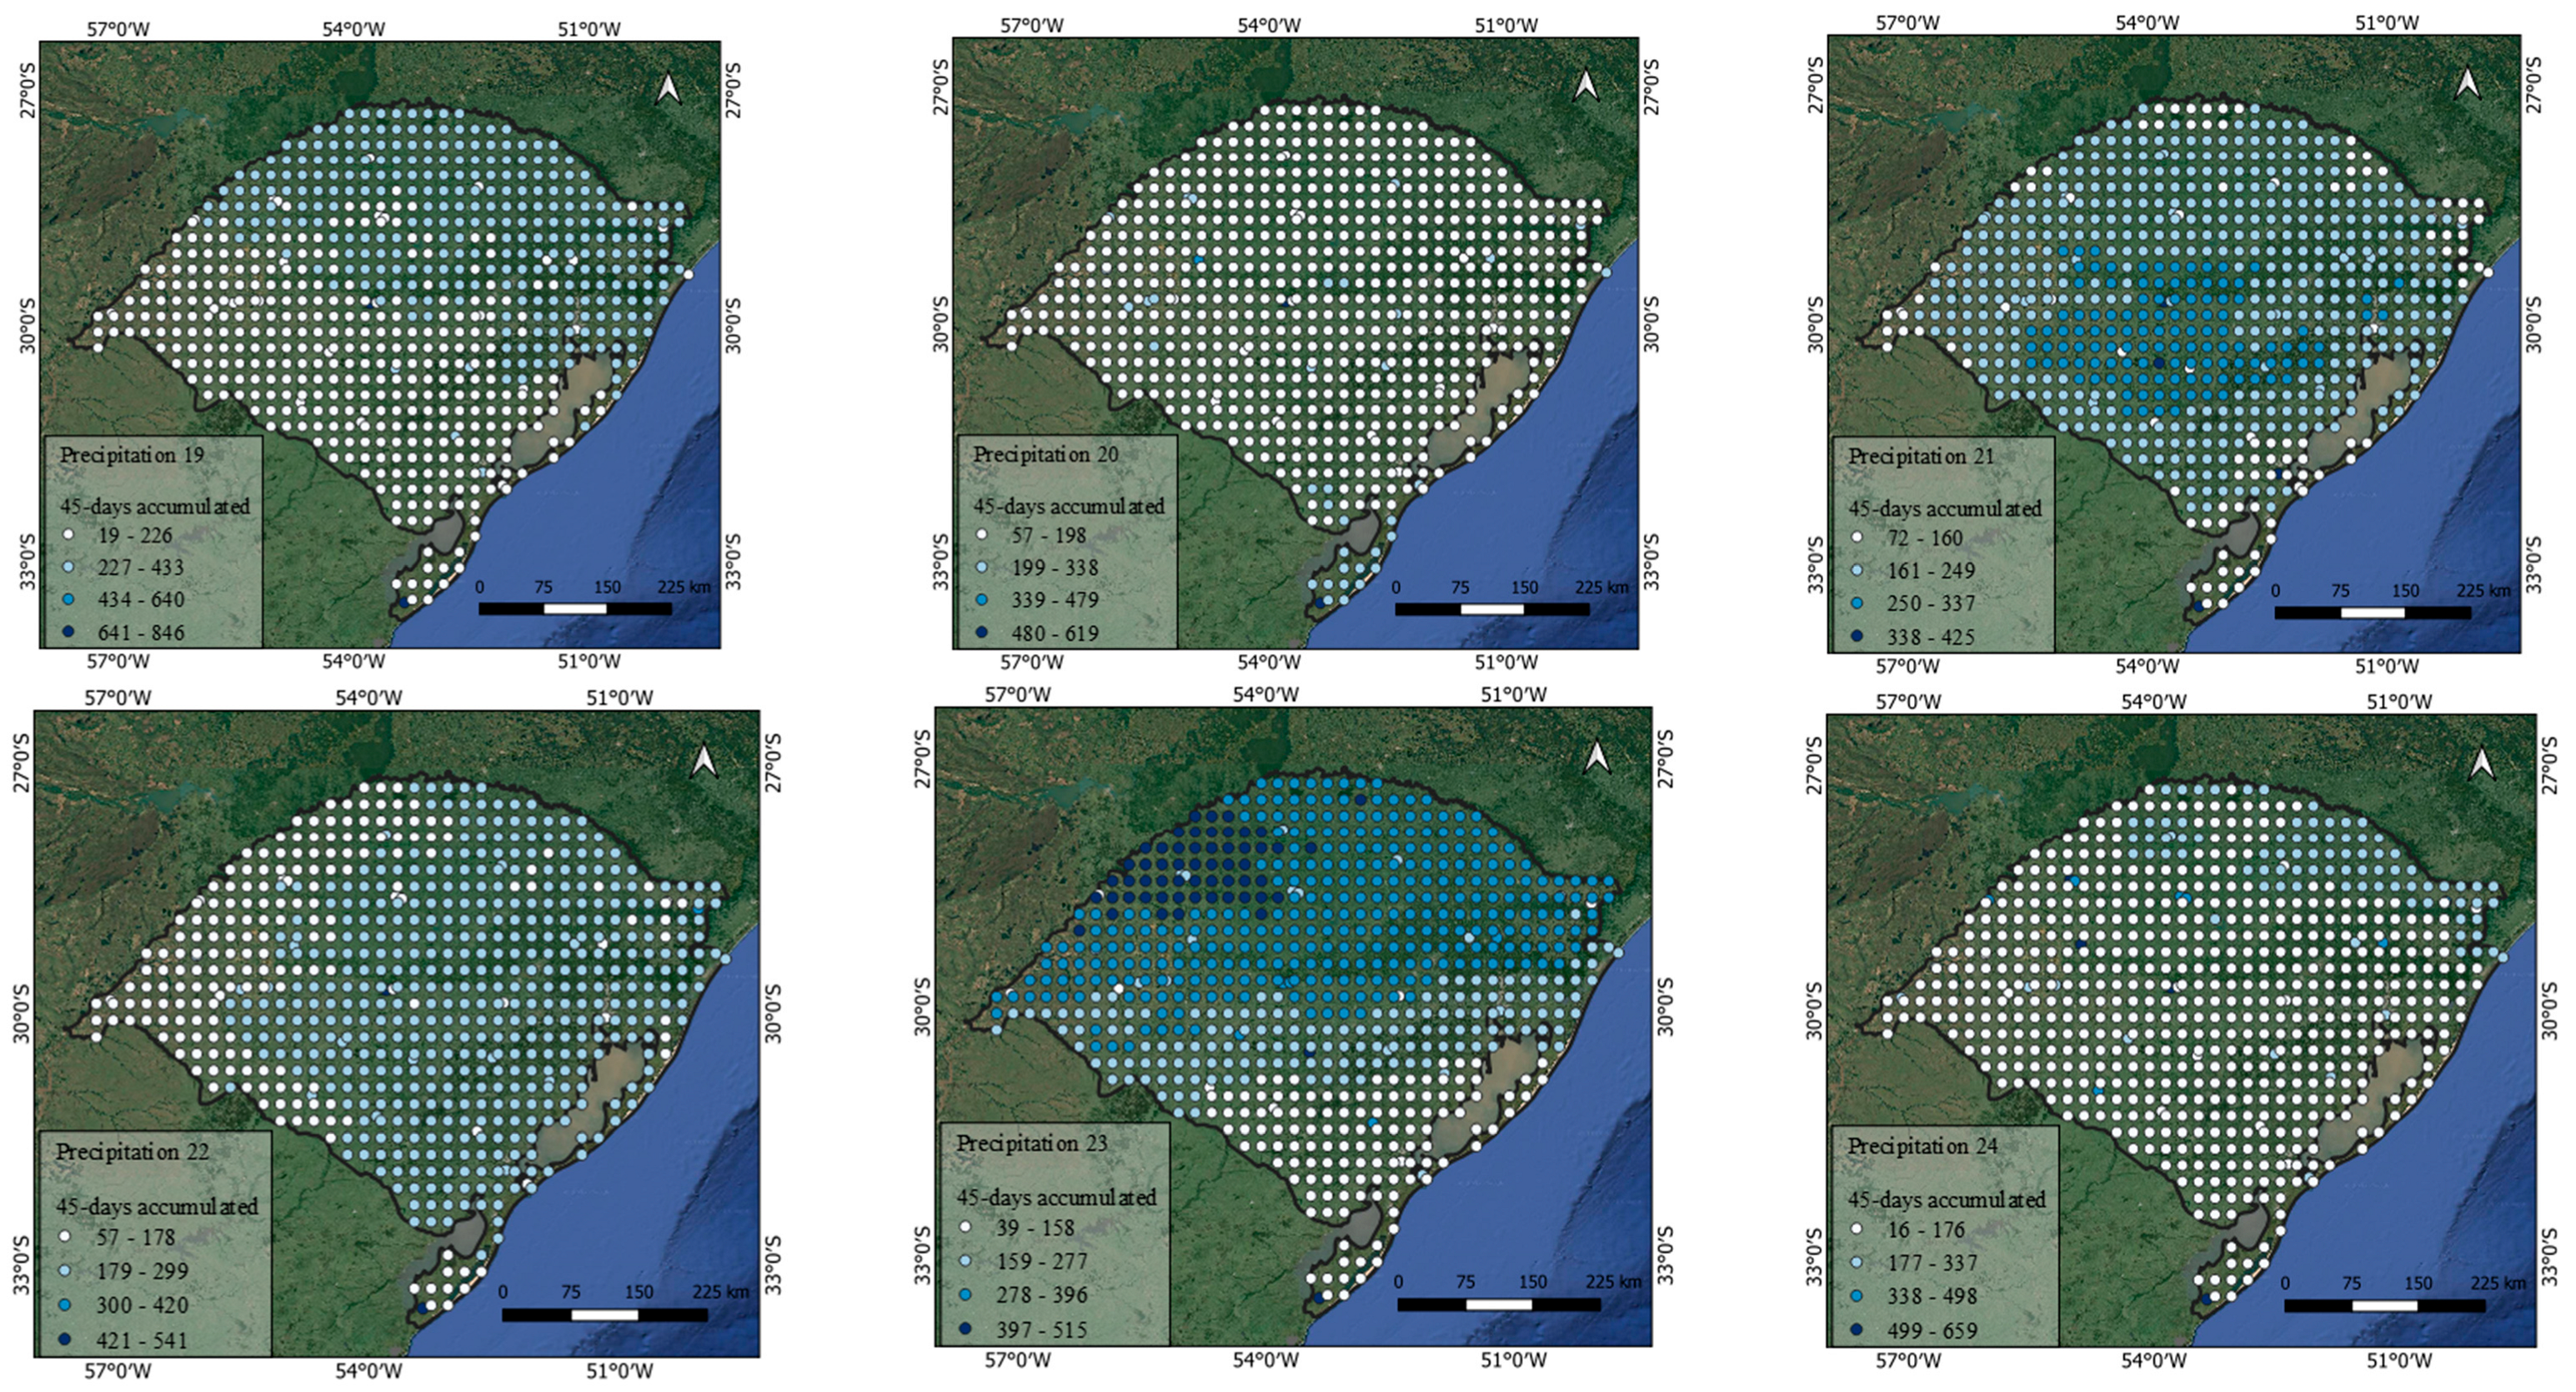
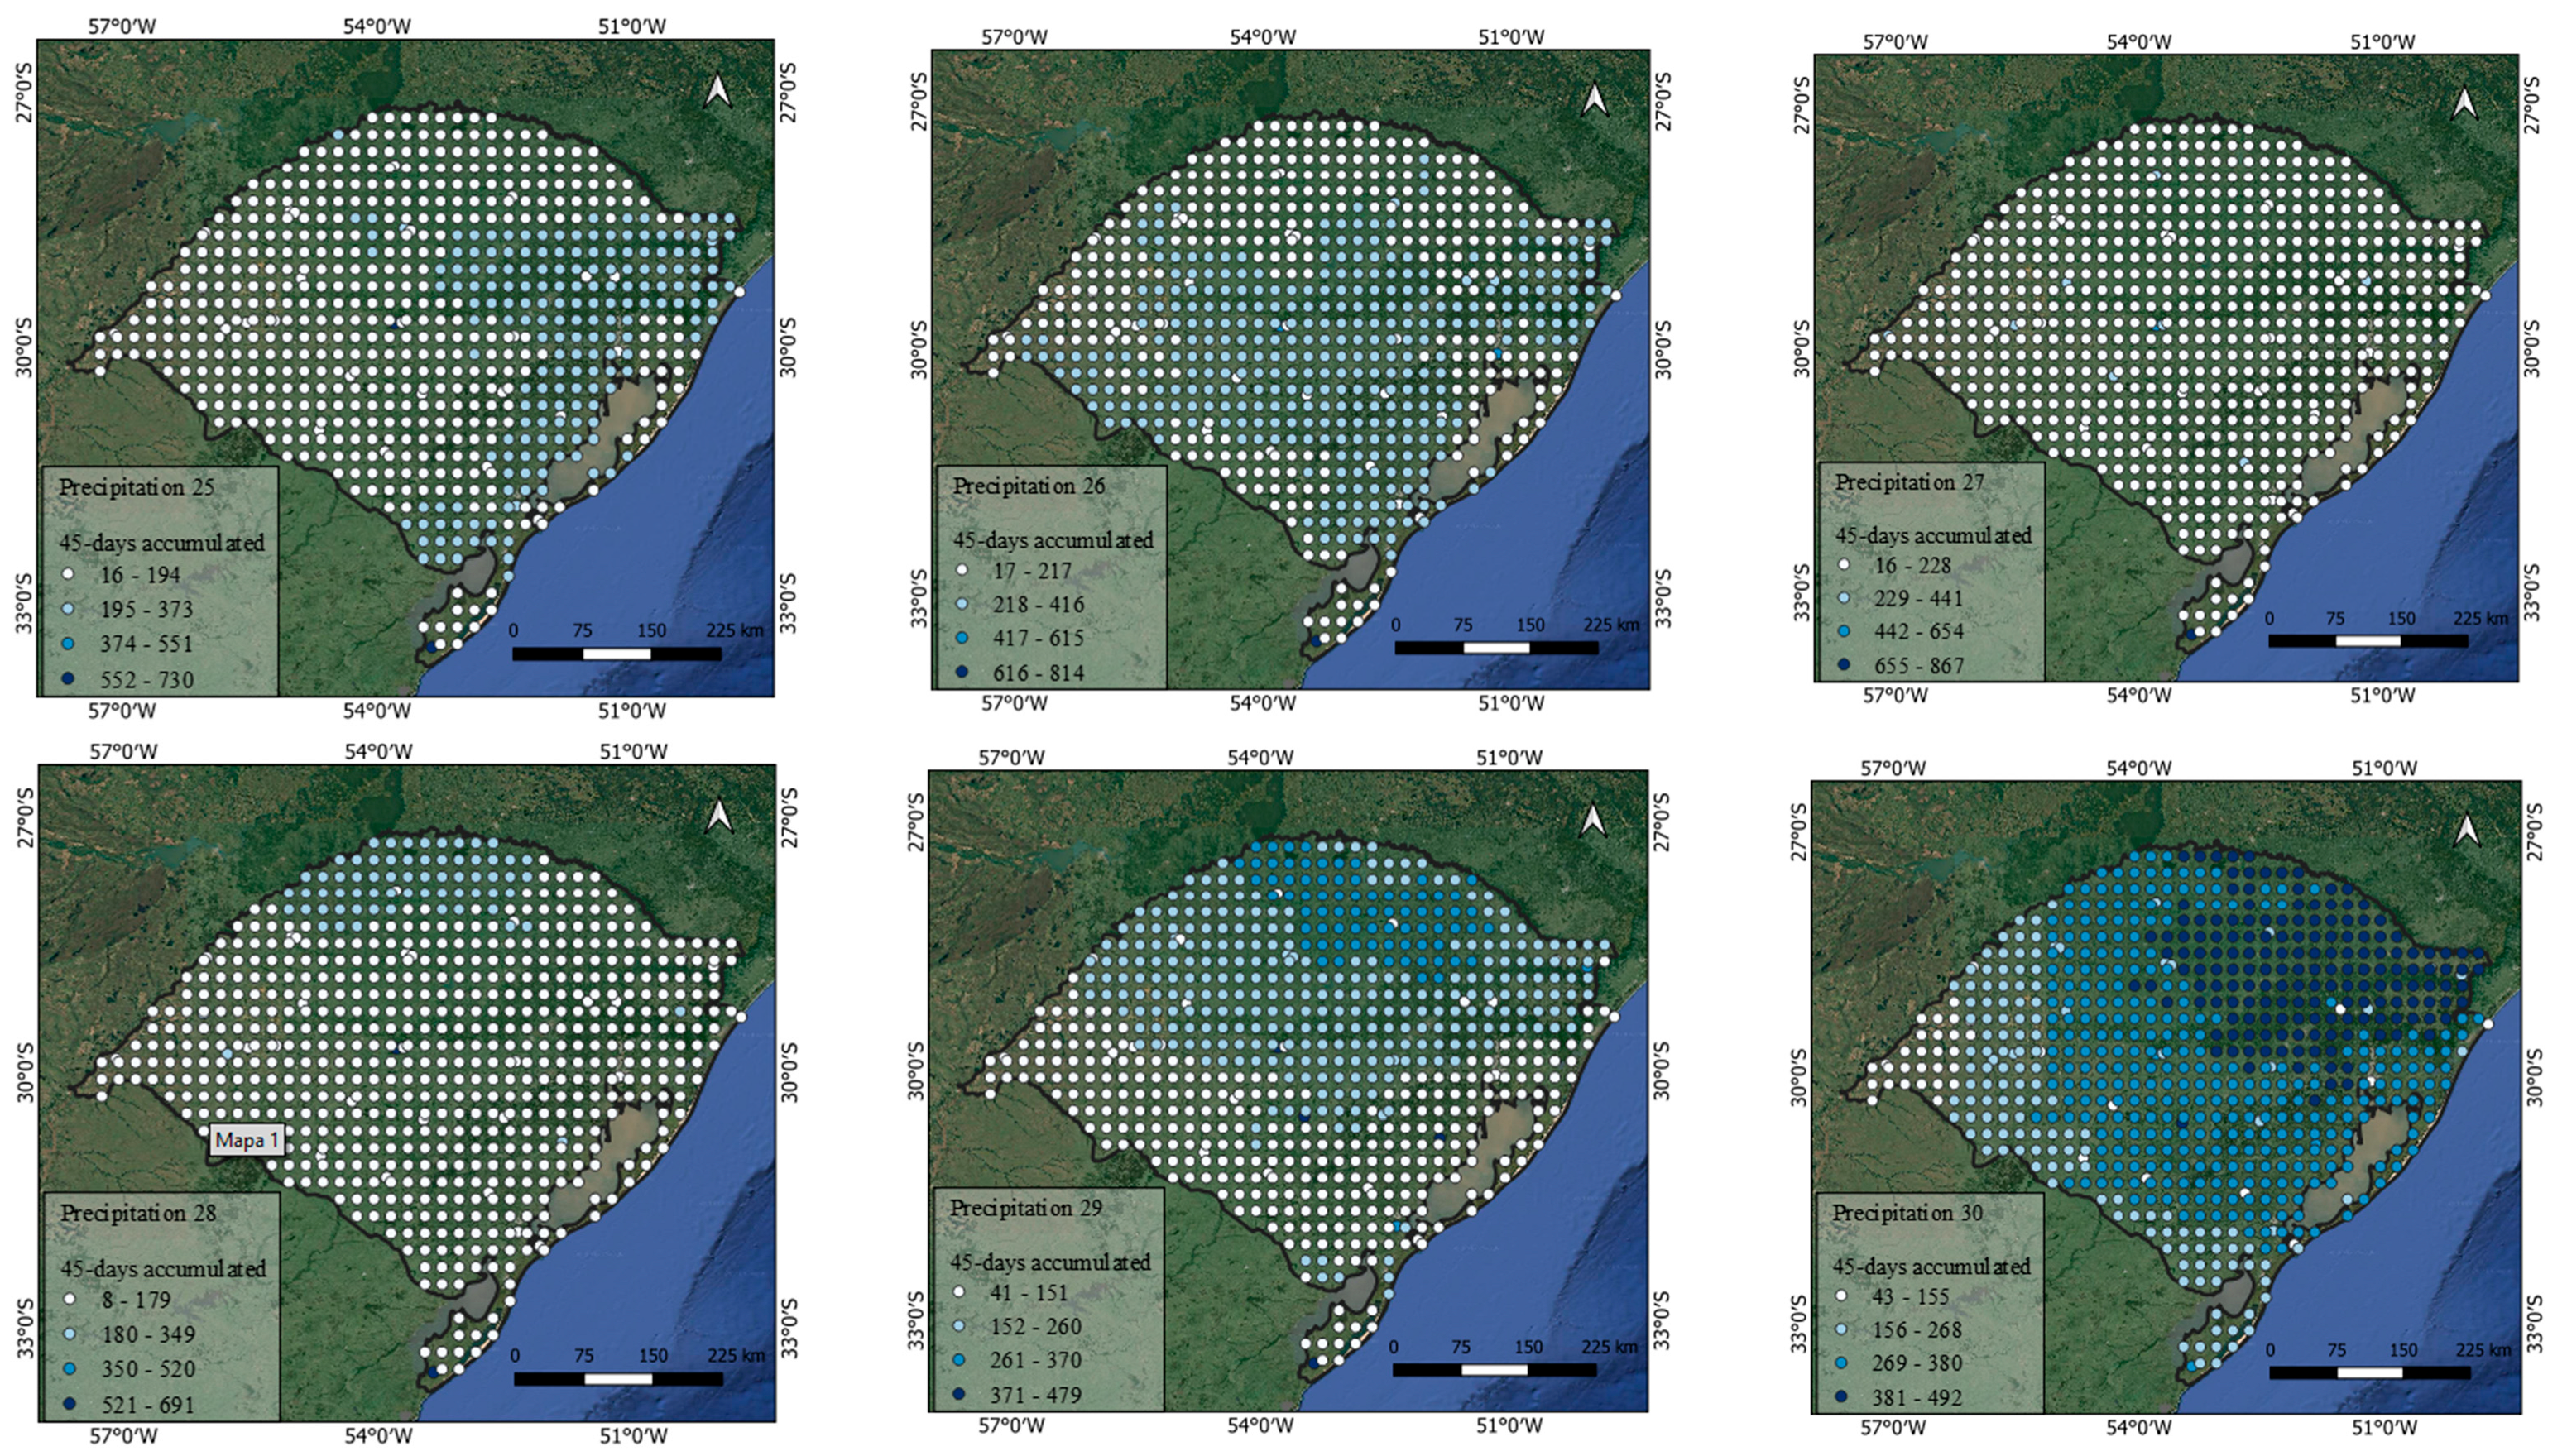
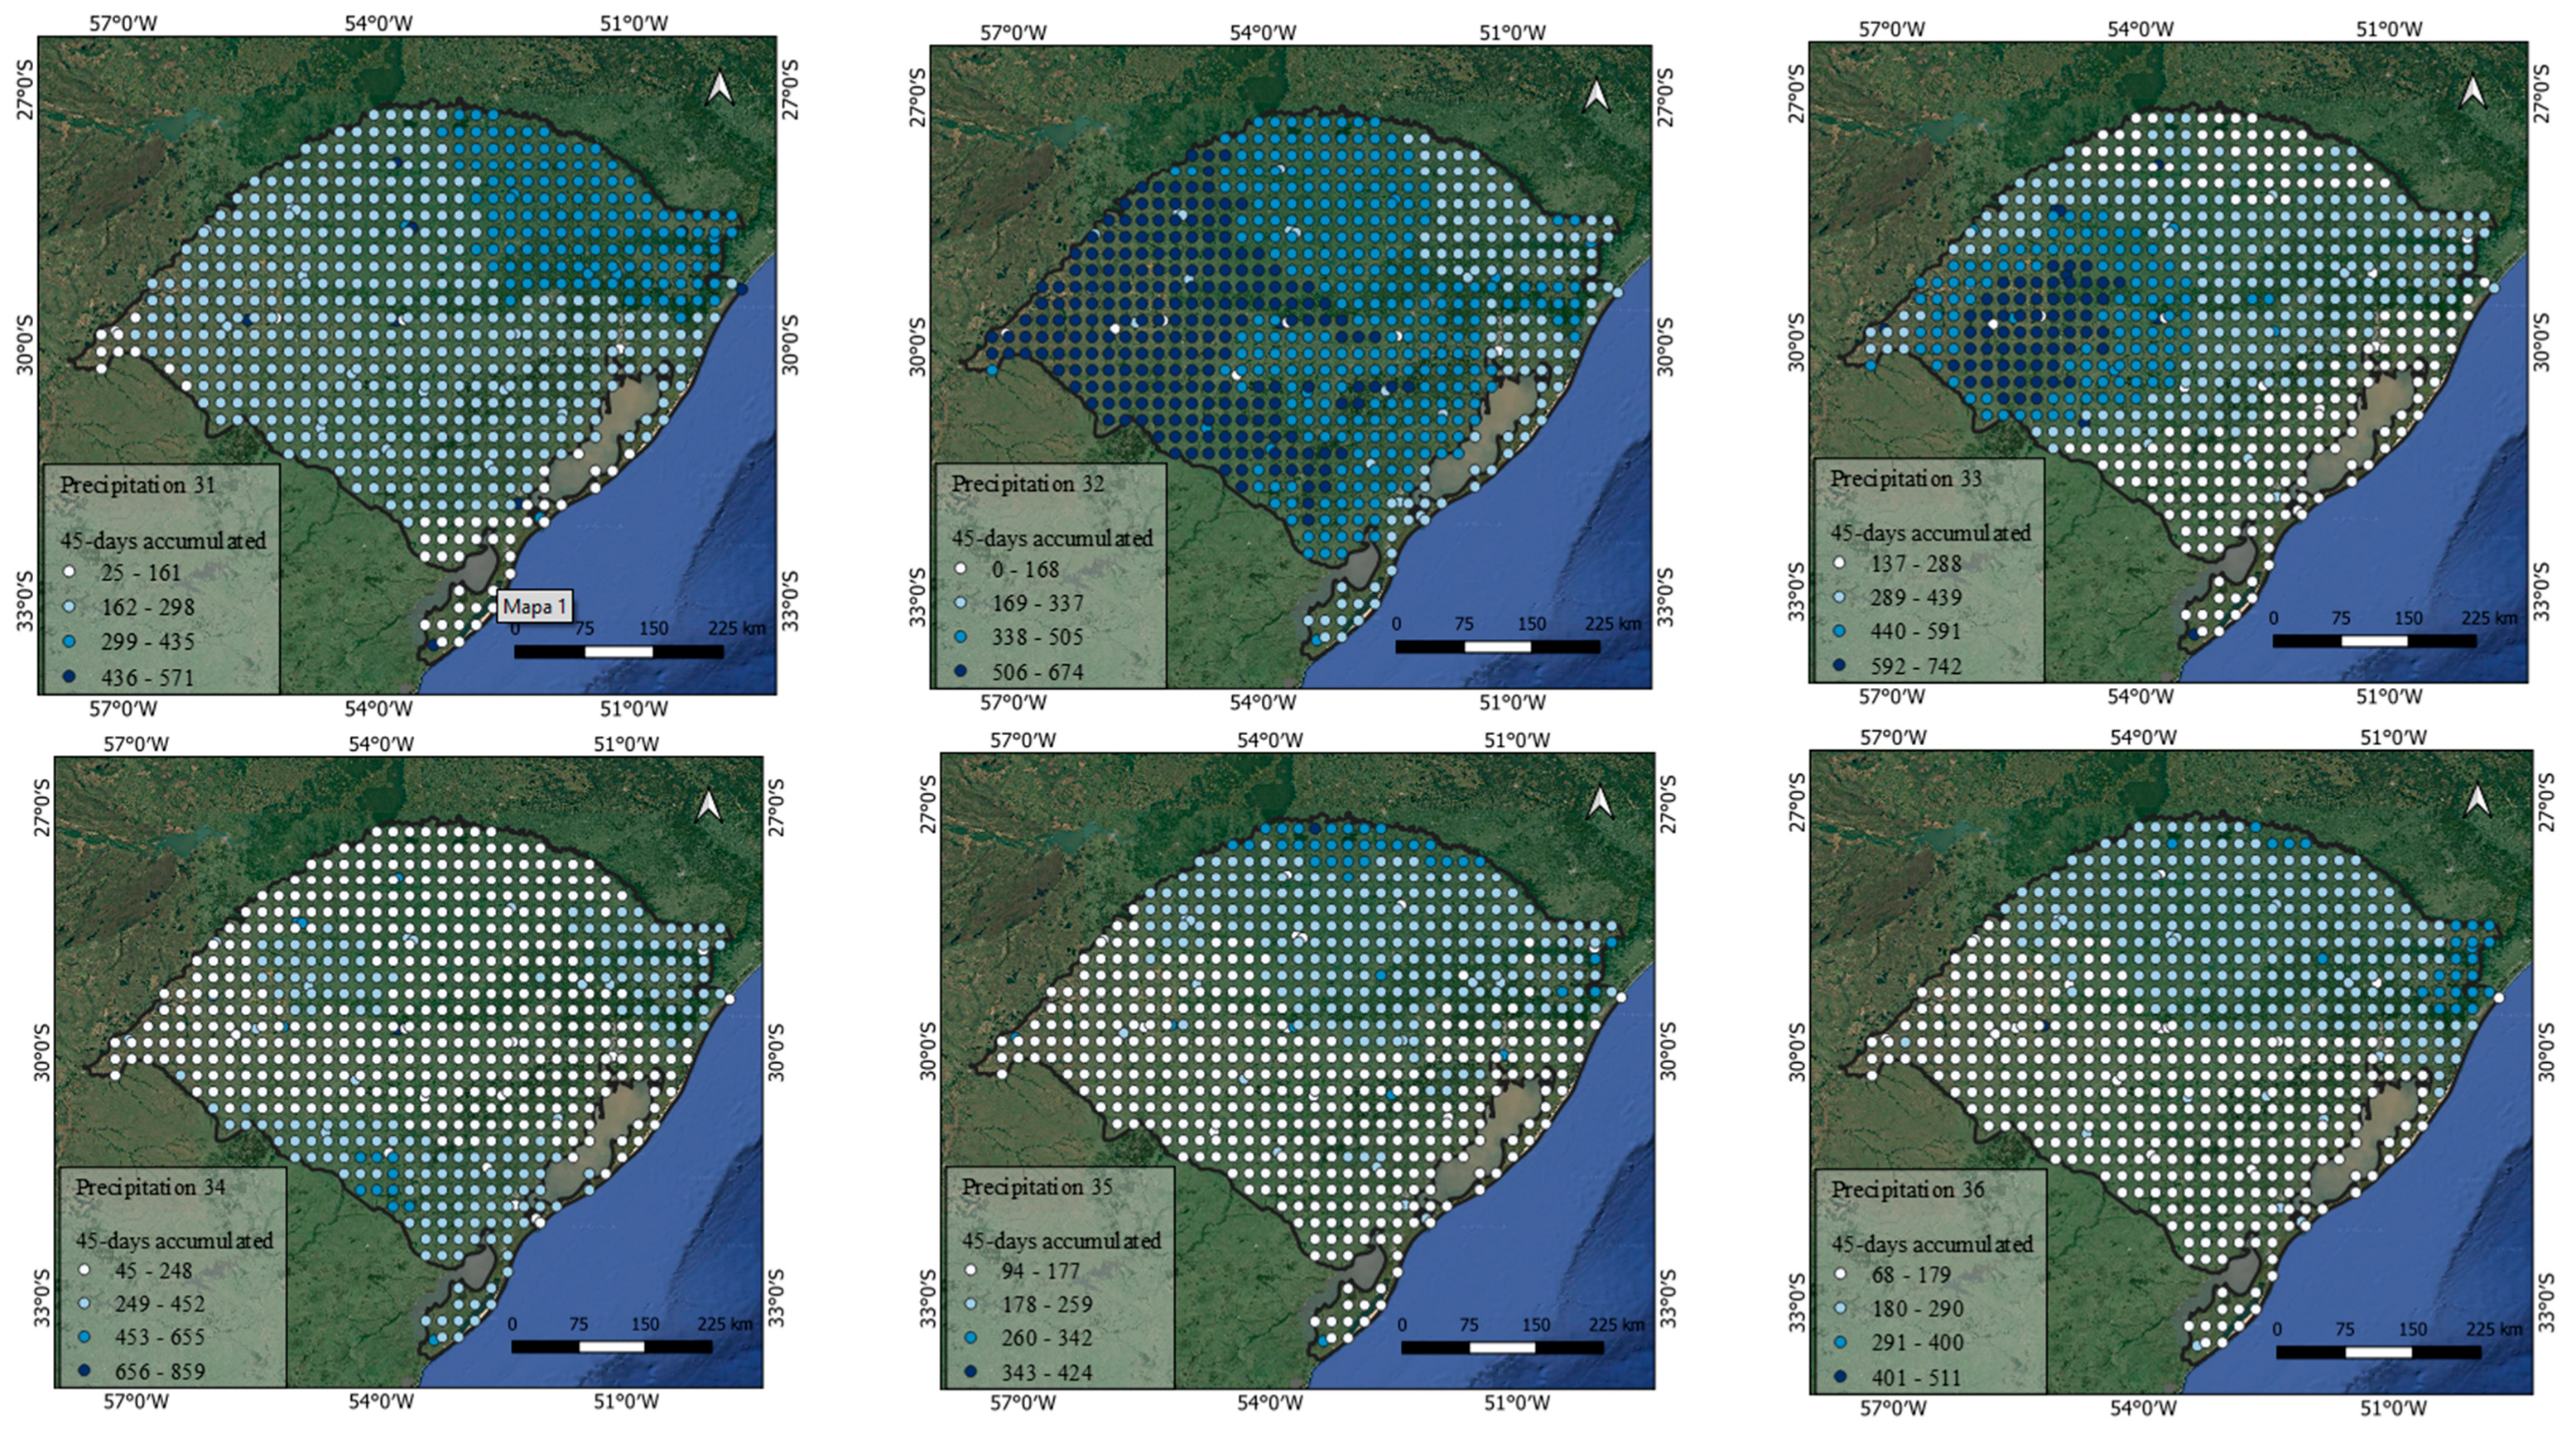
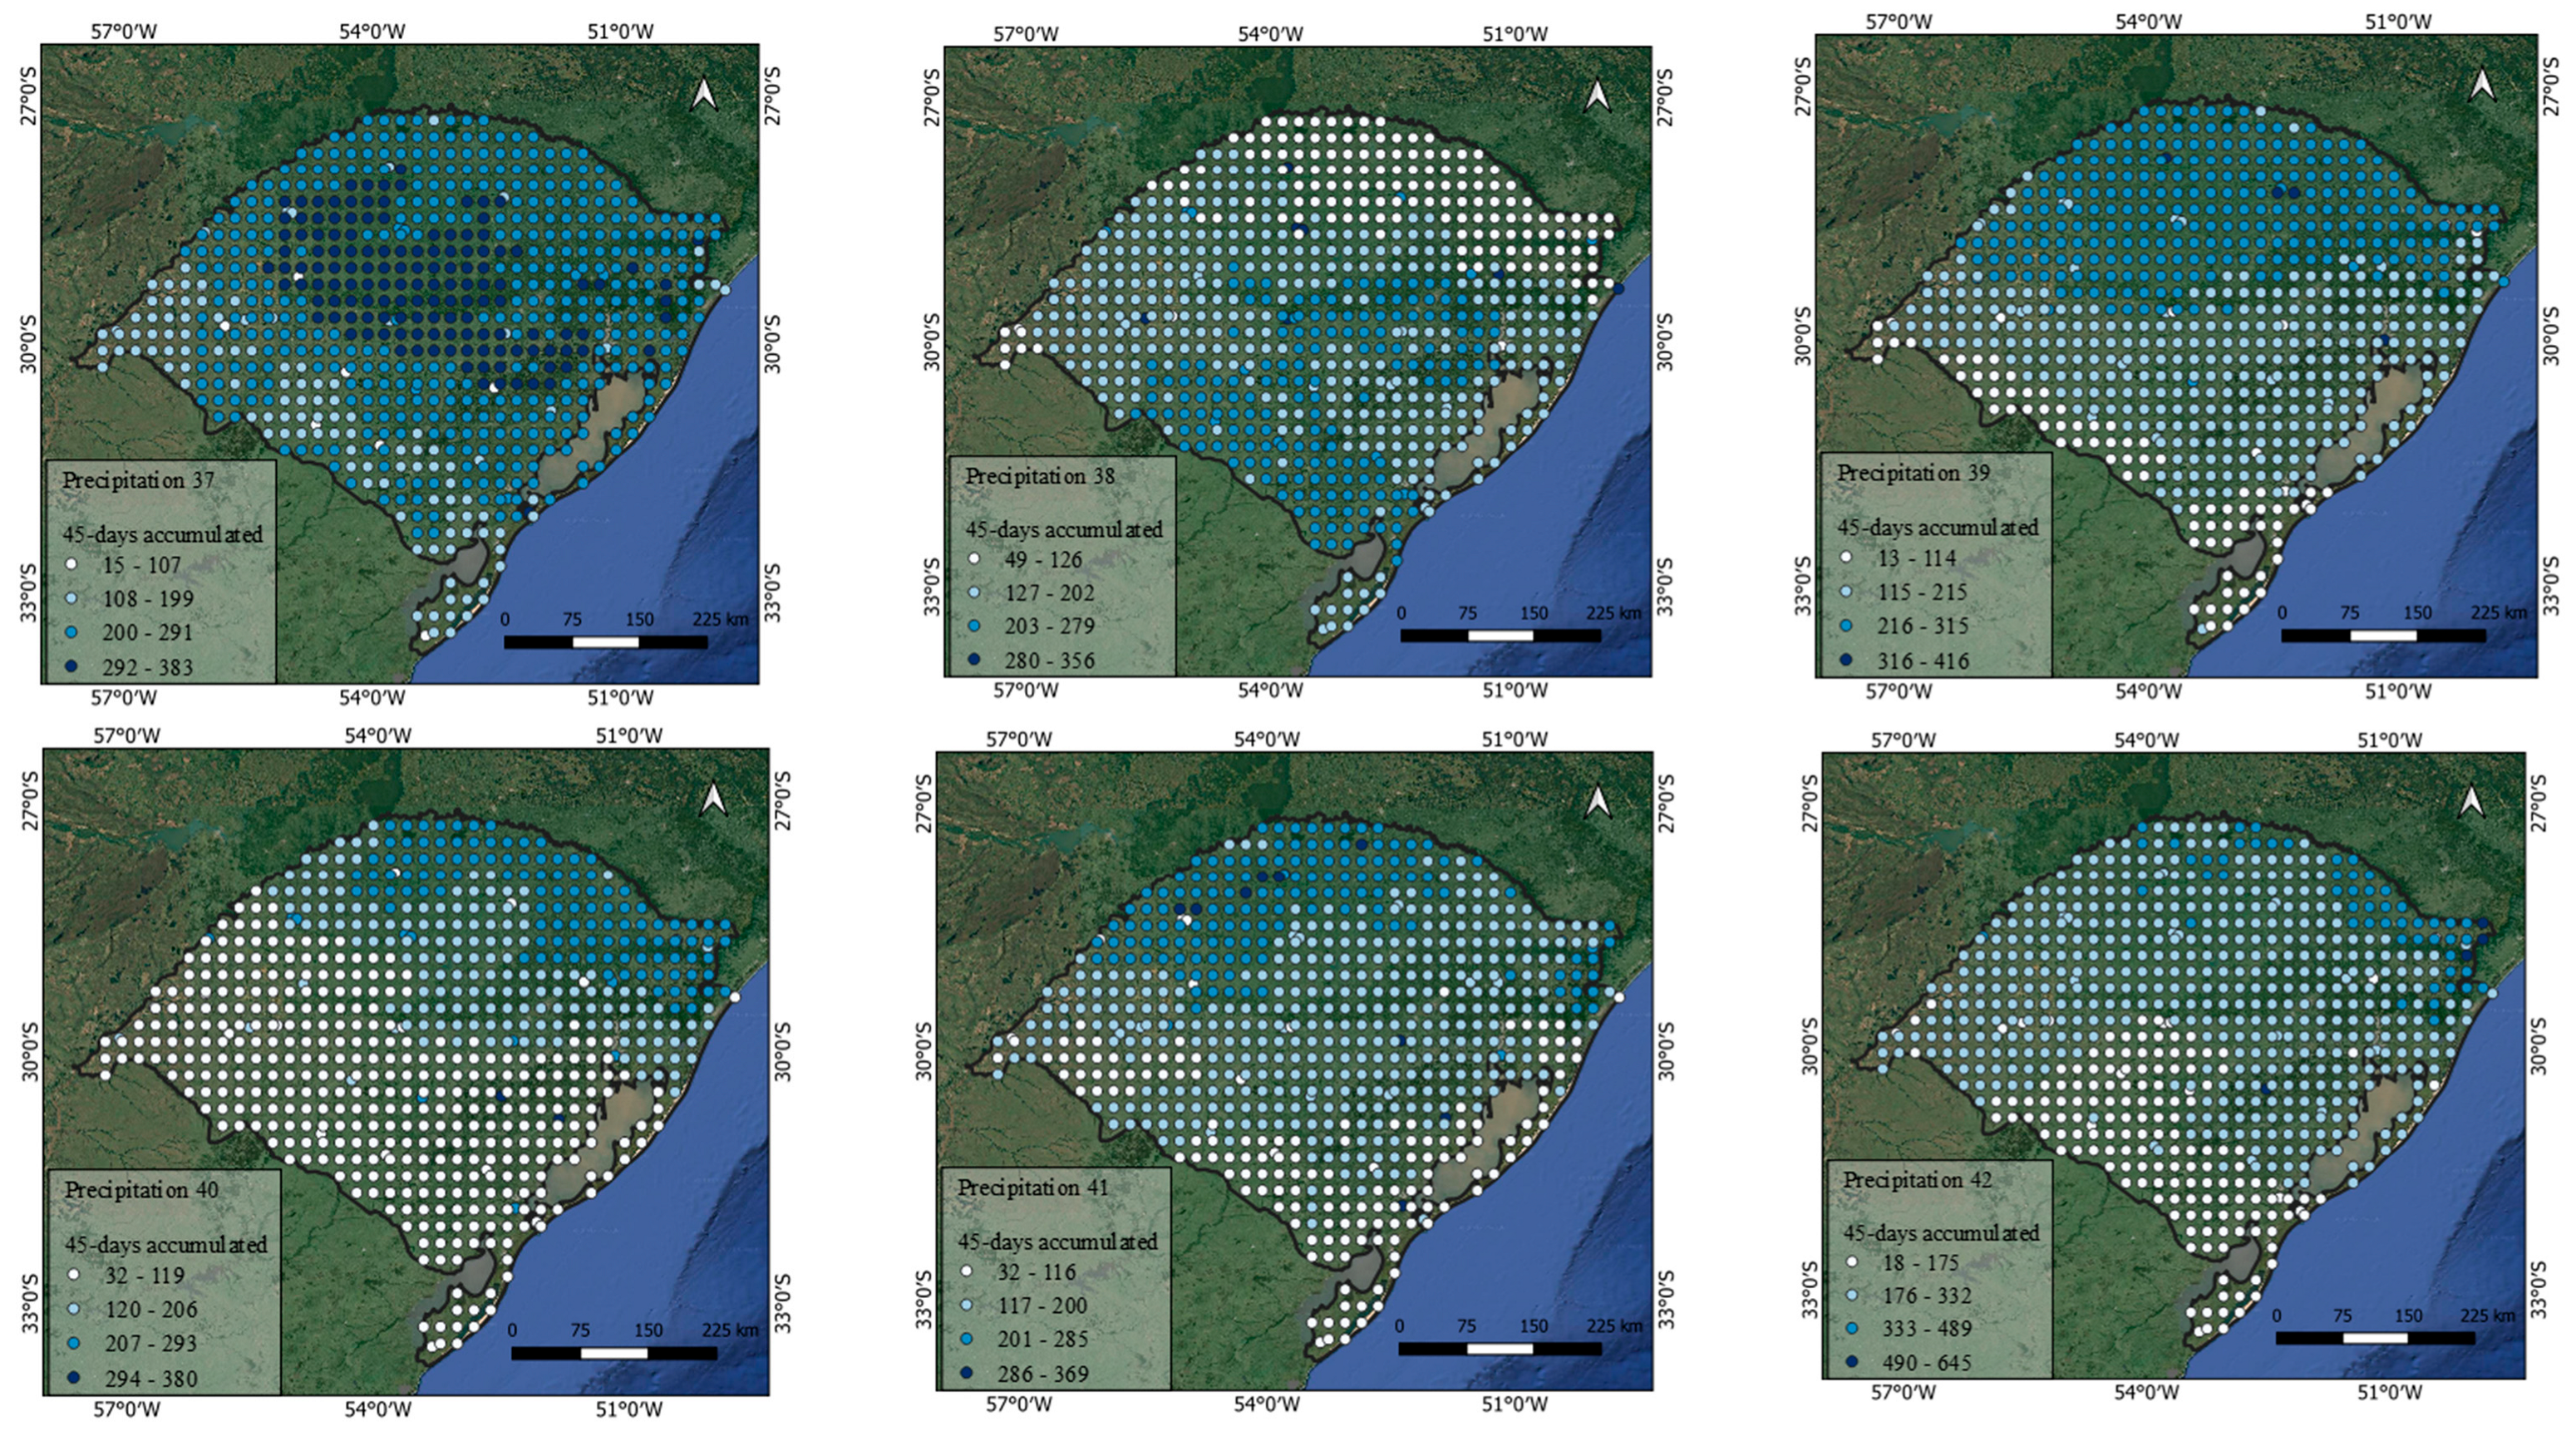
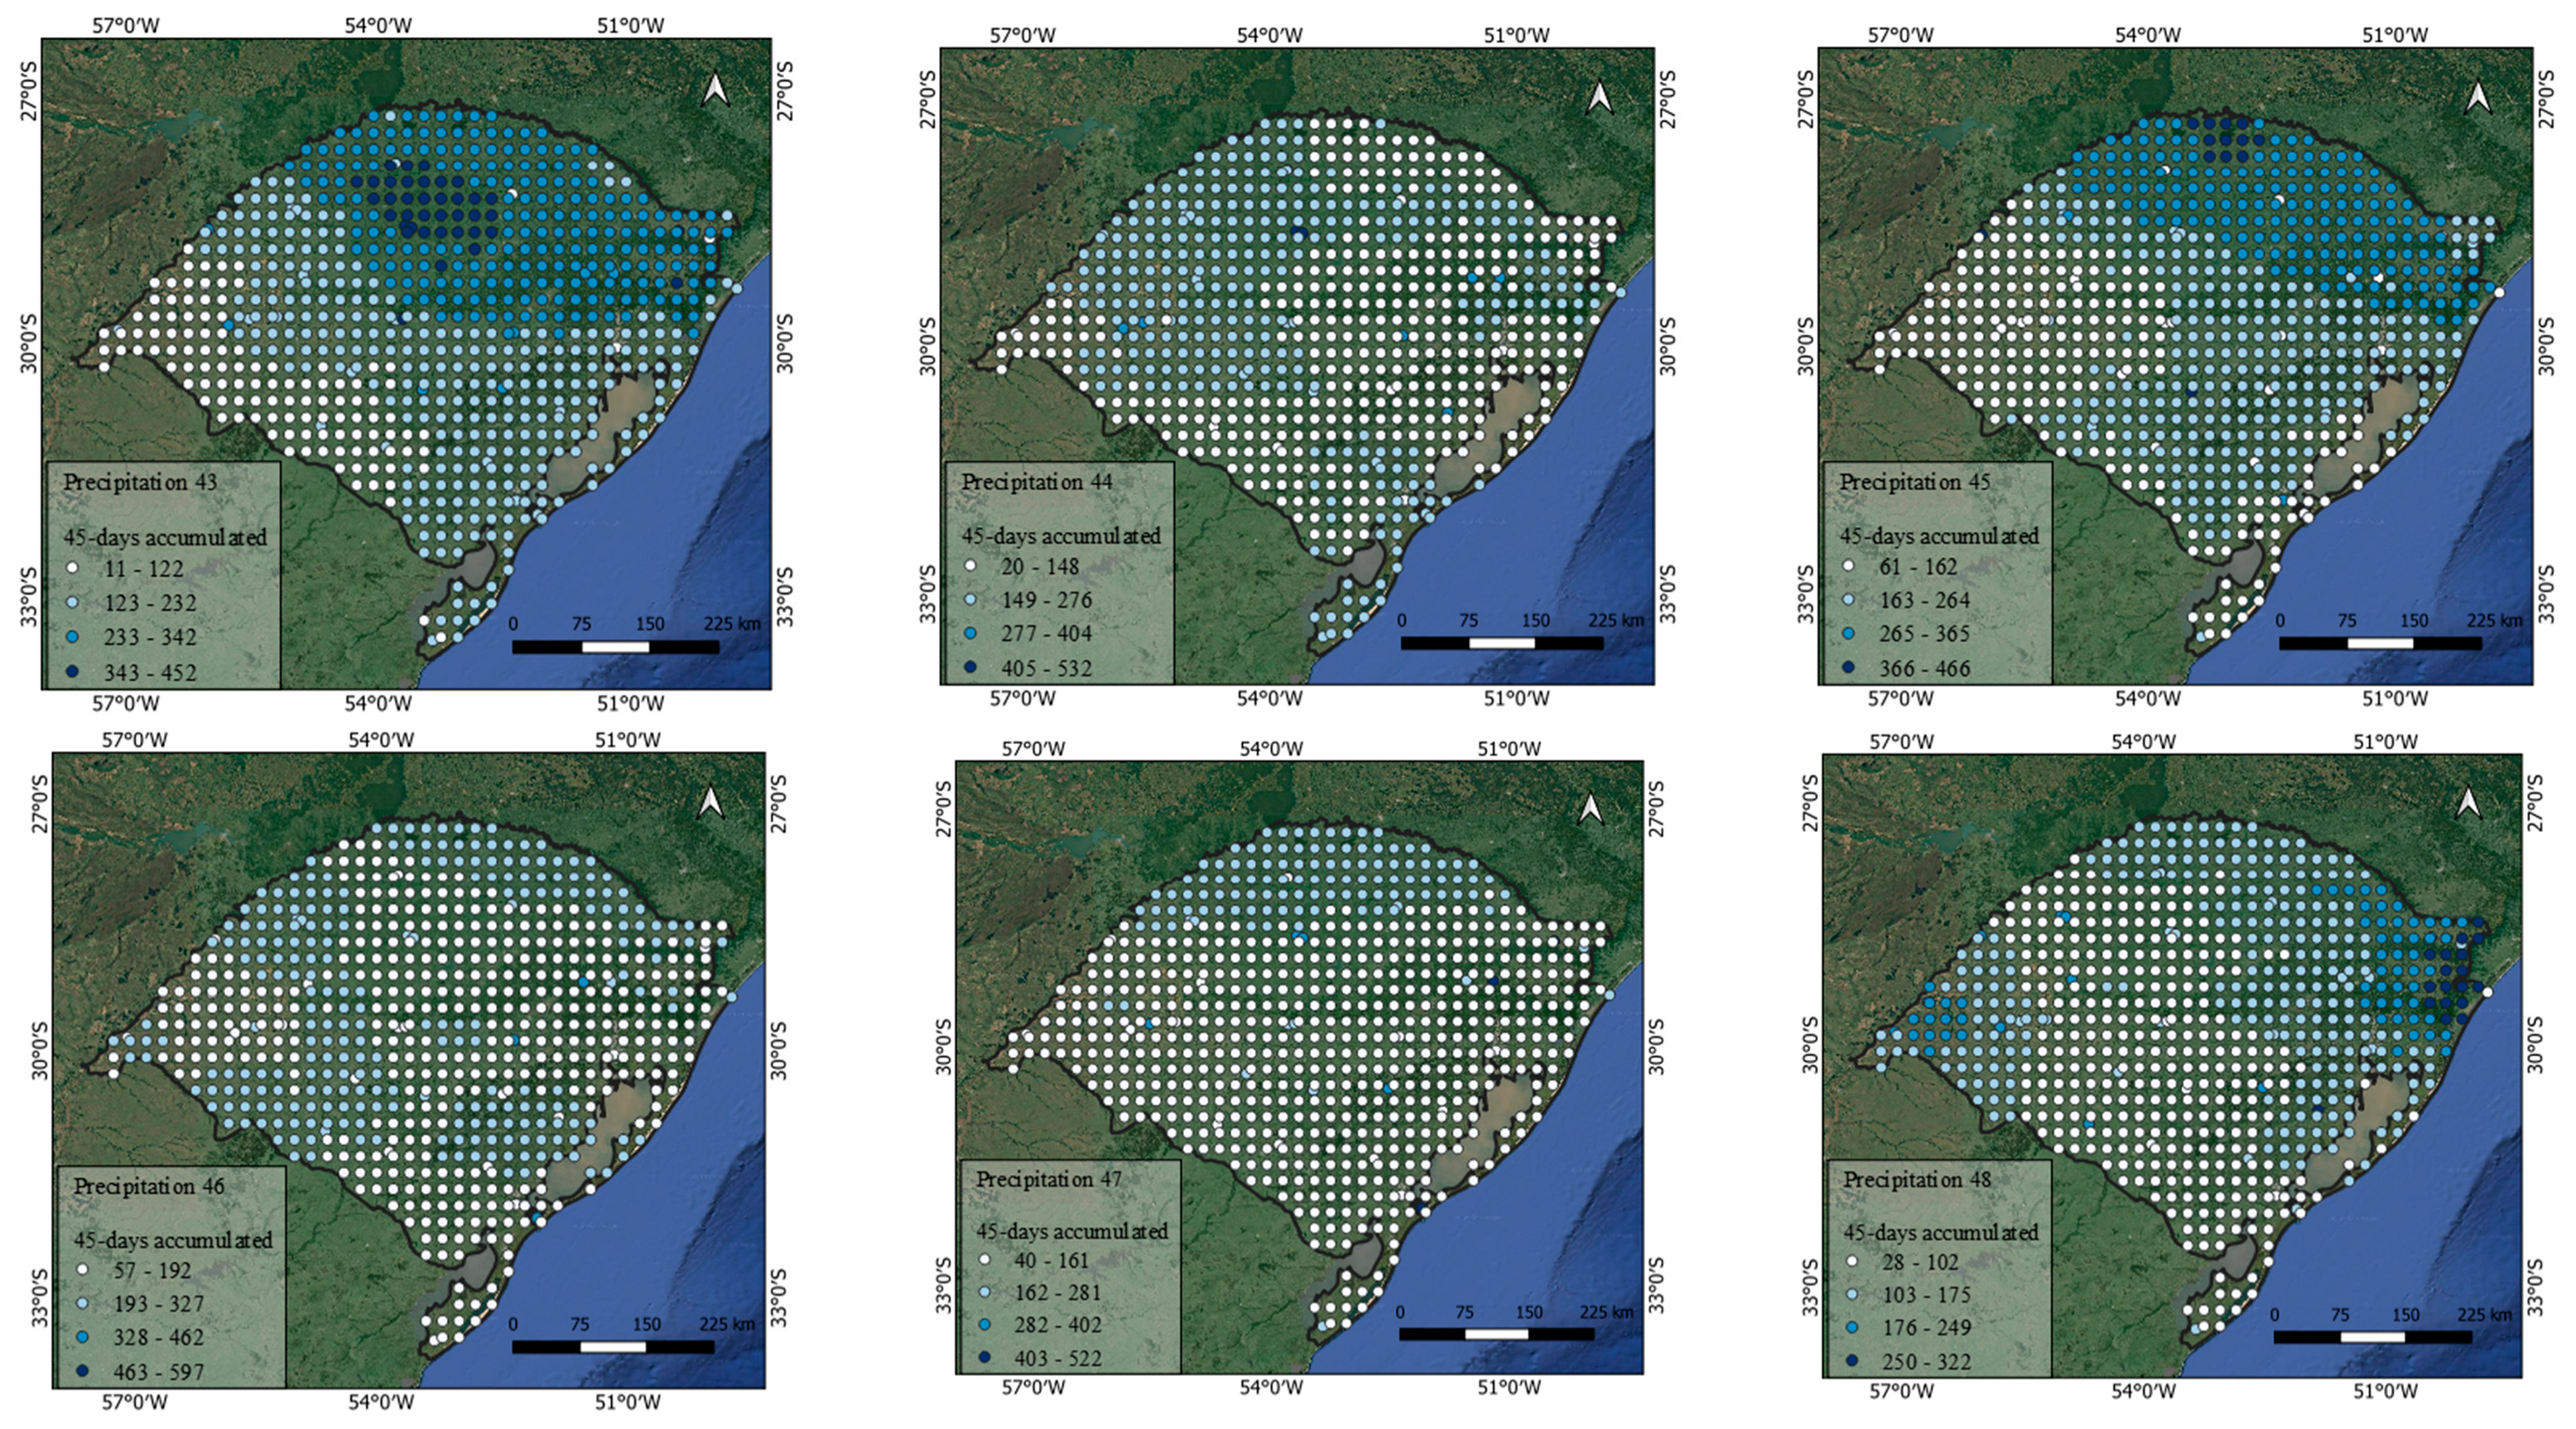
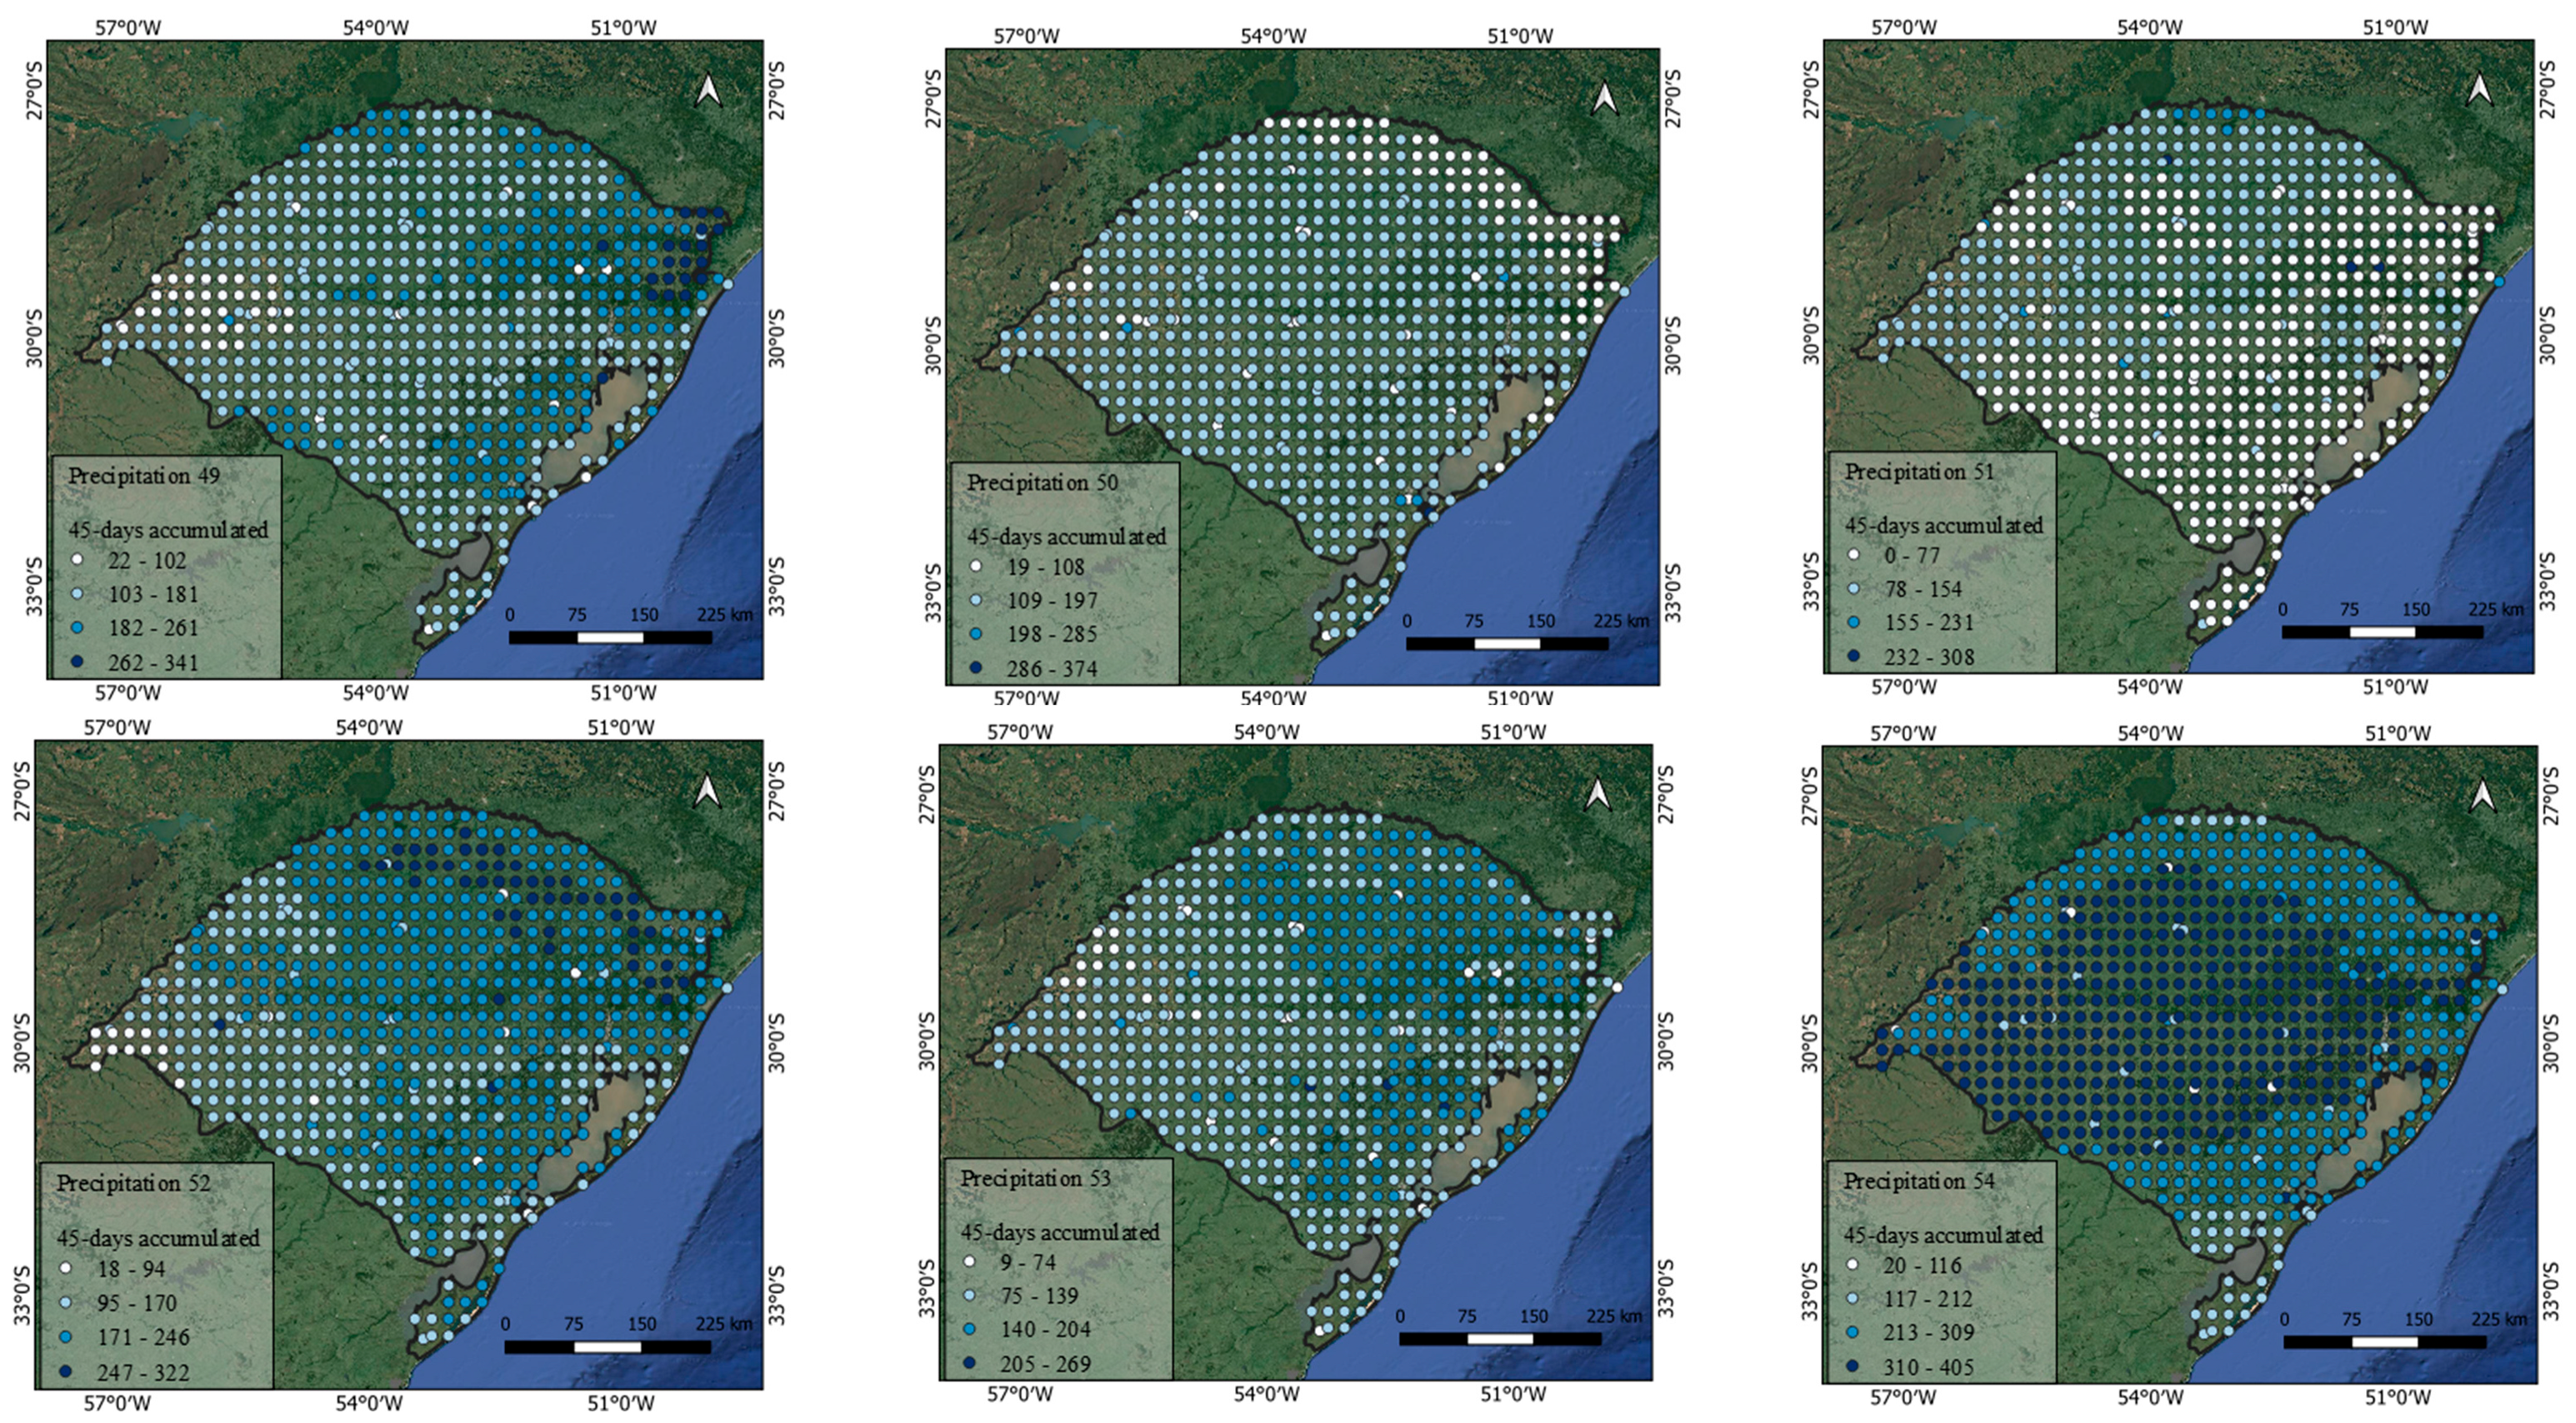
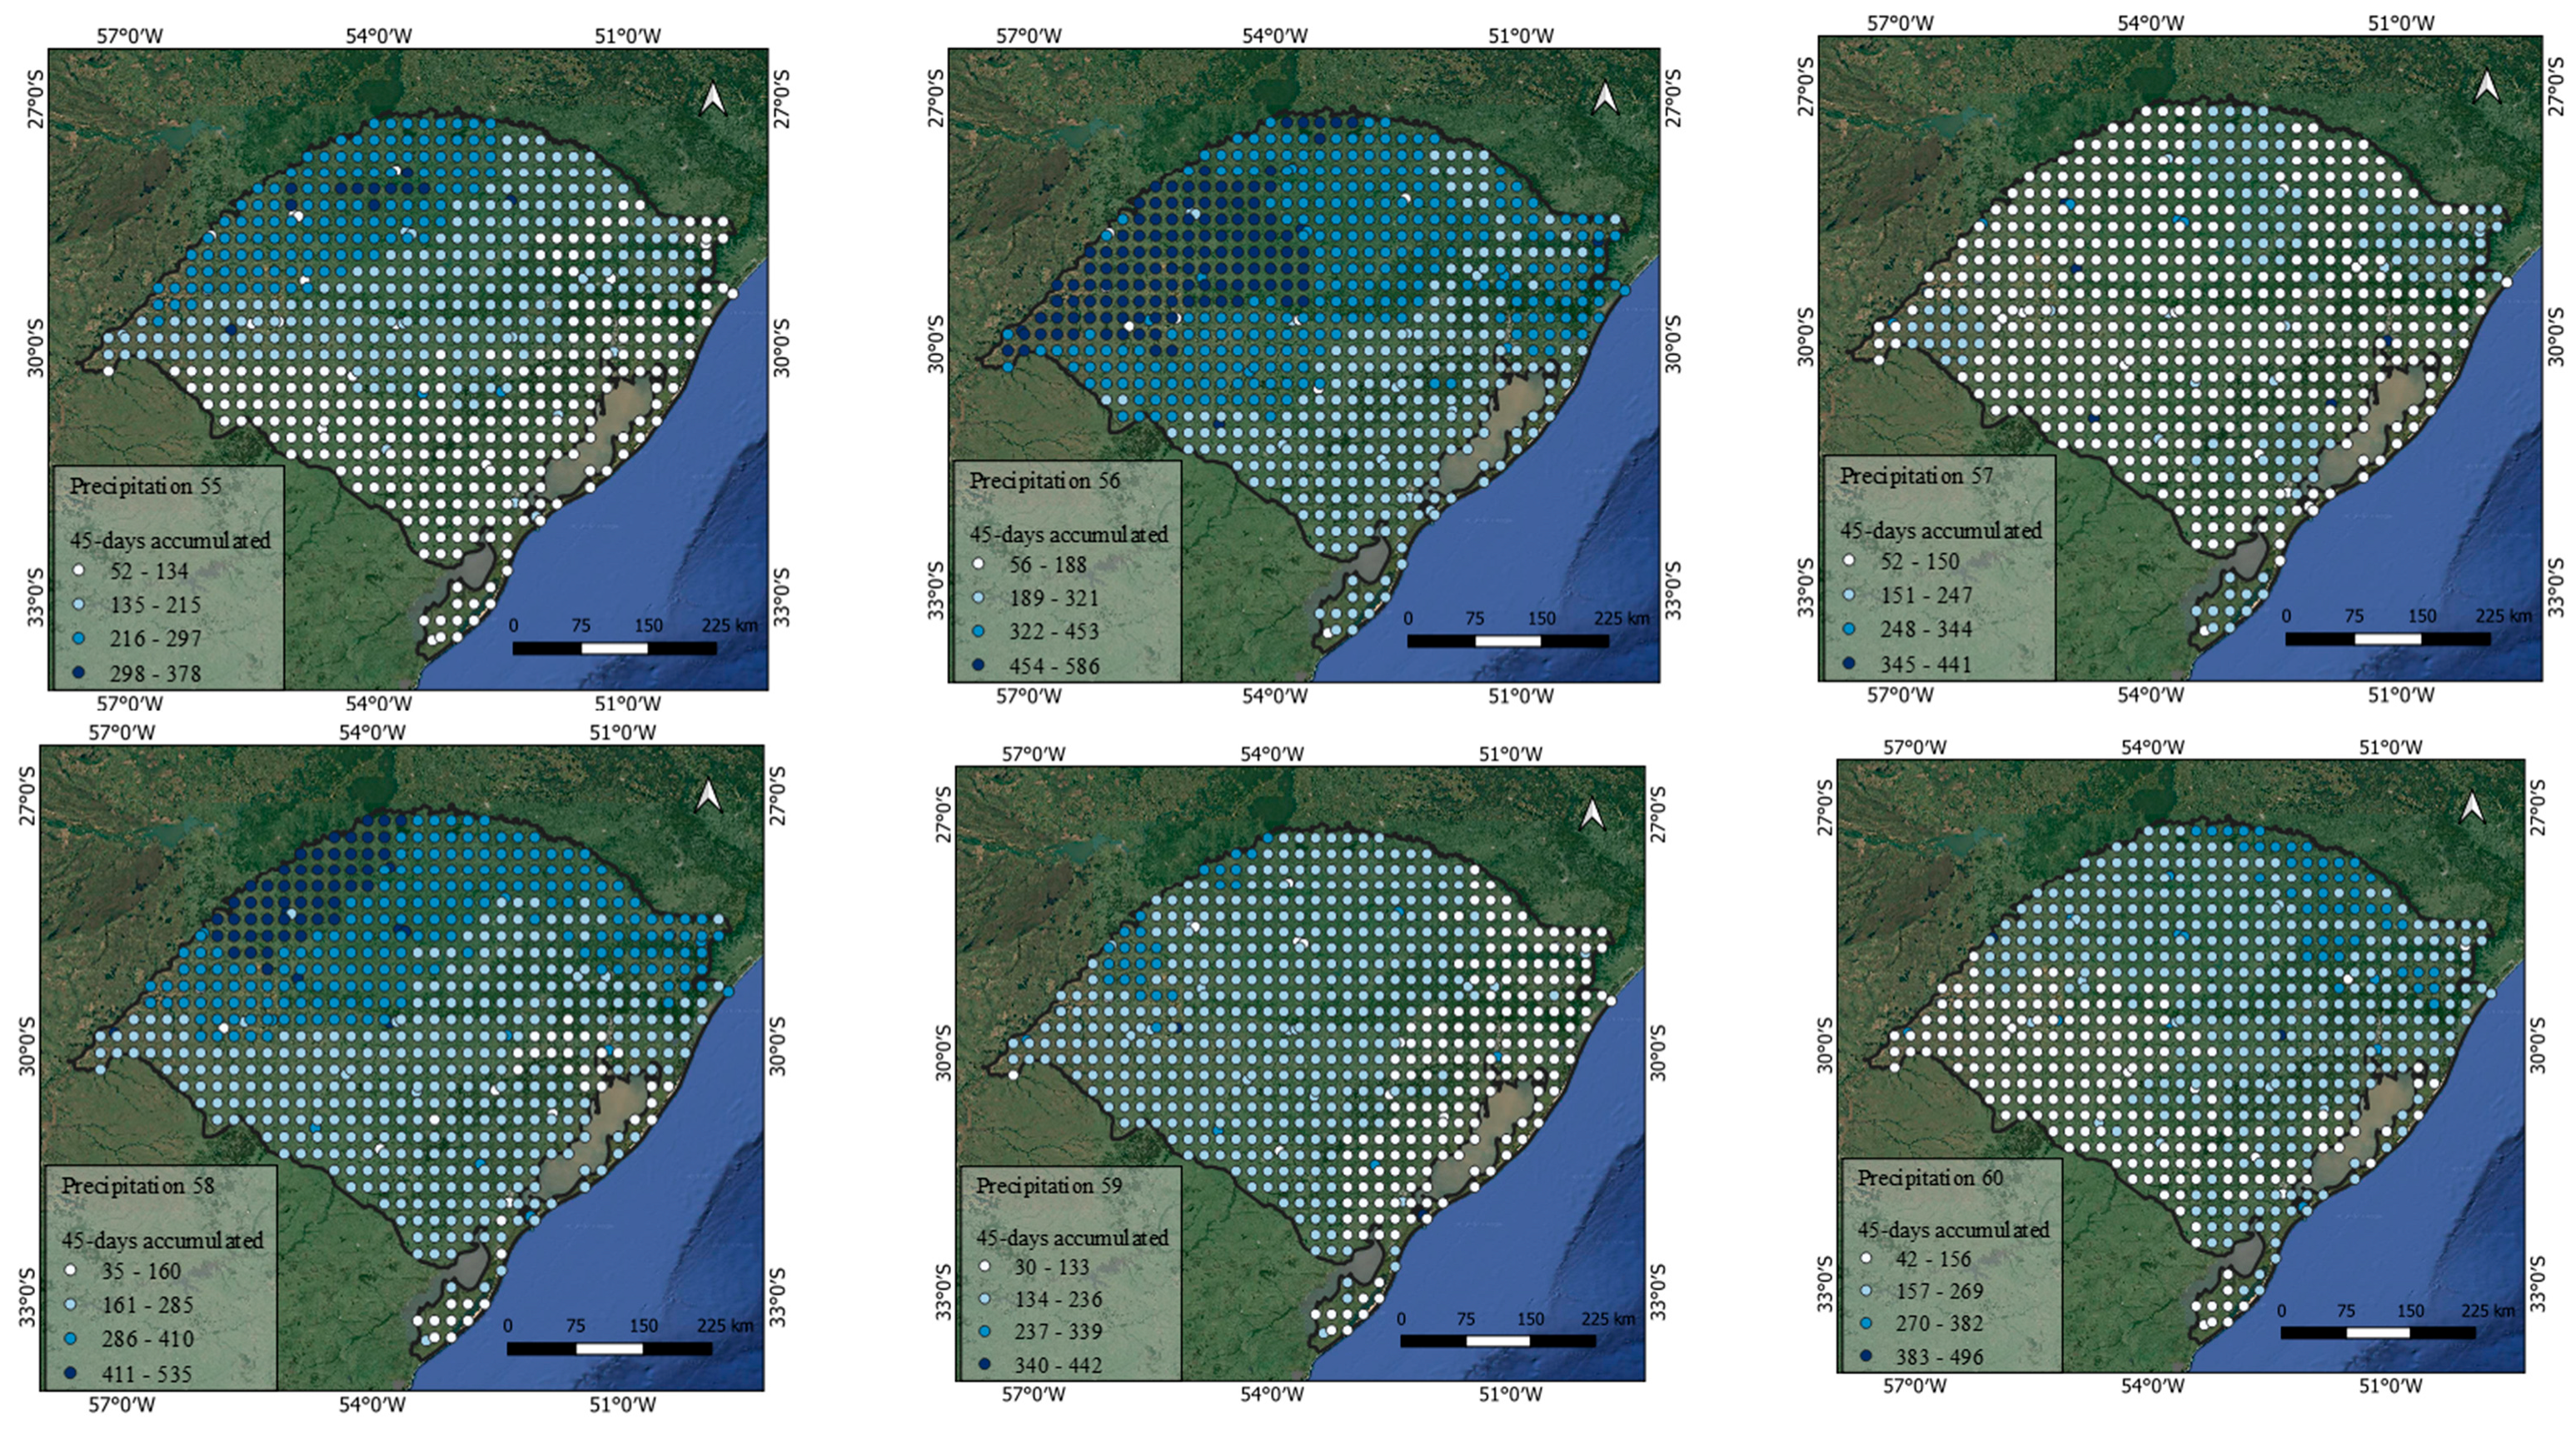
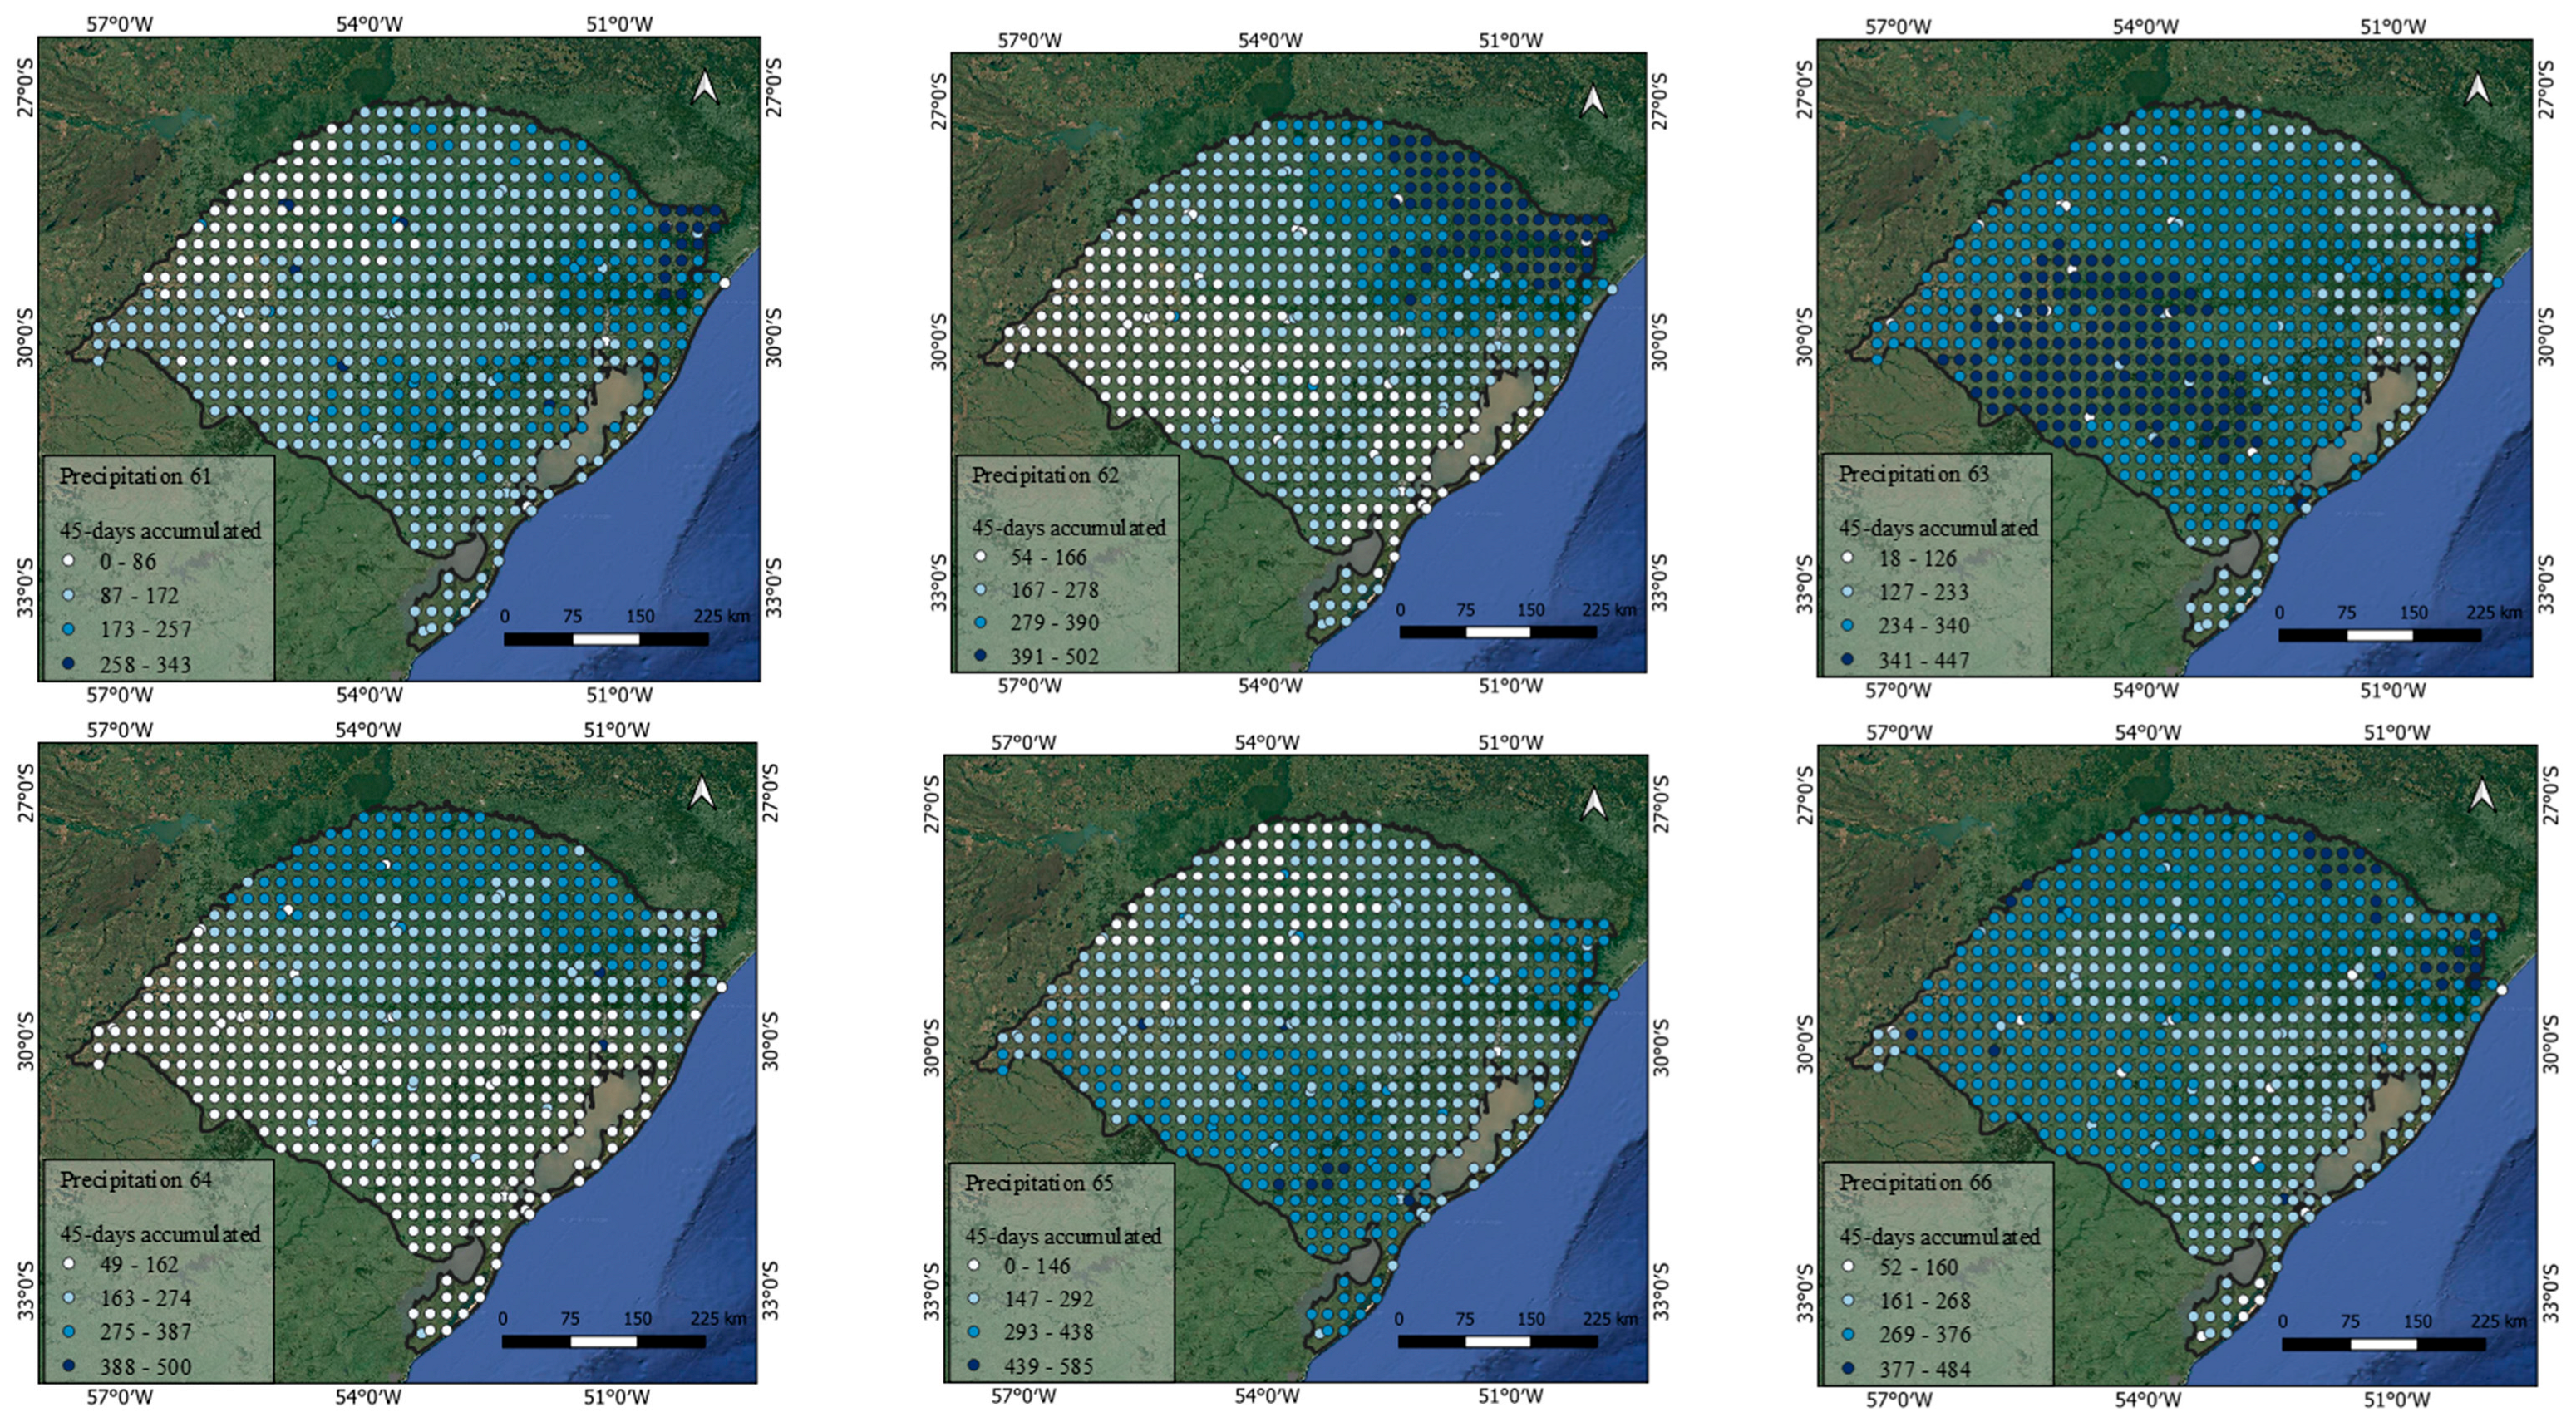
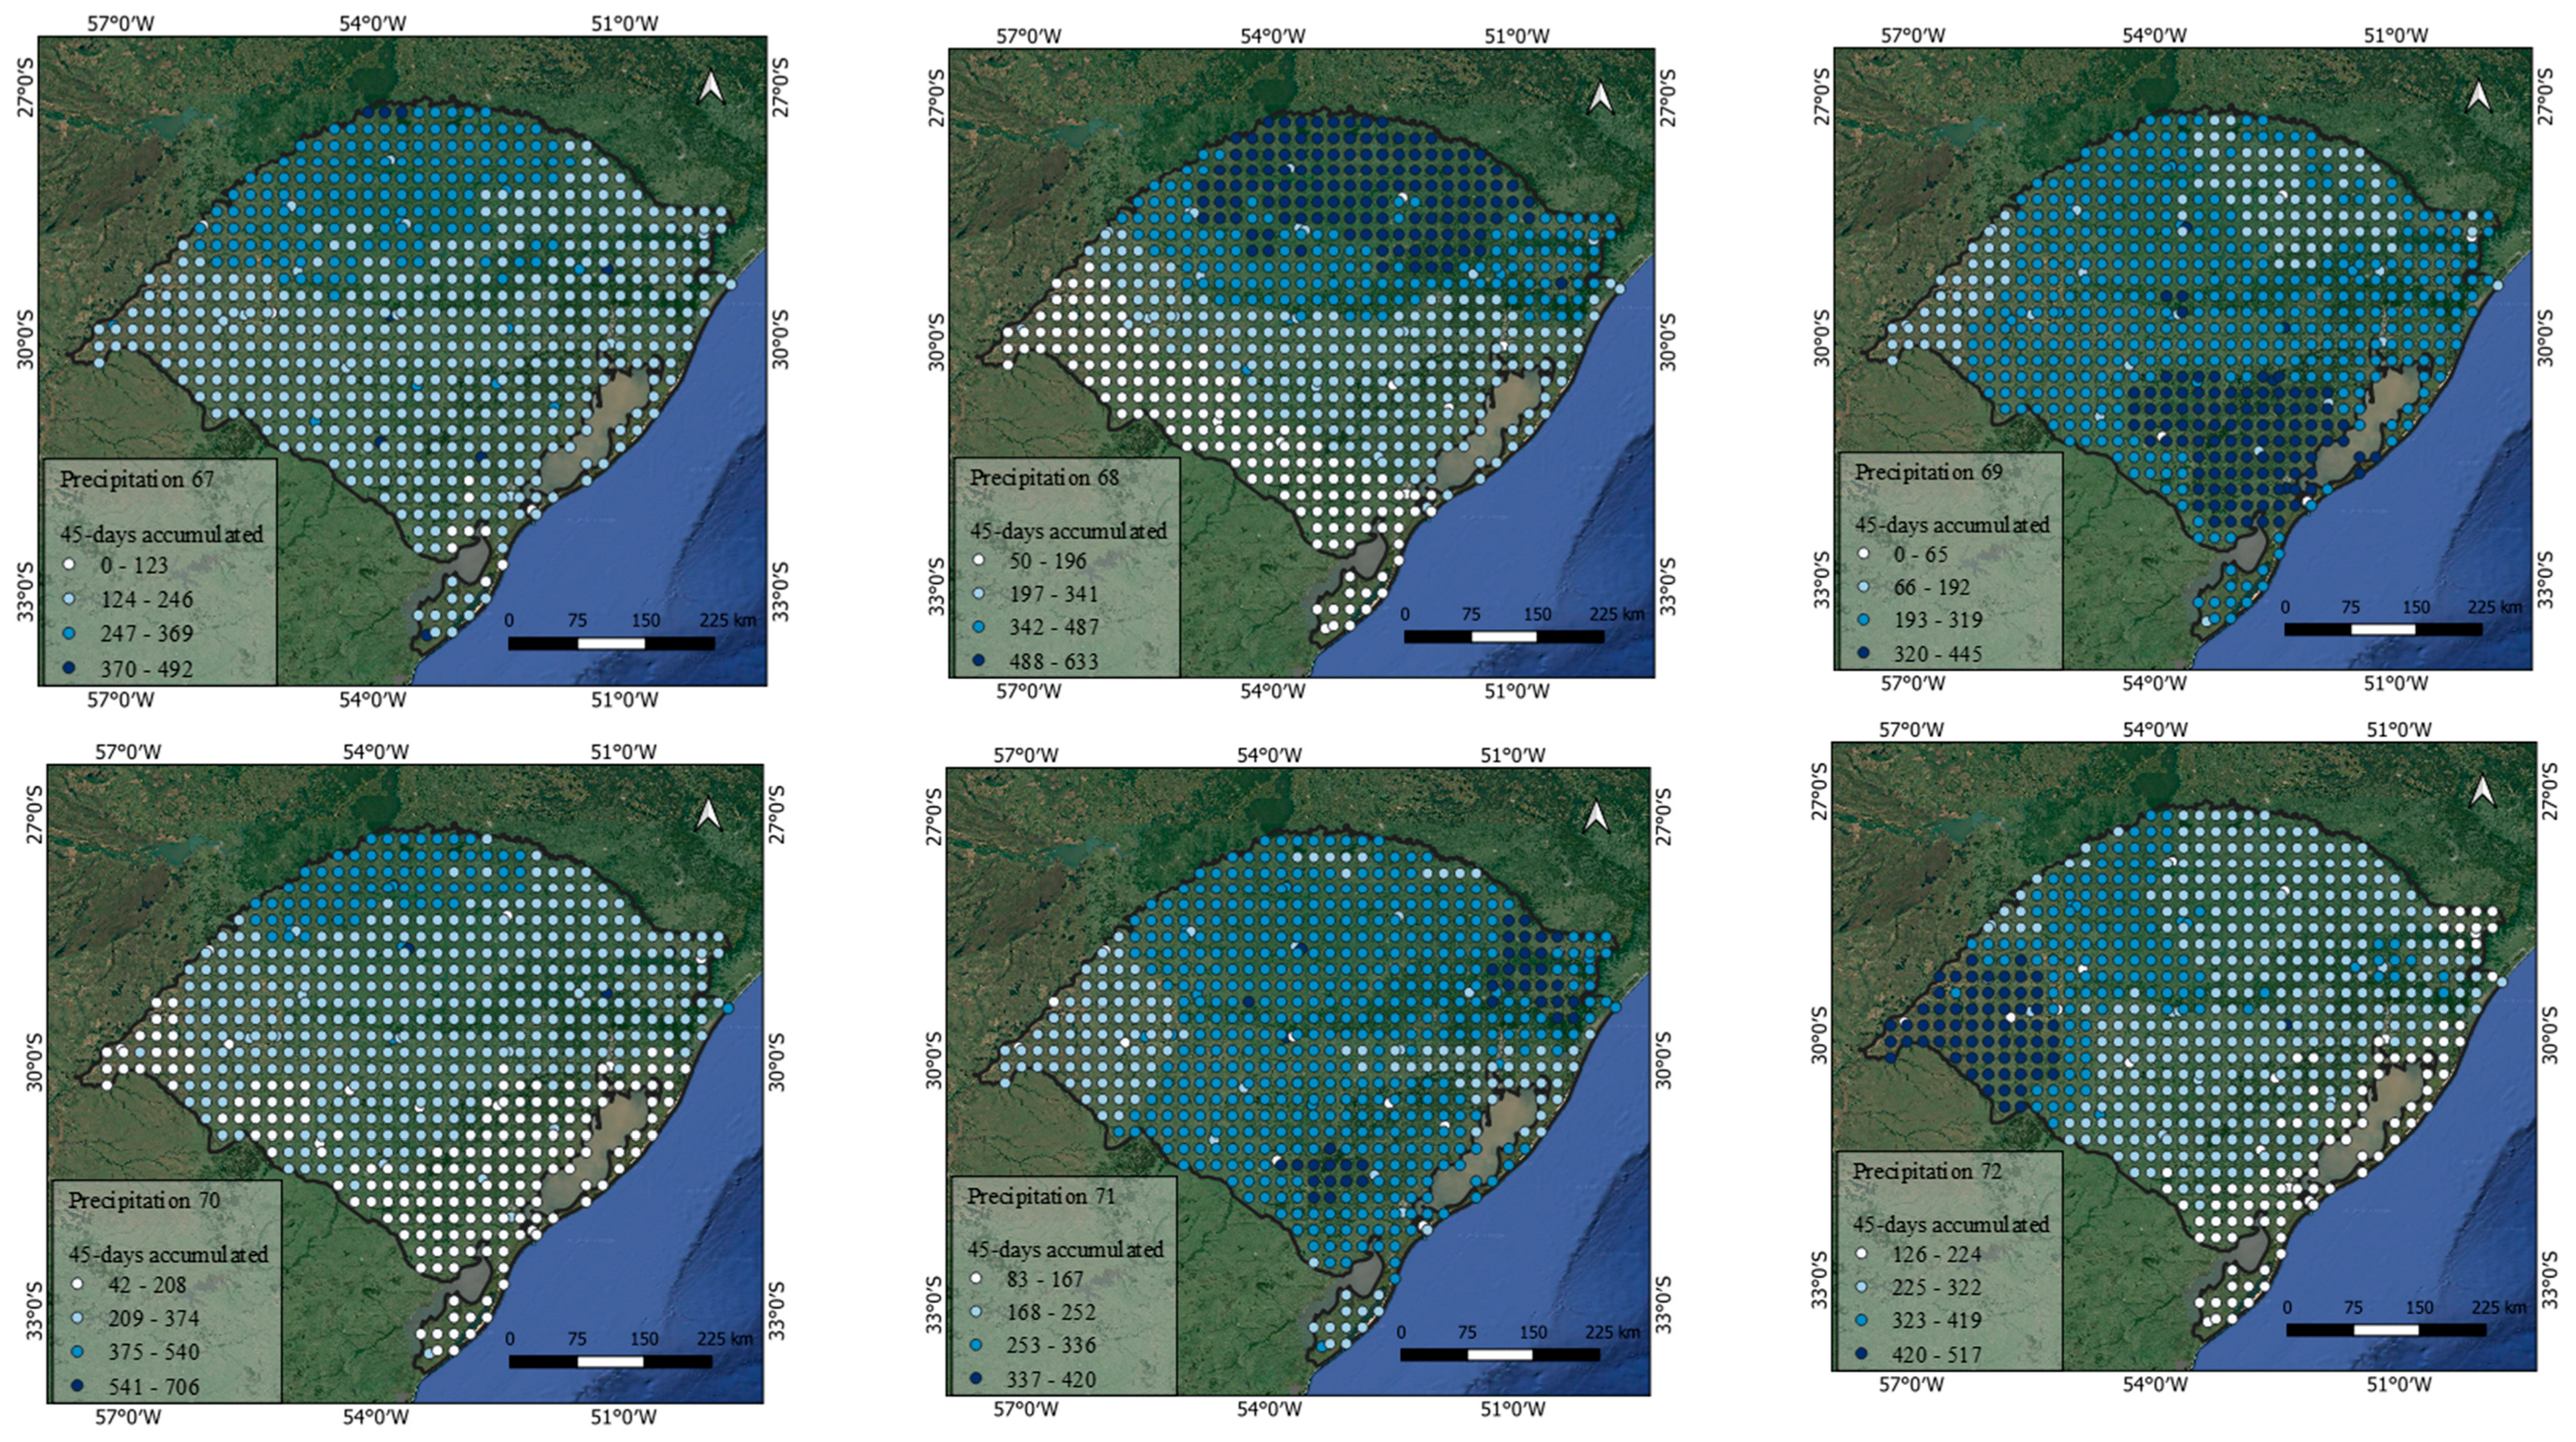
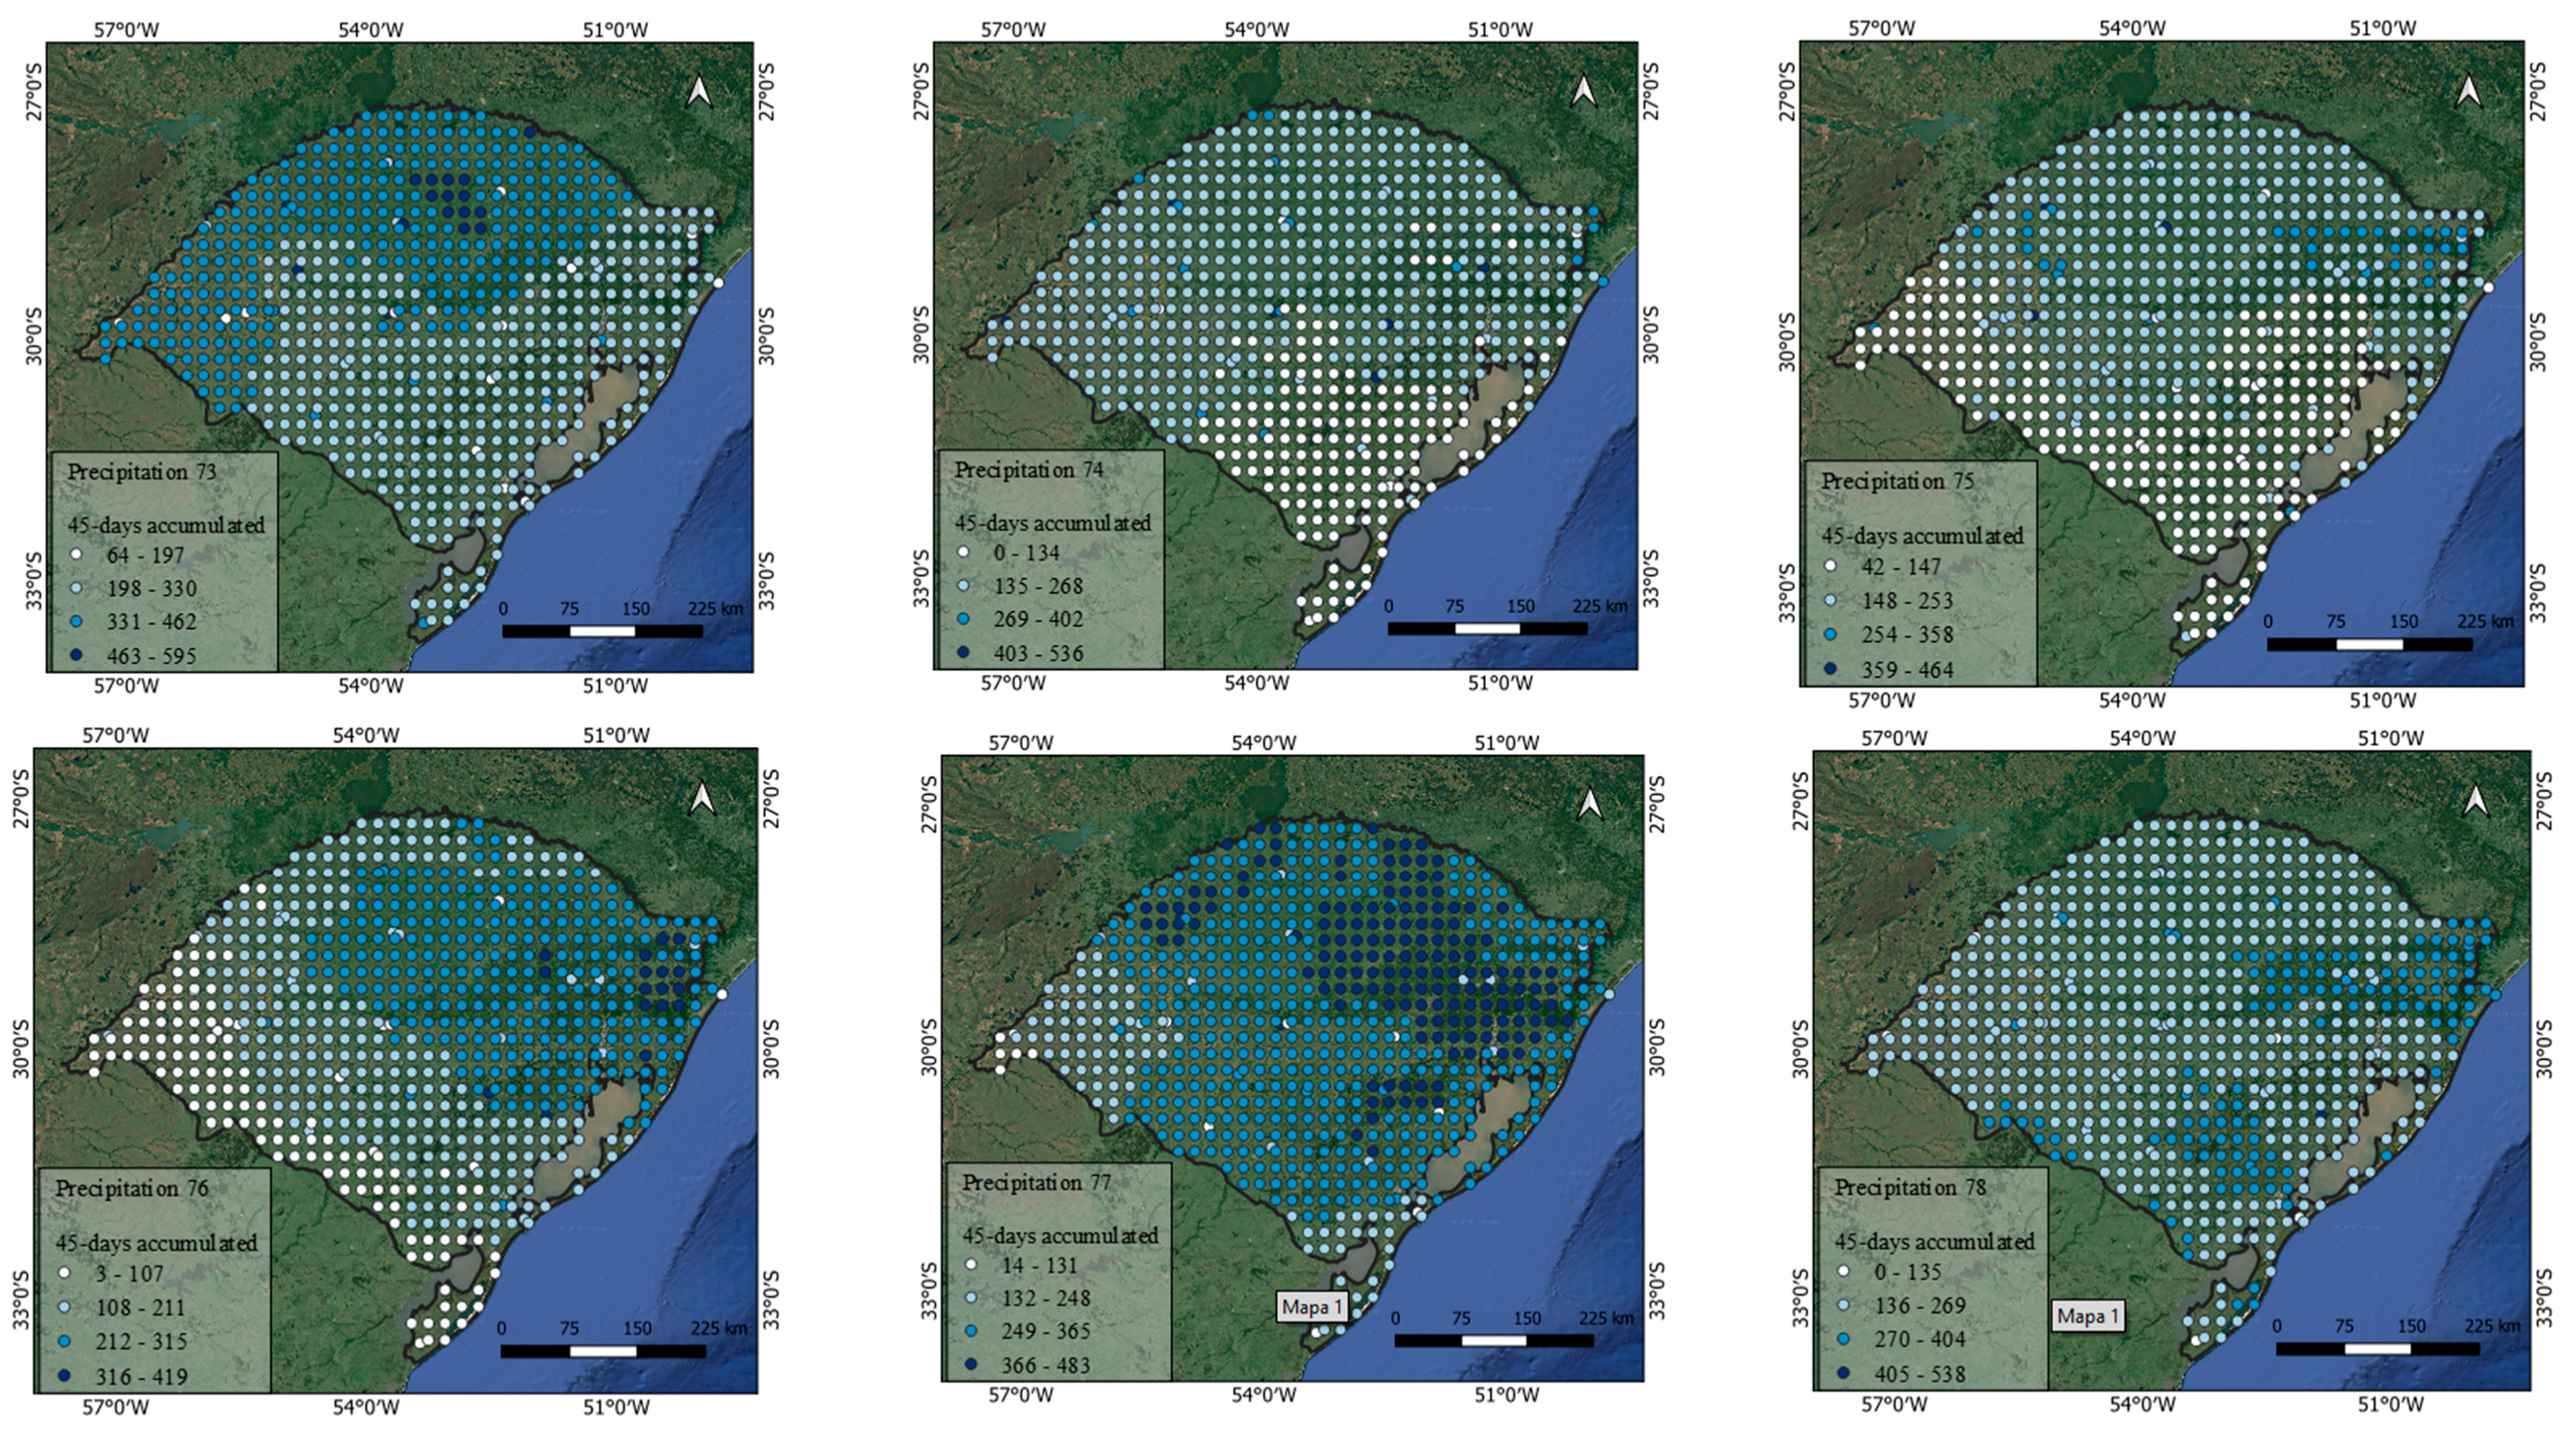
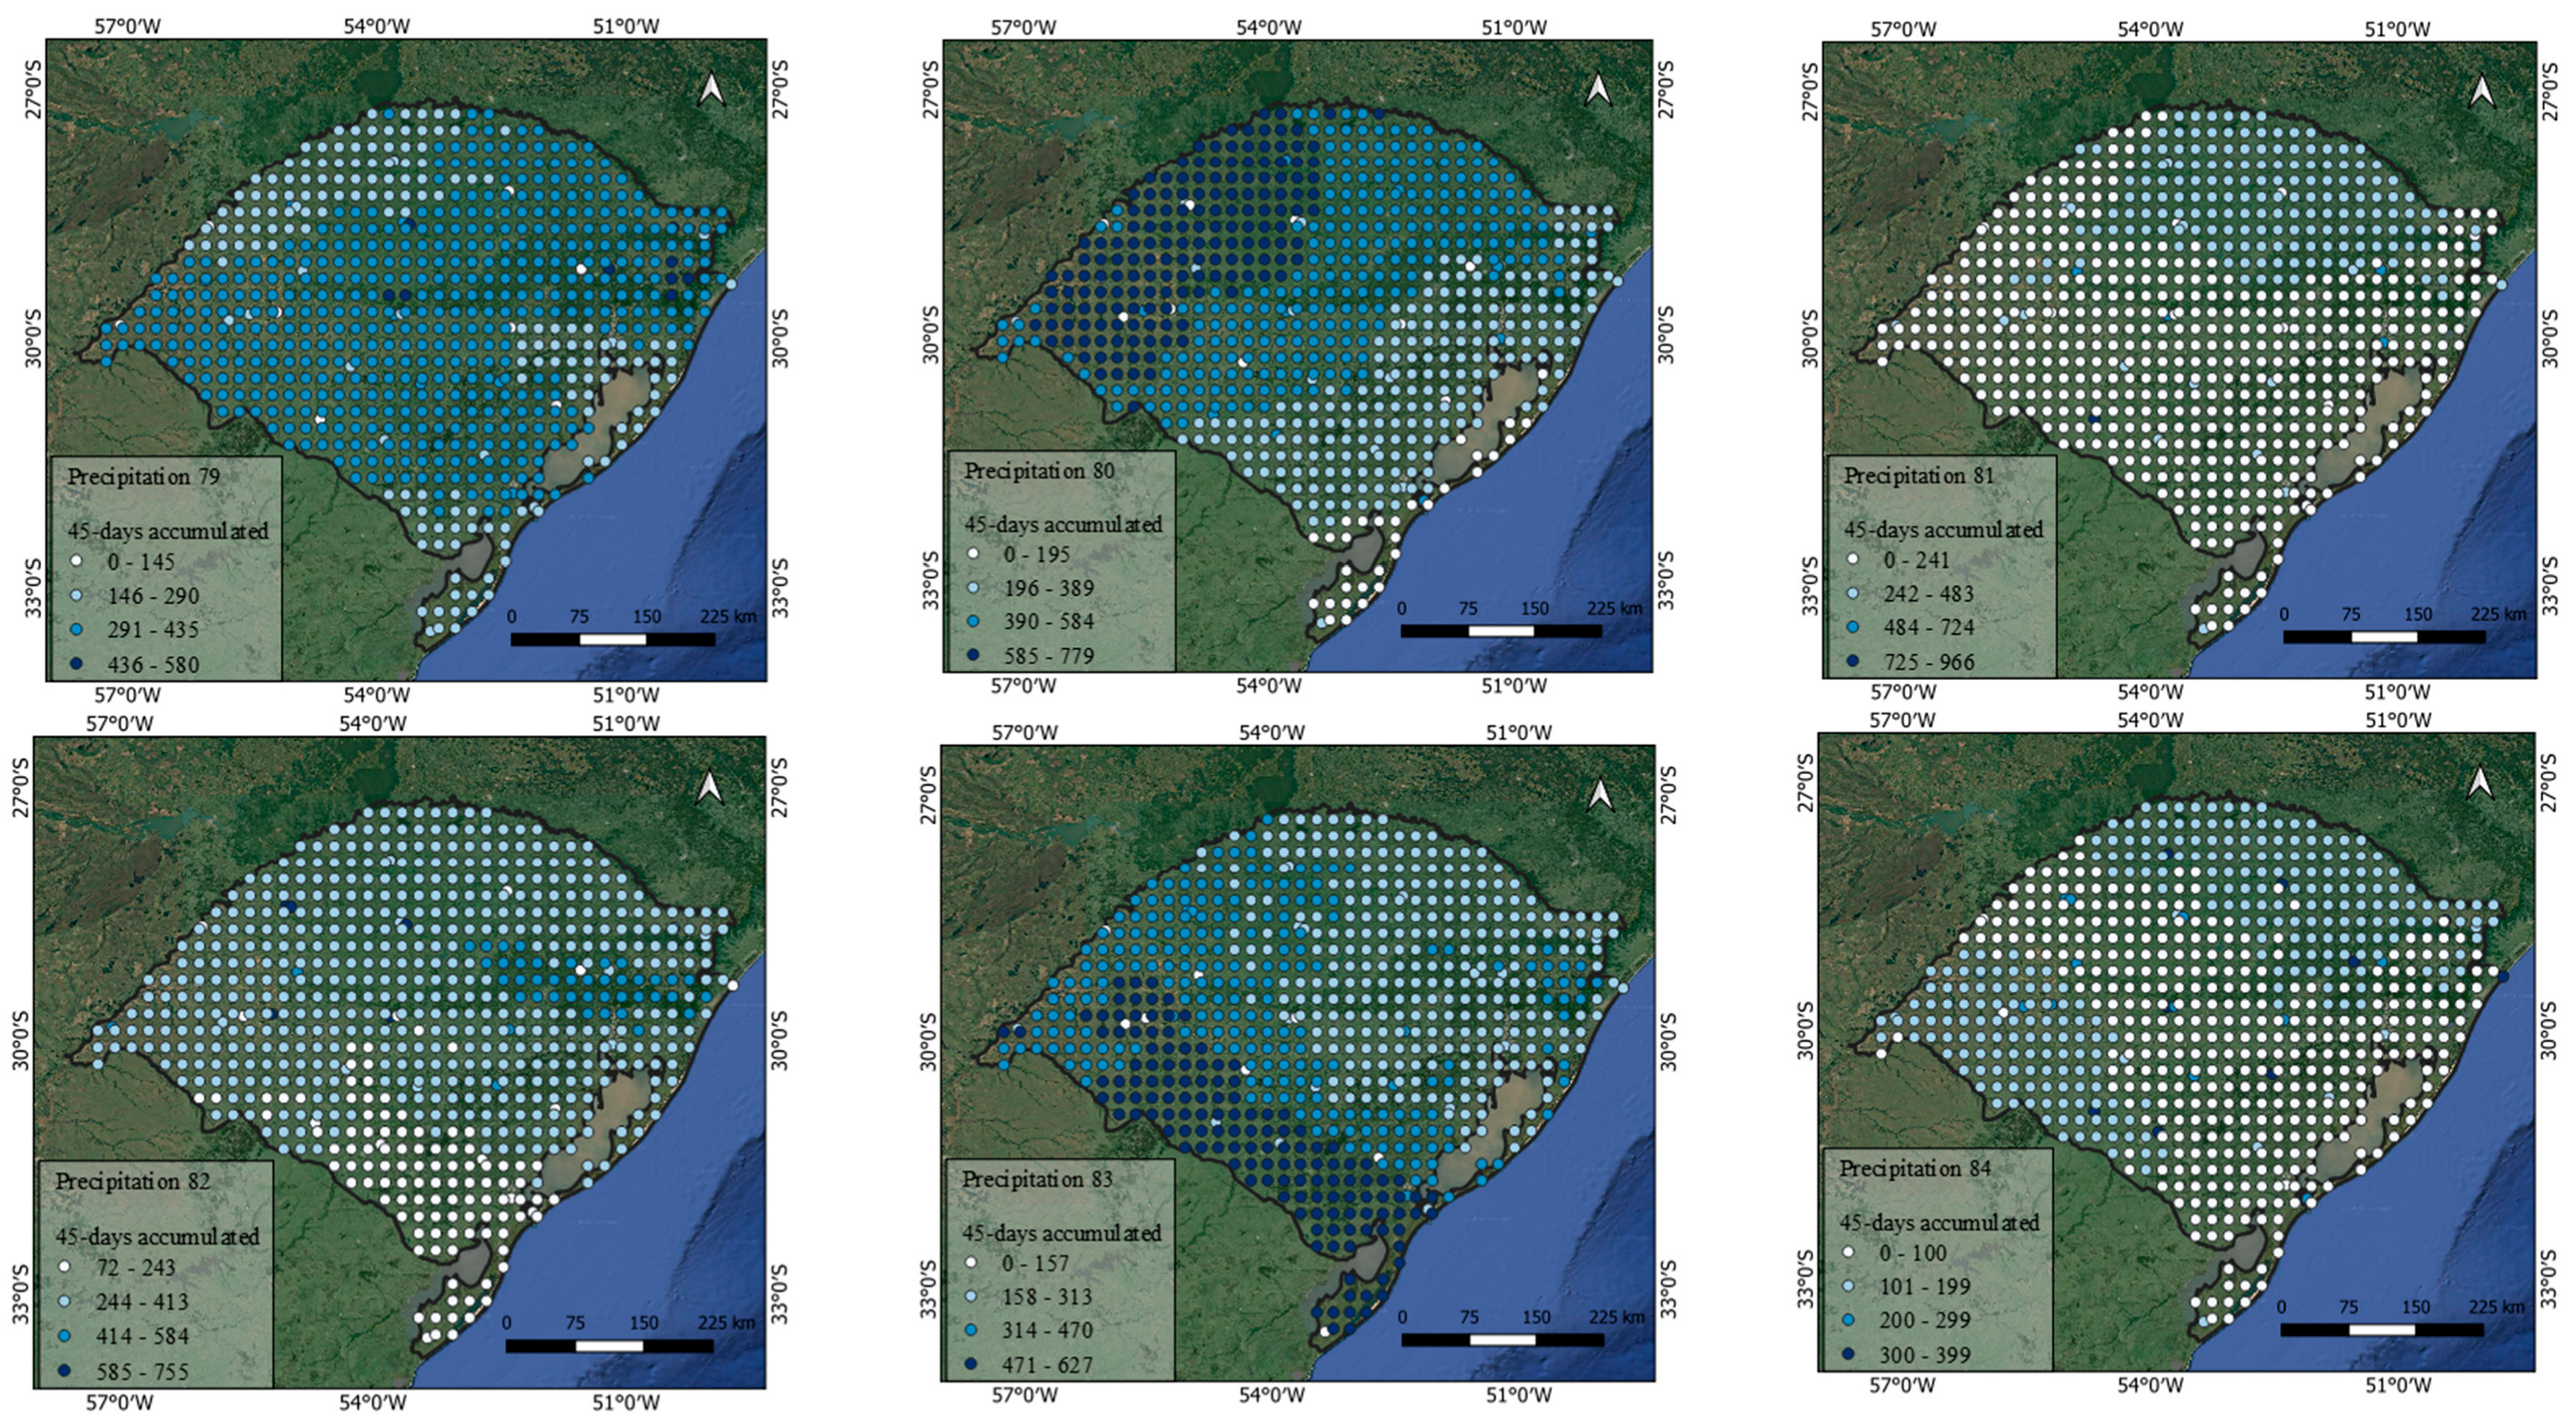
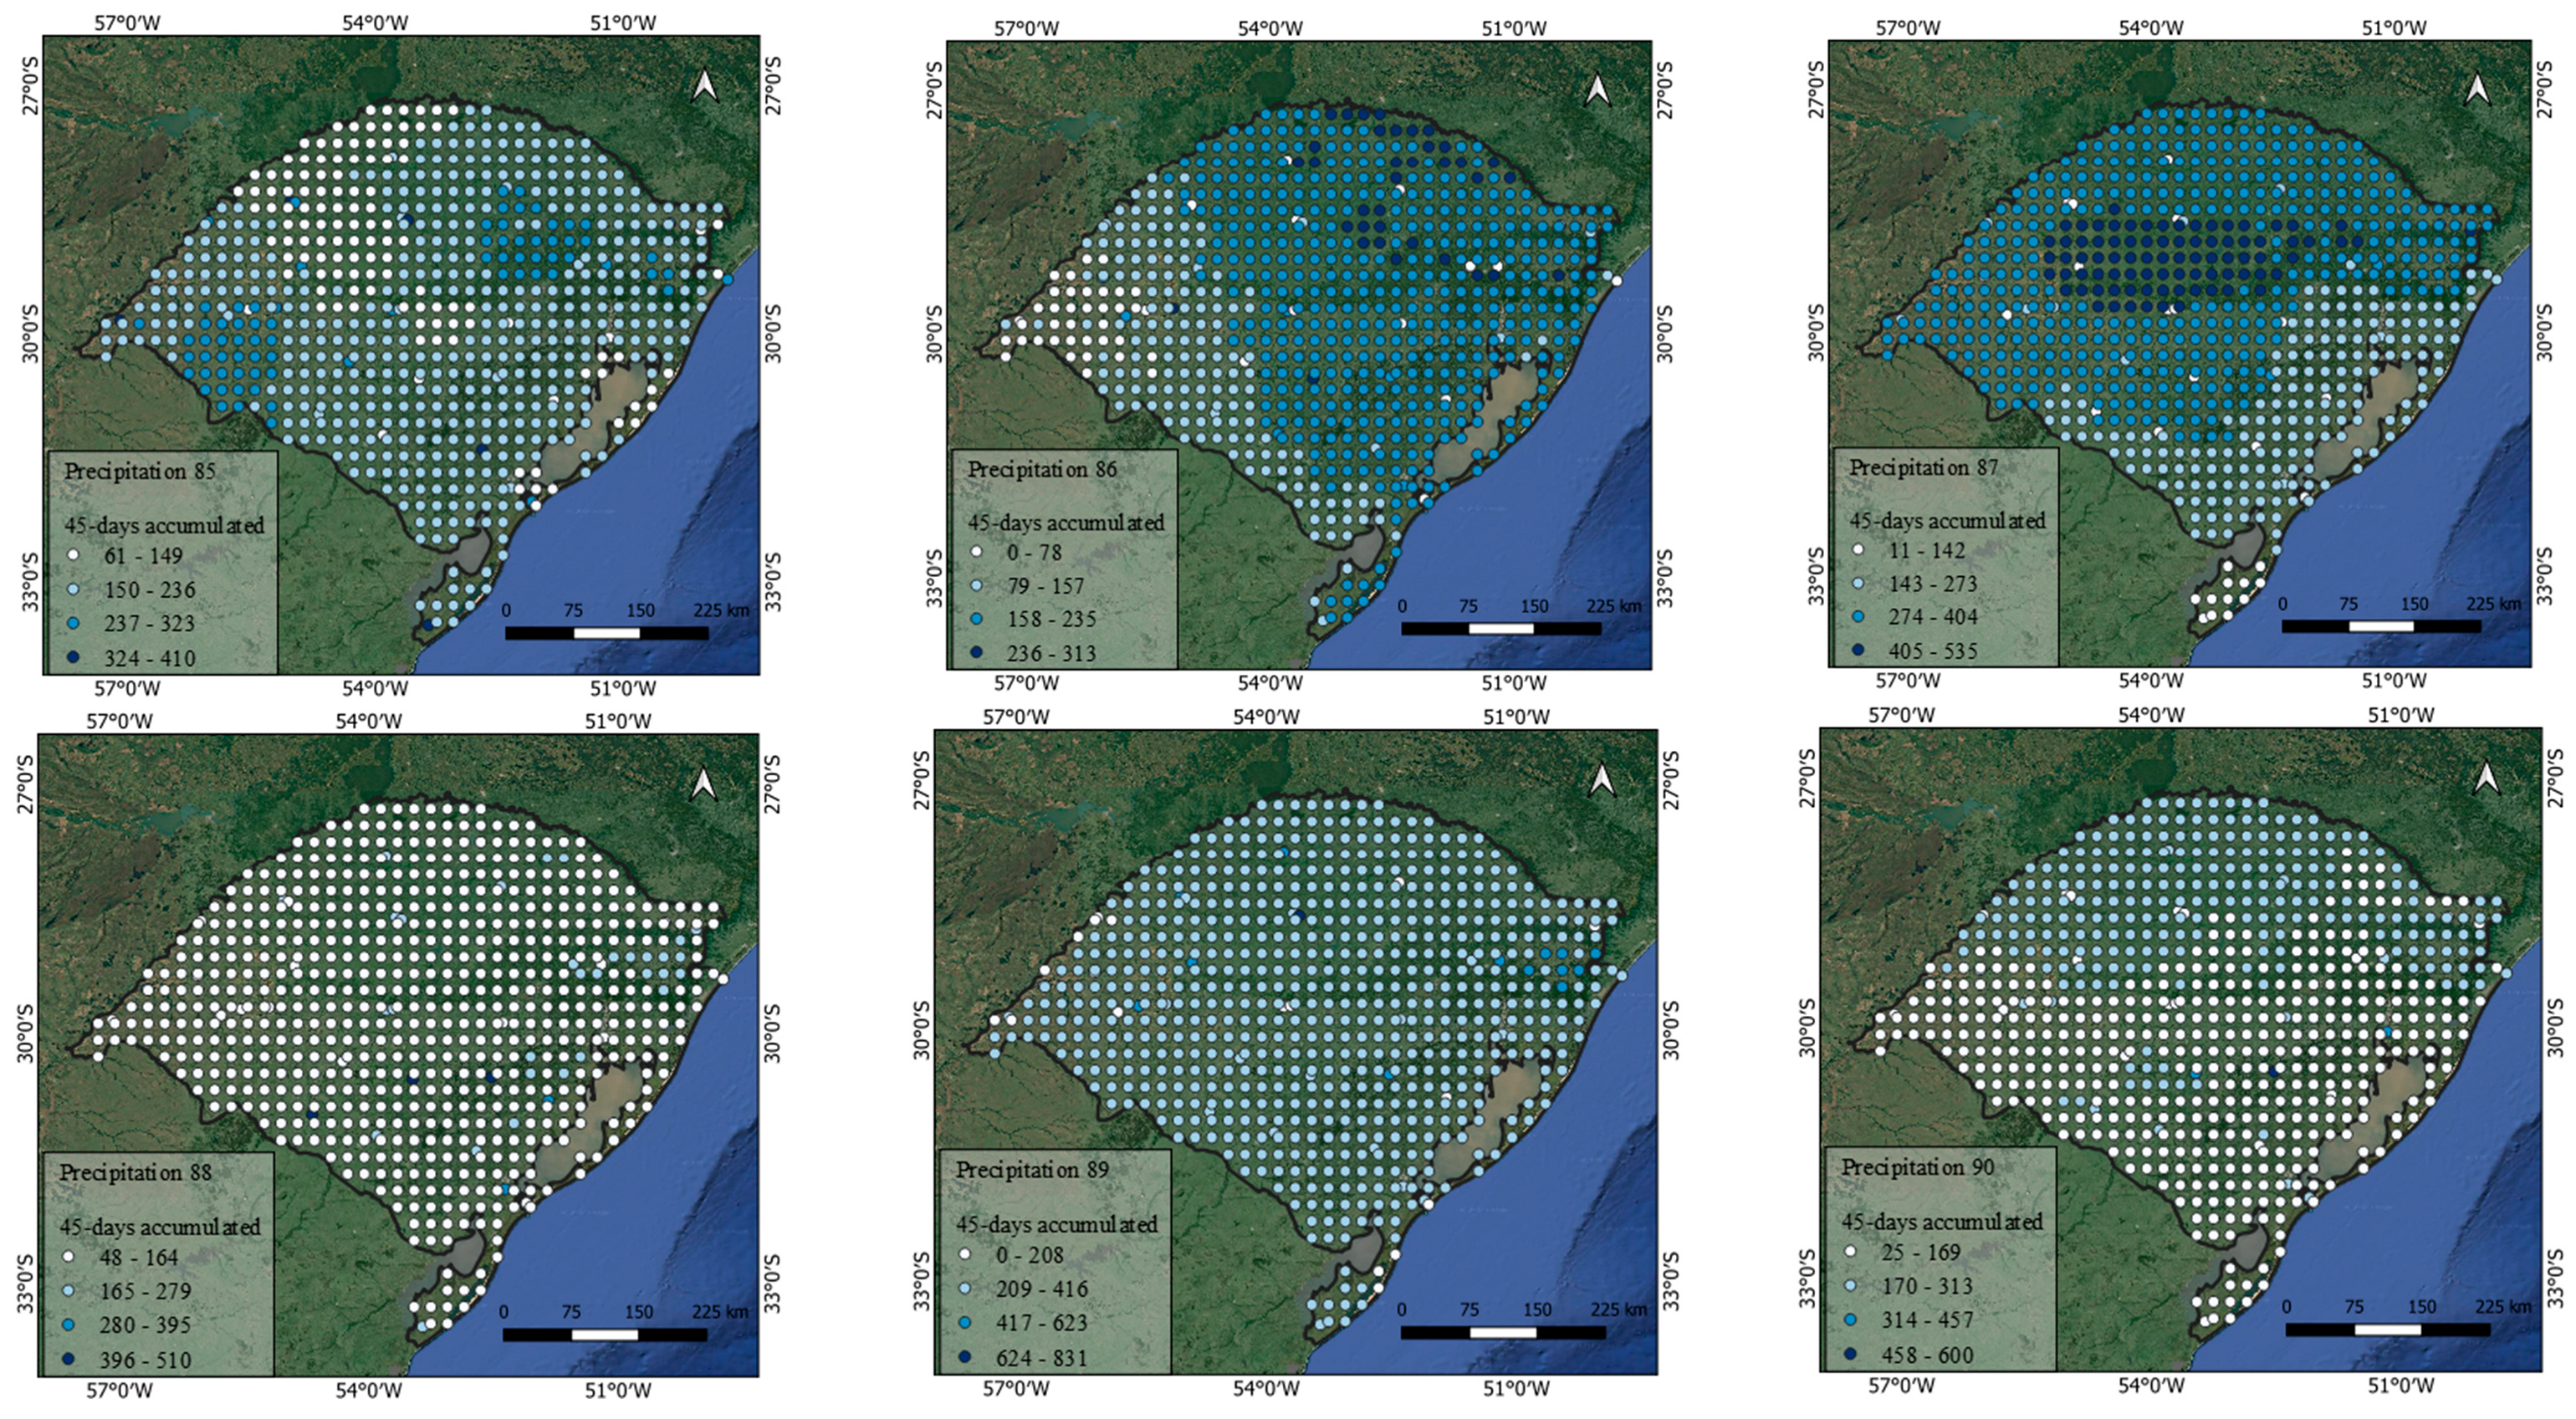
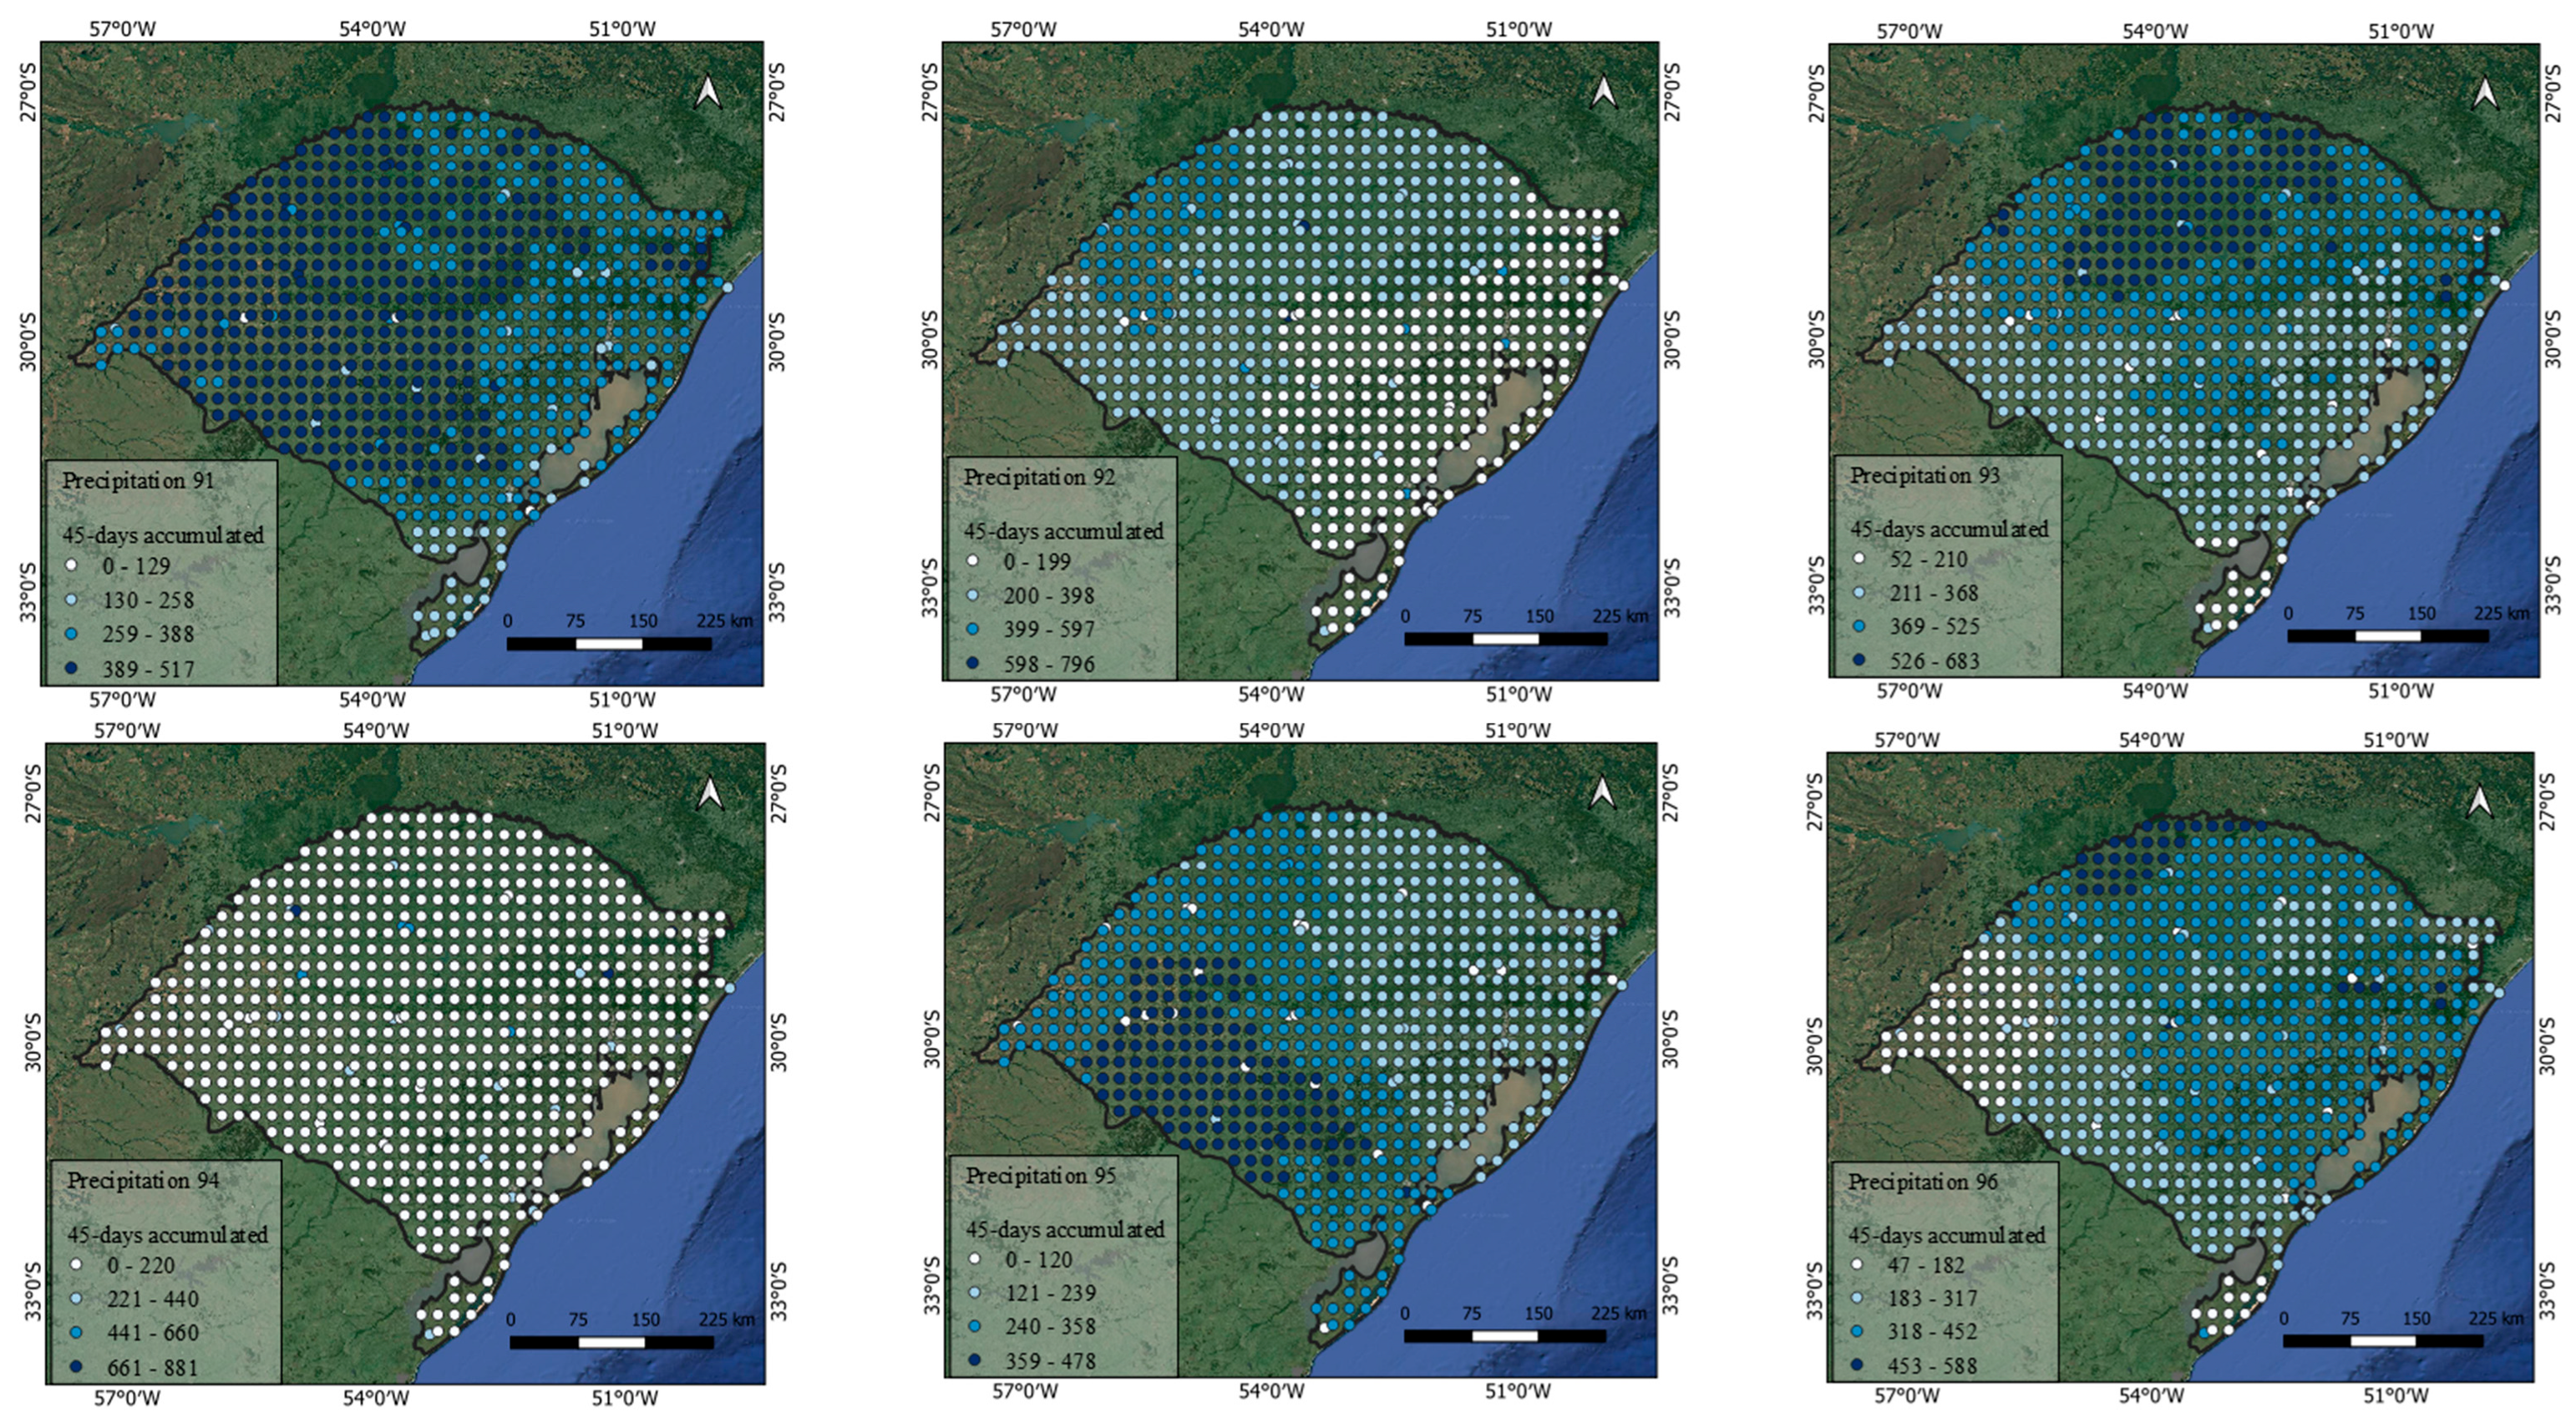
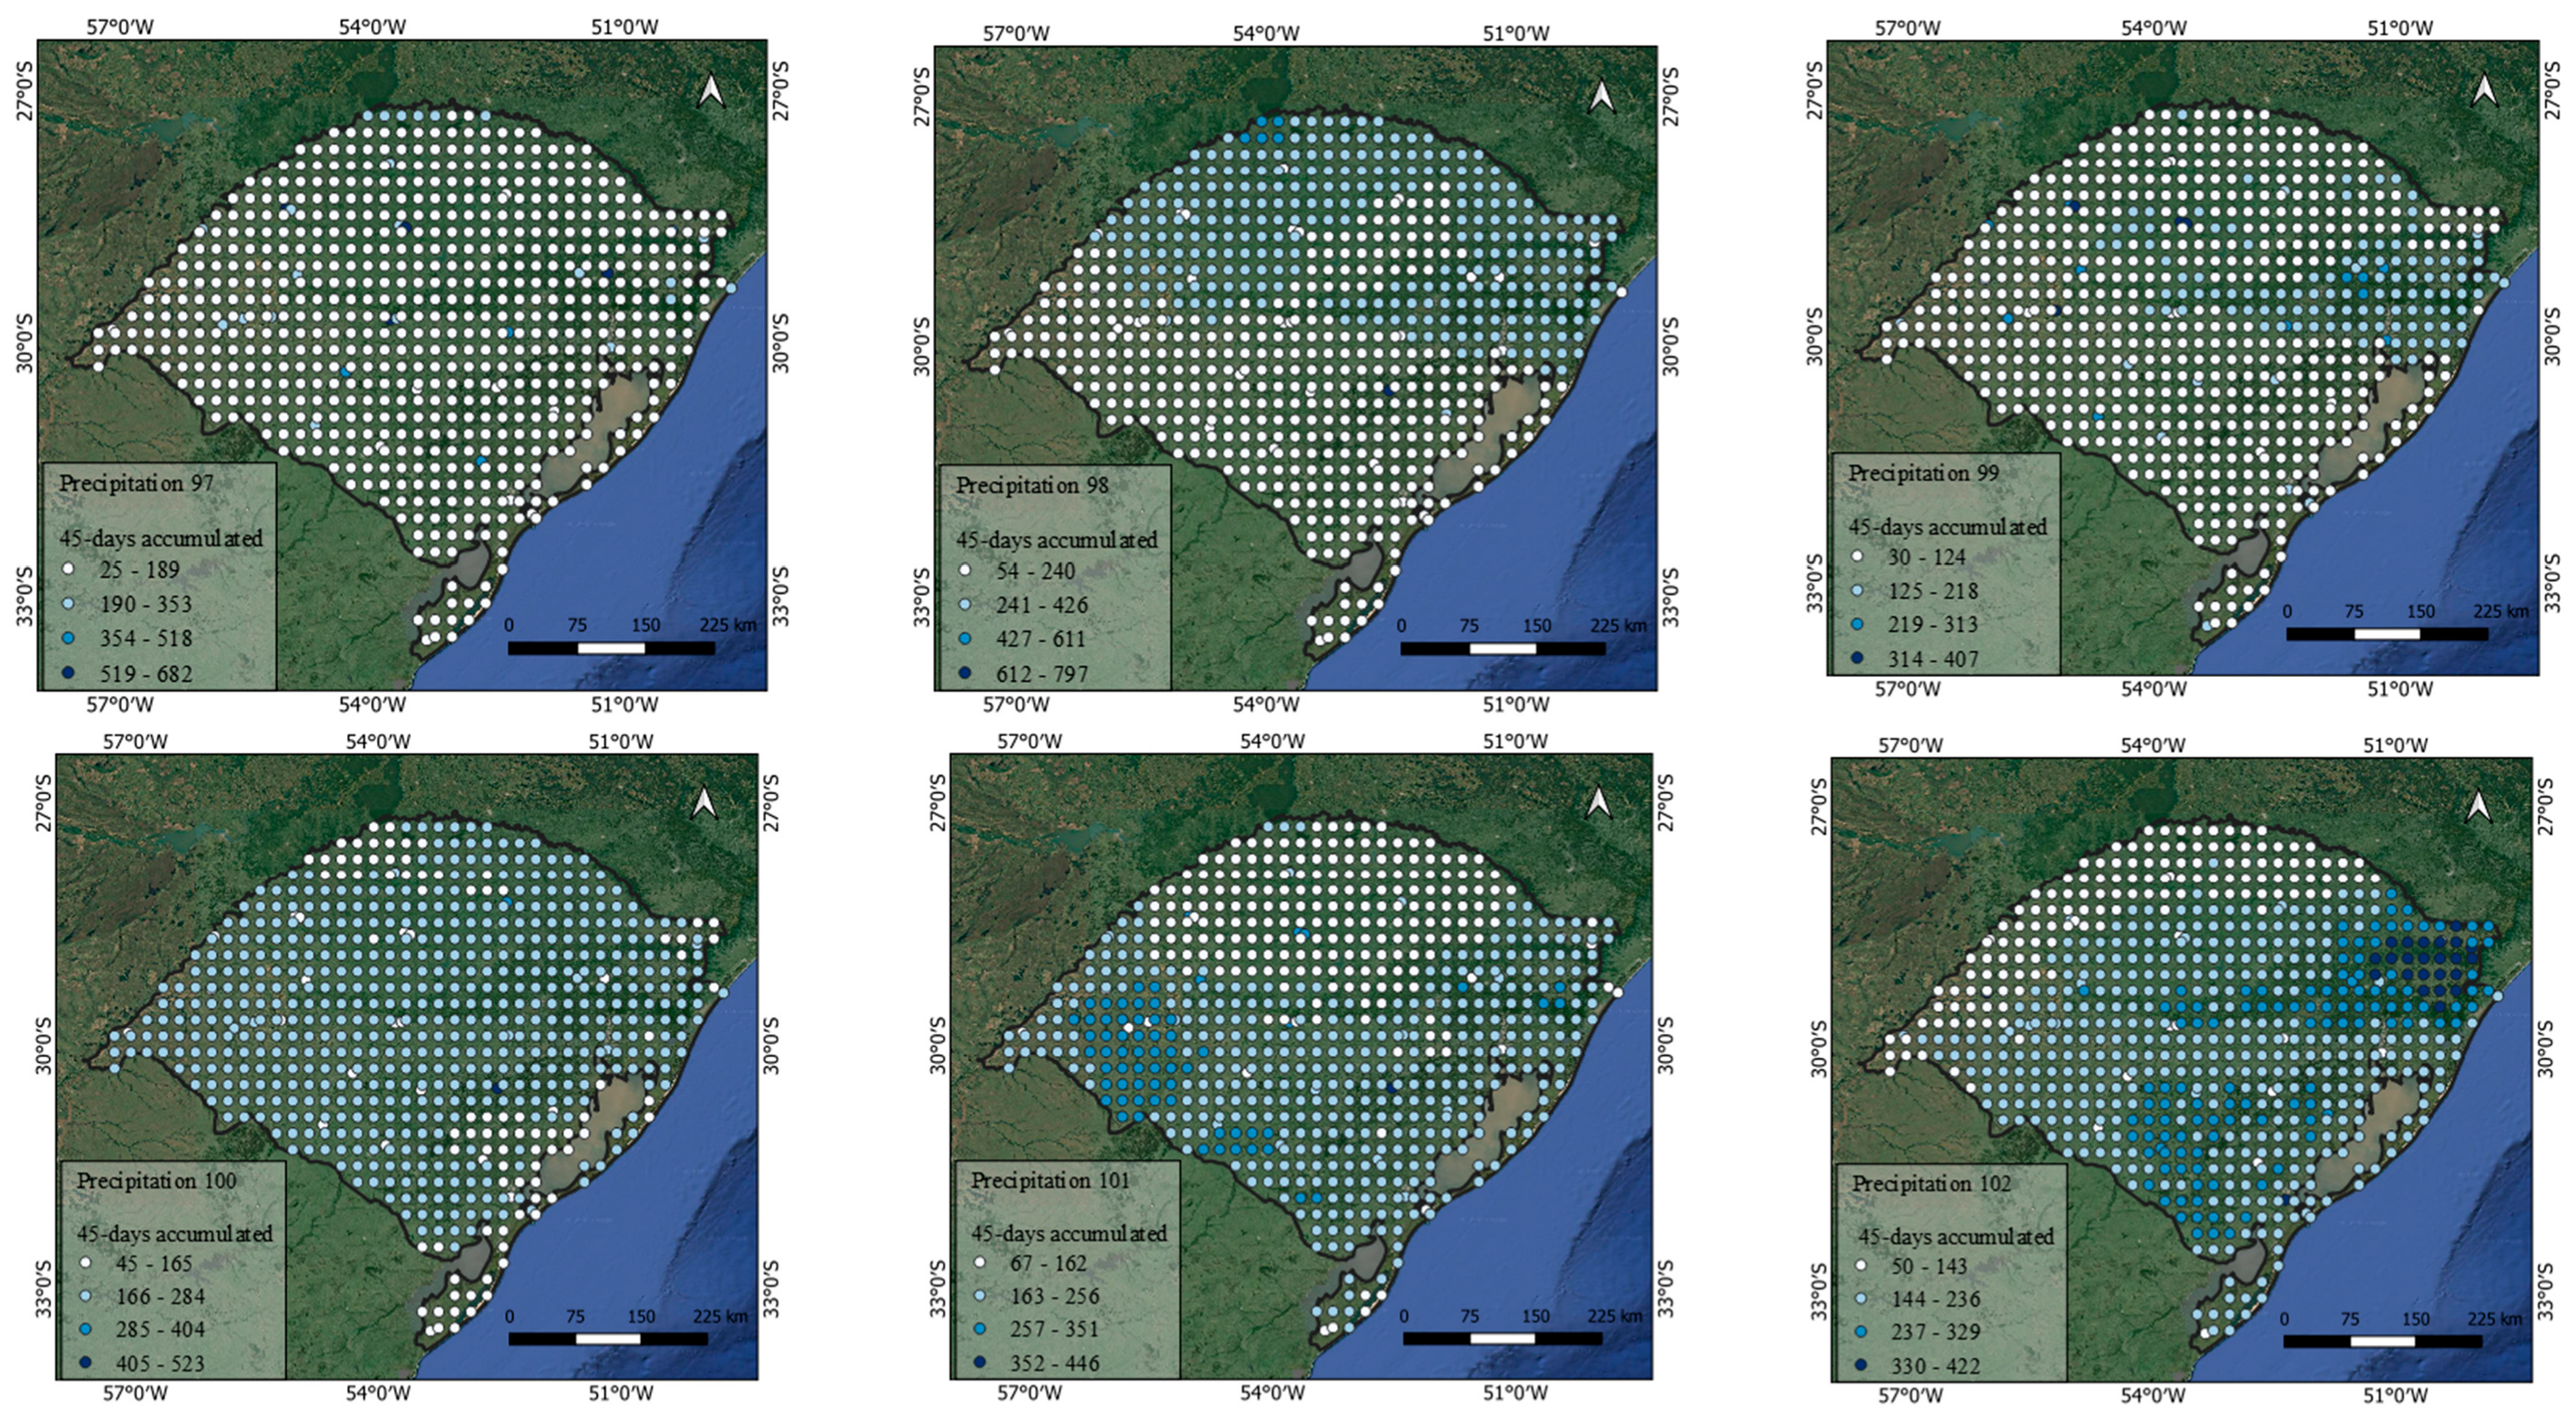
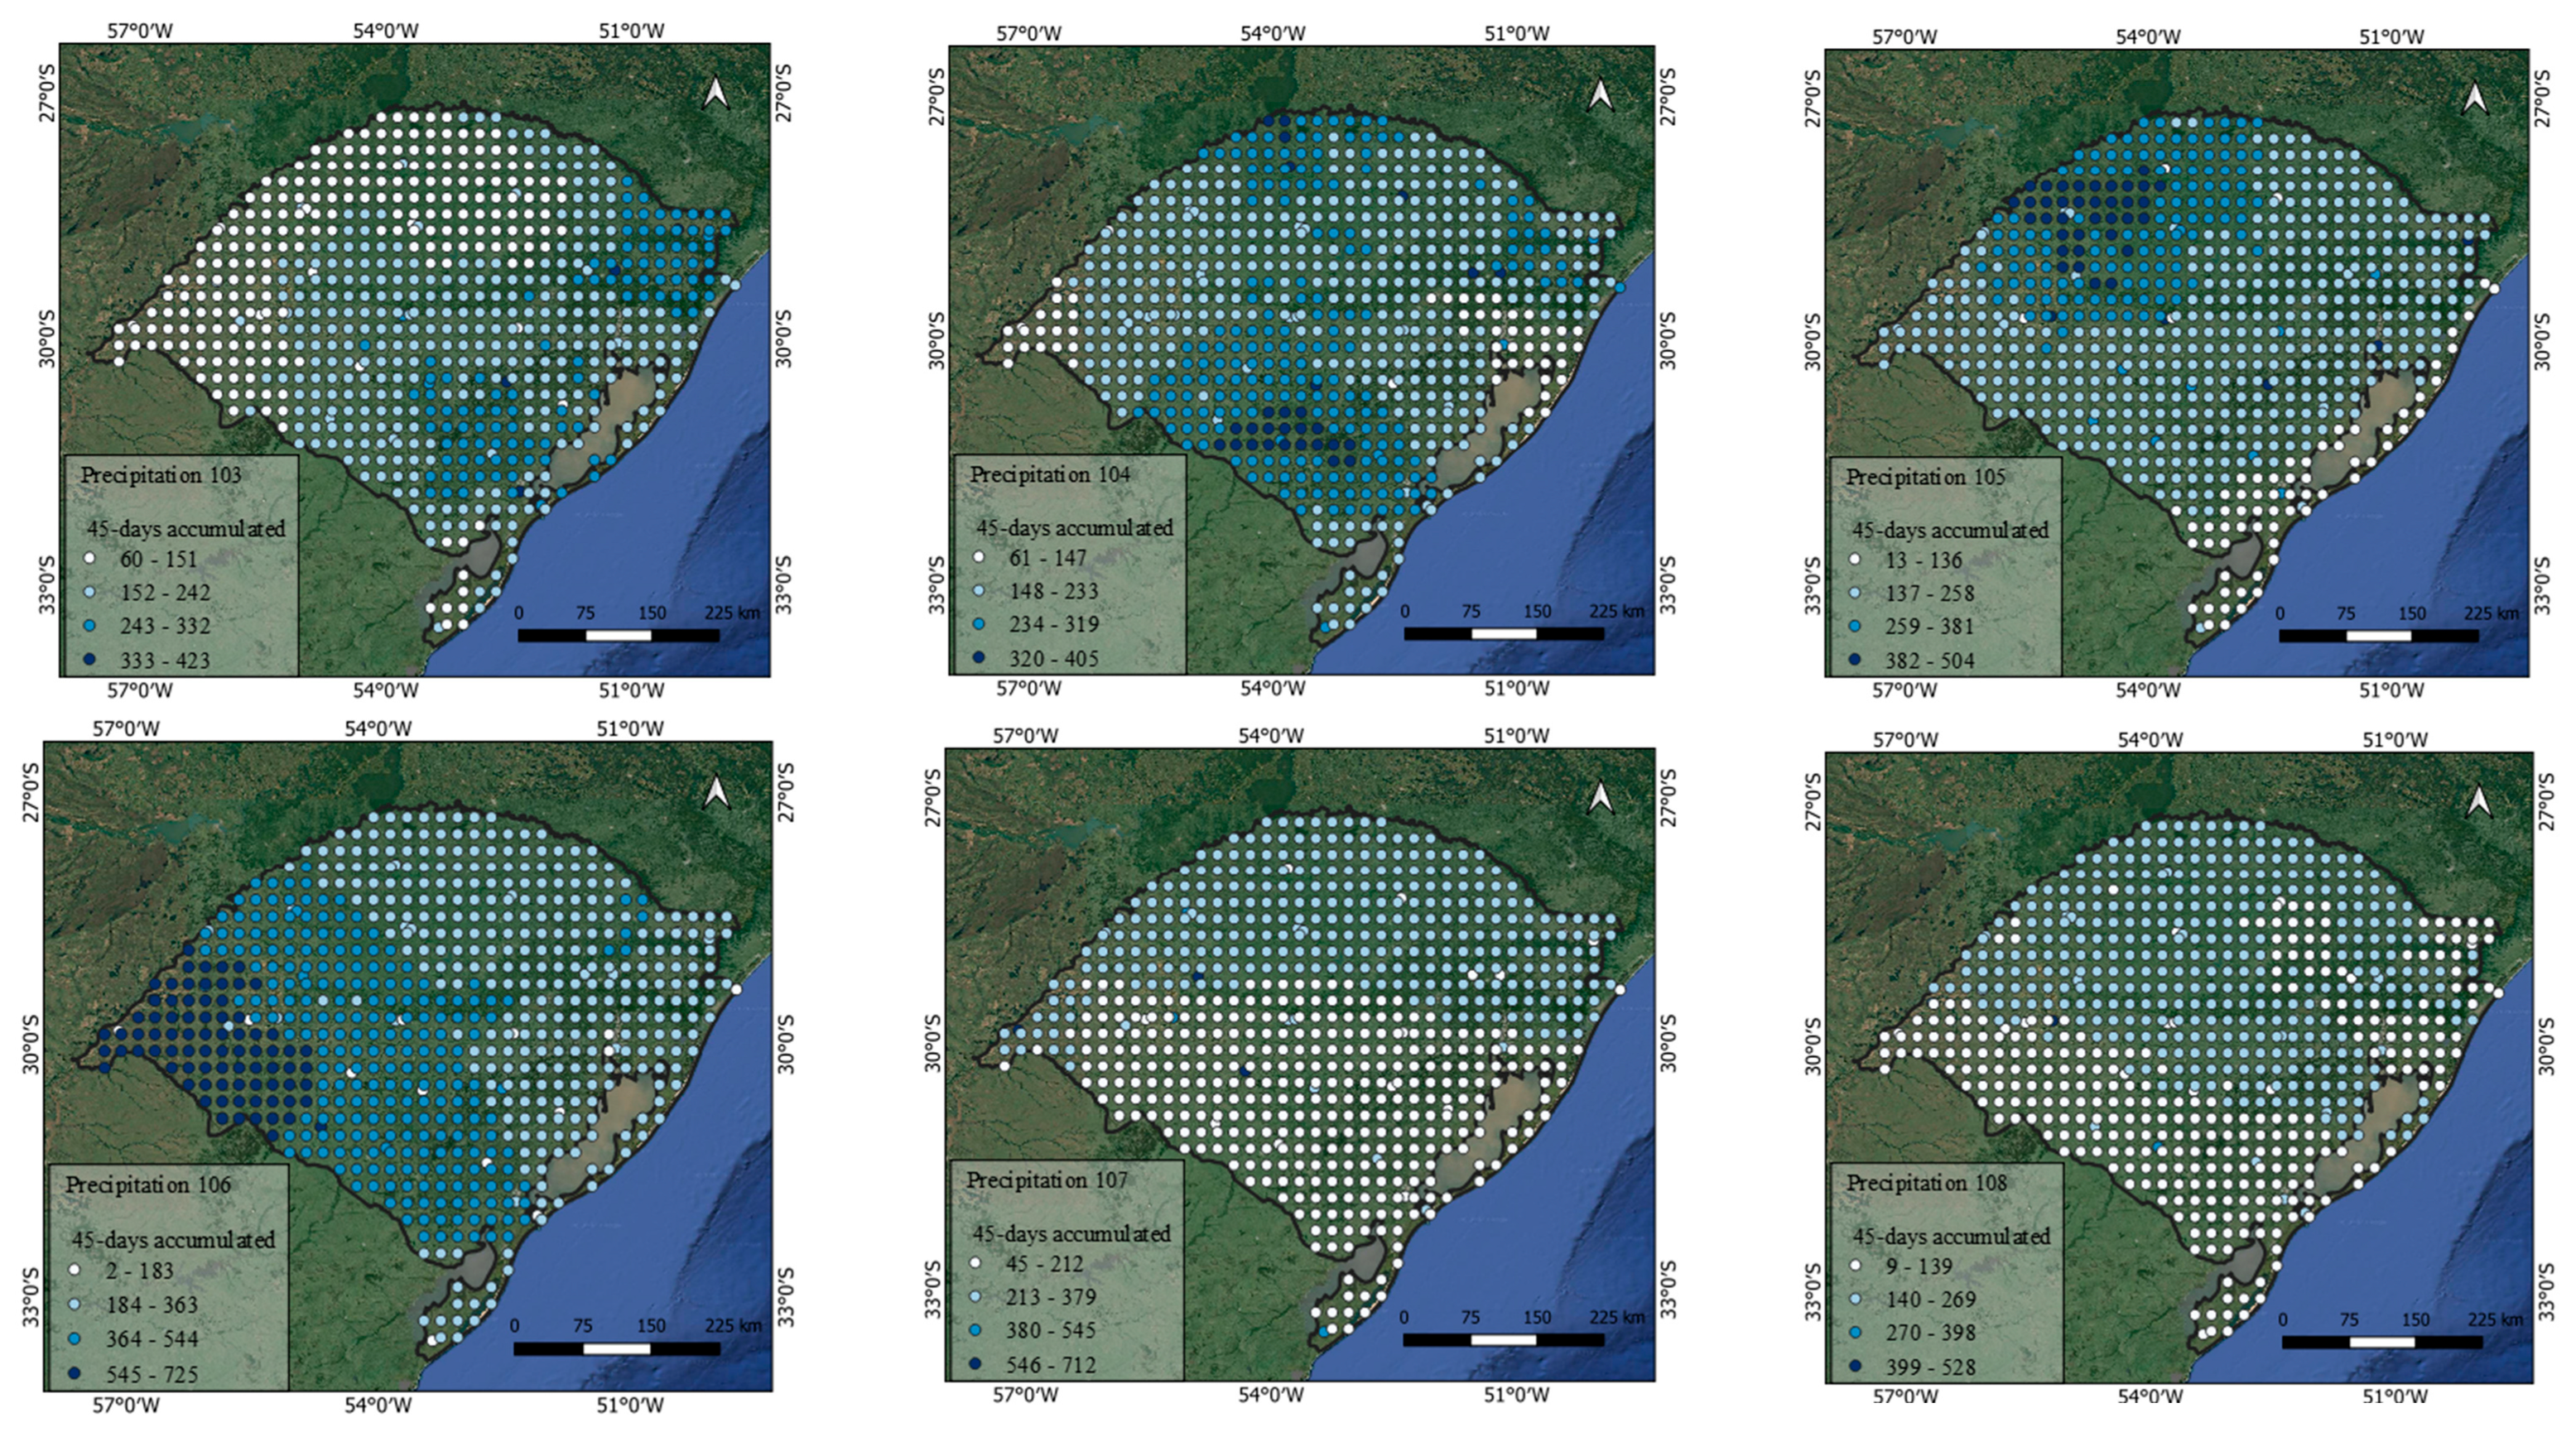
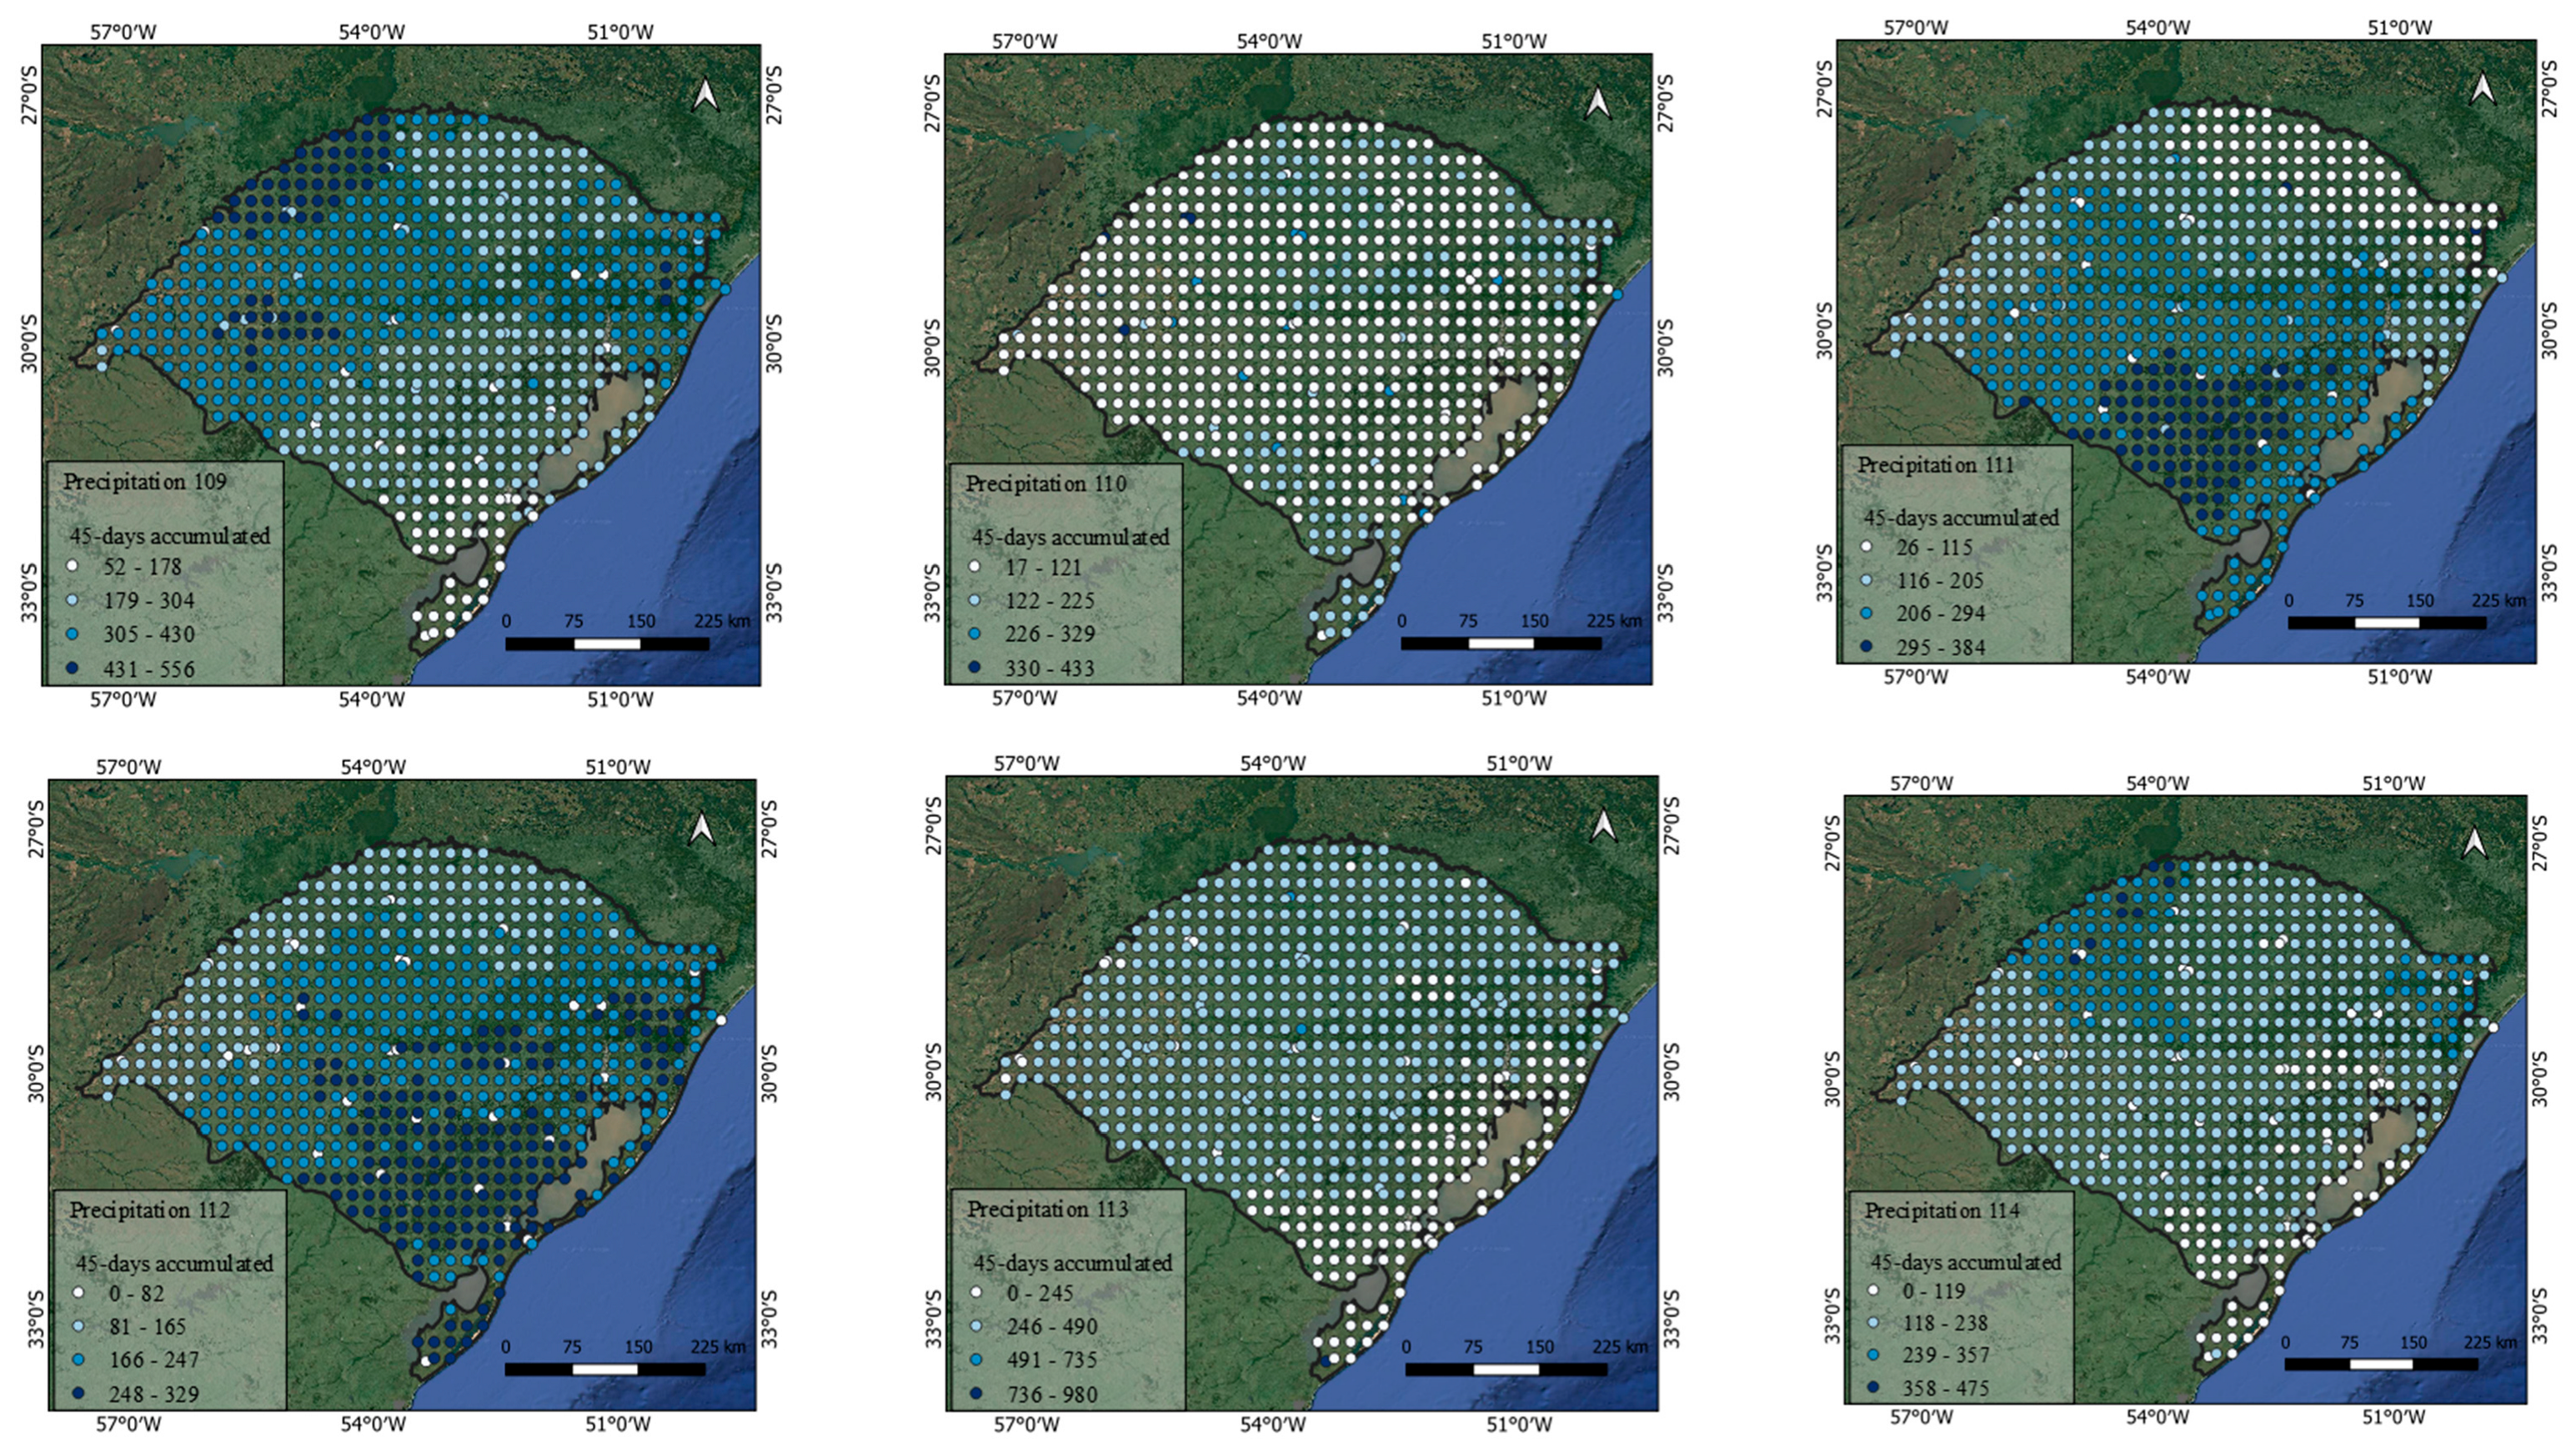
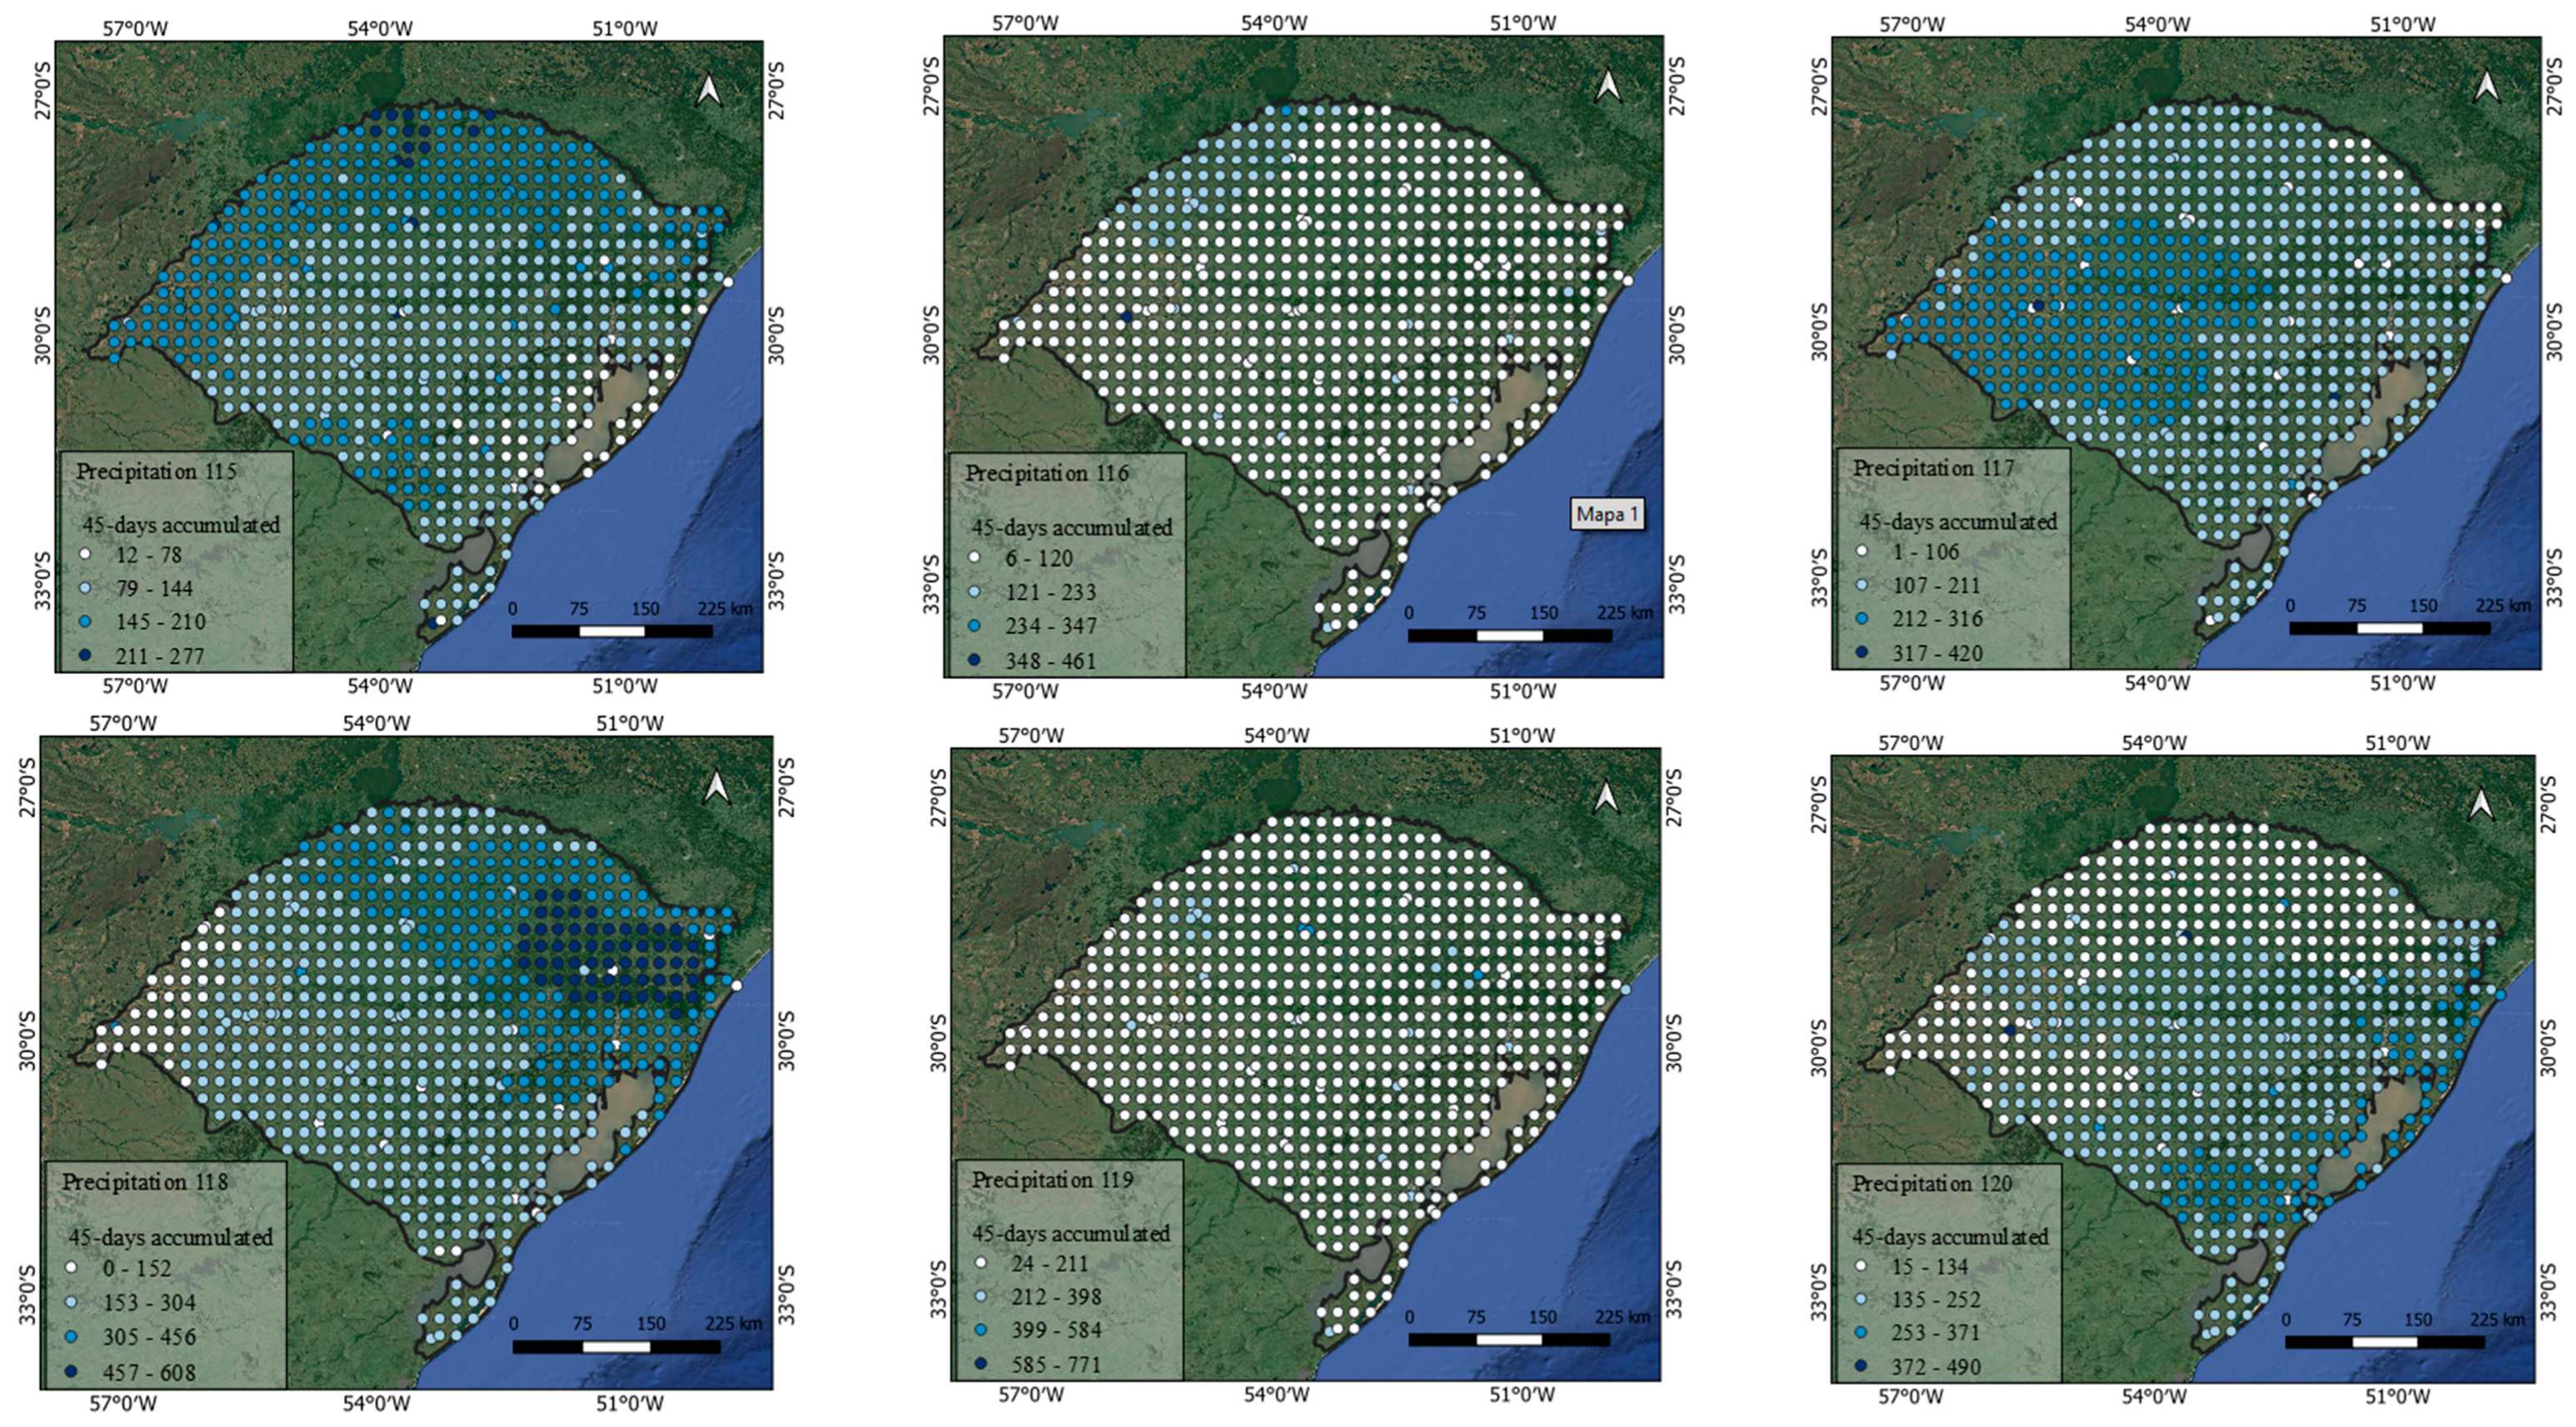
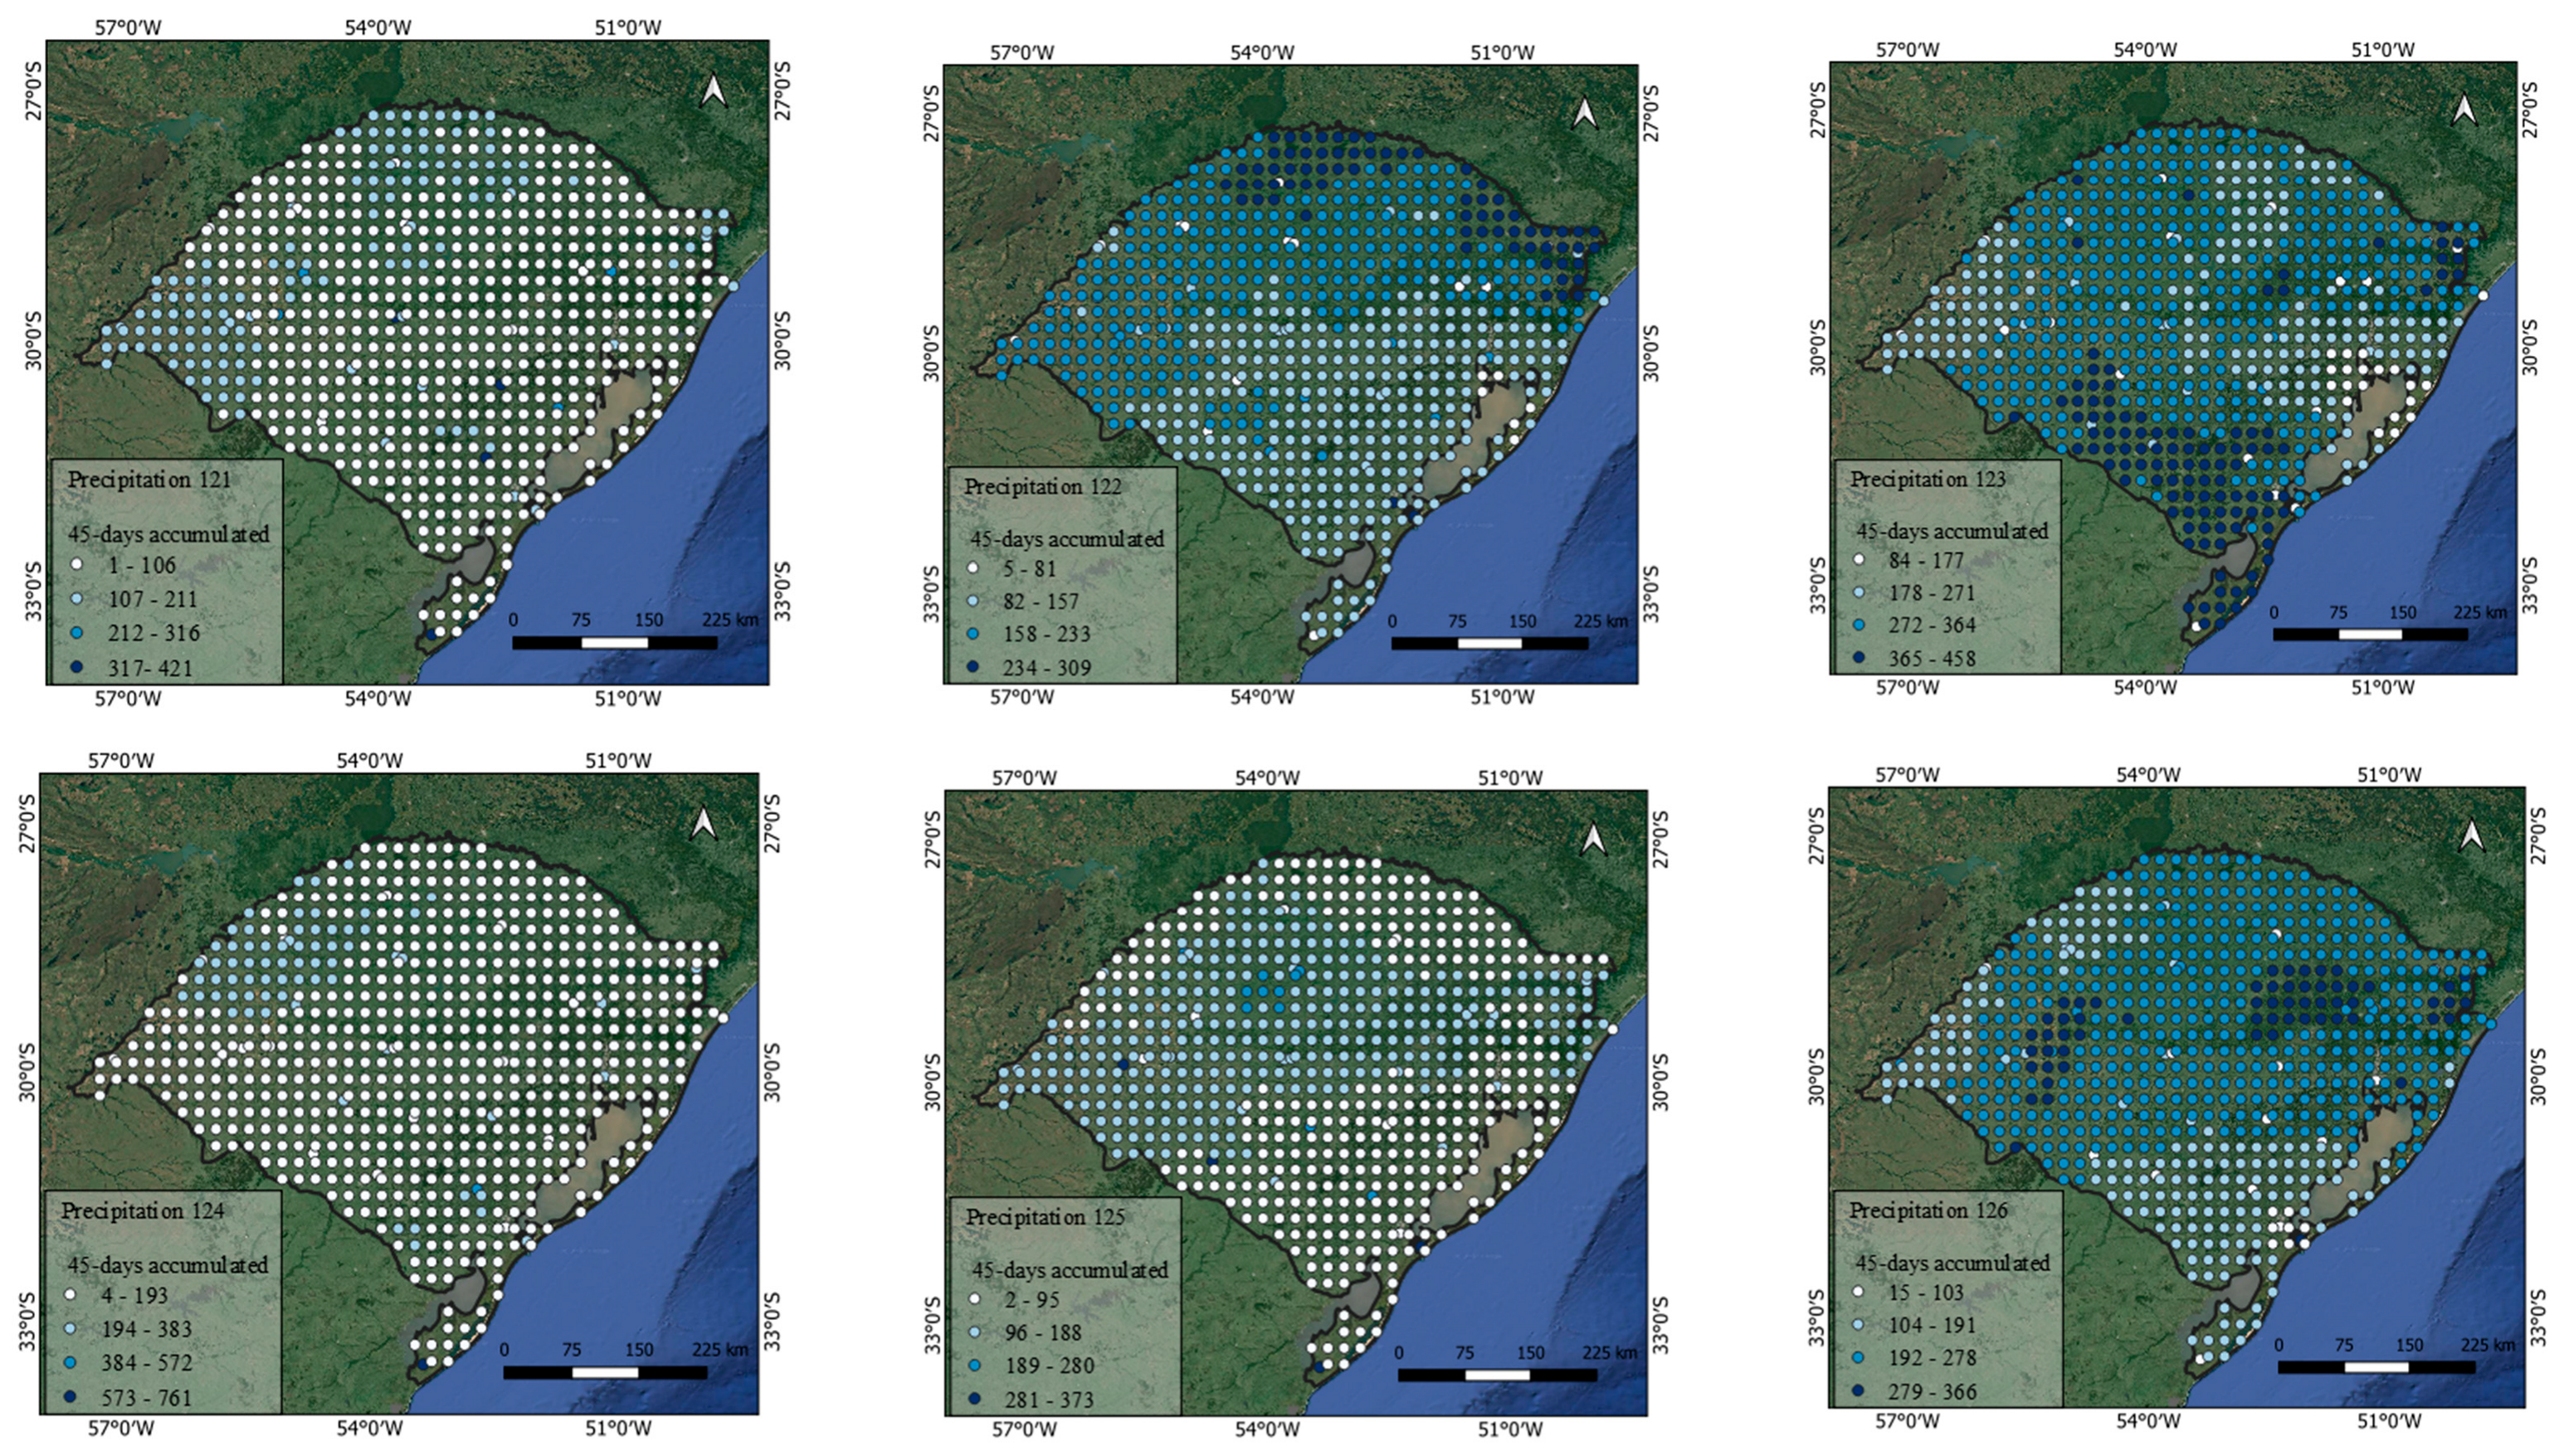
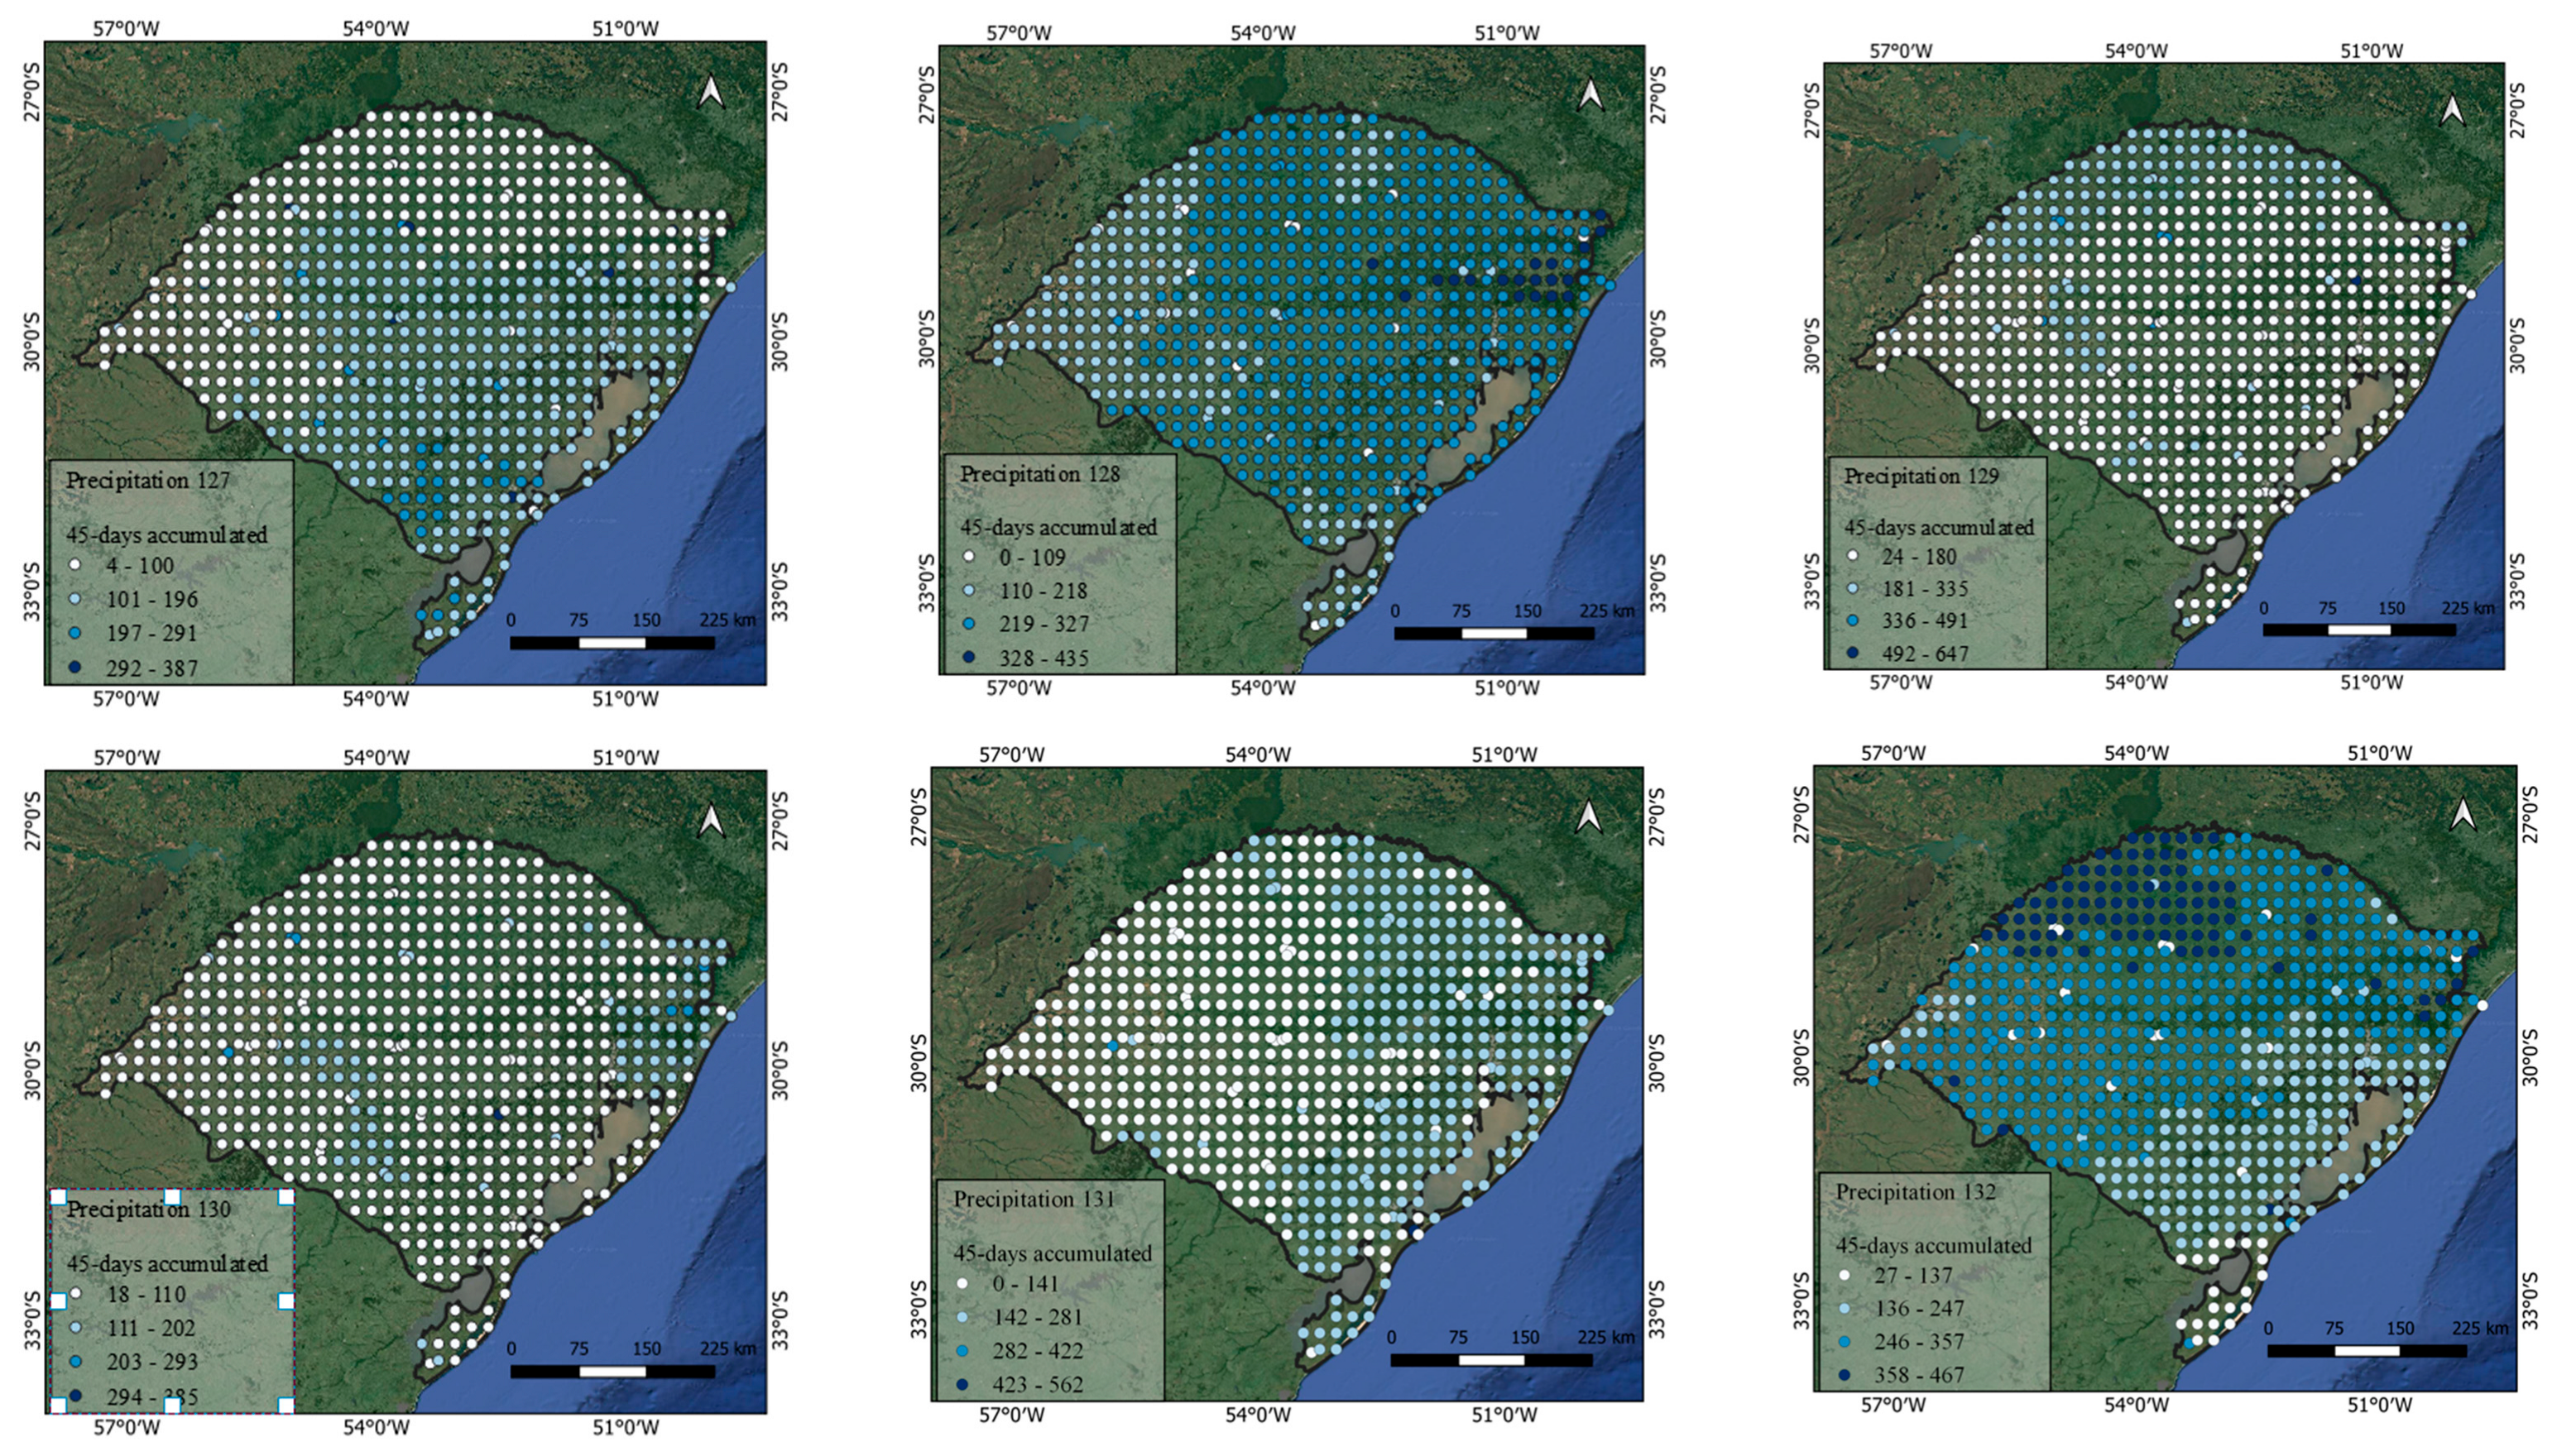
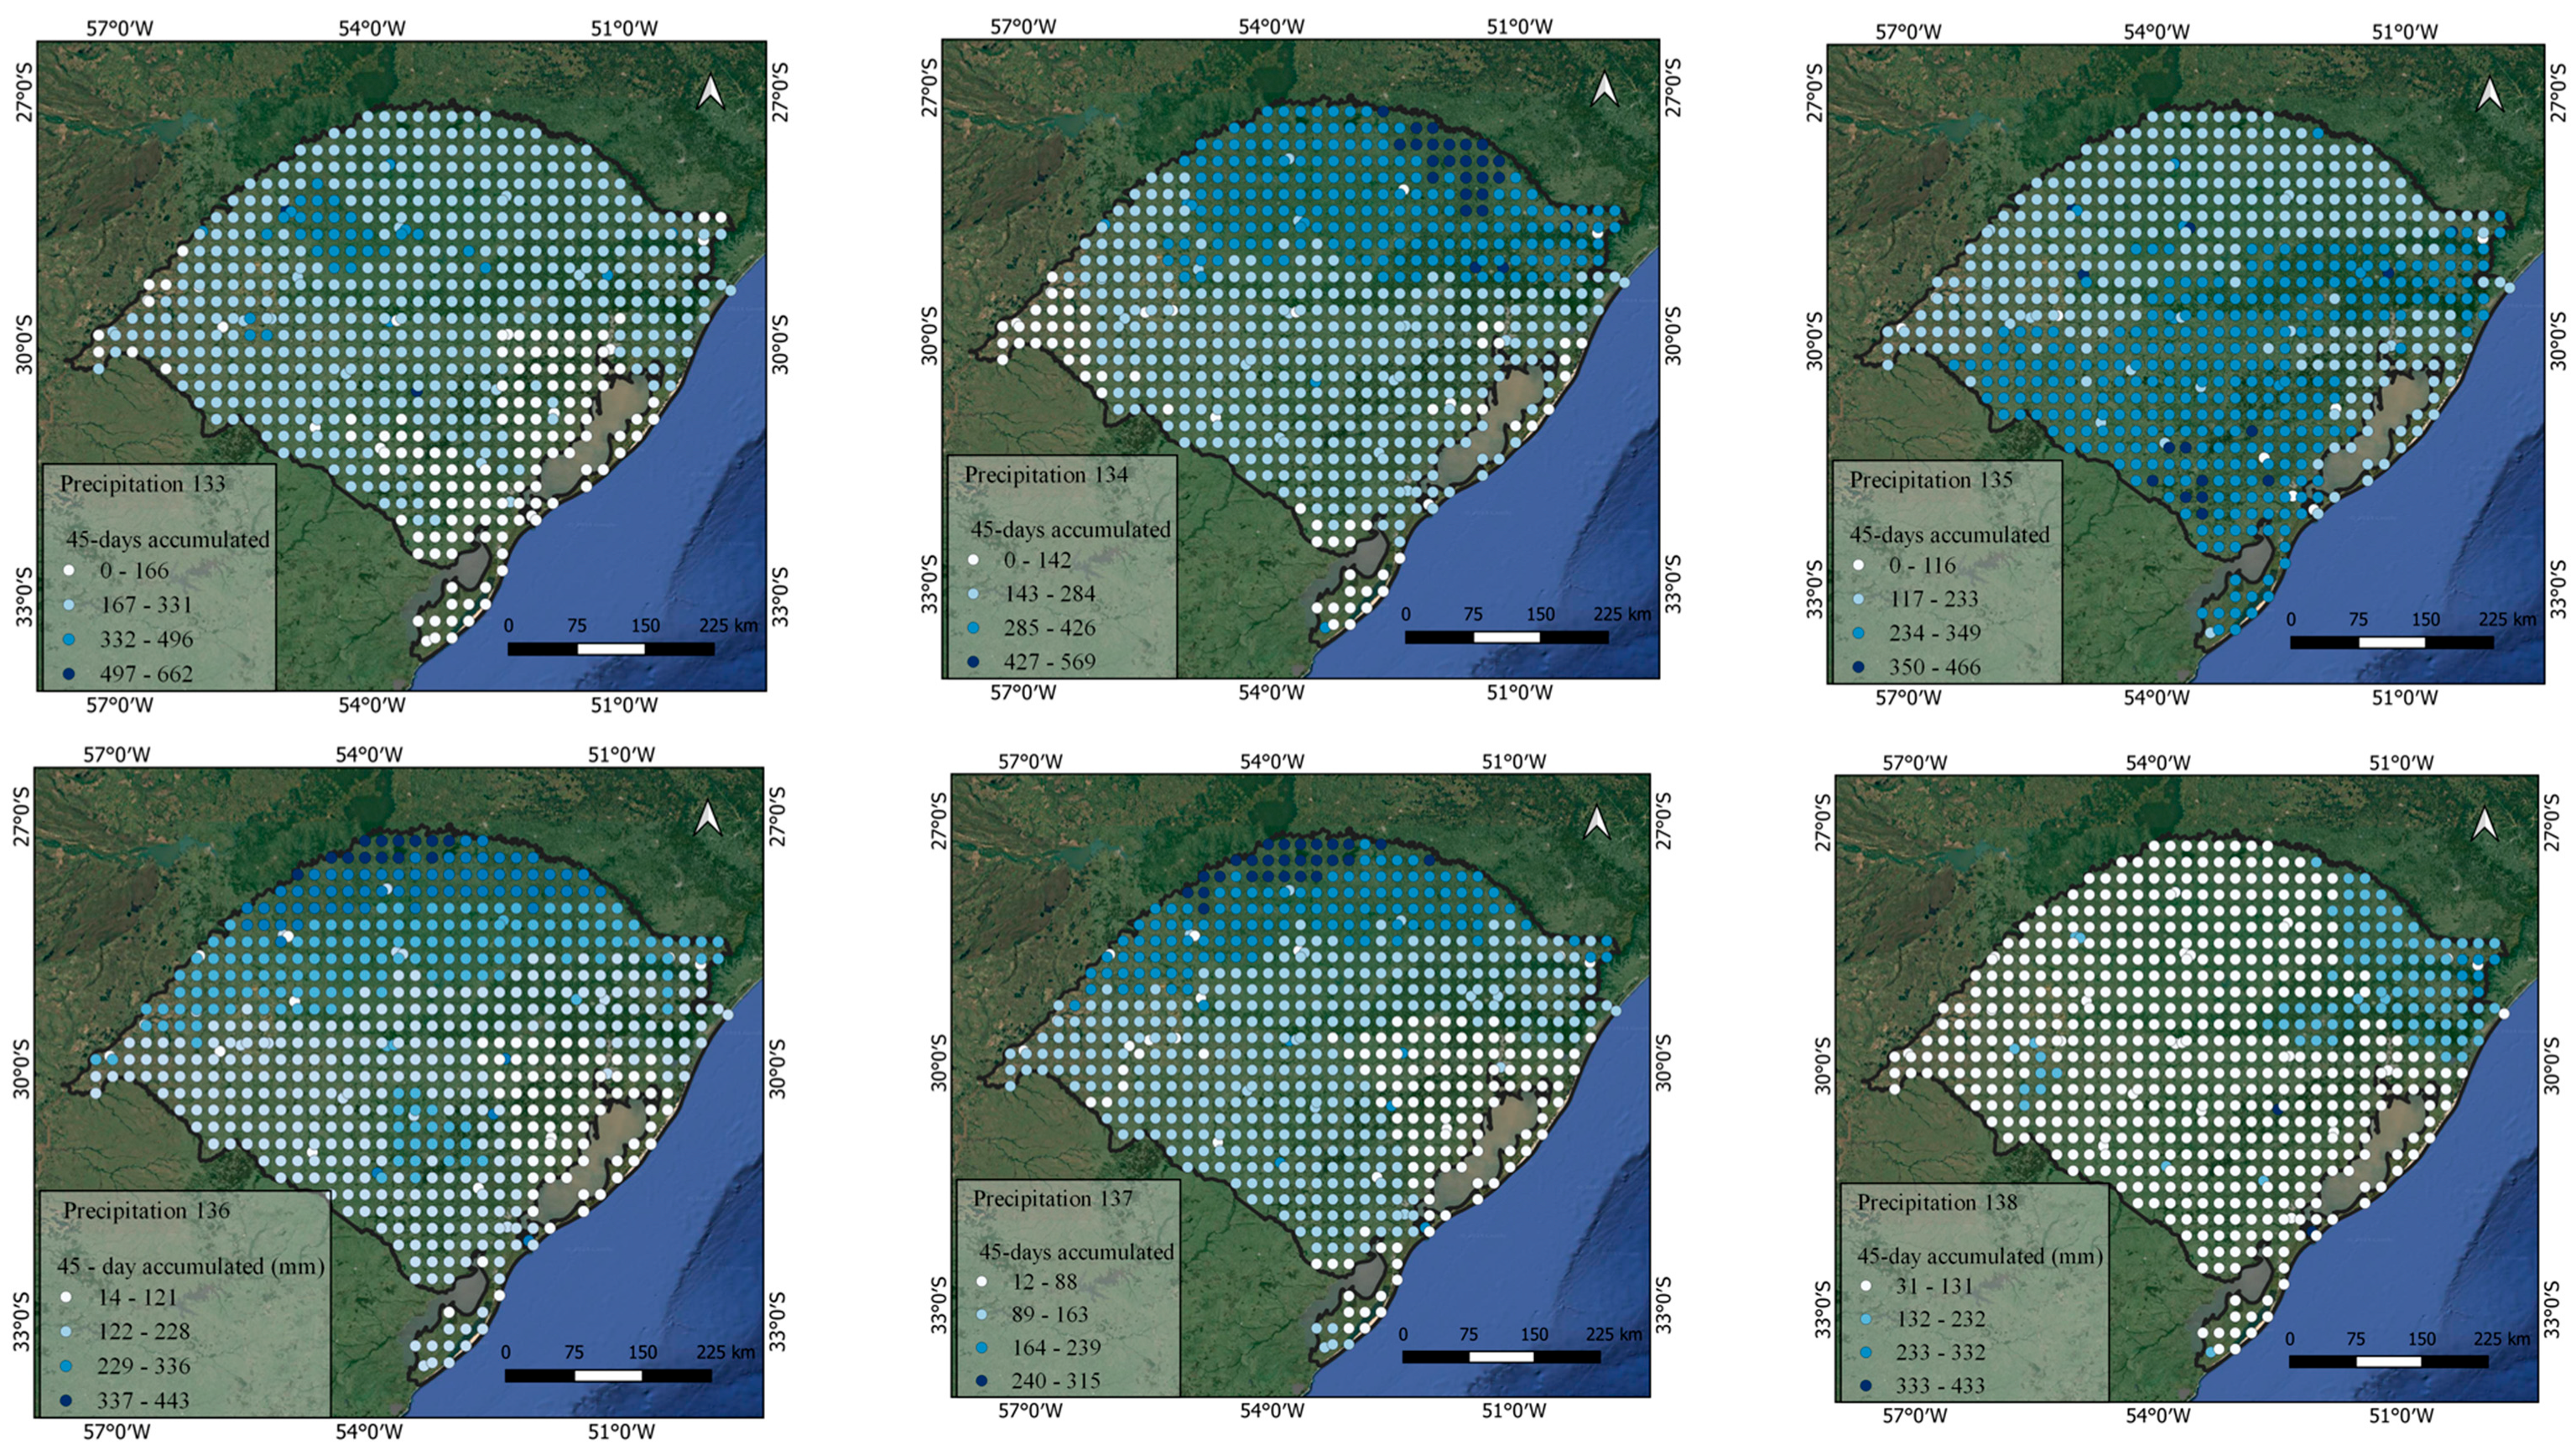
We generated 138 spatialized precipitation maps (Appendix A), each representing a 45-day accumulation, and compared them to the Oceanic Niño Index (ONI). This allowed for an exploratory assessment of ENSO phases and their relation to rainfall anomalies (Table 1). Consistent with the literature, El Niño events were generally associated with increased precipitation in many parts of Rio Grande do Sul, while La Niña tended to reduce rainfall in some areas.

Table 1.
Oceanic Niño Index (ONI)—Periods of Warm and Cold Anomalies (2006–2022). The classification of El Niño (warm phase) and La Niña (cold phase) periods was based on the ONI values provided by NOAA. The comparison between ONI phases and regional precipitation patterns was carried out through a visual inspection of the 45-day accumulated precipitation anomaly maps presented in Appendix A. This approach allowed for the identification of potential associations between ENSO phases and spatiotemporal rainfall variability in Rio Grande do Sul.
For example, during the period July–August 2013, the expected relationship between ONI and rainfall was not observed, reflecting the influence of other climate drivers such as MJO, SACZ displacements, and SAM fluctuations. This finding is critical and aligns with a more nuanced, modern understanding of ENSO impacts. As [10,26] have extensively documented, ENSO’s influence is not a simple, monolithic switch for wet or dry conditions. Instead, ENSO teleconnections create complex spatial patterns, often inducing a dipole of precipitation anomalies over South America, with opposite effects in southeastern South America (including RS) versus the core SACZ region to the north. The strength and position of this dipole are highly sensitive to the specific characteristics of the ENSO event itself (e.g., Central vs. Eastern Pacific El Niño) and its interaction with other climate modes like the MJO and SAM/AAO.
Therefore, multi-scale frameworks are essential for understanding these deviations. Specific cases were observed (Appendix A): In late 2006 (Case 5), precipitation increased across much of the state except the far west. This pattern intensified in Cases 6–8, reaching up to 589 mm/45 days. The 2009 El Niño (Cases 29–32) brought successive increases, peaking at 674 mm/45 days with rainfall shifting from northeast to western regions. This observed westward shift is a compelling example of the evolving spatial expression of ENSO’s influence during an event, consistent with the dynamic dipole pattern described by [10].
Between 2014 and 2016 (Cases 72–82), during a strong El Niño, maximum rainfall exceeded 900 mm/45 days in the central-north, the highest recorded in the series. In contrast, weaker El Niño events (2018–2019) showed limited influence, underscoring the non-linearity of ENSO impacts. This nonlinearity is a key feature of the climate system; the atmospheric response to SST anomalies is not always proportional, and weak oceanic forcing can be easily overridden by regional circulation or other modes of variability.
These observations reinforce the findings by [25,27,28], who point to the importance of local relief, ocean–atmosphere feedbacks, and anthropogenic warming in shaping rainfall variability. This spatial heterogeneity affects water availability and poses challenges for agricultural and urban resilience.
3.4. Autocorrelation Analysis of Precipitation
Autocorrelation analyses were conducted for all 670 precipitation time series (Figure 4). This analysis measures the similarity of a time series with a time-shifted version of itself, providing insights into the persistence of precipitation anomalies.
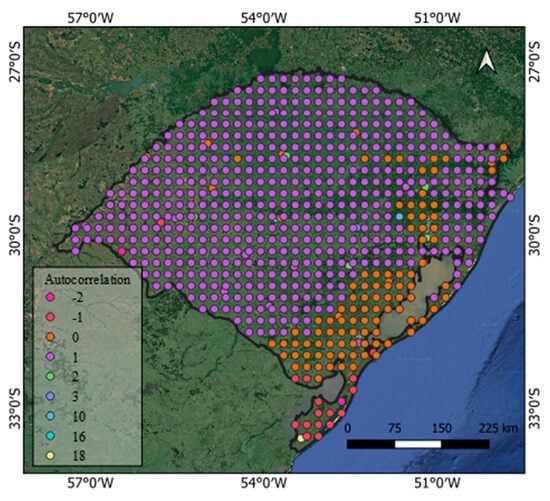
Figure 4.
Autocorrelation analysis of subseasonal 45-day historical time series for individual points across Rio Grande do Sul.
A significant positive temporal autocorrelation was detected at lag 1 (i.e., 45 days) in much of the central, northern, and western regions. This suggests persistence in rainfall behavior between successive 45-day intervals. This statistical “memory” in the precipitation series is likely rooted in slowly varying components of the climate system. Potential physical mechanisms include soil moisture feedbacks, where wet conditions in one period enhance evapotranspiration and atmospheric moisture, preconditioning the environment for continued rainfall in the next period. Another driver is the persistence of large-scale oceanic and atmospheric states, such as quasi-stationary anomalies in the SASH position or slowly evolving sea surface temperatures in the South Atlantic.
Some regions, especially in the south, exhibited negative temporal autocorrelation at lag 2 (90 days), with correlation coefficients reaching approximately −0.45. This implies an inverse relationship with rainfall observed 90 days earlier, suggesting a quasi-oscillatory behavior on this timescale. While speculative, this could reflect the lifecycle of dominant intraseasonal oscillations like the MJO, where an active, wet phase is often followed by a suppressed, dry phase approximately 45–60 days later, which would manifest as a negative correlation at a lag of ~90 days.
Crucially, these autocorrelation patterns are the statistical foundation for predictability on subseasonal timescales. The presence of significant autocorrelation means that knowledge of the current 45-day precipitation total provides statistically meaningful information about the next 45-to-90 days, offering predictive skill beyond simple climatology. This directly addresses the so-called “predictability desert” between short-term weather forecasting and long-term seasonal outlooks.
These autocorrelation patterns are important for improving precipitation forecasting. They indicate how much current rainfall conditions can inform future periods. By quantifying this persistence, this study provides an empirical basis for the development of regional subseasonal-to-seasonal (S2S) forecast models, a high-priority area of research highlighted by studies such as [11,17].
Highly autocorrelated locations are especially valuable for short-to-medium-range predictions [29] that can inform critical decisions in water management and agriculture.
3.5. Multiple Spatio-Temporal Analysis with Precipitation Anomaly Index
The application of PCA and the standardized precipitation index (SPI) allowed us to capture dominant patterns of variability. The Kaiser–Meyer–Olkin (KMO) test presented a coefficient of 0.909, indicating high adequacy for the analysis. Bartlett’s sphericity test confirmed the significance of the correlations between the variables (χ2 = 187,990.945; p < 0.05). These results demonstrate that there is a latent structure in the data, justifying the use of multivariate techniques to understand the main factors that explain the variability in subseasonal precipitation over time and space in Rio Grande do Sul.
When analyzing the amount of variance explained by each main component in the factor analysis (Table 2), seven main components were identified that explain the most significant phenomena in the historical series.

Table 2.
Factor analysis with principal component extraction of subseasonal 45-day cumulative precipitations, highlighting significant factor loadings in bold. The factor analysis was applied to identify dominant patterns of precipitation variability across the 670 points in Rio Grande do Sul. The interpretation of each factor was supported by a visual comparison between the spatial distribution of factor scores and the precipitation anomaly maps shown in Appendix A. This allowed associating the temporal behavior of each factor with specific rainfall patterns and possible teleconnections with large-scale climate drivers.
The first component (PC1) explains around 26% of the total variance, standing out as the most influential in the historical series. The factor loadings of PC1, together with the standardized precipitation anomaly index (Figure 5), showed a predominance of points classified as approximately normal to normal in most of the periods analyzed. However, case 68 (4 April 2014 to 18 May 2014), which has the highest factor loading (0.9) in PC1, presents a concentration of points more intensely classified as extremely humid and very humid (SPI > 2.0), mainly in the central-north and northeast region of the state (Figure 5). This dominant mode can be interpreted physically as the signature of widespread, extreme rainfall events driven by the constructive interference of multiple large-scale drivers. Such a pattern likely represents the “perfect storm” scenario for the region, where a strong El Niño provides abundant large-scale moisture, an active phase of the MJO enhances convection, and a well-positioned SACZ efficiently channels this moisture into southern Brazil. The fact that a single mode explains over a quarter of the total variance suggests that the most impactful, widespread flood events in RS are not random but are governed by this specific, recurring combination of atmospheric conditions.
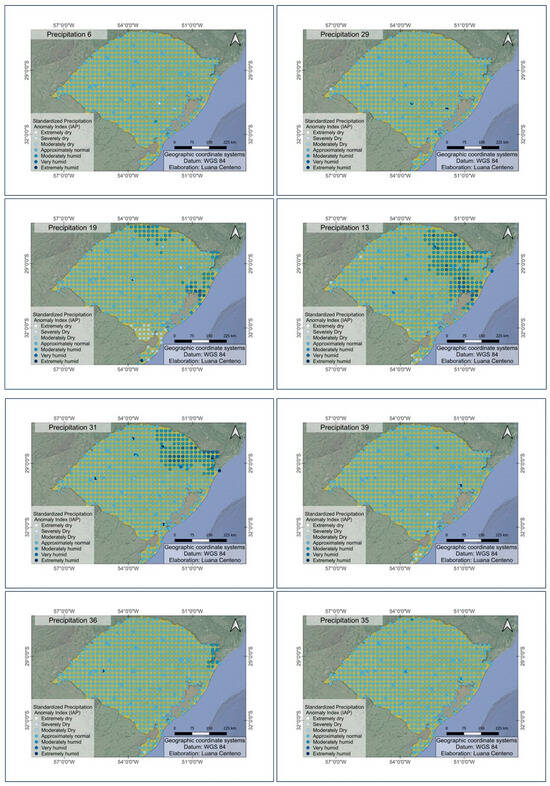
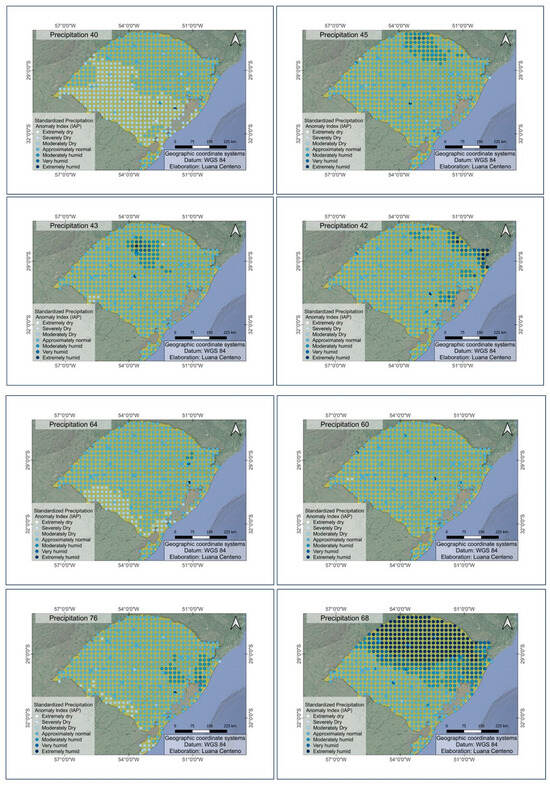
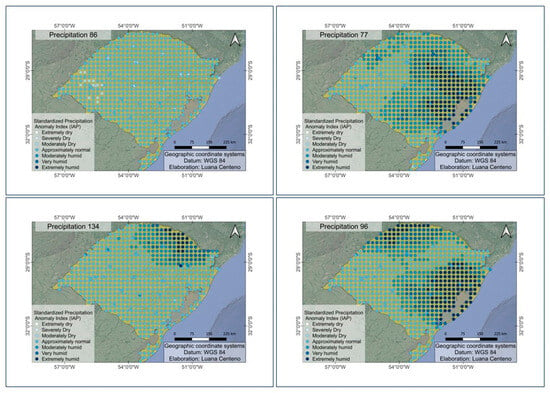
Figure 5.
Spatial analysis of 45-day subseasonal precipitation, exhibiting the greatest influence in the historical series based on factor loadings.
The second principal component (PC2) explains 15% of the global variance and is represented by 11 factor loadings of subseasonal cases. It is observed that, although the factor loadings of PC2 and the following ones increase the explanation and there is importance of these components in the overall variance, the subsequent main components are smaller in explained variance compared to PC1. Therefore, in Figure 6, the standardized spatialized indices of precipitation anomalies of only the largest factor loadings of each principal component after PC1 are presented.
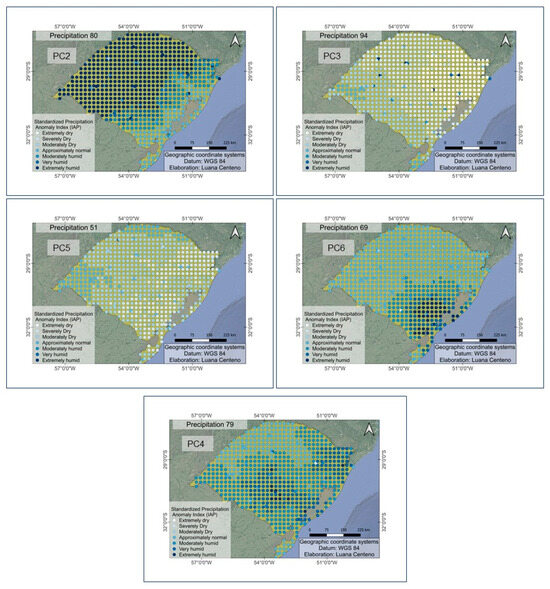
Figure 6.
Spatial analysis of 45-day subseasonal precipitation, showing the greatest influence on the historical series based on the factor loadings of each principal component.
The highest factor loadings of the subsequent components (Table 2) showed a less homogeneous spatial distribution of precipitation compared to PC1. Except for precipitation 80 (26 September 2015 to 9 November 2015), which predominated in the extremely humid category in the central-west, northeast, and north regions, the other components showed more diverse classifications. PC3 was characterized as extremely dry in most of the sampling points, mainly covering the central region towards the north and east. This mode may represent periods of atmospheric blocking, potentially associated with an anomalously strong and westward-displaced SASH, which suppresses convection and moisture inflow, a mechanism known to cause droughts in southeastern Brazil.
PC4, despite oscillating between different classifications, concentrated humidity in the southern region, like PC6, which also presented this distinctive pattern. These dipole-like patterns, with anomalies concentrated in the south, could reflect shifts in the subtropical jet and storm tracks associated with phases of the southern annular mode (SAM), or they may represent the canonical ENSO-induced rainfall dipole over South America.
Finally, PC7, although relevant in the general variance, did not exhibit a significant factorial load in the analysis, indicating that all precipitation influenced this component in a similar way.
These findings reveal regionally specific behavior: while some areas are prone to recurring extreme rainfall (e.g., northeast, central-west), others experience persistent dry periods. Understanding these components helps anticipate drought and flood risks. According to [28,29,30,31,32], such multivariate techniques help link rainfall anomalies to broader atmospheric circulation regimes. By providing a physical interpretation for these statistical modes, the PCA transitions from a simple data reduction technique to a powerful diagnostic tool for identifying the key climate regimes that govern subseasonal precipitation variability in the region.
Future work could explore how individual components relate to MJO phases, SACZ position shifts, SAM variability, and warming trends under climate change scenarios. Implications for water resource management, agriculture, and public policy are significant. Results highlight vulnerable areas where tailored mitigation strategies are needed to adapt to increasing precipitation variability.
4. Conclusions
This study identified distinct spatio-temporal patterns in subseasonal precipitation over Rio Grande do Sul from 2006 to 2022, using 45-day accumulated rainfall intervals. The analysis demonstrated the value of this temporal scale in capturing submonthly variability influenced by large-scale phenomena such as ENSO, MJO, SACZ, and SAM, as well as local topographic and synoptic effects. More importantly, the study elucidated the physical mechanisms connecting these drivers to the observed patterns, moving beyond statistical description to a more integrated, dynamic understanding.
A key finding is the mechanistic explanation for the state’s primary spatial precipitation gradient: the interaction between the moisture-advecting South Atlantic Subtropical High and the orographic barrier of the Serra Gaúcha creates a persistent wet zone in the northeast, while inland regions remain comparatively drier and more variable. The association between the Oceanic Niño Index (ONI) and precipitation revealed that El Niño events generally favored increased rainfall in parts of the state, especially in the northeast and central-west. However, this relationship was not consistent across all events or regions. The analysis highlighted the nonlinear and heterogeneous nature of ENSO’s influence, which is modulated by the specific type of ENSO event and its interaction with other climate modes, often manifesting as a complex dipole of anomalies across the continent. Some El Niño periods showed modest or even atypical precipitation behavior, reinforcing the need to avoid simplistic generalizations such as “El Niño increases rainfall.” La Niña events, in turn, were often—but not always—associated with reduced rainfall in specific areas, highlighting the role of interacting drivers.
Temporal autocorrelation patterns indicated that, in several regions, rainfall anomalies tend to persist for up to 45 or 90 days, providing important insights for short- and medium-term prediction strategies. Crucially, this demonstrated persistence provides a statistical and physical basis for subseasonal-to-seasonal (S2S) predictability, suggesting that skillful forecasts on this critical timescale are achievable for the region.
The PCA results revealed latent structures that explain the major precipitation regimes observed over time and space. These components were interpreted not as mere statistical artifacts, but as physically meaningful climate modes representing distinct atmospheric states, such as the “perfect storm” scenario of constructively interfering drivers (PC1) or widespread drought associated with atmospheric blocking (PC3). These components captured signals related to both extreme rainfall and droughts and offer a statistical basis for associating precipitation behavior with regional atmospheric circulation patterns.
Beyond climatological insight, these findings offer practical implications. The results support improvements in agricultural planning, by anticipating regions prone to extreme events or persistent droughts; water resource management, through identification of areas with recurrent hydrological stress; and public policy and climate adaptation, by highlighting the influence of sub-seasonal drivers and global warming trends on regional hydrometeorological risks. The identification of recurring, physically driven climate models and demonstrable subseasonal persistence provides a scientific foundation for developing the next generation of tailored S2S forecasting tools, which are essential for building resilience in a changing climate.
This study underscores the importance of adopting multi-scale, integrated approaches in climate analysis, combining robust statistical techniques with physical understanding of atmospheric processes. The 45-day temporal resolution proves valuable for the monitoring and forecasting in a changing climate. Future research should deepen the integration of PCA outputs with atmospheric circulation indices and model-based forecasts, as well as expand the analysis to include projected climate scenarios to better inform regional adaptation strategies.
Author Contributions
Conceptualization, L.C.C., A.M.d.A. and A.B.N.; methodology, L.C.C. and A.M.d.A.; formal analysis, L.C.C. writing—original draft preparation, L.C.C. and A.B.N.; writing—review and editing, L.C.C., T.M.S. and A.B.N.; supervision, A.B.N. and T.M.S. All authors have read and agreed to the published version of the manuscript.
Funding
This study was financed in part by the Coordination for the Improvement of Higher Education Personnel—Brazil (CAPES)—n° 88881.749062/2022-01.
Data Availability Statement
The data presented in this study are available on request from the corresponding author. The data are not publicly available due to privacy.
Conflicts of Interest
The authors declare no conflicts of interest.
Appendix A. Spatial Distribution of Precipitation During the Studied Periods
 |
 |
 |
 |
 |
 |
 |
 |
 |
 |
 |
 |
 |
 |
 |
 |
 |
 |
 |
 |
 |
 |
 |
Appendix B. Google Earth Engine (GEE) Script Used to Extract the CHIRPS Precipitation Time Series
| // Região de interesse |
| var RS = ee.FeatureCollection(‘users/luananunescenteno/RS_Inteiro’); |
| // Dados chuvas |
| var prec = ee.ImageCollection(“UCSB-CHG/CHIRPS/DAILY”) |
| .filterDate(‘xxxxx′, ‘xxxxxx′) |
| .map(function(image) { |
| return image.clip(RS); |
| }); |
| // Função para calcular a soma a cada 45 dias |
| var calculateSumEvery45Days = function(startDate) { |
| var endDate = startDate.advance(45, ‘day’); |
| var filteredPrecipitation = prec.filterDate(startDate, endDate); |
| var sumPrecipitation = filteredPrecipitation.sum(); |
| return sumPrecipitation.set(‘system:time_start’, startDate.millis()); |
| }; |
| // Definir intervalo de datas |
| var startDate = ee.Date(‘xxxxxxx′); |
| var endDate = ee.Date(‘xxxxxx′); |
| var interval = xxxxx*xxxx*xxxx 1000;//Intervalo em milissegundos |
| var dateList = ee.List.sequence(startDate.millis(), endDate.millis(), interval); |
| // Mapear a função sobre a lista de datas e criar a coleção de imagens das somas |
| var precipitation_sum_45days = ee.ImageCollection.fromImages( |
| dateList.map(function(time) { |
| var startDate = ee.Date(time); |
| var endDate = startDate.advance(45, ‘day’); |
| return calculateSumEvery45Days(startDate); |
| }) |
| ); |
| // Definição dos parâmetros de visualização |
| var visParams = { |
| palette: [‘red’, ‘orange’, ‘yellow’, ‘green’, ‘blue’], |
| min: 80, |
| max: 380 |
| }; |
| // Adicionar as imagens de soma a cada 45 dias ao mapa |
| Map.addLayer(precipitation_sum_45days, visParams, ‘Precipitation Sum’); |
| // Exportar imagens de soma a cada 45 dias |
| var imageCount = precipitation_sum_45days.size().getInfo(); |
| // Dentro do loop de exportação |
| for (var index = 0; index < imageCount; index++) { |
| var img = ee.Image(precipitation_sum_45days.toList(imageCount).get(index)); |
| var description = ‘imagem’ + (index + 1); |
| // Configurar parâmetros de exportação |
| var exportParams = { |
| image: img, |
| description: description, |
| folder: “” |
| fileNamePrefix: description, |
| crs: ‘EPSG:3857′, |
| scale: 5000, |
| maxPixels: 1e13, |
| fileFormat: ‘GeoTIFF’ |
| }; |
| // Iniciar a tarefa de exportação |
| Export.image.toDrive(exportParams); |
| print(‘Exporting:‘, description); |
| } |
References
- Raihan, A. A review of the global climate change impacts, adaptation strategies, and mitigation options in the socio-economic and environmental sectors. J. Environ. Sci. Econ. 2023, 2, 36–58. [Google Scholar] [CrossRef]
- Abebe, W.T.; Endalie, D. Artificial intelligence models for prediction of monthly rainfall without climatic data for meteorological stations in Ethiopia. J. Big Data 2023, 10, 1147–1158. [Google Scholar] [CrossRef]
- Hussain, M.A.; Shuai, Z.; Moawwez, M.A.; Umar, T.; Iqbal, M.R.; Kamran, M.; Muneer, M. A Review of Spatial Variations of Multiple Natural Hazards and Risk Management Strategies in Pakistan. Water 2023, 15, 407. [Google Scholar] [CrossRef]
- Sobel, A.H.; Kim, D.; Lin, H.; Zhang, C. The Madden–Julian Oscillation: A window into the subseasonal prediction problem. Bull. Am. Meteorol. Soc. 2024, 105, E1449–E1466. [Google Scholar] [CrossRef]
- Lin, H.; Zhang, C.; Chen, M.; Kim, D. Madden–Julian Oscillation. In Subseasonal to Seasonal Prediction: The Gap Between Weather and Climate; Elsevier: Amsterdam, The Netherlands, 2025; pp. 325–342. [Google Scholar] [CrossRef]
- Alvalá, R.C.S.; Ribeiro, D.F.; Marengo, J.A.; Seluchi, M.E.; Gonçalves, D.A.; da Silva, L.A.; Pineda, L.A.C.; Saito, S.M. Analysis of the hydrological disaster occurred in the state of Rio Grande do Sul, Brazil in September 2023: Vulnerabilities and risk management capabilities. Int. J. Disaster Risk Reduct. 2024, 110, 104645. [Google Scholar] [CrossRef]
- Arruda, A.M.; de Centeno, L.N.; Nunes, A.B. Relation between major climatic indices and subseasonal precipitation in Rio Grande do Sul State, Brazil. Meteorology 2025, 4, 5. [Google Scholar] [CrossRef]
- Pillar, V.D.; Overbeck, G.E. Learning from a climate disaster: The catastrophic floods in southern Brazil. Science 2024, 385, eadr8356. [Google Scholar] [CrossRef]
- Rizzotto, M.L.F.; Costa, A.M.; Lobato, L.d.V.d.C. Climate crisis and new challenges for health systems: The case of floods in Rio Grande do Sul/Brazil. Saúde Em Debate 2024, 48, e141ED. [Google Scholar] [CrossRef]
- Grimm, A.M.; Zilli, M.T. Interannual variability and seasonal evolution of summer monsoon rainfall in South America. J. Clim. 2009, 22, 2257–2275. [Google Scholar] [CrossRef]
- Coelho, C.A.S.; Firpo, M.A.F.; de Andrade, F.M. A verification framework for South American sub-seasonal precipitation predictions. Meteorol. Z. 2018, 27, 503–520. [Google Scholar] [CrossRef]
- Scheuerer, M.; Switanek, M.B.; Worsnop, R.P.; Hamill, T.M. Using artificial neural networks for generating probabilistic subseasonal precipitation forecasts over California. Mon. Weather. Rev. 2020, 148, 3489–3506. [Google Scholar] [CrossRef]
- Zhang, C.; Lin, H.; Chen, M.; Kim, D. Advances in understanding the Madden–Julian Oscillation. Adv. Atmos. Sci. 2025, 42, 1045–1063. [Google Scholar] [CrossRef]
- Zhou, S.; L’Heureux, M.; Weaver, S.; Kumar, A. A composite study of the MJO influence on the surface air temperature and precipitation over the Continental United States. Clim. Dyn. 2012, 38, 1459–1471. [Google Scholar] [CrossRef]
- Hidayat, R. Modulation of Indonesian rainfall variability by the Madden–Julian Oscillation. Procedia Environ. Sci. 2016, 33, 167–177. [Google Scholar] [CrossRef]
- Lee, J.-Y.; Fu, X.; Wang, B. Predictability and prediction of the Madden-Julian Oscillation: A review on progress and current status. In The Global Monsoon System; World Scientific: Singapore, 2017; pp. 147–159. [Google Scholar] [CrossRef]
- Badagian, J.; Barreiro, M.; Saurral, R.I. Evaluation of subseasonal precipitation forecasts in the Uruguay River basin. Int. J. Climatol. 2024. advance online publication. [Google Scholar] [CrossRef]
- Bergamaschi, H.; Wheeler, T.R.; Challinor, A.J.; Comiran, F.; Heckler, B.M.M. Maize yield and rainfall on different spatial and temporal scales in Southern Brazil. Pesqui. Agropecuária Bras. 2007, 42, 603–613. [Google Scholar] [CrossRef]
- Alam, J.; Saha, P.; Mitra, R.; Das, J. Investigation of spatio-temporal variability of meteorological drought in the Luni River Basin, Rajasthan, India. Arab. J. Geosci. 2023, 16, 1–22. [Google Scholar] [CrossRef]
- Grimm, A.M.; Padoan, D. Explaining Climate Change in South America. 2025. Available online: https://meetingorganizer.copernicus.org/EGU25/EGU25-979.html (accessed on 15 March 2025).
- Funk, C.; Peterson, P.; Landsfeld, M.; Pedreros, D.; Verdin, J.; Shukla, S.; Husak, G.; Rowland, J.; Harrison, L.; Hoell, A.; et al. The climate hazards infrared precipitation with stations—A new environmental record for monitoring extremes. Sci. Data 2015, 2, 150066. [Google Scholar] [CrossRef]
- Atlas Socioeconômico do Rio Grande do Sul. 2025. Available online: https://cidades.ibge.gov.br/brasil/rs/panorama (accessed on 15 March 2025).
- Kuinchtner, A.; Buriol, G.A. Clima do Estado do Rio Grande do Sul segundo a classificação climática de Köppen e Thornthwaite. Discip. Sci. Nat. E Tecnológicas 2001, 2, 171–182. Available online: https://periodicos.ufn.edu.br/index.php/disciplinarumNT/article/view/1136/1077 (accessed on 15 March 2025).
- McKee, T.B.; Doesken, N.J.; Kleist, J. The Relationship of Drought Frequency and Duration to Time Scales. In Proceedings of the Eighth Conference on Applied Climatology, Anaheim, CA, USA, 17–22 January 1993; pp. 179–183. Available online: https://www.droughtmanagement.info/literature/AMS_Relationship_Drought_Frequency_Duration_Time_Scales_1993.pdf (accessed on 15 March 2025).
- Alemu, M.M.; Bawoke, G.T. Analysis of spatial variability and temporal trends of rainfall in Amhara region, Ethiopia. J. Water Clim. Change 2020, 11, 1505–1520. [Google Scholar] [CrossRef]
- Cai, W.; McPhaden, M.J.; Grimm, A.M.; Rodrigues, R.R.; Taschetto, A.S.; Garreaud, R.D.; Dewitte, B.; Poveda, G.; Ham, Y.-G.; Santoso, A. Climate impacts of the El Niño–Southern Oscillation on South America. Nat. Rev. Earth Environ. 2020, 1, 215–231. [Google Scholar] [CrossRef]
- Silva, A.S.A.; Menezes, R.S.C.; Rosso, O.A.; Stosic, B.; Stosic, T. Complexity entropy-analysis of monthly rainfall time series in northeastern Brazil. Chaos Solitons Fractals 2021, 143, 110623. [Google Scholar] [CrossRef]
- Fahad, S.; Su, F.; Khan, S.U.; Naeem, M.R.; Wei, K. Implementing a novel deep learning technique for rainfall forecasting via climatic variables: An approach via hierarchical clustering analysis. Sci. Total Environ. 2023, 854, 15. [Google Scholar] [CrossRef] [PubMed]
- Santos, C.A.C.; dos Neale, C.M.U.; Mekonnen, M.M.; Gonçalves, I.Z.; Oliveira, G.; de Ruiz-Alvarez, O.; Safa, B.; Rowe, C.M. Trends of extreme air temperature and precipitation and their impact on corn and soybean yields in Nebraska, USA. Theor. Appl. Climatol. 2022, 147, 1379. [Google Scholar] [CrossRef]
- Tripathy, K.P.; Mukherjee, S.; Mishra, A.K.; Mann, M.E.; Williams, A.P. Climate change will accelerate the high-end risk of compound drought and heatwave events. Proc. Natl. Acad. Sci. USA 2023, 120, e2219825120. [Google Scholar] [CrossRef]
- Huang, B.; Thorne, P.W.; Banzon, V.F.; Boyer, T.; Chepurin, G.; Lawrimore, J.H.; Menne, M.J.; Smith, T.M.; Vose, R.S.; Zhang, H.-M. Extended Reconstructed Sea Surface Temperature Version 5 (ERSSTv5): Upgrades, validations, and intercomparisons. J. Clim. 2017, 30, 8179–8205. [Google Scholar] [CrossRef]
- Pathak, H. Impact, adaptation, and mitigation of climate change in Indian agriculture. Environ. Monit. Assess. 2022, 195, 1–22. [Google Scholar] [CrossRef]
Disclaimer/Publisher’s Note: The statements, opinions and data contained in all publications are solely those of the individual author(s) and contributor(s) and not of MDPI and/or the editor(s). MDPI and/or the editor(s) disclaim responsibility for any injury to people or property resulting from any ideas, methods, instructions or products referred to in the content. |
© 2025 by the authors. Licensee MDPI, Basel, Switzerland. This article is an open access article distributed under the terms and conditions of the Creative Commons Attribution (CC BY) license (https://creativecommons.org/licenses/by/4.0/).