Abstract
This study examines a convergence event at the trailing end of a cold front observed in the United States’ Southern Great Plains region on 28 September 1997, using an array of in situ and remote sensing instruments. The event exhibited a structure with elevated divergence near 3 km AGL and moisture transport over both warm and cold sectors. Data from Raman lidar (RL), Atmospheric Emitted Radiance Interferometer (AERI), and Radar Wind Profilers (RWP) were used to characterize vertical profiles of the event, revealing the presence of a narrow moist updraft, horizontal moisture advection, and cloud development ahead of the front. Convection parameters, Convective Available Potential Energy (CAPE) and Convective Inhibition (CIN), were derived from collocated AERI and RL. Regions of high CAPE were aligned with areas of high moisture, indicating that convection was more favorable at moist elevated levels than near the surface. RWP observations revealed vorticity structures consistent with existing theories. This study highlights the value of high-resolution, continuous profiling from remote sensors to resolve mesoscale processes and evaluate convection potential. The event underscores the role of elevated moisture and wind shear in modulating convection initiation along a trailing-end cold front boundary where mesoscale and synoptic forces interact.
1. Introduction
The southernmost end of a cold front in the Northern Hemisphere (or the northernmost end in the Southern Hemisphere), referred to as the trailing portion, is often situated hundreds to thousands of kilometers away from its associated low-pressure center. In this region, some frontal boundary characteristics are present; however, the convergence region can also be influenced by mesoscale forcing mechanisms acting alongside broader synoptic-scale processes. This study utilizes a robust dataset of in situ and ground-based remote sensing observations to highlight a well-observed convergence case in the trailing portion of an expansive cold front in the central United States.
The convergence observed in this case study was embedded in a large cold frontal structure, although the trailing region of the front observed in this case was more heavily influenced by mesoscale processes than the portion of the front to its north. The trailing portion of the front features a weaker surface temperature gradient and is more likely to be modulated by, and to affect, mesoscale-driven surface convergence and boundary layer interactions. A notable example of these mesoscale interactions observed during the event discussed in this study is the balanced divergence near the top of its updraft region, approximately 3 km above ground level (AGL). This elevated divergence facilitated the horizontal transport of water vapor over both the warm sector and cold sectors, rather than favoring advection primarily over the cold sector, as would be expected near the portion of the frontal boundary closest to the low-pressure center. This phenomenon will be discussed in later sections using time–height cross-sections of remote sensing observations collected during the event, which display thermodynamic quantities and derived convection indices.
Despite the frequent occurrence and impacts from the front’s trailing end, it is not highly discussed in the literature. This case study is of particular interest due to the extensive data collected from a variety of remote sensing instruments—a level of detail only available during intensive observation periods and field campaigns. It also served as partial motivation for the International H20 (IHOP) field campaign and provides a clear example of the interactions between a synoptic-scale frontal boundary and mesoscale boundary-layer convergence zone features.
1.1. Convergence Theories
Modern theories of convection initiation and system maintenance largely stem from the widely accepted RKW theory [1], hereafter RKW88, which explains how quasi-linear mesoscale convective systems (QLCSs) maintain themselves over extended periods. RKW88 argues the optimal conditions for new cells to grow as old cells decay occurs when circulations from cold pool outflows () and vertical wind shear () are opposed and balanced, yielding deep vertical updrafts. RKW88 further demonstrated that restricting moderate-to-strong wind shear to low levels favors long-lived systems. Weisman and Rotunno [2], hereafter WR04, added to the theory that while long-lived (but weaker) squall lines are observed in environments where the relative strengths of and impact system organization. However, WR04’s concept is still valuable for describing storm system properties.
The role of upper-level (free tropospheric and lower stratospheric) wind shear has been a topic of discussion following RKW88 and WR04. Shapiro [3] used an analytical 2D model to show how strong, deep-tropospheric shear decreases the vertical velocity of parcels and increases the vertical displacement of parcels due to longer residence times in the region of upward vertical motion. However, the applicability of Shapiro’s study was limited by its unique setup and constraints (exponential decrease in shear with height and the density current’s fixed barrier). Stensrud et al. [4] commented on the significance of RKW88 and WR04’s argument (the vorticity balance between the cold pool and environmental wind shear is key to producing a balanced and deep vertical updraft: ). They found a high correlation between and , or in other words, there was little variability in . Additionally, when evaluating observed squall line cases, no hint of a linear relationship was shown to exist between and 0–2 km shear. Coniglio et al. [5] explored the relationship between upper-level shear and strong QLCSs. Unlike previous studies, they used a fixed low-level shear magnitude for all study cases to isolate the impacts from the upper-level shear profile. Their research concluded that upper-level shear, when working in tandem with low-level shear, can have a significant impact on the structure and evolution of simulated convection systems. Crook and Klemp [6] conducted an analytical and numerical analysis of lifting depth. They found that the depth of lifting could be increased by decreasing the horizontal flow above the convergence line, supporting previous findings [3,7]. Their analytical approach offers greater insight into the representation of this relationship (Figure 1).
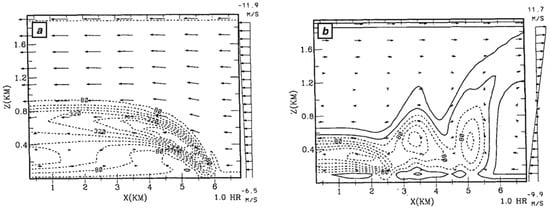
Figure 1.
Excerpt of Figure 3b,d from Chen [8]. Contours of positive (solid) and negative (dashed) vorticity for a gravity current propagating in a neutrally stratified layer under an environment of negative shear (panel (a)) and strong positive shear (panel (b)). © American Meteorological Society. Used with permission.
Chen [8], henceforth C95, studied the effect of wind shear on gravity currents (the flow of one fluid within another of a different density [9]). Described in terms of “vorticity ventilation”, front-to-rear flows (negative shear profiles where ∂u/∂z < 0) were found favorable for stabilizing gravity currents because of their ability to carry newly generated vorticity away from its source region (Figure 1a). Rear-to-front flows (positive shear profiles where ∂u/∂z > 0) were instead found to promote eddy mixing which destabilized and destroyed gravity currents (Figure 1b). In cases where positive environmental shear balanced cold pool-generated shear, the “vorticity counteract” mechanism was stated to be present [8,10]. This concept of vorticity ventilation motivated shear vorticity calculations, shown and discussed in Section 5, to describe the impact of several forces at play in the cold front.
1.2. Observation-Based Studies
Observation-based analyses of convergence events include work by Melfi et al. [11] who used continuous Raman lidar profiling to measure water vapor mixing ratio and aerosol backscattering to describe the structure of overpassing cold and warm fronts at night. Their Raman lidar observations captured features of frontal boundaries such as the elevated nose in the frontal zone, downsloping structures, cloud development, as well as individual air masses and their moisture concentrations. They concluded that Raman lidar is a valuable tool for studying the dynamical changes in a frontal boundary which would be missed by radiosondes, even when deployed at high temporal frequencies. Sakai et al. [12] continued this trend of studying frontal boundaries using Raman lidar and added a wind profiler to their analysis for the evaluation of continuous 3-dimensional winds. Their study of a non-precipitating nocturnal cold frontal head included discussions of horizontal and vertical wind patterns to complement thermodynamic discussions. Demoz et al. [13] discussed the interaction between an observed cold front and dryline over the SGP using a combination of in situ surface meteorological and remote sensing data (Raman lidar and microwave radiometer). They observed that the merger between the dryline and cold front led to a bore wave (atmospheric wave disturbance in a stable atmosphere marked by an abrupt pressure jump), moisture oscillations, and mixing of prefrontal air, as well as lifting of the moist layer by the cold-frontal surface. A bore-ducting analysis was included in part of their study as well, finding that recorded bore speeds were in agreement with the low-level stable layer and capping inversion present.
In addition to Raman lidar and radar wind profilers, Turner et al. [14] incorporated the Atmospheric Emitted Radiance Interferometer (AERI) into their observation-based study of the lower atmosphere which included the overpass of a dryline, warm air advection, and a cold front. AERI, a passive ground-based infrared interferometer, measures downwelling atmospheric radiance [15] from which it can retrieve vertical profiles of temperature and moisture [16,17]. Turner et al. [14] demonstrated that collocating AERI and Raman lidar systems allows for the retrieval of high-resolution convective stability indices. In a two-part case study analysis, Friedrich et al. [18,19] characterized a non-precipitating cold front using a wide array of ground-based and airborne instruments to examine boundary layer conditions via the across-front and along-front axes independently. Their findings demonstrated that the cool-air sector contained gravity current characteristics and wind shear instabilities might favor convection initiation due to vertical vorticity and velocity maxima observed in the area where pre-frontal boundaries intersected the cold front.
Discussions of convergence, particularly those associated with frontal passages, are often linked with a pressure jump [20,21,22,23]. Pressure jumps that originate from frontal and/or outflow regimes often produce undulations in the boundary layer that become full-blown undular, gravity, and/or solitary waves [23,24]. Their undulations, the nocturnal low-level jet, and shear that follows are likely to produce convection. Lidar and AERI-based water vapor and aerosol backscatter profiles across bore wave undulations have been reported in the past [13,25,26,27]; however, none of these reports investigate the associated vorticity and overall convergence structure that evolves across many hours before and after the frontal passage.
The primary objectives of this study are: (1) to document the mesoscale-influenced region of the 27 September 1997 cold front case and (2) to discuss its symmetric convergence structure, lifting depth, and moisture transport in terms of existing theories and published literature to comment on the usefulness of RKW theory in describing such an event. The role of moisture redistribution in the vertical column on the maintenance of convection, as opposed to shear-dominant considerations, is of interest, as some of the theories above discuss. Vertical transects of the event obtained using remote sensors, Raman Lidar (RL), AERI, and Radar Wind Profiler (RWP), were used to evaluate the evolution of the temperature, humidity, and 3-dimensional wind, before, during, and after the overpassing of the symmetric convergence event. Moisture and temperature are observed by RL and AERI, respectively, and allow for quantification of the Convective Available Potential Energy (CAPE) and Convective Inhibition (CIN) to be derived over time–height cross-sections, as demonstrated in previous Plains Elevated Convection at Night (PECAN) field campaign studies [28,29]. The RWP is used to calculate horizontal vorticity, a method based on previous research by C95. Radiosondes launched every three hours at ARM SGP observing facilities during this event provide insight into the upper atmosphere at a relatively high frequency.
The sections to follow expand on the data, methods, and theory introduced above. Section two describes in detail the instruments and observational data used in this study. Section three outlines the convergence case study event from a synoptic perspective using satellite imagery, surface analyses, and other traditional data. It also outlines the observed timing of the convergence event from a meteorological tower time series. Section four shows and discusses remote sensing data collected from ground-based ARM SGP Observation Sites and Section five introduces derived quantities from remote sensing data (CAPE, vorticity). Finally, Section six combines data and elements of discussion from previous sections to frame the convergence case study in terms of the many forces and their scales at play: frontal-dynamic influences and mesoscale convergence. Contribution of the current observations to the science of prior theories [1,8] is also included here.
2. Instruments and Data
2.1. In Situ
Surface Meteorology: Three surface meteorology networks were used in this study, the ARM SGP surface network [30], the Oklahoma Mesonet [31], and the federally operated Automated Surface Observing System [32]. The ARM central facility located in Lamont, Oklahoma is also home to a 60 m tall tower [33] that continuously measures (1 min resolution) temperature at 25 m and 60 m heights, alongside surface meteorology (wind at 10 m; temperature, relative humidity, and vapor pressure at 2 m; barometric pressure at 1 m). Most of the data shown in this study was collocated at the central observing facility (36.6° N, −97.5° E); thus, observations from the meteorological tower are used for determining the timing of the convergence boundary and bore wave arrival.
Radiosondes: The ARM program regularly launches Vaisala radiosondes at its SGP facility; in 1997, the program was using RS80H radiosondes. During this period, an intensive observation period was underway, and 8 radiosondes were launched per day (i.e., every 3 h). As a comparison and confirmation of the remote sensing data, in situ sonde measurements are plotted in overtop curtain plots in Section 4 (Raman lidar relative humidity, AERI temperature, and AERI potential temperature).
2.2. Remote Sensors
Raman Lidar (RL): The ARM Raman lidar (RL) is a research-grade long-term operating instrument that continuously monitors the water vapor and aerosol evolution as it passes over the ARM SGP central facility. The RL transmits laser pulses at a wavelength of 355 nm and collects backscattered energy at 355 nm, as well as rotational-vibrational Raman scattering signals at 387 nm (nitrogen molecules) and 408 nm (water vapor molecules). The ratio of water vapor signal to the nitrogen signal as a function of height is proportional to the water vapor mixing ratio (g/kg) profile. The Raman lidar has been described in the literature in ample detail elsewhere (see Goldsmith et al. [34] for instrument-specific design and Turner et al. [35] for recent additions as well as references therein). RL observations of water vapor used in this study are averaged to a 10 min temporal and 60 m vertical resolution.
915 MHz Radar Wind Profiler (RWP): ARM SGP’s 915 MHz radar wind profilers (RWP) collected continuous observations of the 3-dimensional vertical wind profile during the event. The RWP system transmits electromagnetic waves in four cardinal directions, where the strength and frequency (Doppler) of the backscattered energy are recorded. Geometric translations of the Doppler winds allow for calculating three-dimensional wind vectors in the vertical column directly above the instrument. The system employs the sensitivities of the backscatter signal to refractive index via Bragg scattering and its relationship to clear air wind speed and direction to profile the dynamic structure of the sub−4 km layer (see Ralph [36], Tridon et al. [37], and references therein). This paper focuses on boundary layer winds and evolution-associated wind.
Atmospheric Emitted Radiance Interferometer (AERI): The Atmospheric Emitted Radiance Interferometer (AERI) is a ground-based passive remote sensing instrument that measures downwelling spectral infrared radiation; in 1997, the temporal resolution was roughly 8 min [15]. Profiles of temperature and water vapor mixing ratio are derived using an optimal estimation-based retrieval technique that uses both AERI and RL data as input, as discussed in detail in Turner and Blumberg [38]. This work uses thermodynamic profiles retrieved from AERI data to derive quantities as the symmetric convergence case discussed passes over the central facility.
2.3. Data Limitations
Radiosonde observations in this case are assumed to follow a vertical path during their ascent, which is physically unrealistic. Differences between true vertical stares from remote sensors and drifting radiosondes vary seasonally and with local conditions, with larger discrepancies typically occurring at high altitudes and during winter due to stronger winds [39]. This study focuses on lower altitudes (0–5 km) during a nocturnal summer event; therefore, radiosonde drift is of reduced concern. Additionally, reversals of radiosonde heading at or above 2 km were common. Thus, while radiosondes are not treated as a perfect representation of the atmospheric profile, they provide a useful and reliable comparison to remote sensing observations.
Radar Wind Profiler data were averaged to a 1 h resolution to reduce the influence of turbulence and to enhance the Singal-to-Noise Ratio (SNR), resulting in observations representative of the mean flow over the span of the event. This averaging limits the RWP’s ability to clearly observe sub-hour features such as bore waves. However, higher resolution data from Raman lidar, AERI, and surface meteorology instruments capture clear signatures of finer features. The coordinated deployment of these platforms enables a comprehensive reconstruction of the event, leveraging the relative strengths of each instrument.
Additionally, the observations of this event were collocated at the ARM SGP central observation site, providing a single-point, vertical profile perspective. While we acknowledge that this limits the evaluation of the spatial variability, our analysis is focused on the across-front axis, which this perspective observes in detail. Furthermore, we assume that the meso-synoptic scale structures on the across-front axis remain relatively stable over the 24 h period observed.
3. Synoptic Overview and In Situ Measurements
During the night of 27–28 September 1997, a cold front extending from a Canadian low-pressure system was observed by the Atmospheric Research Measurement (ARM) observation network [40] in the Southern Great Plains (SGP) [41]. The front’s associated cloud cover and the location of the ARM SGP central observing facility (C1) can be seen in Figure 2. This low-pressure system formed over the northwest Pacific Ocean several days before its associated cold front reached the plains region. On 26 September 1997 the low-pressure center made landfall over British Columbia and its cold front extended through northern California. As the system continued to travel east across Canada and the United States it became more spatially expansive. By 29 September 1997 the cold front stretched along the east and gulf coasts (approximately 3000 km long) and the system soon after continued east into the Atlantic Ocean.
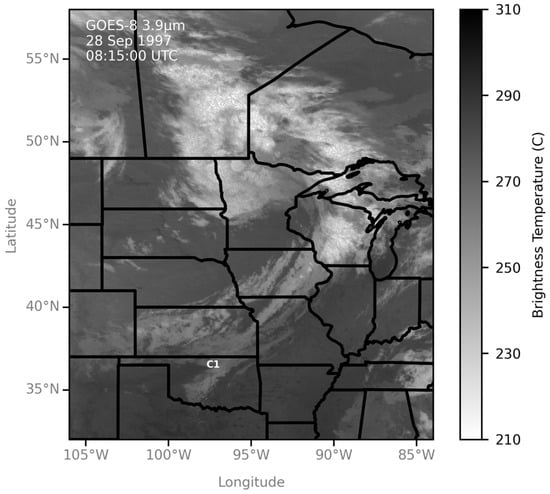
Figure 2.
GOES-8 Channel 2 imagery of cloud cover along the convergence boundary at the front’s trailing region at 08:15 UTC. The location of the ARM SGP central facility (C1) and state boundaries (black lines) have been overlaid for reference.
The locations of the cold front boundary around the time of observation over the SGP facility, as identified in surface analysis charts, are annotated on Figure 3. Fifteen hours before the cold front reached the SGP central observing facility (labeled “SGP − 15 h” in Figure 3), forecasters identified its location over Nebraska, South Dakota, and Wyoming. Nine hours after the cold front passed the central facility (24 h after “SGP − 15 h”), the front spanned the Ohio river valley into Texas (labeled “SGP + 9 h” on Figure 3). Around 9:00 Coordinated Universal Time (UTC), the time of overpass at C1, surface analyses estimate the low pressure was centered 1300 km to the north. Satellite imagery (Figure 2) shows two groups of expansive cloud cover separated by a narrow cloud-free region. Clouds blanketed the entire state of Kansas and extended northeast towards Illinois and Wisconsin with coherent linear organization. A narrow band of clouds stretching southwest to northeast across Oklahoma is also visible and is in line with moisture advection over the cold sector of the front, as will be discussed in future sections. From 00:00 UTC on 27 September through 06:00 UTC on 28 September a standing trough was also indicated on surface analyses, delineating southeasterly and southwesterly air masses. The central observing facility, C1, is where the bulk of the observations shown in the sections to follow were collected.
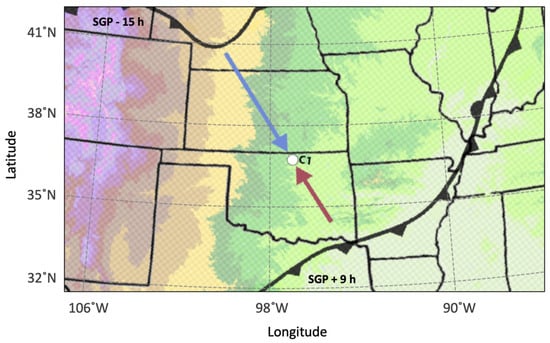
Figure 3.
The cold front from this case study at 1800 UTC on 27 September 1997 (annotated “SGP − 15 h”) and 1800 UTC on 28 September 1997 (annotated “SGP + 9 h”), as drawn by the National Weather Service. Colored contours represent ground elevation and black lines indicate state boundaries. The ARM SGP Central Facility (annotated “C1”) is marked by a white circle in Lamont, Oklahoma. Red and blue arrows pointing towards C1 depict the across-front axis as well as the relative magnitude of warm (red) and cold (blue) sector air masses from SGP − 15 h to SGP + 9 h.
In situ meteorological observations atop a 60 m tower at the C1 site identify the timing of the front’s passage through measured thermodynamic and kinematic changes. Observed synoptic-scale trends of increasing (decreasing) pressure (temperature) over time can be attributed to the front’s overpass (Figure 4). At the center of Figure 4, a shaded and hatched region represents the cold front’s surface convergence boundary region. Wind speeds shift direction and see a sustained increase of 4–5 m/s during this time as well. Vertical mixing associated with the front also led to a breakdown of the stratified lower atmosphere, as temperature and moisture values converged at three vertical levels (2 m, 25 m, 60 m).
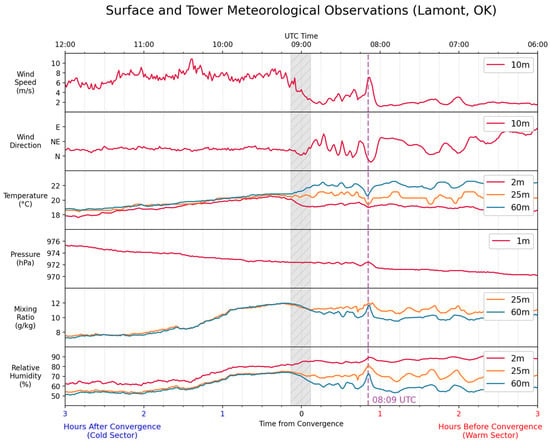
Figure 4.
Meteorological tower time series data, showing wind speed, wind direction, temperature, pressure, water vapor mixing ratio, and relative humidity, from top to bottom. Timing on the bottom
x-axis is shown relative to the cold front’s arrival: zero on the x-axis is 09:00 UTC (the arrival of the well-mixed cold-sector air mass) and time increases from right to left. The
arrival of a related bore wave is annotated by a vertical, purple-dashed line at 08:09 UTC. Times in UTC are shown on the top x-axis for reference.
Embedded in this trend, a prefrontal undular bore wave is marked by a dashed vertical line at 08:09 UTC, approximately one hour before the frontal convergence zone. Temperature observations can distinguish bore waves—which lift the stable layer and modify the prefrontal atmosphere—from gravity currents. In this case, there was no notable change in surface temperature, and elevated observations at 2 m and 60 m AGL reveal a dip in the stable layer’s temperature, consistent with vertical displacement of the layer. Additionally, there was no sustained temperature change following the measured pressure jump. Taken together, these features point to a bore rather than a gravity current.
This transient bore wave signature was accompanied by a brief shift in wind speed, temperature, pressure, and moisture which oscillated for about an hour until the cold front arrived. Such brief jumps or “impulse pressure increases” are often generated by cold frontal adjustment and embedded in pre-cold frontal pressure trends leading to bore wave-like perturbations in the warm sector of the air mass and moving faster than the front [13,20]. The 08:09 UTC pressure increase was the largest of pressure perturbations observed at least in the 4 h leading the convergence zone. The resulting undulations, though short lived, were observed in satellite cloud imagery.
Radiosonde wind profiles on this day revealed a dramatic shift in the front-perpendicular wind direction. Blue and orange lines in Figure 5 represent radiosondes launched before the front’s arrival (negative values correspond to southeasterly winds). The green line in Figure 5, very close to the frontal convergence region (8:30 UTC), shows a sharp transition from northwesterly winds below 1 km to southeasterly winds from 1 to 2.5 km. The remaining radiosondes launched at 11:30 UTC and later all indicate northwesterly winds in the warm sector entering the region behind the front. Note that the zero-speed crossing was raised from 1 km at 08:30 to about 2.5 km in later soundings, a reflection of the “lifting” of the layer associated with the reverse flow. The 11:30 UTC sounding shows the strongest front-perpendicular wind speed, over 20 m/s briefly at 0.5 km, and the maximum speed of the profiles to follow decreased over time.
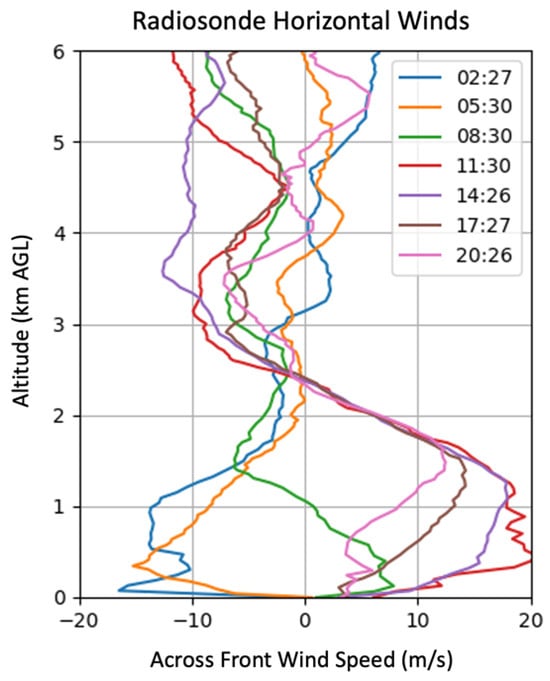
Figure 5.
Across Front wind speeds from radiosondes at C1. Negative values correspond with southeasterly winds and positive values correspond with northwesterly winds (red and blue arrows from Figure 3, respectively).
These 3 h resolution radiosonde profiles detecting broad changes in wind, although they cannot visualize the smooth connected flows of different vertical layers or sharp transitions and moisture transport associated with the transition in air masses which are crucial to characterize the details of the dynamics and local convective responses at work. Remote sensing observations shown in the next section will show wind profiles at a much greater temporal frequency and provide more insight into the finer structures of this frontal system.
4. Remote Sensing Observations
Thermodynamic profiles of the trailing-end convergence event were captured by the ARM SGP central facility’s Raman lidar and AERI ground-based remote sensors at high vertical and temporal detail. Special focus is given to the thermodynamic profiles discussion because profiles give insight into atmospheric stability and temporal-vertical moisture distribution as they evolve throughout the cold frontal passage. Note that the optimal estimation method used here incorporates additional constraints and observations into the retrievals [38], including the AERI’s observed infrared radiance spectra, partial profiles of water vapor mixing ratio values from the RL, and surface meteorology observations. Potential temperature retrievals show the depth of the cold sector’s boundary layer air mass which extends to approximately 1 km AGL. The true vertical resolution of the retrieved profiles decreases with height, and thus the small-scale structure along the warm-cold boundary is smoothed out; however, equivalent potential temperature displays a similar structure as captured by the Raman lidar’s RH. We present a unified look at the temperature, moisture, and wind data in this section. A detailed discussion of these features and their connection to the symmetric convergence nature of the case are discussed in Section 5 and Section 6.
Figure 6 shows both the synoptic transition from the pre-frontal warm sector to post-frontal cool sector over several hours of observations, as well as finer mesoscale boundaries and features within these larger trends. Radiosonde observations are overlaid for reference and indicate that Raman lidar and AERI temperatures match well overall. However, Raman lidar and AERI contribute insights into local convective responses and mesoscale structures which radiosondes and surface observations alone miss entirely. AERI temperature retrievals (Figure 6b) provide specific timing of the sharpest elevated temperature transition (8:00 UTC) and quantify the depth of the warm sector’s air mass (~1 km). AERI potential temperatures (Figure 6c) nicely capture the deepening of the mixed layer over the course of several hours after its initial jump.
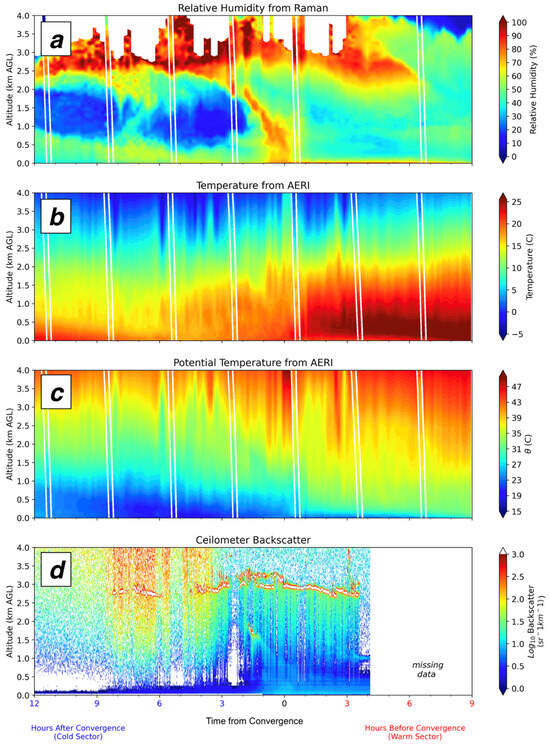
Figure 6.
Time–height cross-sections of remote sensing observations. Relative humidity was computed from Raman lidar water vapor and AERI temperature data (panel (a)), followed by thermodynamic products retrieved from the optimal estimation retrieval as a combination of AERI and Raman lidar data: temperature (b), and potential temperature (c). Attenuated aerosol backscatter from the collocated ceilometer (d) displays the basic structure of the convergence as a reference for the profiling capabilities of a lower-cost sensor alternative. Corresponding radiosonde observations are overlaid on panels (a–c) between the white lines for reference. RH data from the radiosonde at 0530 UTC was deemed of poor quality and has been removed. Time on the x-axis is reversed, as in Figure 4.
The Raman lidar (RL)’s observations of relative humidity (Figure 6a) and water vapor mixing ratio (Figure 7) during this cold front case show a striking example of high space-time variability of water vapor, a conservative quantity in the absence of precipitation. The RL observations show a moist surface air mass (>10 g/kg in the warm sector; Figure 7) followed by a very dry surface air mass (<6 g/kg in the cold sector) aligned with the frontal passage. A few features stand out as striking and are annotated in Figure 7 for reference, including (a) the narrow convergence and moist updraft plume extending close to 3 km in altitude, (b) the spread of moisture between 2 and 3 km extending much of the time domain plotted and connected to the upright moist plume aforementioned, and (c) the structure of the lifted depth and cloud-base altitude vis-à-vis the convergence (ceilometer cloud base heights shown in Figure 7).
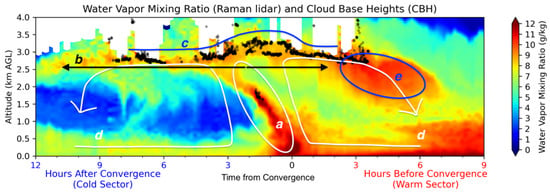
Figure 7.
Water vapor mixing ratio (g/kg) from Raman lidar with annotations to outline key features of the convergence event including: the narrow convergence region and moisture plume (annotation a), horizontal moisture spread from elevated divergence (b), structure of the lifted depth and cloud base heights (c), mesoscale circulation surrounding the convergence, including horizontal transport and descending regions (d), and the region of elevated moisture over the warm sector (e). Cloud base heights derived from the ceilometer are overlaid as black dots.
Water vapor mixing ratio, in the absence of precipitation, is a good tracer for the air mass motion and a proxy for the ongoing dynamic processes. Air is lifted at the convergence boundary, spreads horizontally, and then descends farther away from the frontal boundary—forming a mesoscale circulation of balanced surface convergence, updraft, and elevated divergence (Figure 7, annotation d). This mesoscale structure distinguishes this event from traditional frontal convergence cases. A particularly moist elevated region over the warm sector (Figure 7, annotation e) also stands out from traditional frontal convergence events.
5. Derived Quantities
5.1. CAPE
Sensitivities of temperature and moisture vertical gradients are critical to the analysis of convection [6], and insights into these variations can be gained through the evaluation of convective parameters Convective Available Potential Energy (CAPE) and Convective Inhibition (CIN). Given the strong dominance of the convergence dynamics and subsequent redistribution of the low-level air mass temperature and moisture in this case, an accurate diagnosis of the evolution of CAPE/CIN is important. CIN is largely influenced by temperature variations, given the current lapse rate stratification, while CAPE responds to the updraft velocity and moisture variations strongly. Crook’s approximation of CAPE in terms of updraft velocity, , complements this relationship. Since the vertical thermodynamic profile rapidly evolves along the convergence structure, a look at the short-term evolution and parcel contribution to the CIN and CAPE is instructive. In particular, the evolution of CAPE/CIN is insightful in understanding and interpreting the dynamics at work on the mesoscale during this event and its contribution in changing the thermodynamics and energy distribution in the vertical.
Parcel-specific CAPE and CIN are calculated following Grasmick et al. [29] and shown in a time–height cross-section (Figure 8). A combination of observations was used for calculations: temperature from AERI retrievals and water vapor from RL. Parcel-specific CAPE and CIN are calculated for each parcel from the surface to 4 km, as described by the equations:
where
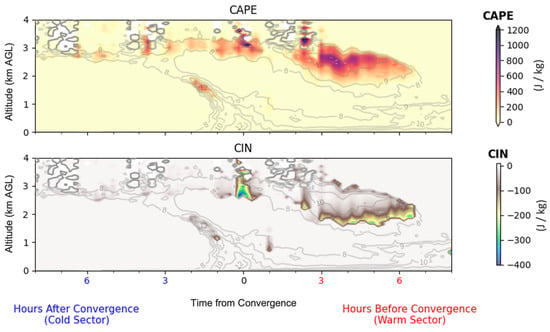
Figure 8.
CAPE and CIN calculated using Raman lidar and AERI data collected at the ARM SGP Central Facility. Gray contours represent water vapor mixing ratio from Raman lidar observations in 1 g/kg steps from 8 g/kg to 12 g/kg (Figure 7).
LFC = parcel-specific level of free convection,
EL = parcel-specific equilibrium level,
Rd = dry air gas constant,
Tparcel = parcel temperature at each pressure level,
Tenvironment = environmental temperature at each pressure level.
In a physical sense, the resulting CIN value for any given parcel (at a specific altitude and time) informs the amount of energy an external lifting mechanism would need to provide to that parcel before it could reach its Level of Free Convection (LFC; Equation (1)). If the parcel does reach its LFC, its corresponding CAPE value is the amount of potential energy the parcel would have available for lifting at that time from its LFC to its Equilibrium Level (EL), as shown in Equation (2).
A previous study [42] compared CAPE and CIN values derived from remote sensing data to those calculated from nearby radiosonde measurements. The analysis focused on the influence of different water vapor measurement sources on derived CAPE and CIN values and found that CAPE, in particular, was highly sensitive to water vapor variability. On the day evaluated in [42], when CAPE and CIN were calculated using AERI temperature profiles and Raman lidar water vapor mixing ratio—the same approach used in this study, the root mean squared errors were 450.8 J/kg for CAPE and 86.5 J/kg for CIN.
Visualizing CAPE and CIN in this curtain-style format (Figure 8) details the evolution of convection potential within the mesoscale circulation, points to areas within the circulation that is prone to elevated convection initiation and allows for ease in relating convection indices to thermodynamic variables. Low (high) values of surface (elevated) CAPE indicate that convection is much more likely to be brought on by an elevated lifting mechanism than by a surface lifting mechanism. At the frontal boundary (0 on the x-axis), convergence in the front-perpendicular wind direction is strongest from 0 to 2 km. However, the highest values of CAPE at that time are present at 3 km AGL, highly correlated with elevated moisture (relative humidities exceeding 80%).
Outside of the frontal boundary, elevated CAPE was present in both sectors: reaching values of 1200 J/kg in the warm sector and values 550 J/kg in the cold sector. In both regions, high CAPE is correlated with areas of cloud cover and high relative humidity, indicating that during this event, lifting at convergence and subsequent mixing of low-level moist and warm air was a key ingredient in the formation of convection and observed clouds. Eleven hours of resultant cloud formation is visible from Geostationary Operational Environment 8 (GOES-8) satellite observations (Figure 2) and ceilometer backscatter (Figure 6d). Thus, the convergence and frontal movement was “controlling” the redistribution of moisture in the vertical, and hence, convection potential in the warm sector (more than 11 h in this case). This is accomplished by direct pumping of moisture by the convergence system and through a series of pressure impulses, some which created undulations that traveled ahead of the system. Both these mechanisms modify the pre-cold frontal warm sector and prime it for convection.
The circulation pattern that would lead to such CAPE distribution is also evident in the RL measurements of the moisture, a conserved quantity used as a tracer of the dynamics at the time (Figure 7, annotation d). This additionally confirms that CAPE’s sensitivity to variations in moisture is greater than its sensitivity to variations in temperature. The implication and advantage of such a long-term continuous profile measurement is to reveal the modification of the CAPE that was brought about by airmass convergence can control and modify the environment 5–6 h ahead of the convergence. Given the importance of the timing, elevation, and strength of convection-prediction quantities (such as CAPE and CIN), the long-advocated goal of greater profiling networks [43], particularly for observing water vapor and temperature profiles, are underlined here.
5.2. Front-Relative Winds
The concept of vorticity ventilation [8] focuses on the effects from wind shear on evolution of gravity currents, where front-to-rear flows were shown to carry newly generated vorticity away from convergence boundaries and promote the stabilization of gravity currents, while rear-to front flows promoted eddy mixing, which can destabilize and destroy gravity currents. Radar wind profiler observations of horizontal winds and calculated vorticity (Figure 9) are used here to discuss vorticity ventilation as it correlates with water vapor transport, rather than gravity current stability as discussed in C95.
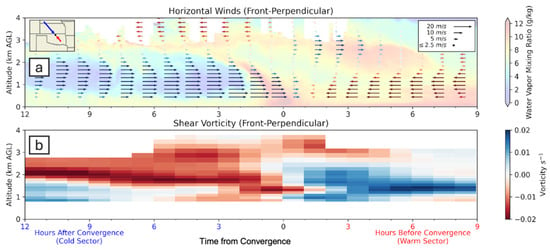
Figure 9.
Horizontal winds on the front-perpendicular axis (offset 35 degrees from N/S; panel a) and shear vorticity on the across-front axis (panel b). Blue wind vectors correspond to air originating from the NW (cold sector; panel a) and red vectors correspond to air originating from the SE (warm sector; panel a). Blue vorticity values are clockwise (into the page) and red vorticity is counterclockwise (out of the page; panel b). The underlying color contour in panel a is the water vapor mixing ratio from the Raman lidar. Time on the x-axis follows from Figure 4.
Figure 9 shows front-perpendicular winds measured by the RWP (panel a) and vorticity calculated from these data (panel b). Vorticity was calculated as the curl of velocity vector (Equation (3)) where the velocity vector, , is split into front-perpendicular (), front-parallel (), and vertical () components.
The change in distance along the front-perpendicular direction can be approximated as the change in time between observations multiplied by the mean speed of system (); however, the change in distance along the front-parallel direction cannot be approximated since the frontal system is only measured along one slice of its front-parallel axis (∂∥ = 0). This leaves us with:
A scale analysis indicates that the frequency of wind profiling (1 h) makes terms which include it negligible (Equations (5)–(8)).
Therefore, constraints from RWP observations leave us with the vertical shear of horizontal wind components as our vorticity vector components in this case (Equation (9)), which is shown as follows:
While this does not capture the complete horizontal vorticity picture, shear vorticity still plays a significant role in the mesoscale dynamics. The front-perpendicular component of the vorticity is shown in Figure 9b, where blue colors represent rotations into the page and red colors represent rotations out of the page. Wind and vorticity values were smoothed using a gaussian filter to highlight general mesoscale circulation trends. The inset map shows the angle at which the front-perpendicular winds were determined and the relative spatial magnitudes of the cold and warm sectors pictured (Figure 9a).
Observations from the RWP indicate the front’s cold sector was dominated by front-to-rear shear flows (Figure 9a) and counterclockwise rotations (Figure 9b). Additionally, the weakest front-perpendicular surface winds were found in the region of transition between predominantly clockwise (warm sector) and counterclockwise (cold sector) rotations, beginning one hour prior to the front’s arrival (the time of the bore wave). This region of vorticity transition is correlated with the onset of the strongest updrafts and greatest vertical lifting of water vapor. Ventilation mechanics described by C95 identify this front-to-rear shear regime as one dominated strong by advection over the cold air dome, which is consistent with the transport of water vapor away from the convergence boundary and over the cold sector.
Conversely the warm sector was dominated by rear-to-front flows, meaning there was enhanced eddy mixing according to the C95’s vorticity ventilation theory. Northwesterly front-perpendicular wind vectors from 2 to 3 km, 2–4 h before the convergence (Figure 9a) near the elevated moisture plume (Figure 7, annotation e) indicates that this feature is a product of moisture transport within the convergence circulation as well. RWP wind vectors indicate that a secondary flow separated from the primary updraft and spread “backwards” over the warm sector to aid in this moisture transport (Figure 7, annotation d). The enhanced eddy circulations within this rear-to-front dominated regime further enabled the buildup of elevated moisture in the warm sector.
6. Discussion
The trailing-end of cold fronts lies in a regime influenced by cyclogenesis, synoptic-scale, and mesoscale forces. The case study outlines features and forcing mechanisms from both scales which play an important role in shaping the structure of a trailing end cold-front convergence region observed in the SGP region. Remote sensing observations collected at the ARM SGP central observing facility allow for the vertical profile of the convergence case to be evaluated over time and collocated instruments provide enough information to calculate value-added products such as CAPE, CIN, and vorticity to enhance the discussion.
On the synoptic scale, an expansive cold front passed over the region and is the driver of the surface convergence observed. On the mesoscale, however, vertical wind shear and a bore wave preceding the frontal boundary modified the frontal convergence structure. The convergence structure was distinct from a traditional cold frontal boundary, as is seen through water vapor transport in Figure 7. Water vapor and horizontal wind (Figure 9) reveal elevated divergence around 3 km AGL, with transport over both the cold and warm sectors of the front. In fact, water vapor mixing ratios (Figure 7) indicate that more transport occurred ahead of the front, over the warm sector, than the cold sector as is traditionally expected in frontal regimes.
In addition to directly observed quantities, collocated AERI and Raman lidar systems allow for the calculation of convective parameters CAPE and CIN during the event. These results (Figure 8) reveal that the potential for convection in this case was much greater at elevated layers than at the surface. Highest CAPE values were found between 2 and 3 km above the surface, both before and after the frontal boundary, but in larger quantities and more expansively within elevated layers in the warm sector preceding the front, aligned with larger quantities of water vapor mixing ratio observed in Figure 7. Additionally, a bore wave, which passed over the observing facility approximately one hour before the frontal boundary, is well-aligned with shifts in wind speed and direction indicated by both surface measurements (Figure 4) and RWP observations (Figure 9) which enhanced water vapor lifting at the convergence region.
RKW88 outlines optimal environmental conditions for producing long-lived convection as a balance between positive and negative circulations produced by vertical wind shear and cold pool outflows, respectively. This case follows a nocturnal convergence boundary, under the influence of a stable atmosphere profile, yet despite these differences, we observe opposing circulations which resemble RKW88’s concept of vorticity balance from vertical shear along the front-perpendicular axis (Figure 9b). Additionally, we find positive and negative circulations span to approximately 2.5 km AGL, indicating that it may be possible for vorticity balance to contribute to the formation of elevated convection. These vorticity circulations, and “ventilations” as coined by C95, are important in redistributing moisture and priming the warm prefrontal environment for convection—elevated convection several hours prior to the convergence zone. This is an important contribution made possible by remote sensing instruments as part of a network which can detect the environment in high detail.
Author Contributions
Conceptualization, K.H., D.D.T. and B.B.D.; methodology, K.H. and B.B.D.; software, K.H.; validation, K.H.; formal analysis, K.H.; investigation, K.H.; resources, D.D.T. and B.B.D.; writing—original draft preparation, K.H.; writing—review and editing, D.D.T. and B.B.D.; visualization, K.H.; supervision, B.B.D.; funding acquisition, K.H. and B.B.D. All authors have read and agreed to the published version of the manuscript.
Funding
This material is based upon work supported by the NASA Early Career Research Program, Future Investigators in NASA Earth and Science and Technology, under Award No. #80NSSC22K1454 and by the U.S. Department of Commerce, National Oceanic and Atmospheric Administration, Educational Partnership Program, under Agreement No. #NA16SEC4810006.
Institutional Review Board Statement
Not applicable.
Informed Consent Statement
Not applicable.
Data Availability Statement
Data used in this research are publicly available through the U.S. Department of Energy’s Atmospheric Radiation Measurement (ARM) user facility at https://www.arm.gov/data (accessed on 2 April 2024). Additional materials, clarification, or guidance are available from the authors upon request.
Conflicts of Interest
The authors declare no conflicts of interest.
Abbreviations
The following abbreviations are used in this manuscript:
| RL | Raman Lidar |
| AERI | Atmospheric Emitted Radiance Interferometer |
| RWP | Radar Wind Profiler |
| CAPE | Convective Available Potential Energy |
| CIN | Convective Inhibition |
| QLCS | Quasi-Linear Convective System |
| ARM | Atmospheric Radiation Measurement |
| SGP | Southern Great Plains |
| AGL | Above Ground Level |
| UTC | Coordinated Universal Time |
| GOES-8 | Geostationary Operational Environmental Satellite 8 |
| PECAN | Plains Elevated Convection At Night |
| IHOP | International H20 Project |
| LFC | Lifting Condensation Level |
| EL | Equilibrium Level |
References
- Rotunno, R.; Klemp, J.B.; Weisman, M.L. A Theory for Strong, Long-Lived Squall Lines. J. Atmos. Sci. 1988, 45, 463–485. [Google Scholar] [CrossRef]
- Weisman, M.L.; Rotunno, R. A Theory for Strong Long-Lived Squall Lines Revisited. J. Atmos. Sci. 2004, 61, 361–382. [Google Scholar] [CrossRef]
- Shapiro, A. A Hydrodynamical Model of Shear Flow over Semi-Infinite Barriers with Application to Density Currents. J. Atmos. Sci. 1992, 49, 2293–2305. [Google Scholar] [CrossRef]
- Stensrud, D.J.; Coniglio, M.C.; Davies-Jones, R.P.; Evans, J.S. Comments on a Theory for Strong Long-Lived Squall Lines Revisited. J. Atmos. Sci. 2005, 62, 2989–2996. [Google Scholar] [CrossRef]
- Coniglio, M.C.; Stensrud, D.J.; Wicker, L.J. Effects of Upper-Level Shear on the Structure and Maintenance of Strong Quasi-Linear Mesoscale Convective Systems. J. Atmos. Sci. 2006, 63, 1231–1252. [Google Scholar] [CrossRef]
- Crook, N.A.; Klemp, J.B. Lifting by Convergence Lines. J. Atmos. Sci. 2000, 57, 873–890. [Google Scholar] [CrossRef]
- Wilson, J.W.; Megenhardt, D.L. Thunderstorm Initiation, Organization, Lifetime Associated with Florida Boundary Layer Convergence Lines. Mon. Weather Rev. 1997, 125, 1507–1525. [Google Scholar] [CrossRef]
- Chen, C. Numerical Simulations of Gravity Currents in Uniform Shear Flows, American Meteorological Society. Mon. Weather Rev. 1995, 123, 3240–3253. [Google Scholar] [CrossRef]
- Simpson, J.E. Gravity Currents in the Laboratory, Atmosphere, and Ocean. Annu. Rev. Fluid Mech 1982, 141, 213–234. [Google Scholar] [CrossRef]
- Garner, S.T.; Thorpe, A.J. The Development of Organized Convection in a Simplified Squall-Line Model. Quart. J. R. Meteoro. Soc. 1992, 118, 101–124. [Google Scholar] [CrossRef]
- Melfi, S.H.; Whiteman, D.; Ferrare, R. Observation of Atmospheric Fronts Using Raman Lidar Moisture Measurements. J. Appl. Meteor. 1989, 28, 789–806. [Google Scholar] [CrossRef]
- Sakai, T.; Nagai, T.; Matsumura, T.; Nakazato, M.; Sasaoka, M. Vertical Structure of a Nonprecipitating Cold Frontal Head as Revealed by Raman Lidar and Wind Profiler Observations. J. Meteorol. Soc. Jpn. 2005, 83, 293–304. [Google Scholar] [CrossRef]
- Demoz, B.B.; Starr, D.O.; Evans, K.D.; Lare, A.R.; Whiteman, D.N.; Schwemmer, G.; Ferrare, R.A.; Goldsmith, J.E.M.; Bisson, S.E. The Cold Front of 15 April 1994 over the Central United States. Part I: Observations. Mon. Weather Rev. 2005, 133, 1525–1543. [Google Scholar] [CrossRef]
- Turner, D.D.; Feltz, W.F.; Ferrare, R.A. Continuous Water Vapor Profiles from Operational Ground—Based Active and Passive Remote Sensors. Bull. Amer. Meteor. Soc. 2000, 81, 1301–1317. [Google Scholar] [CrossRef]
- Knuteson, R.O.; Revercomb, H.E.; Best, F.A.; Ciganovich, N.C.; Dedecker, R.G.; Dirkx, T.P.; Ellington, S.C.; Feltz, W.F.; Garcia, R.K.; Howell, H.B.; et al. Atmospheric Emitted Radiance Interferometer. Part I: Instrument Design. J. Atmos. Ocean. Technol. 2004, 21, 1763–1776. [Google Scholar] [CrossRef]
- Feltz, W.F.; Smith, W.L.; Knuteson, R.O.; Revercomb, H.E.; Woolf, H.M.; Howell, H.B. Meteorological Applications of Temperature and Water Vapor Retrievals from the Ground-Based Atmospheric Emitted Radiance Interferometer AERI. J. Appl. Meteor. 1998, 37, 857–875. [Google Scholar] [CrossRef]
- Turner, D.D.; Löhnert, U. Information Content and Uncertainties in Thermodynamic Profiles and Liquid Cloud Properties Retrieved from the Ground-Based Atmospheric Emitted Radiance Interferometer AERI. J. Appl. Meteorol. Climatol. 2014, 53, 752–771. [Google Scholar] [CrossRef]
- Friedrich, K.; Kingsmill, D.E.; Flamant, C.; Murphey, H.V.; Wakimoto, R.M. Kinematic and Moisture Characteristics of a Nonprecipitating Cold Front Observed during IHOP. Part I: Across-Front Structures. Mon. Weather Rev. 2008, 136, 147–172. [Google Scholar] [CrossRef]
- Friedrich, K.; Kingsmill, D.E.; Flamant, C.; Murphey, H.V.; Wakimoto, R.M. Kinematic and Moisture Characteristics of a Nonprecipitating Cold Front Observed during IHOP. Part II: Alongfront Structures. Mon. Weather Rev. 2008, 136, 3796–3821. [Google Scholar] [CrossRef]
- Tepper, M. A Proposed Mechanism of Squall Lines: The Pressure Jump Line. J. Meteor. 1950, 7, 21–29. [Google Scholar] [CrossRef]
- Smith, R.K.; Reeder, M.J. On the Movement and Low-Level Structure of Cold Fronts. Mon. Weather Rev. 1988, 116, 1927–1944. [Google Scholar] [CrossRef]
- Rottman, J.W.; Simpson, J.E. The formation of internal bores in the atmosphere: A laboratory model. Quart. J. R. Meteoro. Soc. 1989, 115, 941–963. [Google Scholar] [CrossRef]
- Haghi, K.R.; Parsons, D.B.; Shapiro, A. Bores Observed during IHOP_2002: The Relationship of Bores to the Nocturnal Environment. Mon. Weather Rev. 2017, 145, 3929–3946. [Google Scholar] [CrossRef]
- Loveless, D.M.; Wagner, T.J.; Turner, D.D.; Ackerman, S.A.; Feltz, W.F. A Composite Perspective on Bore Passages during the PECAN Campaign. Mon. Weather Rev. 2019, 147, 1395–1413. [Google Scholar] [CrossRef]
- Flamant, C.; Koch, S.; Weckwerth, T.; Wilson, J.; Parsons, D.; Demoz, B.; Gentry, B.; Whiteman, D.; Schwemmer, G.; Fabry, F.; et al. The Life Cycle of a Bore Event over the US Southern Great Plains During IHOP 2002. In Proceedings of the 22nd International Laser Radar Conference, Matera, Italy, 12–16 July 2004; Available online: https://adsabs.harvard.edu/full/2004ESASP.561..635F (accessed on 15 May 2025).
- Koch, S.E.; Dorian, P.B.; Ferrare, R.; Melfi, S.H.; Skillman, W.C.; Whiteman, D. Structure of an Internal Bore and Dissipating Gravity Current as Revealed by Raman Lidar. Mon. Weather Rev. 1991, 119, 857–887. [Google Scholar] [CrossRef]
- Toms, B.A.; Tomaszewski, J.M.; Turner, D.D.; Koch, S.E. Analysis of a Lower-Tropospheric Gravity Wave Train Using Direct and Remote Sensing Measurement Systems. Mon. Weather Rev. 2017, 145, 2791–2812. [Google Scholar] [CrossRef]
- Lin, G.; Grasmick, C.; Geerts, B.; Wang, Z.; Deng, M. Convection Initiation and Bore Formation Following the Collision of Mesoscale Boundaries over a Developing Stable Boundary Layer: A Case Study from PECAN. Mon. Weather Rev. 2021, 149, 2351–2367. [Google Scholar] [CrossRef]
- Grasmick, C.; Geerts, B.; Turner, D.D.; Wang, Z.; Weckwerth, T.M. The Relation between Nocturnal MCS Evolution and Its Outflow Boundaries in the Stable Boundary Layer: An Observational Study of the 15 July 2015 MCS in PECAN. Mon. Weather Rev. 2018, 146, 3203–3226. [Google Scholar] [CrossRef]
- Ritsche, M. Surface Temperature Humidity Reference System Handbook; DOE/SC-ARM/TR-068; PNNL: Richland, WA, USA, 2011. [Google Scholar] [CrossRef][Green Version]
- Brock, F.V.; Crawford, K.C.; Elliott, R.L.; Cuperus, G.W.; Stadler, S.J.; Johnson, H.L.; Eilts, M.D. The Oklahoma Mesonet: A Technical Overview. J. Atmos. Ocean. Technol. 1995, 12, 5–19. [Google Scholar] [CrossRef]
- Automated Surface Observing System. ASOS User’s Guide. Available online: https://apps.dtic.mil/sti/citations/ADA354716 (accessed on 15 May 2025).
- Cook, D. Tower Temperature and Humidity Sensors TWR Handbook; DOE/SC-ARM/TR-050; PNNL: Richland, WA, USA, 2010. [Google Scholar] [CrossRef][Green Version]
- Goldsmith, J.E.M.; Blair, F.H.; Bisson, S.E.; Turner, D.D. Turn-key Raman lidar for profiling atmospheric water vapor, clouds, and aerosols. Appl. Opt. 1998, 37, 4979. [Google Scholar] [CrossRef]
- Turner, D.D.; Goldsmith, J.E.M.; Ferrare, R.A. Development and Applications of the ARM Raman Lidar. Meteorol. Monogr. 2016, 57, 18.1–18.15. [Google Scholar] [CrossRef]
- Ralph, F.M. Using Radar-Measured Radial Vertical Velocities to Distinguish Precipitation Scattering from Clear-Air Scattering. J. Atmos. Ocean. Technol. 1995, 12, 257–267. [Google Scholar] [CrossRef]
- Tridon, F.; Battaglia, A.; Kollias, P.; Luke, E.; Williams, C.R. Signal Postprocessing and Reflectivity Calibration of the Atmospheric Radiation Measurement Program 915-MHz Wind Profilers. J. Atmos. Ocean. Technol. 2013, 30, 1038–1054. [Google Scholar] [CrossRef]
- Turner, D.D.; Blumberg, W.G. Improvements to the AERIoe Thermodynamic Profile Retrieval Algorithm. IEEE J. Sel. Top. Appl. Earth Obs. Remote Sens. 2019, 125, 1339–1354. [Google Scholar] [CrossRef]
- Adam, M.; Demoz, B.B.; Venable, D.D.; Joseph, E.; Connell, R.; Whiteman, D.N.; Gambacorta, A.; Wei, J.; Shephard, M.W.; Miloshevich, L.M.; et al. Water Vapor Measurements by Howard University Raman Lidar during the WAVES 2006 Campaign. J. Atmos. Ocean. Technol. 2010, 271, 42–60. [Google Scholar] [CrossRef]
- Turner, D.D.; Ellingson, R.G. Introduction. Meteorol. Monogr. 2016, 57, v–x. [Google Scholar] [CrossRef]
- Sisterson, D.L.; Peppler, R.A.; Cress, T.S.; Lamb, P.J.; Turner, D.D. The ARM Southern Great Plains SGP Site. Meteorol. Monogr. 2016, 57, 6.1–6.14. [Google Scholar] [CrossRef]
- Hoffman, K.; Demoz, B. Convection Parameters from Remote Sensing Observations over the Southern Great Plains. Sensors 2025, 25, 4163. [Google Scholar] [CrossRef]
- National Research Council U.S. Observing Weather and Climate from the Ground up: A Nationwide Network of Networks; National Academies Press: Washington, DC, USA, 2009. [Google Scholar]
Disclaimer/Publisher’s Note: The statements, opinions and data contained in all publications are solely those of the individual author(s) and contributor(s) and not of MDPI and/or the editor(s). MDPI and/or the editor(s) disclaim responsibility for any injury to people or property resulting from any ideas, methods, instructions or products referred to in the content. |
© 2025 by the authors. Licensee MDPI, Basel, Switzerland. This article is an open access article distributed under the terms and conditions of the Creative Commons Attribution (CC BY) license (https://creativecommons.org/licenses/by/4.0/).