Abstract
Previous research has primarily focused on assessing seasonal mean or annual extreme climate events, whereas intraseasonal variability in extreme climate has received comparatively little attention, despite its importance for understanding short-term climate dynamics and associated risks. This study evaluates the performance of nine climate models from the Coupled Model Intercomparison Project Phase 6 (CMIP6) in reproducing summer maximum temperature (Tmax) variability across China during 1979–2014, with the variability defined as the standard deviation of daily Tmax anomalies for each summer. Results show that most CMIP6 models fail to reproduce the observed north–south gradient of Tmax variability with significant regional biases and limited agreement on temporal trends. The multi-model ensemble (MME) outperforms most individual models in terms of root-mean-square error and spatial correlation, but it still under-represents the observed temporal trends, especially over southeastern and central China. Taylor diagram analysis reveals that EC-Earth3, GISS-E2-1-G, IPSL-CM6A-LR, and the MME perform relatively well in capturing the spatial characteristics of Tmax variability, whereas MIROC6 shows the poorest performance. These findings highlight the persistent limitations in simulating intraseasonal Tmax variability and underscore the need for improved model representations of regional climate dynamics over China.
1. Introduction
The World Climate Research Programme (WCRP) identifies alterations in extreme weather and climate events as a primary scientific challenge. Similarly, the Intergovernmental Panel on Climate Change (IPCC) has also highlighted this issue in its assessment reports [1,2]. Surface air temperature serves as a fundamental and widely used indicator for assessing both regional and global climate changes, as well as the occurrence of extreme weather and climate events [3,4]. Extreme weather and climate events pose growing risks to societies and ecosystems [5,6]. As a major agricultural nation, China is particularly vulnerable to extreme high temperatures, which can severely impact agriculture, public health, labor productivity, and natural resources, resulting in substantial economic losses [7]. These risks underscore the urgent need to quantify and understand the variability in extreme high temperatures over China.
Climate models have long been leveraged as essential tools for analyzing both historical and projected changes in climate extremes [8,9,10,11]. The recent development of a new generation of climate models for the Coupled Model Intercomparison Project Phase 6 (CMIP6) experiment provides an opportunity to assess their performance [12]. Numerous studies have assessed the capability of climate models from different CMIP phases to simulate temperature extremes at both global and regional scales [13,14,15,16,17]. For instance, CMIP6 models could effectively reproduce the spatial distributions and temporal variations of temperature extremes and compound warm/wet extremes in some regions [18,19,20]. However, CMIP5 and CMIP6 models consistently overestimate the magnitude of temperature anomalies for both hot and cold extremes, with CMIP6 showing modest improvements over CMIP5 [21,22]. CMIP5 and CMIP6 models reproduce warm extremes reasonably well but underestimate the spatial heterogeneity and temporal trends of cold extremes across China with CMIP6 exhibiting reduced biases and inter-model variability [23].
Previous research has predominantly concentrated on assessing seasonal mean or annual extreme climate events at both global and regional scales, with less emphasis on intraseasonal variability in extreme climates. This intraseasonal variability is strongly associated with the occurrence and intensity of extreme climates, which in turn have significant impacts on human health and energy demands [5,6,7]. However, few studies have explicitly addressed the intraseasonal variability in extreme climates, particularly in temperature extremes. This represents a critical research gap, especially for regions like China, where intraseasonal climate variability is strongly influenced by monsoonal dynamics and land–atmosphere interactions.
The IPCC’s Special Report on Managing Extreme Events and Disaster Risks to Promote Climate Change Adaptation (SREX) suggests that shifts in extreme temperature events may result from changes in the mean state and alterations in the probability density function, including metrics such as skewness, kurtosis, and variations in intraseasonal standard deviation [24]. Recent studies have demonstrated that interannual and intraseasonal fluctuations in daily temperature variability can account for more than half of the regional differences in warming trends, potentially outweighing mean-state warming in driving changes in heatwave severity and occurrence rates [6,25]. This suggests that climate models with limited representation of extreme temperature variability may struggle to accurately simulate the frequency and intensity of extreme temperature events. Since variability is strongly associated not only with the occurrence of extreme temperature events but also with their temporal clustering and duration, its accurate simulation is crucial for improving the prediction of temperature extremes. Therefore, a robust evaluation of CMIP model simulations of maximum temperature variability is critical to quantify and correct biases in the magnitude and temporal structure of temperature extremes.
This research aims to evaluate the performance of nine CMIP6 climate models in simulating summer maximum temperature (Tmax) variability, which is calculated by the standard deviation of the daily Tmax in each year’s summer, across China during 1979–2014. The remainder of this study is organized as follows. Section 2 presents the data and methodology. Section 3 shows the performance of nine CMIP6 climate models in reproducing summer Tmax variability over China for the period of 1979–2014. Section 4 summarizes the main conclusions of the present study.
2. Data and Methodology
2.1. Data
Daily Tmax data for the period 1979–2014 from historical simulations of 9 climate models (Table 1) that participated in the CMIP6 project are utilized in this study. The CN05.1 daily Tmax data with a horizontal resolution of 0.25° × 0.25° during 1979–2014, which is interpolated from quality-controlled 2416 meteorological observations [26], is used to evaluate the performance of CMIP6 models. The CN05.1 data was developed by the National Climate Center of China Meteorological Administration. It is generated using an improved “anomaly approach” with thin-plate spline interpolation, which is widely used in climate studies over China. The CN05.1 dataset has been extensively evaluated against independent station data and other gridded products. It performs well in representing temperature variability as well as temperature extremes, although uncertainties may exist in areas with sparse station coverage or complex topography [26]. Note that the CMIP6 and CN05.1 data is re-gridded to a resolution of 1° × 1° in this research for ease of comparison.

Table 1.
The list of 9 CMIP6 models in the present study and their horizontal spatial resolutions.
2.2. Methodology
Here we mainly focus on the performance of CMIP6 models in reproducing summer intraseasonal Tmax variability during 1979–2018. Daily Tmax anomalies were first computed for each day from 1979 through 2014. Specifically, the climatological daily Tmax for each calendar day (i.e., day 1 to day 365) was calculated over the period 1979–2014. This was accomplished by averaging the Tmax values for each specific day across all years in the study period. For example, the climatological mean Tmax for 1 January was obtained by averaging the Tmax values for 1 January from 1979 to 2014. The daily Tmax anomaly for each day in each year was calculated by subtracting the corresponding climatological mean Tmax value on that particular day. Then the summer intraseasonal Tmax variability was quantified as the standard deviation of Tmax anomalies in each year’s summer (June–August, 92 days) during 1979–2018. In this research, a multi-model ensemble (MME) was constructed by assigning equal weights to all 9 models, treating each as equally plausible contributors to the ensemble’s prediction.
The correlation analysis, root-mean-square error (RMSE), mean bias, and Taylor diagrams are utilized to assess the performances of CMIP6 simulations [19,22,27,28]. The temporal trends of Tmax variability in observations and CMIP6 outputs are estimated via linear least squares regression analysis [29]. The significances of correlation coefficients and mean bias are estimated via the Student’s t test.
Taylor diagrams offer an integrated graphical approach for evaluating the performance of climate models by simultaneously presenting three key statistical metrics: the Pearson correlation coefficient, the normalized standard deviation, and the centered root-mean-square error. These diagrams provide a unified visualization that facilitates direct comparison between model outputs and observations in terms of pattern similarity, amplitude, and overall error. In this polar-coordinate system, the reference observation is typically plotted along the horizontal axis, while each model is represented as a point whose angular and radial positions reflect the correlation and standard deviation, respectively. The distance from the reference point corresponds to the centered root-mean-square error, enabling a concise assessment of model fidelity across multiple dimensions in a single framework. This method is particularly useful for diagnosing the ability of multiple models to reproduce observed spatial or temporal variability [19,27].
3. Results
3.1. Comparison of Spatial Distribution and Trend of Summer Tmax Variability over China
To understand the variations in Tmax variability across China, the spatial distribution and temporal trends of summer Tmax variability during 1979–2014 are investigated. This analysis allows us to identify regions with pronounced variability and to detect potential hotspots of increasing or decreasing trends. By exploring these spatial and temporal characteristics, we can gain valuable insights into the regional distribution patterns of Tmax variability over China.
Figure 1 presents climatological summer Tmax variability, quantified as the standard deviation of Tmax anomalies, over China during 1979–2014. The observed spatial distribution of summer Tmax variability from CN05.1 exhibits an evident north–south gradient, with higher variability over northern and central China, where the standard deviation ranges approximately from 2.5 to 4 °C. In contrast, the variability is lower over the Tibetan Plateau and southern China, with standard deviations around 2 °C (Figure 1a). The MME generally exhibits a pronounced Tmax variability peak in the northern region, with a gradual decrease towards the southwest. In particular, the MME overestimates Tmax variability over the Tibetan Plateau and northern China with evident regional bias compared with the CN05.1 (Figure 1b). Individual CMIP6 climate models exhibit diverse performances with substantial inter-model differences in both the magnitude and spatial pattern. GISS-E2-1-G, MIROC6, and MRI-ESM2-0 exhibit a pronounced overestimation in Tmax variability across China especially over northern areas. AWI-CM-1-1-MR, CanESM5, and IPSL-CM6A-LR show a moderate underestimation in Tmax variability over southeastern China. CNRM-CM6-1, EC-Earth3, and MPI-ESM1-2-HR slightly overestimate Tmax variability over northern China and underestimate Tmax variability over southern China. Overall, most CMIP6 climate models are unable to reproduce the general north–south gradient of Tmax variability, and notable biases remain both in the magnitude and spatial distribution.
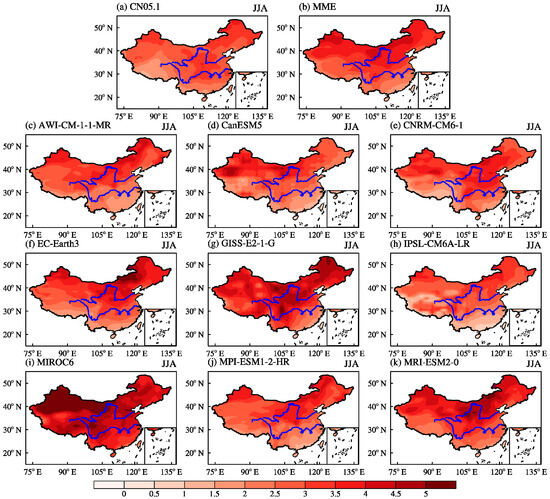
Figure 1.
Climatological summer Tmax variability, quantified as the standard deviation of Tmax anomalies (unit: °C), over China for the period 1979–2014 from (a) CN05.1, (b) multi-model ensemble (MME), and (c–k) individual climate models that participated in CMIP6. The upper thick blue line denotes the Yellow River, and the lower one represents the Yangtze River.
Figure 2 displays temporal trends of summer Tmax variability from CN05.1, MME, and individual climate models that participated in CMIP6. Summer Tmax variability derived from CN05.1 exhibits pronounced positive trends over southeastern and central China, particularly around the middle and lower reaches of the Yangtze River Basin, with rates ranging from 0.1 to 0.2 °C per decade. In contrast, negative trends are detected across parts of southwestern China (Figure 2a). The MME does not capture the overall trend pattern of summer Tmax variability across China. Apart from some regions over northeastern China, MME presents insignificant negative trends of summer Tmax variability (Figure 2b). AWI-CM-1-1-MR exhibits a marked decreasing trend for summer Tmax variability around northeastern and southeastern China and an increasing trend around the central Tibetan Plateau (Figure 2c). Contrary to CN05.1, CanESM5 shows a negative trend around lower reaches of the Yangtze River Basin and a positive trend around the Tibetan Plateau and northeastern China (Figure 2d). Except for limited areas, CNRM-CM6-1, GISS-E2-1-G, MIROC6, MPI-ESM1-2-HR, and MRI-ESM2-0 show insignificant trends over the most regions of China with substantial discrepancies comparing to that of the CN05.1 (Figure 2e,g,i–k). EC-Earth3 exhibits a marked negative trend for summer Tmax variability over northern and central China (Figure 2f). Significant decreasing trends are detected over northeastern China in IPSL-CM6A-LR (Figure 2h). Compared with the CN05.1 model, CMIP6 MME and individual models show poor performances in simulating the trends of Tmax variability in summer over China with divergent trend distributions inconsistent with that of the observation.
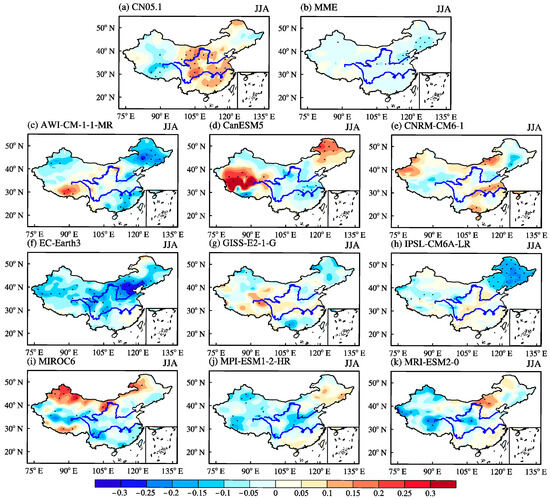
Figure 2.
Temporal trends of summer Tmax variability (unit: °C/decade) from (a) CN05.1, (b) MME, and (c–k) individual climate models that participated in CMIP6. The stippled areas indicate trends with statistical significance exceeding the 95% confidence level. The upper thick blue line denotes the Yellow River, and the lower one represents the Yangtze River.
3.2. Evaluation of CMIP6 Models in Simulating Summer Tmax Variability over China
Accurate simulation of climate extremes is essential for reliable climate projections and impact assessments. In this section, we evaluate the performance of the selected 9 CMIP6 climate models in reproducing summer Tmax variability over China. By comparing model outputs with CN05.1 data, we assess the strengths and limitations of the models and identify areas where improvements are needed. This evaluation provides a basis for selecting appropriate models for future climate projections and for understanding model uncertainties.
Differences in summer Tmax variability between CMIP6 MME, individual climate models, and CN05.1 over China during 1979–2014 are given in Figure 3. The MME displays positive biases in summer Tmax variability over western and northeastern China and negative biases around southeastern China. The most pronounced biases are primarily confined to fragmented regions in western and northern China, where the MME overestimates Tmax by approximately 1.0 to 1.5 °C compared to CN05.1 (Figure 3a). Compared to the CN05.1, both AWI-CM-1-1-MR and MPI-ESM1-2-HR show marked negative biases around middle and lower reaches of the Yangtze River, and with significant positive biases around northwestern Tibetan Plateau with MPI-ESM1-2-HR being less significant (Figure 3b,i). Summer Tmax variability is significantly overestimated around some areas over western China and underestimated over southeastern China in CanESM5 (Figure 3c). The differences in summer Tmax variability between CNRM-CM6-1 and CN05.1 over most regions of China are insignificant except for limited areas over northwestern China (Figure 3d). A large bias in summer Tmax variability between EC-Earth3 and CN05.1 is detected over northeastern China, where EC-Earth3 overestimates Tmax variability by approximately 1–2 °C (Figure 3e). Apart from southeastern China, positive biases in summer Tmax variability occur across most regions of China for GISS-E2-1-G, MIROC6, MPI-ESM1-2-HR, and MRI-ESM2-0 compared to CN05.1. The pronounced biases are predominantly located in western and northern China, with MIROC6 exhibiting the most substantial bias and MRI-ESM2-0 showing a less pronounced one (Figure 3f,h,j). For IPSL-CM6A-LR, significant positive biases in summer Tmax variability are observed over the central Tibetan Plateau, with overestimations of approximately 1.0–1.5 °C. In contrast, pronounced negative biases are present over the western Tibetan Plateau and southeastern China, where the model underestimates variability by about 1.0–2.0 °C (Figure 3g). Overall, CMIP6 individual models exhibit distinct regional biases in summer Tmax variability over China with AWI-CM-1-1-MR, CNRM-CM6-1, and MPI-ESM1-2-HR demonstrating relatively better performance.
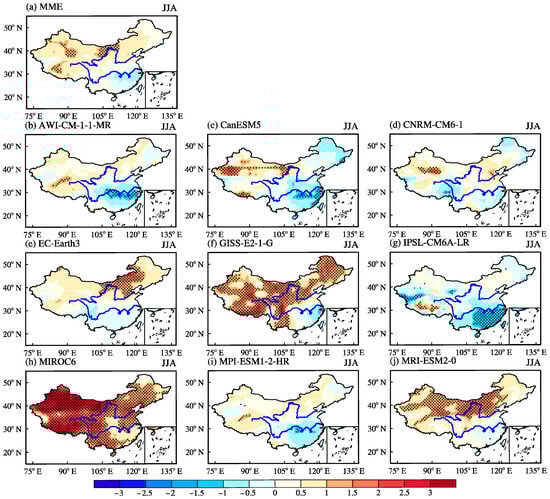
Figure 3.
Differences in summer Tmax variability between CMIP6 (a) MME, (b–j) individual climate models, and CN05.1 over China for the period 1979–2014. The stippled areas indicate differences with statistical significance exceeding the 95% confidence level. The upper thick blue line denotes the Yellow River, and the lower one represents the Yangtze River.
RMSE is a widely used measure that quantifies the average magnitude of the differences between model-simulated values and actual observed values. The RMSE values of summer Tmax variability from CMIP6 MME and individual climate models compared against the CN05.1 data over China during 1979–2014 are shown in Figure 4. The MME shows higher RMSE values, ranging from 0.9 to 1.5 °C, in the lower reaches of the Yangtze River as well as in western and northern China. The MME has a lower RMSE compared to individual CMIP6 climate models with values ranging from 0 to 1.5 (Figure 4a). AWI-CM-1-1-MR and MPI-ESM1-2-HR perform relatively better than other climate models with lower RMSE values. However, large RMSE values, ranging from 0.9 to 1.5 °C, are also detected around middle and lower reaches of the Yangtze River as well as the Tibetan Plateau in AWI-CM-1-1-MR and MPI-ESM1-2-HR (Figure 4b,i). For CanESM5 and CNRM-CM6-1, large RMSE values are scattered across China with the most pronounced errors occurring in the northwest (Figure 4c,d). Compared to the CN05.1 model, EC-Earth3 exhibits large RMSE values over northern China, ranging from 1.5 to 2.1 °C, while showing lower RMSE values over southeastern China (Figure 4e). For IPSL-CM6A-LR, larger RMSE values are evident, ranging from 0.9 to 1.8 °C, around southeastern China and the Tibetan Plateau (Figure 4g). The GISS-E2-1-G, MIROC6, and MRI-ESM2-0 models all yield higher RMSE values than the other models across most regions of China, with GISS-E2-1-G showing the largest errors. Notably, in certain regions, the RMSE for GISS-E2-1-G exceeds 3 °C (Figure 4f,h,j).
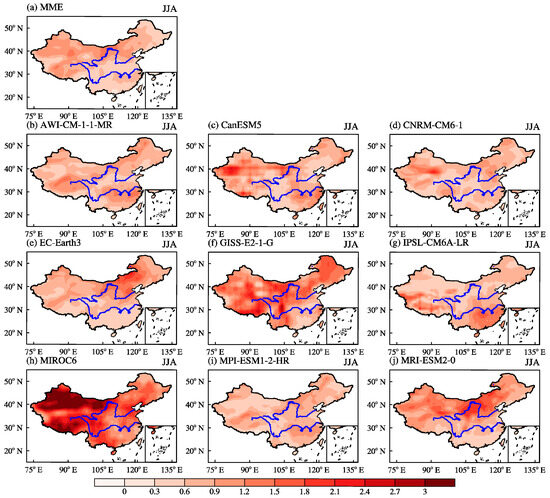
Figure 4.
Root-mean-square error (RMSE) of summer Tmax variability from CMIP6 (unit: °C) (a) MME and (b–j) individual climate models compared against the CN05.1 data over China during 1979–2014. The upper thick blue line denotes the Yellow River, and the lower one represents the Yangtze River.
Correlation coefficients between summer Tmax variability from CMIP6 MME, individual climate models, and CN05.1 over China during 1979–2014 are displayed in Figure 5. As shown in Figure 5a, marked positive correlation coefficients (exceeding 0.3) between summer Tmax variability from CMIP6 MME and CN05.1 are found over southeastern China, with smaller but still significant areas around the western Tibetan Plateau and the northernmost margins of China. In contrast, significant negative correlation coefficients are mainly distributed around southwestern and northeastern China, indicating poor performance of the MME in capturing summer Tmax variability there. Except for a few scattered areas, correlation coefficients between summer Tmax variability simulated by the majority of CMIP6 climate models and CN05.1 are insignificant over China (Figure 5b–d,f,h). For EC-Earth3, significant positive correlation coefficients are observed over southeastern and northeastern China, indicating that EC-Earth3 performs particularly well in these regions (Figure 5e). IPSL-CM6A-LR exhibits pronounced positive correlation coefficients around southeastern China (Figure 5g). For MPI-ESM1-2-HR, significant positive correlation coefficients appear over southeastern China and southern Tibetan Plateau whereas marked negative correlation coefficients occur around northeastern China (Figure 5i). MRI-ESM2-0 shows pronounced positive correlation coefficients over western China (Figure 5j).
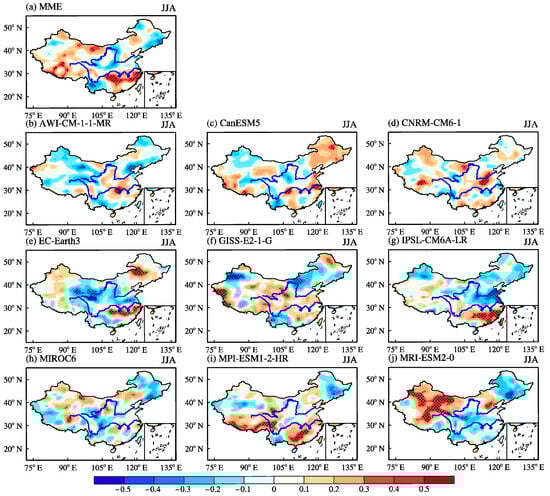
Figure 5.
Correlation coefficients between summer Tmax variability from CMIP6 (a) MME, and (b–j) individual climate models and CN05.1 over China during 1979–2014. The stippled areas indicate correlation coefficients with statistical significance exceeding the 95% confidence level. The upper thick blue line denotes the Yellow River, and the lower one represents the Yangtze River.
The Taylor diagram [28] is employed to estimate the skill of the CMIP6 MME and climate models in simulating the spatial pattern of climatological summer Tmax variability over China during 1979–2014. Figure 6 displays Taylor diagrams for summer Tmax variability from CMIP6 MME and individual climate models as compared with CN05.1 over China during 1979–2014. The performances of CMIP6 MME and individual climate models in capturing summer Tmax variability are distributed loosely, indicating the inter-model spread of summer Tmax variability is large. The MME, EC-Earth3, GISS-E2-1-G, IPSL-CM6A-LR, and MRI-ESM2-0 exhibit relatively higher spatial correlation coefficients, generally exceeding 0.5, indicating a spatial pattern of climatological summer Tmax variability that is more similar to that of CN05.1. MIROC6 shows the lowest spatial correlation coefficient among those nine climate models, with a value of approximately 0.35, suggesting a poor performance of MIROC6 in capturing spatial pattern of climatological summer Tmax variability over China. The normalized spatial standard deviations of the CMIP MME and individual climate models range from 1.2 to 1.5, exceeding that of CN05.1. The normalized spatial standard deviation simulated by IPSL-CM6A-LR is the closest to that of CN05.1. However, MIROC6 and MRI-ESM2-0 represent relatively large normalized spatial standard deviations, which is much larger compared with the CN05.1. The centered pattern root-mean-square differences range from 1.2 to 1.4 with IPSL-CM6A-LR showing the lowest value and MIROC6 exhibiting the largest value. Therefore, the MME, EC-Earth3, GISS-E2-1-G, and IPSL-CM6A-LR perform relatively well in capturing the spatial characteristics of climatological summer Tmax variability over China, outperforming the other climate models. However, MIROC6 possesses a fairly poor ability in simulating the spatial patterns of the climatological summer Tmax variability over China.
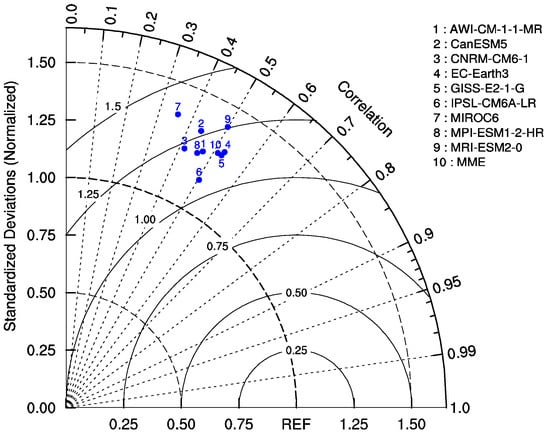
Figure 6.
Taylor diagrams for summer Tmax variability from CMIP6 MME and individual climate models as compared with CN05.1 over China during 1979–2014. The azimuthal axes indicate the spatial correlation coefficient between simulated fields and CN05.1 data. The radial distance from the diagram’s origin represents the normalized spatial standard deviation of each dataset. Radial distances measured from the point labeled “REF” (denoting the CN05.1) correspond to the centered pattern root-mean-square difference. Numerical labels 1 through 9 refer to individual climate model simulations, and label 10 denotes the MME result.
Despite advances in model physics and increased resolution, most CMIP6 models still exhibit substantial limitations in accurately simulating Tmax variability over China. One of the main reasons for the limited performance is that many models still have difficulties in accurately representing key physical processes and the land–atmosphere interactions that strongly influence surface air temperature variability. Particularly, those physical processes related to surface energy partitioning and evapotranspiration processes during heat extremes [30,31,32,33]. Many models struggle to capture the spatial heterogeneity of land cover, vegetation dynamics, and soil moisture feedbacks, all of which play crucial roles in modulating local and regional heat extremes. Furthermore, biases in simulating cloud cover, precipitation, and radiative fluxes can propagate into errors in surface temperature variability [21,30,31,32,33]. These combined limitations underscore the complexity of the processes governing extreme high temperature events and highlight the need to further refine both physical parameterizations and coupled land–atmosphere interactions in climate models to improve the fidelity of future projections of summer temperature extremes.
4. Conclusions
This study conducted a comprehensive evaluation of nine CMIP6 climate models in simulating the intraseasonal summer Tmax variability across China during the historical period of 1979–2014. The variability was quantified as the standard deviation of daily Tmax anomalies for each summer season (June–August), and model performance was assessed relative to the CN05.1 dataset. A suite of statistical metrics, including RMSE, mean bias, and Taylor diagrams, was employed to assess both the spatial distribution and temporal evolution of summer Tmax variability over China during 1979–2014.
The results reveal that most CMIP6 models struggle to replicate the observed spatial gradient of summer Tmax variability, particularly the prominent north–south contrast. The MME generally provides improved performance relative to individual models, capturing broad features of the observed variability and exhibiting lower RMSE and higher correlation coefficients in several regions. Among the individual models, EC-Earth3 and IPSL-CM6A-LR perform relatively well in reproducing both the magnitude and spatial structure of Tmax variability, while MIROC6 displays the poorest performance. In terms of temporal trends, the observed increase in summer Tmax variability over southeastern and central China is poorly captured by most models, which tend to underestimate or misrepresent the spatial pattern and significance of these trends.
Overall, this study provides a systematic assessment of the capabilities and limitations of CMIP6 models in reproducing the intraseasonal variability of summer Tmax over China. The substantial inter-model spread and regional inconsistencies highlight that, despite advancements in model resolution and physical parameterizations, significant uncertainties remain in simulating sub-seasonal temperature variability. The added value of the MME demonstrates the utility of ensemble approaches in reducing individual model biases and enhancing the robustness of simulated climate variability. These findings underscore the ongoing challenges in simulating sub-seasonal temperature variability over complex terrains such as China and highlight the necessity of further improving climate model representations of land–atmosphere interactions and regional-scale processes. Future work should extend the analysis to a broader ensemble of CMIP6 models, incorporate alternative observational datasets for more robust validation, and explore the physical mechanisms underlying the model deficiencies to guide targeted model improvements.
Author Contributions
Conceptualization, J.Z., J.W., and X.L. (Xing Li); methodology, S.L.; Software, S.L.; validation, G.Y., Y.C., and X.L. (Xiao Li); data curation, S.L.; Writing–original draft, J.Z. and S.L.; writing—review and editing, J.Z. and J.W. All authors have read and agreed to the published version of the manuscript.
Funding
This study was jointly supported by the National Natural Science Foundation of China (Grant 42305035), the Natural Science Foundation of Sichuan Province (Grant 2025ZNSFSC1134), the Yunnan Fundamental Research Projects (Grant 202501AT070079), the Second Tibetan Plateau Scientific Expedition and Research (STEP) program (Grant 2019QZKK0105), and the Scientific Research Foundation of Chengdu University of Information Technology (Grants KYTZ201821 and KYTZ202219).
Institutional Review Board Statement
Not applicable.
Informed Consent Statement
Not applicable.
Data Availability Statement
The CMIP6 datasets can be accessed via https://aims2.llnl.gov/search/cmip6/ (accessed on 3 January 2025). The CN05.1 data is derived from http://www.geophy.cn/article/doi/10.6038/cjg20130406 (accessed on 8 September 2024) and is available upon request.
Conflicts of Interest
The authors declare no conflicts of interest.
Abbreviations
The following abbreviations are used in this manuscript:
| CMIP6 | Coupled Model Intercomparison Project Phase 6 |
| MME | Multi-model ensemble |
| Tmax | Maximum temperature |
| WCRP | The World Climate Research Programme |
| IPCC | The Intergovernmental Panel on Climate Change |
References
- IPCC. Climate Change 2014: Synthesis Report; Contribution of Working Groups I, II and III to the Fifth Assessment Report of the Intergovernmental Panel on Climate Change; IPCC: Geneva, Switzerland, 2014. [Google Scholar]
- IPCC. Climate Change 2021—The Physical Science Basis; Cambridge University Press: Cambridge, UK, 2023; ISBN 9781009157896. [Google Scholar]
- Ambadan, J.T.; Berg, A.A.; Merryfield, W.J.; Lee, W.-S. Influence of Snowmelt on Soil Moisture and on near Surface Air Temperature during Winter–Spring Transition Season. Clim. Dyn. 2018, 51, 1295–1309. [Google Scholar] [CrossRef]
- Wu, R.; Chen, S. Regional Change in Snow Water Equivalent–Surface Air Temperature Relationship over Eurasia during Boreal Spring. Clim. Dyn. 2016, 47, 2425–2442. [Google Scholar] [CrossRef]
- Herring, S.C.; Christidis, N.; Hoell, A.; Hoerling, M.P.; Stott, P.A. Explaining Extreme Events of 2018 from a Climate Perspective. Bull. Am. Meteorol. Soc. 2020, 101, S1–S140. [Google Scholar] [CrossRef]
- van der Wiel, K.; Bintanja, R. Contribution of Climatic Changes in Mean and Variability to Monthly Temperature and Precipitation Extremes. Commun. Earth Environ. 2021, 2, 1. [Google Scholar] [CrossRef]
- Li, X.; Sun, J. Atmospheric Circulation Patterns Conducive to Summer Extreme Temperature, Precipitation, and Vapor Pressure Deficit Events over Northeast China. J. Clim. 2025, 38, 835–853. [Google Scholar] [CrossRef]
- Akter, M.Y.; Islam, A.R.M.T.; Mallick, J.; Alam, M.M.; Alam, E.; Shahid, S.; Biswas, J.C.; Alam, G.M.; Pal, S.C.; Oliver, M.M.H. Temperature Extremes Projections over Bangladesh from CMIP6 Multi-Model Ensemble. Theor. Appl. Climatol. 2024, 155, 8843–8869. [Google Scholar] [CrossRef]
- Wang, L.; Zhu, J.; Wang, D. Comparative Analysis of High-Resolution CMIP6 GCM and CMIP5 RCM: Unveiling Biases and Advancements in Simulating Compound Extreme Events in China. Clim. Dyn. 2025, 63, 91. [Google Scholar] [CrossRef]
- Ajjur, S.B.; Al-Ghamdi, S.G. Global Hotspots for Future Absolute Temperature Extremes from CMIP6 Models. Earth Space Sci. 2021, 8, e2021EA001817. [Google Scholar] [CrossRef]
- Roldán-Gómez, P.J.; De Luca, P.; Bernardello, R.; Donat, M.G. Regional Irreversibility of Mean and Extreme Surface Air Temperature and Precipitation in CMIP6 Overshoot Scenarios Associated with Interhemispheric Temperature Asymmetries. Earth Syst. Dyn. 2025, 16, 1–27. [Google Scholar] [CrossRef]
- Collazo, S.; Barrucand, M.; Rusticucci, M. Evaluation of CMIP6 Models in the Representation of Observed Extreme Temperature Indices Trends in South America. Clim. Change 2022, 172, 21. [Google Scholar] [CrossRef]
- Sillmann, J.; Kharin, V.V.; Zhang, X.; Zwiers, F.W.; Bronaugh, D. Climate Extremes Indices in the CMIP5 Multimodel Ensemble: Part 1. Model Evaluation in the Present Climate. J. Geophys. Res. Atmos. 2013, 118, 1716–1733. [Google Scholar] [CrossRef]
- Das, P.; Zhang, Z.; Ghosh, S.; Lu, J.; Ayugi, B.; Ojara, M.A.; Guo, X. Historical and Projected Changes in Extreme High Temperature Events over East Africa and Associated with Meteorological Conditions Using CMIP6 Models. Glob. Planet. Change 2023, 222, 104068. [Google Scholar] [CrossRef]
- Ali, Z.; Hamed, M.M.; Muhammad, M.K.I.; Shahid, S. A Novel Approach for Evaluation of CMIP6 GCMs in Simulating Temperature and Precipitation Extremes of Pakistan. Int. J. Climatol. 2024, 44, 592–612. [Google Scholar] [CrossRef]
- Samuel, S.; Mengistu Tsidu, G.; Dosio, A.; Mphale, K. Assessment of Historical and Future Mean and Extreme Precipitation Over Sub-Saharan Africa Using NEX-GDDP-CMIP6: Part I—Evaluation of Historical Simulation. Int. J. Climatol. 2025, 45, e8672. [Google Scholar] [CrossRef]
- Song, S.; Yan, X. Evaluation of Events of Extreme Temperature Change between Neighboring Days in CMIP6 Models over China. Theor. Appl. Climatol. 2022, 150, 53–72. [Google Scholar] [CrossRef]
- Fan, X.; Miao, C.; Duan, Q.; Shen, C.; Wu, Y. The Performance of CMIP6 Versus CMIP5 in Simulating Temperature Extremes Over the Global Land Surface. J. Geophys. Res. Atmos. 2020, 125, e2020JD033031. [Google Scholar] [CrossRef]
- Zhao, Y.; Qian, C.; Zhang, W.; He, D.; Qi, Y. Extreme temperature indices in Eurasia in a CMIP6 multi-model ensemble: Evaluation and projection. Int. J. Climatol. 2021, 41, 5368–5385. [Google Scholar] [CrossRef]
- Wu, Y.; Miao, C.; Sun, Y.; AghaKouchak, A.; Shen, C.; Fan, X. Global Observations and CMIP6 Simulations of Compound Extremes of Monthly Temperature and Precipitation. GeoHealth 2021, 5, e2021GH000390. [Google Scholar] [CrossRef]
- Di Luca, A.; Pitman, A.J.; de Elía, R. Decomposing Temperature Extremes Errors in CMIP5 and CMIP6 Models. Geophys. Res. Lett. 2020, 47, e2020GL088031. [Google Scholar] [CrossRef]
- Deng, X.; Perkins-Kirkpatrick, S.E.; Lewis, S.C.; Ritchie, E.A. Evaluation of Extreme Temperatures Over Australia in the Historical Simulations of CMIP5 and CMIP6 Models. Earth’s Future 2021, 9, e2020EF001902. [Google Scholar] [CrossRef]
- Yang, Y.; Zhang, Y.; Gao, Z.; Pan, Z.; Zhang, X. Historical and Projected Changes in Temperature Extremes Over China and the Inconsistency Between Multimodel Ensembles and Individual Models from CMIP5 and CMIP6. Earth Space Sci. 2023, 10, e2022EA002514. [Google Scholar] [CrossRef]
- IPCC. Managing the Risks of Extreme Events and Disasters to Advance Climate Change Adaptation; A Special Report of Working Groups I and II of the Intergovernmental Panel on Climate Change; Cambridge University Press: Cambridge, UK, 2012. [Google Scholar]
- Simolo, C.; Corti, S. Quantifying the Role of Variability in Future Intensification of Heat Extremes. Nat. Commun. 2022, 13, 7930. [Google Scholar] [CrossRef] [PubMed]
- Wu, J.; Gao, X.; Giorgi, F.; Chen, D. Changes of Effective Temperature and Cold/Hot Days in Late Decades over China Based on a High Resolution Gridded Observation Dataset. Int. J. Climatol. 2017, 37, 788–800. [Google Scholar] [CrossRef]
- Taylor, K.E. Summarizing Multiple Aspects of Model Performance in a Single Diagram. J. Geophys. Res. Atmos. 2001, 106, 7183–7192. [Google Scholar] [CrossRef]
- Wang, A.; Kong, X.; Chen, Y.; Ma, X. Evaluation of Soil Moisture in CMIP6 Multimodel Simulations Over Conterminous China. J. Geophys. Res. Atmos. 2022, 127, e2022JD037072. [Google Scholar] [CrossRef]
- Ali, S.; Cheema, M.J.M.; Waqas, M.M.; Waseem, M.; Awan, U.K.; Khaliq, T. Changes in Snow Cover Dynamics over the Indus Basin: Evidences from 2008 to 2018 MODIS NDSI Trends Analysis. Remote Sens. 2020, 12, 2782. [Google Scholar] [CrossRef]
- van den Hurk, B.; Kim, H.; Krinner, G.; Seneviratne, S.I.; Derksen, C.; Oki, T.; Douville, H.; Colin, J.; Ducharne, A.; Cheruy, F.; et al. LS3MIP (v1.0) Contribution to CMIP6: The Land Surface, Snow and Soil Moisture Model Intercomparison Project—Aims, Setup and Expected Outcome. Geosci. Model Dev. 2016, 9, 2809–2832. [Google Scholar] [CrossRef]
- Jiang, D.; Hu, D.; Tian, Z.; Lang, X. Differences between CMIP6 and CMIP5 Models in Simulating Climate over China and the East Asian Monsoon. Adv. Atmos. Sci. 2020, 37, 1102–1118. [Google Scholar] [CrossRef]
- Xu, L.; Dirmeyer, P. Snow-Atmosphere Coupling Strength in a Global Atmospheric Model. Geophys. Res. Lett. 2011, 38, L13401. [Google Scholar] [CrossRef]
- Benson, D.O.; Dirmeyer, P.A. The Soil Moisture–Surface Flux Relationship as a Factor for Extreme Heat Predictability in Subseasonal to Seasonal Forecasts. J. Clim. 2023, 36, 6375–6392. [Google Scholar] [CrossRef]
Disclaimer/Publisher’s Note: The statements, opinions and data contained in all publications are solely those of the individual author(s) and contributor(s) and not of MDPI and/or the editor(s). MDPI and/or the editor(s) disclaim responsibility for any injury to people or property resulting from any ideas, methods, instructions or products referred to in the content. |
© 2025 by the authors. Licensee MDPI, Basel, Switzerland. This article is an open access article distributed under the terms and conditions of the Creative Commons Attribution (CC BY) license (https://creativecommons.org/licenses/by/4.0/).