Abstract
Biomass burning processes affect many semi-rural areas in the Mediterranean, but there is a lack of long-term datasets focusing on their classification, obtained by monitoring carbonaceous particle concentrations and optical properties variations. To address this issue, a campaign to measure equivalent black carbon (eBC) and particle number size distributions (0.3–10 μm) was carried out from August 2019 to November 2020 at a coastal semi-rural site in the Basilicata region of Southern Italy. Long-term datasets were useful for aerosol characterization, helping to clearly identify traffic as a constant eBC source. For a shorter period, PM2.5 mass concentrations were also measured, allowing the estimation of elemental and organic carbon (EC and OC), and chemical and SEM (scanning electron microscope) analysis of aerosols collected on filters. This multi-instrumental approach enabled the discrimination among different biomass burning (BB) processes, and the analysis of three case studies related to domestic heating, regional smoke plume transport, and a local smoldering process. The AAE (Ångström absorption exponent) daily pattern was characterized as having a peak late in the morning and mean hourly values that were always higher than 1.3.
1. Introduction
The study of the microphysical and chemical properties of atmospheric aerosols is still a challenge due to the relevance of this component for atmospheric radiative transfer, cloud formation, and human health. Aerosol microphysical and chemical properties at rural, semi-rural, remote, and coastal sites have not been studied as intensively as those at urban sites, but interest in aerosol characterization in these zones has been growing over recent years. Semi-rural sites are characterized by locally produced aerosols that are mainly carbonaceous, produced by biomass processes, and often modified by interactions with short and long-scale transported particles.
As described in [1], among atmospheric aerosols, the formation mechanisms, sources, and structures of the carbonaceous fraction are poorly understood, although these aerosols contribute significantly to the atmospheric composition in rural sites. Sciare et al. [2], during a 5-year campaign in Crete, focused their attention on the importance of carbonaceous aerosols in the Eastern Mediterranean area where, especially during summer, transport of sulfate and carbonaceous particles from the Balkans, Turkey, and Central/Eastern Europe can be observed. The interaction of these components adds further elements to be considered, such as size and chemical composition variation. Ziková et al. [3] measured, for two years, particle number size distributions by means of an SMPS at the observatory at Košetice, a rural site in the Czech Republic, highlighting annual and diurnal cycles of new particle formation (NPF) events. Gill et al. [4] analyzed a five-year dataset of the main chemical compositions of particles collected in a rural area in Lithuania, highlighting, in the submicron range, a local source of organic aerosols (OAs) and a transport contribution of both SO2 and NH4+.
In recent years, many studies, including [5], have suggested that aerosol number size distributions, rather than aerosol mass (PM10, PM2.5), represent the danger of atmospheric aerosols to human health. Therefore, studies on fine and ultrafine aerosol size distributions are needed, owing to their relevance in condensation/coagulation processes that, by changing the size distribution, modify the ability of particles to become cloud condensation nuclei (CCN). Undoubtedly, the availability of a wide array of instruments has allowed scientists to extensively describe atmospheric particulate matter. For example, during the “Multidisciplinary drifting Observatory for the Study of Arctic Climate” (MOSAiC) expedition in the central Arctic, from October 2019 to September 2020 [6], an AMS (aerosol mass spectrometer) and an SMPS (scanning mobility particle sizer) were used. Measurements taken included particle number concentrations, size distributions, and the chemical composition and mass concentration of black carbon, sulfates, nitrates, ammonium, chlorides, and organics, emphasizing the exclusion by AMS of refractory particles, such as sea aerosols. The marine aerosol component, or sea-spray particles, is one of the major natural atmospheric constituents, and the corresponding size distributions can be studied only in a “pure” marine context. The Tara Pacific Expedition described in [7], among other studies, highlighted the different shapes of the size distributions depending on the areas of data recording (Atlantic or Pacific Ocean).
Biomass burning processes affect semi-rural areas in Southern Italy throughout the year, due to both agricultural activities and domestic heating, but there is still a lack of long-term measurements identifying and characterizing these processes.
In the framework of the OT4Clima project (Development of Innovative Earth Observation Technologies for the Study of Climate Change and Its Impacts on the Environment), an extended measurement campaign for eBC concentrations and estimations of aerosol number size distributions (0.3–10 µm) took place from August 2019 to November 2020 in Southern Italy, at a semi-rural site in the Basilicata region, close to the Ionian Sea. The long-term dataset allowed the identification of daily cycles of eBC, the AAE, fine number counts of NC1 (particles counts for equivalent diameter Deq ≤ 1 μm), and coarse number counts of NC1_10 (particles counts for equivalent diameter 1 μm < Deq ≤ 10 μm). For a shorter and discontinuous period (February 2020–October 2020, 108 samples), as described by [8], a PM2.5 low-volume sampler, equipped with quartz filters, recorded measurements at the site. Chemical post-processing analysis of filters allowed the determination of water-soluble ions (Cl−, NO3−, Br−, SO42−, C2O42−, K+, and NH4+) and concentrations of twelve main elements (Al, Ca, Cr, Cu, Fe, Mg, Mn, Na, Pb, Sr, Ti, and Zn), together with elemental and organic carbon (EC, OC) concentrations.
The estimation of eBC, AAE, NC1, and EC/OC parameters highlighted days with biomass burning fingerprints associated with different combustion processes (domestic heating, regional BB plume transport, and local smoldering). For these days, morphological and compositional characteristics were studied by means of an SEM, together with chemical analysis. Concerning marine aerosol, a diffuse presence of Na and Mg and, to a lesser extent, of Cl on particles observed with an SEM, can be considered as a chemical “background” signature. A day characterized by constant winds blowing from the sea toward the site highlighted specific sea-salt morphological structure and chemical composition.
2. Site Description
The site hosting the instruments is an agricultural area managed by ALSIA (Regional Agency for Development and Innovation in Agriculture, 40.39° N, 16.79° E, Basilicata region), which lies approximately 5 km from the Ionian Sea. It is surrounded by three roads: E847, E90, and SP3, and by a 50 km coastal forest dominated by “Pinus Halepensis”, “Pinus Pinea”, and “Pinus Pinaster” (Carabinieri Italian Department for Biodiversity https://rgpbio.it/riserva/metaponto, accessed 2 May 2025). Some villages, characterized by cultivations of citrus, fruits in general, and vegetables are located behind the pine forest. To the north, northwest, and northeast lie several towns (each with a few thousand inhabitants) and Matera (about 64,000 inhabitants). To the northeast, the Taranto pollution hot spot (steel plant, oil refinery, harbor), does not affect air quality in the measurement site, as shown in a WHO document [9]. PM10 fallout maps show emissions localized around the source, extending southeastward. In Figure 1a,b, a Google Earth image shows the ALSIA location and the surrounding area with a close-up image of the measurement site.
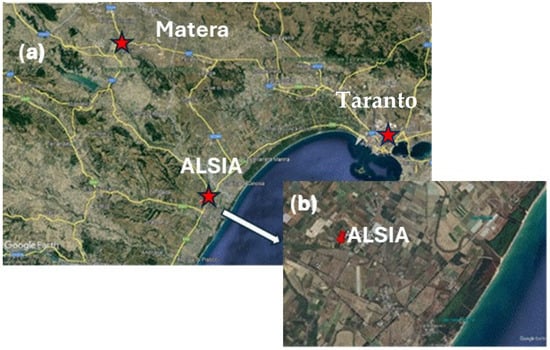
Figure 1.
(a) Measurement site and surroundings, including Matera city (about 35 km far). (b) Zoom-in on the measurement site area with the pine forest.
Air mass circulation at the site was described by means of the HYSPLIT model (https://www.ready.noaa.gov/HYSPLIT.php, accessed on 1 July 2025), which clusters backward trajectories by similar advection conditions and paths as described by [10]. Both cold (October 2019–March 2020) and warm (April–September 2020) seasons were considered (Figure 2a,b).
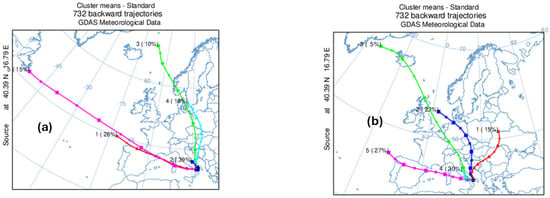
Figure 2.
(a) Cluster analysis of HYSPLIT back trajectories for cold season (b) and warm season.
Air masses from North–Central Europe and the Mediterranean occurred in both cases. However, the Atlantic air mass observed in winter disappeared in summer, while cold-season and shorter trajectories crossing the Adriatic Sea shifted toward the Balkans during warm months. The proximity of the Ionian Sea favors mild seasons, confirmed by ALSIA meteorological data, with <T> = 12° ± 5° and <RH> 75% ± 16% in winter and <T> = 22° ± 6° and <RH> 63% ± 19.0% in summer. Mean wind speeds were similar across seasons (2.4 ± 1.8 m/s winter, 2.3 ± 1.4 m/s summer), with prevailing W–NW–N, and minor SW contributions. SE winds (marine direction) were stronger in winter than summer (Figure 3a,b).
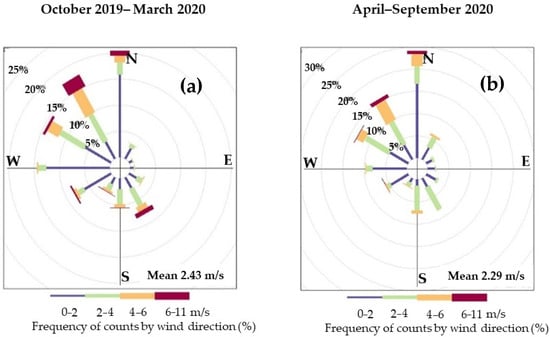
Figure 3.
Wind roses for (a) cold season; (b) warm season.
3. Instruments and Methods
The long-term campaign was realized by means of an AE33 aethalometer (MAGEE Scientific, Ljubljana, Slovenia) and an optical particle sizer (OPS) 3330 TSI (Minneapolis, MA, USA). The aethalometer, equipped with a PM2.5 cyclone (M4110 SC Cyclone, (Magee Scientific, Ljubljana, Slovenia), estimated eBC concentrations by measuring aerosol optical absorption at seven wavelengths (λ = 370, 470, 520, 590, 660, 880, and 950 nm). Dual-spot technology avoided shadowing effect [11]. eBC concentration was derived using the manufacturer’s calculation for M8060 filter tape (C = 1.39) [12]. A mass absorption coefficient (MAC) of 7.77 m2 g−1 at 880 nm was applied, consistent with the 7.8 m2 g−1 reported for AE33 [13]. The AAE was calculated by means of an exponential best-fit technique applied to absorption coefficients over 470–950 nm [14], requiring no harmonization as AAE represents the fitting exponent. Aerosol size distributions (0.3–10 μm) were measured optically: particles sampled through a static dissipative flexible tube at a 2 L/min flow rate were counted via scattered light detection across 16 channels (5-minute resolution). Hourly and daily measurements were used to evaluate the correlation between OPS and AE33 data. For a shorter period (February–October 2020, 108 samples), PM2.5 was collected using a low-volume Explorer Plus sampler (Zambelli, Bareggio, Italy). As described in [8], quartz filters (Whatman Q-grade 47 mm in diameter) were pre-heated at 700 °C for 2 hours pre-deployment, to contain carbon contamination. After gravimetric PM2.5 determination, filters were quartered for chemical and single particle analyses. EC and OC concentrations were determined with a Sunset EC/OC Analyzer (Tigard, Oregon, USA). Secondary organic carbon (SOC) was derived via the EC tracer method [15,16]. Chemical analysis identified water-soluble ions (Cl−, NO3−, Br−, SO42−, C2O42−, K+, NH4+) and major elements (Al, Ca, Cr, Cu, Fe, Mg, Mn, Na, Pb, Sr, Ti, Zn). Morphological and chemical composition were determined using a field emission scanning electron microscope (FESEM, Zeiss Supra 40, Oberkochen, Germany) coupled with an energy-dispersive X-ray spectrometer (EDS, Oxford Inca Energy 350, Abingdon, UK) and an INCA Xact SDD detector, Oxford Inca Energy 350, Abingdon, UK.
4. Results and Discussion
4.1. Long-Term Aethalometer Measurements
Figure 4a,b display monthly mean eBC and AAE values, with a grey box indicating COVID-19 restriction months. Despite restrictions, the high April AAE (1.43 ± 0.09) reflects persistent agricultural activities like tree residue burning. The lowest AAE occurred in June (1.17 ± 0.12) but values rose in July due to biomass burning of uncultivated areas and post-harvest wheat residues.

Figure 4.
Histograms of (a) monthly mean values of eBC and (b) monthly mean values of the AAE parameter.
Notably, 87.5% of hourly eBC concentrations ranged between 250 and 1000 ng/m3, closely matching values from two semi-rural sites in the Basilicata region [17]. For AAE, 80.7% of hourly values fell within the range 1.4–1.6 (Figure S1a,b).
Figure 5a,b show daily patterns of hourly mean eBC and AAE values, estimated over the entire dataset. eBC exhibits typical traffic-related two-peaks behavior, consistent with the weekly cycle reported in Figure S2. However, on weekends, the nocturnal peak occurs later. Hourly mean AAE values are ≥1.3, peaking broadly during the daytime (≈1.38). This diurnal peak persists regardless of the weekday (Figure S2), suggesting a continuous source of absorbing carbonaceous aerosols, though this is unverified due to insufficient data.
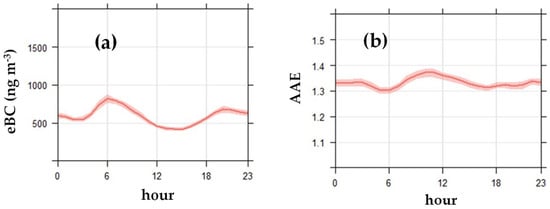
Figure 5.
(a) Daily pattern of hourly mean values of eBC concentrations; (b) daily pattern of hourly mean values of the AAE parameter.
To further investigate the sources of carbonaceous particles, polar plots representative of the entire dataset for eBC and AAE are shown in Figure 6a,b. This graphical tool bins hourly mean eBC concentrations against wind speed/directions, as described by [18]. Figure 6a highlights the highest eBC concentrations immediately around the site, with two lower-concentration corridors: one NW–SE (aligning SP3 road and domestic heating) and another NE (along the E90 highway). For AAE (Figure 6b), the highest values predominantly originate from the northwest and, secondarily, to the southwest, suggesting contributions from winter domestic heating and summer biomass burning. A broad surrounding zone exhibits AAE values between 1.2 and 1.4.
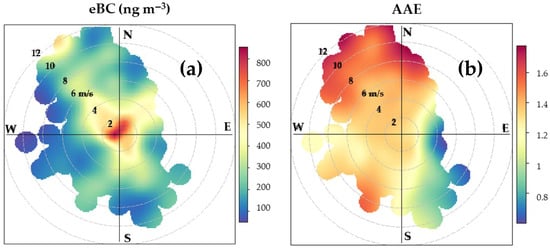
Figure 6.
(a) Polar plots for eBC and (b) for AAE over the entire dataset.
4.2. Long-Term OPS Measurements
Number size distributions were measured from October 2019 until December 2020, with a temporary stop during April–June 2020 due to TSI 3330 instrument issues.
Figure 7 shows the mean size distribution and standard error calculated over the entire dataset (7276 data). Two modes can be identified: one Deq ≈ 1 µm and another one Deq ≈ 1.56 µm. The latter was observed in a recent campaign conducted at a semi-rural site in the Basilicata region, as in [19], and, as suggested by [20], attributed to the vehicular traffic. Figure 8a,b display daily patterns of hourly mean values for NC1 and NC1_10 concentrations. The fine fraction shows a midday minimum value, like eBC, but with greater fluctuations, reflecting the multi-component nature of NC1. This is corroborated by the NC1/eBC scatterplot (R2 = 0.62; Figure 9). The coarse fraction peaks in the afternoon, probably due to resuspended soil particles and black carbon aging. High fluctuations relate to additional coarse particle sources, such as Saharan dust intrusions, observed occasionally. Figure S3 reports the HYSPLIT back trajectories cluster analysis for October–December 2020, with 11% of trajectories originating near North Africa, indicating possible dust transport.
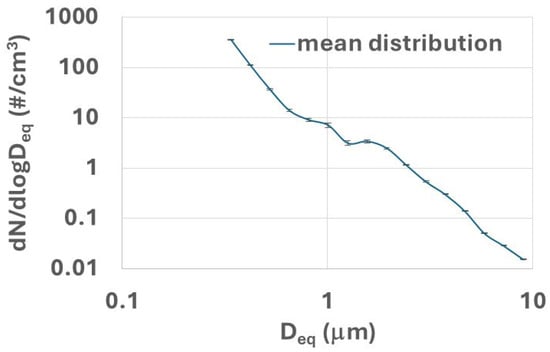
Figure 7.
Mean size distribution and the associated standard error calculated over the entire dataset.
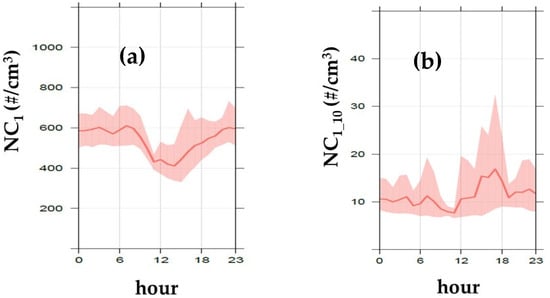
Figure 8.
(a) Daily pattern of hourly mean values for NC1 concentrations and (b) NC1_10.
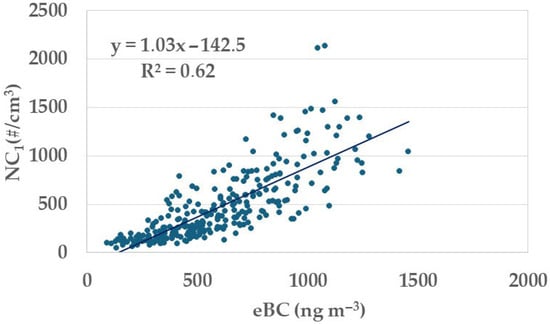
Figure 9.
Scatterplot showing the fine fractions NC1 and eBC.
4.3. Microphysical and Chemical Characterization of Aerosol from Different Sources
Integrated analysis of eBC, AAE, NC1, NC1_10, SOC, and PM2.5 identified days with distinct aerosol characteristics. The background day exhibited minima in NC1 and NC1_10, eBC, and PM2.5. Elevated SOC, AAE, and/or eBC characterized days impacted by domestic heating, regional biomass burning plume, and local fires. A day with persistent onshore winds characterized fresh/aged sea-spray aerosol. Table 1 reports chemical compositions for background and source-impacted days, with color scales (green: low, red: high) indicating element concentrations per column. Background composition is predominantly green, indicating low concentrations of all components.

Table 1.
Aerosol chemical composition for days affected by specific sources. The concentrations of each element are reported with a color scale (green: low value; red: high value).
SEM observations (Figure 10a,b) revealed relatively “clean” filters, with aluminosilicates, biogenic particles (pollen), and occasional Na/Mg condensed phases, indicative of a marine environment.
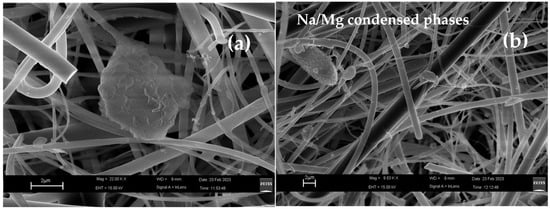
Figure 10.
(a) SEM images for the background day of an aluminosilicate particle; (b) pollen and condensed phases of Na/Mg.
4.3.1. Combustion Sources: 25 February 2020, BB from Domestic Heating
On 25 February 2020, the highest values of SOC, OC, EC, K+, and near-maximum oxalates occurred, alongside with elevated Zn, nitrate, and sulfate concentrations. SEM observations pointed out condensed phases on particles, with Na-S and Na-Mg compositions. Larger particles (~3 μm) were primarily Ca/Na sulfates and agglomerated soot, with Na-S and Na-S-K e Na-S-Mg inclusions (Figure 11a). Electron backscattering analysis revealed many spherical Fe-only particles with ≈1 μm sized diameters (Figure 11b).
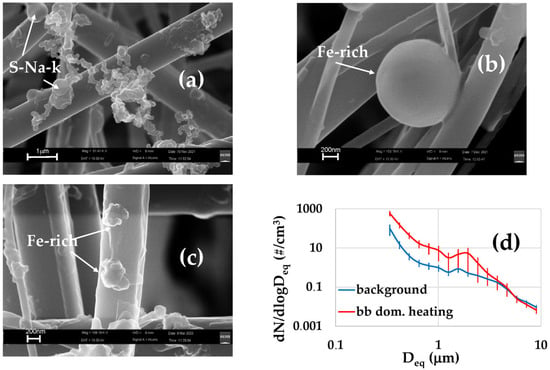
Figure 11.
(a) Soot agglomerate with S-Na-K inclusion. (b) Spherical Fe-rich particle. (c) Fe-soluble particles. (d) Size distribution and standard deviations for BB domestic heating and background.
Spherical morphology typically indicates combustion-derived particles [21], though sizes vary by process. Wilczynska-Michalik et al. [22] observed fine (≈100–200 nm) Fe-rich spherical particles associated with traffic in Krakow. Ault et al. [23] documented large (~6 µm) Fe-spherical fly ash particles in industrial Cleveland. Wiinikka et al. [24] reported bimodal aerosol size distributions from pellet combustion in PM2.5 with refractory metals (including Fe) contributing to the larger mode of ≈0.8 μm. Additionally, Fe-soluble particles with melted morphology and sizes of about 500 nm were observed (Figure 11c). Paris et al. [25], during flights of the AMMA-SOP0/DABEX campaign, concluded that iron solubility is higher in biomass burning than in dust samples, relating iron solubility to different aerosol sources, as confirmed by [26]. Yang et al. [27] found the highest iron solubility in Atlanta PM2.5 during the warm season, when aerosol acidity and oxalate content were the highest. On 25 February 2020, oxalate concentration was the second-highest and SO−4 was the highest (Table 1), supporting domestic heating as the source of Fe-rich particles (spherical/soluble). Size distribution comparison with background (Figure 11d) shows similar coarse fractions (EAD ≥ 3.75 mm), indicating a comparable geogenic contribution. The highest fine fraction suggests strong sulfate and nitrate contributions.
4.3.2. Combustion Sources: 1 August 2020, Regional BB Plume Transport
A procedure integrating long-term eBC, satellite fire data (MODIS and VIIRS), and HYSPLIT back trajectories [28] identified 1 August 2020 as being influenced by Apulia regional fires. Chemical analysis showed the maximum concentration of oxalate and the second-highest concentration of K, EC, OC, and SOC, all biomass burning tracers. Geogenic components and sulfates reached their highest concentrations, likely from soil lifting during wildfires. SEM observations revealed heavily loaded filter, consistent with the highest PM2.5 concentration, widespread S-K crystals (Figure 12a), and condensed phases on fiber filters with low-Z elements, possibly ammonium nitrate. BC appeared as agglomerates, occasionally with aluminosilicate inclusions, and as freshly emitted soot. Figure 12b shows a BC agglomerate partially covering an aluminosilicate, while Figure 12c shows aged BC with S-Ca-K inclusions.
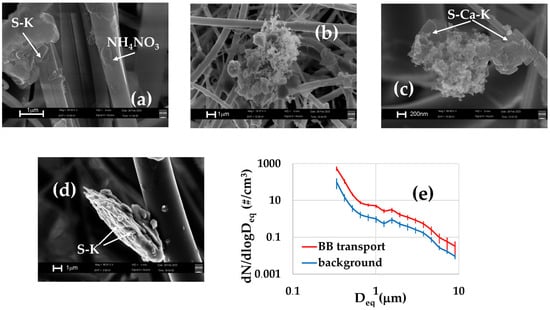
Figure 12.
(a) S-K crystals and condensed phases. (b) BC agglomerate partially covering an aluminosilicate. (c) Aged BC particle with inclusion of S-Ca-K. (d) Aluminosilicate with small (about 200 nm) S-K salt on the surface. (e) Background and BB transport aerosol size distributions and standard deviations.
4.3.3. Combustion Sources: 22 June 2020, Local Smoldering Process
On 22 June 2020, the highest value of OC and K+ concentrations occurred. High-time resolution aethalometer data highlighted low eBC concentrations (<<500 ng/m3), with two 3-hour peaks (the second more intense; maximum 2482 ng/m3, Figure 13). AAE peaked once, coinciding with the second eBC peak, but lasting longer (13:00–21:00).
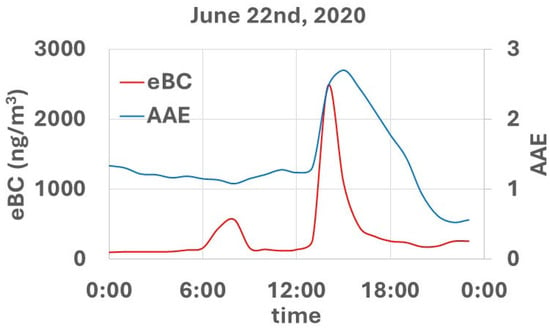
Figure 13.
Time behavior of eBC concentrations and AAE for the process of smoldering.
This suggests an initial low-intensity combustion process, not producing OC absorbing particles, followed by a second process where AAE rose from 1.2 to 2.7. Source-dependent ratios OC/EC and K+/OC are commonly used to classify combustion processes. Popovicheva et al. [29] found OC/EC = 55.6 for Moscow regional biomass fires, while [30] estimated 23 ≤ OC/EC ≤ 72 for Alaskan peat smoldering. The characterization of biomass burning emissions has been realized with both laboratory and in-field experiments. Hong et al. [31] studied emissions from wheat and rice straw in a biomass burning chamber, simulating both smoldering and flaming processes. They found higher OC/EC ratios for smoldering conditions (6.15–9.74) than flaming (3.37–7.64) ones. In the biomass burning experiment, realized in a laboratory chamber with rice and corn straw, Wang et al. [32] proposed K+/OC < 0.1 as a smoldering indicator. Popovicheva et al. [33] performed daily measurements to characterize peat bog smoldering emissions (spring–late summer 2014), observing OC/EC between 10 and 20 and AAE ≤ 4.1. In the present study, the variation of high time-resolution eBC and AAE data, with OC/EC = 26.6 and K+/OC = 0.1, suggests local smoldering.
SEM observations showed diffuse K and S, tar-balls, and many particles about 1 μm in size, mainly composed of Cl-Na-K and S. Figure 14a,b highlight small K-Cl spherical particles (~200 nm) and condensed K-Cl particles. Soot appeared fresh and aged. In Figure 14c, an aged soot particle with S-K inclusion and/or partial coating is shown. Mixed aluminosilicate particles with S-K-Na partial coating were also found (Figure 14d). Abundant Cl, K, and Na in in-field measurements align with laboratory smoldering signatures [32].
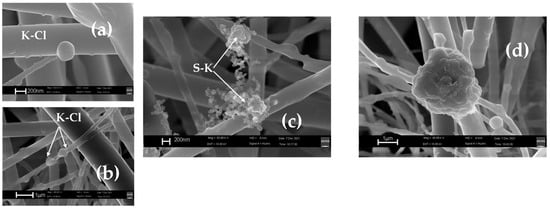
Figure 14.
(a,b) Spherical and condensed K-Cl particles; (c) aged soot particle with S-K inclusions; (d) aluminosilicate particle with partial coating of S-K-Na.
In particular, Li et al. [34] associate K-Cl with young biomass burning smoke, while K2SO4 and KNO3 indicate aged plumes. Moreover, Cl implies fire proximity as Cl depletion increases with distance, forming K-sulfates and nitrates.
4.3.4. Marine Source: 1 March 2020
Although the wind typically blows seaward, ref. [8] estimated that sea-spray contributes, on average, 2.9% to PM2.5 as a marine “background” contribution to the aerosol composition. Among days with 50% SE winds, 1 March 2020 was selected to study fresh/aged marine particles. Mean wind speed was 2.8 ± 1.1 m/s, higher and less variable than the cold season average (2.4 ± 1.8 m/s).
Chemical analysis (Table 1) showed the highest concentrations of Na and Br with Cl and sulfur. Assuming that all Na and Cl were marine-derived, sea-salt aerosol concentration was estimated according to [35]:
[ssa] = 1.4468 [Na+] + [Cl−]
obtaining [ssa] = 1.06 µg/m3 (12.6% of daily PM2.5), an order of magnitude above average. In agreement with these results, SEM analysis revealed a widespread secondary sulfur on aluminosilicates (Figure 15a,b) or as Ca-S (Figure 15c). Similar Ca-S particles were observed west of Cuba during the TARA cruise expedition [7]. In the absence of any biomass burning process, S-particles likely derive from secondary marine aerosol produced by dimethyl sulfide (DMS) oxidation [36].
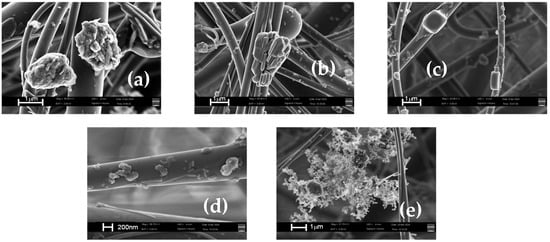
Figure 15.
(a) S-secondary phases. (b) S-secondary phase on aluminosilicates. (c) Ca-S particles. (d) NaCl crystals. (e) Inclusion of NaCl crystals in aged soot particle.
NaCl crystals appeared as 1 μm single particles or as inclusions in aged soot (Figure 15d,e), pointing out the strong marine fingerprint.
Marine size distribution compared to background (Figure 16a) shows composition-driven differences across sizes. The review by Su et al. [37] reports that sea particles span from 0.01 μm to the super micron range. The background 1.56 μm peak shifts to 1.94 μm, likely due to internal mixed particles (e.g., aged BC with inclusions and/or to S-coated particles). The filter section in Figure 16b shows a BC agglomerate (>2 μm) with a sea-salt inclusion on the right, a gypsum particle near a sea-salt crystal in the center (≤2 μm), and fibers rich in fresh soot and fine secondary phases (<1 μm). Particle dimensions in Figure 16b align with the size distribution.
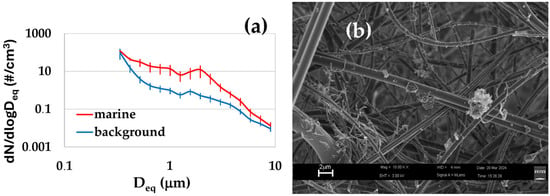
Figure 16.
(a) Background and marine aerosol size distributions and standard deviations; (b) part of the “marine” filter showing a BC agglomerate with a sea-salt inclusion, a sea-salt crystal, a gypsum particle, fresh soot, and secondary phases.
5. Conclusions
A multi-instrumental campaign characterized aerosol properties under specific combustion sources at a semi-rural coastal site in Southern Italy. Long-term eBC concentrations and number size distributions were collected for over a year, supplemented by shorter-term PM2.5 measurements, enabling EC/OC estimation and chemical/SEM analysis.
The main results can be summarized as follows:
- (1)
- Biomass burning processes (varying characteristics) and vehicular traffic are relevant aerosol sources, confirmed by eBC and NC1 correlation (R2 = 0.62).
- (2)
- Multi-parametric analysis identified different biomass burning processes, including local smoldering (AAE maximum = 2.7; OC/EC = 26.6; K+/OC = 0.1).
- (3)
- Each combustion source exhibited unique size distributions and aerosol properties.
- (4)
- A day with seaward wind direction showed a clear marine signature (elevated Na, Br, and Cl). The diffuse S-particles were attributed to the oxidation of marine DMS. Site proximity to the sea allowed observation of fresh and aged marine particles.
In conclusion, unlike laboratory studies where combustion sources are simulated and controlled, this in-field study advances the characterization of particle emissions from diverse biomass burning processes. Long-term eBC measurements, integrated with SEM for study cases, improve the identification and characterization of biomass emissions in semi-rural areas.
Supplementary Materials
The following supporting information can be downloaded at: https://www.mdpi.com/article/10.3390/atmos16070866/s1. Figure S1: Histograms of eBC concentrations and AAE values over the entire dataset. Figure S2: Weekly average pattern of eBC and AAE. Figure S3: Cluster analysis of HYSPLIT back trajectories for the period of October–December 2020.
Author Contributions
Conceptualization, G.P. and D.C.; methodology, G.P., A.D. and A.P.; formal analysis, M.C., A.D., F.E., A.L. and M.M.; investigation, G.P., M.C. and A.D.; resources, G.P. and D.C.; data curation, G.P., A.D., M.C., G.E.D.B., F.E., A.L., M.M., C.M., A.P. and D.C.; writing—original draft preparation, G.P.; writing—review and editing, G.P., A.D., M.C., F.E., A.L. and D.C.; visualization, G.P., M.C., M.M. and A.L.; supervision, G.P. and D.C.; funding acquisition, G.P. and D.C. All authors have read and agreed to the published version of the manuscript.
Funding
This work was supported by the project OT4CLIMA (Innovative Earth Observation technologies to study Climate Change and its impact on the environment-D.D. MIUR 2261 delm6.9.2018, PON R&I 2014-2020 e FSC).
Data Availability Statement
Dataset will be made available upon request to the authors.
Acknowledgments
The authors would like to thank ALSIA for hosting our instruments and for providing meteorological data. The authors are grateful to Emanuele Scalcione, Pietro Zienna, and Cosimo De Monte who made our measurement campaign possible. The authors are thankful to Francesca Agresti for her control of instrument operation during the COVID-19 pandemic.
Conflicts of Interest
The authors declare no conflicts of interest. The funders had no role in the design of the study; in the collection, analyses, or interpretation of data; in the writing of the manuscript; or in the decision to publish the results.
References
- Yttri, K.E.; Simpson, D.; Bergström, R.; Kiss, G.; Szidat, S.; Ceburnis, D.; Eckhardt, S.; Hueglin, C.; Nøjgaard, J.K.; Perrino, C.; et al. The EMEP Intensive Measurement Period campaign, 2008-2009: Characterizing carbonaceous aerosol at nine rural sites in Europe. Atmos. Chem. Phys. 2019, 19, 4211–4233. [Google Scholar] [CrossRef]
- Sciare, J.; Oikonomou, K.; Favez, O.; Liakakou, E.; Markaki, Z.; Cachier, H.; Mihalopoulos, N. Long-term measurements of carbonaceous aerosols in the Eastern Mediterranean: Evidence of long-range transport of biomass burning. Atmos. Chem. Phys. 2008, 8, 5551–5563. [Google Scholar] [CrossRef]
- Zíková, N.; Ždímal, V. Long-Term measurement of aerosol number size distributions at rural background station Košetice. Aerosol Air Qual. Res. 2013, 13, 1464–1474. [Google Scholar] [CrossRef]
- Gill, T.; Pauraité, J.; Kalinauskaité, A.; Byčenkienė, S.; Plauškaitė, K. Long-term study of chemical characteristics of aerosol compositions in the rural environment of Rūgšteliškis (Lithuania). Atmos. Pollut. Res. 2024, 15, 102048. [Google Scholar] [CrossRef]
- Rohra, H.; Pipal, A.S.; Satsangi, P.G.; Taneja, A. Revisiting the atmospheric particles: Connecting lines and changing paradigms. Sci. Total Environ. 2022, 841, 156676. [Google Scholar] [CrossRef]
- Heutte, B.; Bergner, N.; Beck, I.; Angot, H.; Dada, L.; Quéléver, L.L.J.; Laurila, T.; Boyer, M.; Brasseur, Z.; Daellenbach, K.R.; et al. Measurements of aerosol microphysical and chemical properties in the central arctic atmosphere during MOSaiC. Sci. Data 2023, 10, 690. [Google Scholar] [CrossRef]
- Flores, J.M.; Bourdin, G.; Altaratz, O.; Trainic, M.; Lang-Yona, N.; Dzimban, E.; Steinau, S.; Tettich, F.; Planes, S.; Allemand, D.; et al. Tara Pacific expedition’s atmospheric measurements of marine aerosols across the Atlantic and Pacific Oceans. Bull. Am. Meteorol. Soc. 2020, 101, E536–E554. [Google Scholar] [CrossRef]
- Dinoi, A.; Pavese, G.; Calvello, M.; Chirizzi, D.; Pennetta, A.; De Benedetto, G.E.; Esposito, F.; Mapelli, C.; Contini, D. Characterization of aerosol and its oxidative potential in a coastal semi-rural site of Southern Italy. Atmos. Environ. 2024, 333, 120656. [Google Scholar] [CrossRef]
- WHO. Italy Health Impact Assessment of Steel Plant Activities in Taranto, Italy. Available online: https://iris.who.int/bitstream/handle/10665/373258/9789289058360-eng.pdf?sequence=1 (accessed on 2 May 2025).
- Draxler, R.; Stunder, B.; Rolph, G.; Stein, A.; Taylor, A. HYSPLIT User’s Guide, Version 5.3. 2023. Available online: https://www.arl.noaa.gov/documents/reports/hysplit_user_guide.pdf (accessed on 1 January 2025).
- Drinovec, L.; Moĉnik, G.; Zotter, P.; Prévôt, A.S.H.; Ruckstuhl, C.; Coz, E.; Rupakheti, M.; Sciare, J.; Müller, T.; Wiedensohler, A.; et al. The “dual-spot” Aethalometer: An improved measurement of aerosol black carbon with real-time loading compensation. Atmos. Meas. Tech. 2015, 8, 1965–1979. [Google Scholar] [CrossRef]
- Mueller, T.; Fiebig, M. ACTRIS In Situ Aerosol: Guidelines for Manual QC of AE33 Absorption Photometer Data; ACTRIS: Helsinki, Finland, 2021. [Google Scholar]
- Savadkoohi, M.; Pandolfi, M.; Reche, C.; Niemi, J.V.; Mooibroek, D.; Titos, G.; Green, D.C.; Tremper, A.H.; Hueglin, C.; Liakakou, E.; et al. The variability of mass concentrations and source apportionment analysis of equivalent black carbon across urban Europe. Environ. Int. 2023, 178, 108081. [Google Scholar] [CrossRef]
- Esposito, F.; Calvello, M.R.; Gueguen, E.; Pavese, G. A new algorithm for brown and black carbon identification and organic carbon detection in fine atmospheric aerosols by a multi-wavelength Aethalometer. Atmos. Meas. Tech. Discuss. 2012, 5, 1003–1027. [Google Scholar] [CrossRef]
- Pio, C.; Cerqueira, M.; Harrison, R.M.; Nunes, T.; Mirante, F.; Alves, C.; Oliveira, C.; Sanchez de la Campa, A.; Artíñano, B.; Matos, M. OC/EC ratio observations in Europe: Re-thinking the approach for apportionment between primary and secondary organic carbon. Atmos. Environ. 2011, 34, 6121–6132. [Google Scholar] [CrossRef]
- Turpin, B.J.; Huntzicker, J.J. Identification of secondary organic aerosol episodes and quantitation of primary and secondary organic aerosol concentrations during SCAQS. Atmos. Environ. 1995, 29, 3527–3544. [Google Scholar] [CrossRef]
- Pavese, G.; Calvello, M.; Castagna, J.; Esposito, F. Black carbon and its impact on air quality in two semi-rural sites in Southern Italy near an oil pre-treatment plant. Atmos. Environ. 2020, 233, 117532. [Google Scholar] [CrossRef]
- Carslaw, D.C.; Beevers, S.D. Characterising and understanding emission sources using bivariate polar plots and k-means clustering. Environ. Model. Softw. 2013, 40, 325–329. [Google Scholar] [CrossRef]
- Pavese, G.; Agresti, F.; Calvello, M.; Esposito, F.; Lettino, A. Outdoor and indoor measurements of number particles size distributions and equivalent black carbon (eBC) at a mechanical manufacturing plant. Atmos. Pollut. Res. 2022, 13, 101488. [Google Scholar] [CrossRef]
- Pugatshova, A.; Reinart, A.; Tamm, E. Features of the multimodal aerosol size distribution depending on the air mass origin in the Baltic region. Atmos. Environ. 2007, 41, 4408–4422. [Google Scholar] [CrossRef]
- Rabaçal, M.; Costa, M. Particulate Emissions from the Combustion of Biomass Pellets. Biomass Pelletization Stand. Prod. 2015, 85, 101–135. [Google Scholar] [CrossRef]
- Wilczyska-Michalik, W.; Różańska, A.; Bulanda, M.; Chmielarczyk, A.; Pietras, B.; Michalik, M. Physicochemical and microbiological characteristics of urban aerosols in Krakow (Poland) and their potential health impact. Environ. Geochem. Health 2021, 43, 4601–4626. [Google Scholar] [CrossRef]
- Ault, A.P.; Peters, T.M.; Sawvel, E.J.; Casuccio, G.S.; Willis, R.D.; Norris, G.A.; Grassian, V.H. Single-Particle SEM-EDX Analysis of Iron-Containing Coarse Particulate Matter in an Urban Environment: Sources and Distribution of Iron within Cleveland, Ohio. Environ. Sci. Technol. 2012, 46, 4331–4339. [Google Scholar] [CrossRef]
- Wiinikka, H.; Gebart, R.; Boman, C.; Boström, D.; Nordin, A.; Öhman, M. High-temperature aerosol formation in wood pellets flames: Spatially resolved measurements. Combust. Flame 2006, 147, 278–293. [Google Scholar] [CrossRef]
- Paris, R.; Desboeufs, K.V.; Formenti, P.; Nava, S.; Chou, C. Chemical characterization of iron in dust and biomass burning aerosols during AMMA-SOP0/DABEX: Implication for iron solubility. Atmos. Chem. Phys. 2010, 10, 4273–4282. [Google Scholar] [CrossRef]
- Fu, H.; Lin, J.; Shang, G.; Dong, W.; Grassian, V.H.; Carmichael, G.R.; Yan Li, Y.; Chen, J. Solubility of Iron from Combustion Source Particles in Acidic MediamLinked to Iron Speciation. Environ. Sci. Technol. 2012, 46, 11119–11127. [Google Scholar] [CrossRef]
- Yang, Y.; Weber, R.J. Ultrafiltration to characterize PM2.5 water-soluble iron and its sources in an urban environment. Atmos. Environ. 2022, 286, 19246. [Google Scholar] [CrossRef]
- Castagna, J.; Calvello, M.; Esposito, F.; Pavese, G. Analysis of equivalent black carbon multi-year data at an oil pre-treatment plant: Integration with satellite data to identify black carbon transboundary sources. Remote Sens. Environ. 2019, 235, 111429. [Google Scholar] [CrossRef]
- Popovicheva, O.; Kistler, M.; Kireeva, E.; Persiantseva, N.; Timofeev, M.; Kopeikin, V.; Kasper-Giebl, A. Physicochemical characterization of smoke aerosol during large-scale wildfires: Extreme event of August 2010 in Moscow. Atmos. Environ. 2014, 96, 405–414. [Google Scholar] [CrossRef]
- Chakrabarty, R.K.; Gyawali, M.; Yatavelli, R.L.N.; Pandey, A.; Watts, A.C.; Knue, J.; Chen, L.A.; Pattison, R.R.; Tsibart, A.; Samburova, V.; et al. Brown carbon aerosols from burning of boreal peatlands: Microphysical properties, emission factors, and implications for direct radiative forcing. Atmos. Chem. Phys. 2016, 16, 3033–3040. [Google Scholar] [CrossRef]
- Hong, L.; Liu, G.; Zhou, L.; Li, J.; Xu, H.; Wu, D. Emission of organic carbon, elemental carbon and water-soluble ions from crop straw burning under flaming and smoldering conditions. Particuology 2016, 31, 181–190. [Google Scholar] [CrossRef]
- Wang, Y.; Hu, M.; Xu, N.; Qin, Y.; Wu, Z.; Zeng, L.; Huang, X.; He, L. Chemical composition and light absorption of carbonaceous aerosols emitted from crop residue burning: Influence of combustion efficiency. Atmos. Chem. Phys. 2020, 20, 13721–13734. [Google Scholar] [CrossRef]
- Popovicheva, O.B.; Engling, G.; Ku I-Ting Timofeev, M.A.; Shonija, N.K. Aerosol Emissions from Long-lasting Smoldering of Boreal Peatlands: Chemical Composition, Markers, and Microstructure. Aerosol Air Qual. Res. 2019, 19, 484–503. [Google Scholar] [CrossRef]
- Li, J.; Pósfai, M.; Hobbs, P.V.; Buseck, P.R. Individual aerosol particles from biomass burning in southern Africa: 2. Compositions and aging of inorganic particles. J. Geophys. Res. 2003, 108, 8484. [Google Scholar] [CrossRef]
- Maenhaut, W.; Raes, N.; Chi, X.; Cafmeyer, J.; Wang, W. Chemical composition and mass closure for PM2.5 and PM10 aerosols at K-puszta, Hungary, in summer 2006. X Ray Spectrom. 2008, 37, 193–197. [Google Scholar] [CrossRef]
- de Jonge, W.R.; Elm, J.; Rosati, B.; Christiansen, S.; Hyttinen, N.; Lüdemann, D.; Bilde, M.; Roldin, P. Secondary aerosol formation from dimethyl sulfide-improved mechanistic understanding based on smog chamber experiments and modelling. Atmos. Chem. Phys. 2021, 21, 9955–9976. [Google Scholar] [CrossRef]
- Su, B.; Zhuo, Z.; Fu, Y.; Sun, W.; Chen, Y.; Du, X.; Yang, Y.; Wu, S.; Xie, Q.; Huang, F.; et al. Individual particle investigation on the chloride depletion of inland transported sea spray aerosols during East Asian summer monsoon. Sci. Total Environ. 2020, 765, 144290. [Google Scholar] [CrossRef] [PubMed]
Disclaimer/Publisher’s Note: The statements, opinions and data contained in all publications are solely those of the individual author(s) and contributor(s) and not of MDPI and/or the editor(s). MDPI and/or the editor(s) disclaim responsibility for any injury to people or property resulting from any ideas, methods, instructions or products referred to in the content. |
© 2025 by the authors. Licensee MDPI, Basel, Switzerland. This article is an open access article distributed under the terms and conditions of the Creative Commons Attribution (CC BY) license (https://creativecommons.org/licenses/by/4.0/).