Abstract
Air pollution is a growing environmental and public health concern, particularly in urban areas where vehicular emissions, industrial activities, and public events contribute to deteriorating air quality. This study examines air pollution concentrations in two districts of Cusco, Peru, using an interdisciplinary approach that integrates environmental monitoring and social risk perception analysis. Air quality measurements revealed elevated levels of PM2.5 and NO2, with 40–60% of data falling within “Moderate” or “Unhealthy for sensitive groups” categories according to international standards. Notably, major cultural events such as Inti Raymi were associated with a threefold increase in pollutant concentrations, highlighting their impact on urban air quality. Simultaneously, surveys and interviews assessed public perception, revealing a varied understanding of pollution risks and a general concern for health impacts, especially in more polluted and densely populated areas. However, trust in scientists remains limited, which poses challenges for the implementation of evidence-based environmental strategies. This study highlights significant environmental inequality within the city, with central districts facing greater pollution burdens than peripheral zones. These findings underscore the need for holistic air quality management strategies that combine scientific assessments with community engagement. Strengthening trust between scientists and local populations is essential to develop inclusive and effective interventions that align with both technical and social priorities, particularly in rapidly urbanizing contexts such as Cusco.
1. Introduction
Air pollution is a major environmental and health threat, causing around 7 million deaths annually due to respiratory and cardiovascular diseases []. Among the most dangerous pollutants are PM2.5 and NO2, which significantly contribute to chronic illnesses and premature death []. Notably, combined exposure to PM2.5, O3, and NO2 increases health risks and accounts for over 40% of pollution-related deaths in regions such as Beijing–Tianjin–Hebei []. Similarly, in Hong Kong, traffic-related pollutants have been linked to diseases like tuberculosis, lung cancer, and stroke, underlining the distinct health impacts of PM2.5 and NOx emissions [].
In addition to health concerns, climatic and urban factors play a critical role in shaping air quality. For instance, the urban heat island effect tends to worsen pollution in densely populated areas []. Despite global mitigation efforts, 94% of 6743 cities assessed in 2022 still exceeded WHO limits for PM2.5 and PM10 []. In South America, air quality remains poor due to increasing urbanization, reliance on fossil fuels, and weak regulatory frameworks []. Urban vegetation has been proposed as a potential solution, although its effectiveness is variable—especially in areas with poor ventilation [].
Moreover, the internal spatial organization of cities also affects air quality. A study across 330 Chinese cities found that both the quantity and spatial distribution of residential and industrial land influenced PM2.5 concentrations. Interestingly, cities with higher residence–industry accessibility reported lower pollution levels. These findings suggest that optimizing urban land use can support not only pollution reduction but also broader sustainable development goals [].
In the Peruvian context, air pollution has become an increasing concern, with alarming trends observed in multiple regions. Lima is currently the only city equipped with a certified air quality monitoring network, allowing for detailed studies of pollutants such as PM2.5 []. Research shows that vehicular traffic and an aging vehicle fleet are major contributors to PM2.5 levels in Lima, which frequently exceed WHO guidelines []. Furthermore, meteorological factors such as sea breezes and complex atmospheric dynamics contribute to the uneven dispersion and accumulation of pollutants across different urban sectors [].
Conversely, outside Lima, air quality research remains limited due to the absence of certified monitoring stations. In Cusco, for example, the lack of reliable in situ measurements hinders accurate assessment of pollutant exposure. To address this gap, recent studies have turned to satellite data and computational models, revealing worrying PM2.5 levels in several urban zones []. Additionally, the integration of low-cost sensors and AI models has improved monitoring precision in areas lacking traditional infrastructure []. Wharton et al. (2017–2018) identified vehicular traffic as the main pollution source, particularly in densely populated areas near avenues such as Av. de la Cultura (UNSAAC) and Av. Antonio Lorena (Independencia).
Complementing this, a study using certified EPA samplers (HIVOL 3000) and gravimetric analysis at 13 points in Cusco found that over 84% of sites were rated ‘poor’ or ‘hazardous’ according to Peru’s Air Quality Index (INCA). Notably, the district of San Jerónimo recorded peak values of 125 µg/m3, far exceeding WHO limits []. The study identified vehicular traffic and artisanal brick kilns as the main sources of emissions. GIS-based spatial analysis and Power BI visualizations further emphasized the uneven distribution of pollution across the city, highlighting the need for targeted mitigation strategies in the most affected areas.
Globally, innovative approaches have emerged to monitor air quality, especially in areas lacking certified infrastructure. These include low-cost sensors, satellite remote sensing, and simulation models. Low-cost sensors offer real-time data and expand coverage, although they require proper calibration to ensure accuracy []. Satellite products enable large-scale pollution estimation, particularly useful in regions with limited ground data []. In Peru, similar tools have been adopted. For instance, Lima has tested PurpleAir sensors and expanded surveillance through linear calibration []. The qHAWAX system combines low-cost sensors, IoT, and AI to provide real-time air quality maps and short-term forecasts []. In Cusco, EPA-grade equipment and GIS tools have been used to map PM2.5 hotspots linked to traffic and brick kilns []. These efforts underscore the value of blending advanced and accessible technologies to strengthen air quality monitoring in underserved urban areas.
At the same time, dispersion models have revealed that urban morphology—such as building density and street layout—affects how pollutants accumulate and spread. This is particularly critical in cities with complex terrain, where airflow patterns strongly influence air quality []. However, much of the existing research remains focused on physical and technological aspects, often overlooking the social dimensions—such as unequal exposure, public perception, and limited green space access for vulnerable groups. This gap highlights the need for a more integrated and equitable approach to air quality management [].
In fact, most air pollution studies tend to fall into two broad categories: natural sciences, which emphasize physical measurements, modeling, and meteorological factors, and social sciences, which explore perception, behavior, and policy-making. Unfortunately, few studies effectively bridge these perspectives. This disciplinary divide limits our understanding of how objective environmental data—such as pollutant levels—interact with subjective social factors like public awareness and decision making.
To address this gap, the present study explores whether in situ air quality and meteorological data can enhance understanding of how people perceive the risks associated with atmospheric pollution. Although the technical impacts of air pollution on human health are well documented, there remains limited insight into how scientific findings align—or diverge—from public perceptions in specific local contexts. By comparing field measurements with environmental risk perception surveys conducted in the same urban areas, this study aims to identify possible mismatches or correlations between objective and subjective dimensions.
Risk perception refers to how people assess threats, shaping their behavior and decision making []. For example, Oltra and Sala [] found that 70% of people in four Spanish cities paid little attention to air quality, revealing low environmental awareness. Individuals who feel in control of their environment tend to make rational decisions, while those in vulnerable conditions may act more emotionally to avoid regret [].
Moreover, the perception of air pollution risks and access to green spaces both influence public health and individual decision making []. Research shows that individuals with higher risk awareness are more likely to support pollution control measures [], and that access to green spaces can mitigate the health impacts of pollution. In our study, participants with higher risk awareness also showed a greater willingness to pay for improved air quality, reinforcing the importance of integrating both environmental and social considerations [].
Furthermore, several studies have emphasized the importance of linking risk perception, green space access, and public health to environmental governance and public participation []. They stress the need for improved communication between scientists, authorities, and citizens to strengthen air quality management. Recent advances also highlight the potential of new technologies—such as AI and IoT—for collecting real-time data and facilitating more agile responses []. Promoting environmental awareness and encouraging citizen participation through technology are crucial steps forward []. In addition, fostering public trust in scientific data can encourage policymakers to adopt evidence-based decisions [].
Therefore, developing interdisciplinary studies that integrate meteorological measurements and social aspects such as risk perception is essential. This approach enables the formulation of more effective mitigation strategies, informed public policies, and adaptive community behaviors—ultimately providing a more holistic response to air pollution [].
Accordingly, this study examines the relationship between meteorological conditions, air quality, and environmental risk perception in two urban areas of Cusco, Peru. Field measurements of air quality and weather variables were conducted over two months, alongside environmental risk perception surveys administered in the same locations. This combined analysis offers a comprehensive perspective on air pollution in the city.
In this context, the present study not only explores the alignment between objective air quality data and subjective risk perception but also incorporates two additional dimensions that are rarely addressed together: first, the influence of large-scale public events—such as traditional festivities—on short-term fluctuations in air pollution levels, and second, the comparison of both exposure and perception across two distinct urban zones within Cusco. Together, these components contribute to a more nuanced understanding of environmental inequality and the socio-environmental dynamics that shape air quality challenges in the city.
2. Materials and Methods
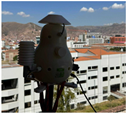
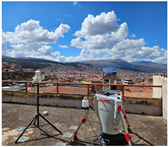
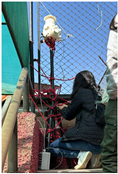
The study was conducted in the city of Cusco, where two monitoring areas were selected with the goal of evaluating air quality and meteorological conditions. The study areas included the National University of San Antonio Abad of Cusco (UNSAAC), the Sagrada Familia de Independencia Church, and the Luis Vallejo Santoni Educational Institution (Figure 1). In each of these locations, air quality sensors and a profiling LiDAR system for wind measurement were installed, allowing a detailed analysis of pollutant dispersion and atmospheric conditions
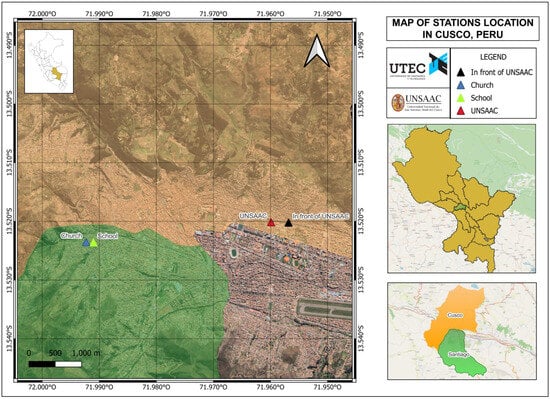
Figure 1.
Map of sensor location in Cusco.
According to the Quality Assurance Handbook for Air Pollution Measurement Systems [], monitoring stations should be located away from direct sources of pollution and obstacles such as trees or walls, maintaining at least twice their height as a minimum distance. The entry point of the sampler should be between 2 and 15 m from the ground, ideally 2 to 7 m for measuring PM2.5. In addition, the site should be safe, be accessible for maintenance, and have good natural ventilation. For meteorological sensors, an even clearer environment is required to ensure accurate measurements of wind and other atmospheric variables.
In the context of Latin America, and specifically in Peru, these technical recommendations must take into account additional restraints in compliance with national regulations. In the case of this research conducted in the city of Cusco, the installation of air quality monitoring stations requires the evaluation of the technical feasibility of the site, access to electricity, and the consent of the landowner or hosting institution (such as universities, schools, or parishes).
The methodology used is divided into two main components: on one hand, the measurement of meteorological and air quality variables through specialized sensors, and on the other hand, the social evaluation, which included the collection of public perceptions regarding air quality in the monitored areas. This methodological combination allowed for a comprehensive diagnosis of air pollution in Cusco, considering both the physical data and the impact perceived by the community.
2.1. Measurement Methodology
We used two low-cost air quality stations (model: qHAWAX, brand: qAIRA) and one profiling LiDAR (model: Spidar, brand: NRG Systems) system to collect air quality and meteorological data in the study sites within the city of Cusco, Peru. Data collection was scheduled in a sequential manner, in which two low-cost air quality stations and the profiling LiDAR were installed in study site number 1 (near the National University of San Antonio Abad of Cusco—UNSAAC) for approximately 1 month, at the end of which, these instruments were moved to the second study site, near the Luis Vallejo Santoni Educational Institution.
The motivation for selecting schools and churches as measurement sites was based on their high social relevance and the presence of vulnerable populations, such as children and the elderly. Schools are critical locations for assessing daily exposure to pollutants among children, who are especially sensitive to poor air quality. Churches, in turn, function as key gathering spaces, particularly during events and religious celebrations, which can temporarily increase emissions due to traffic, fireworks, and large crowds. These sites therefore offered valuable insights into real-world exposure levels in densely populated and culturally active areas.
Site selection also considered logistical and technical factors, including proximity to major transportation routes (to capture traffic-related pollution); availability of secure and powered infrastructure (e.g., rooftops or enclosed school areas); and institutional collaboration, as local schools and churches were supportive of the study and facilitated sensor installation.
The stations recorded concentrations of atmospheric pollutants, meteorological variables, and environmental perception data to evaluate the relationship between air quality and local weather conditions. The campaigns were conducted over two months during the dry season (April–October) to reduce the influence of extreme precipitation and capture key pollution events—such as Inti Raymi, a traditional Andean Festival of the Sun celebrated on June 24, which involves fireworks, ceremonial fires, and increased emissions, for which measurements were strategically timed.
Measurements in the district of Cusco were conducted from June 3 to 25, and in the district of Santiago from June 27 to August 15, covering different monitoring stations on strategically selected dates (Table 1).

Table 1.
Overview of sensor location data.
2.1.1. Collected Meteorological and Air Quality Data
During the study, air quality and meteorological data were collected at the established monitoring stations. Each sensor recorded measurements at regular intervals of 15 min, allowing for a representative dataset of the environmental conditions. Table 2 and Table 3 detail the volume of collected data, the measurement period at each location, and the completeness percentage.

Table 2.
District of Cusco data air quality data.

Table 3.
District of Santiago data.
Data gaps in this study can be attributed to several factors. First, power supply interruptions prevented the control equipment from recording data continuously. These interruptions also caused sudden drops in measurements, leading to the removal of zero values, which were considered unrealistic and attributable to system resets that occurred when sampling resumed. Likewise, outliers caused by anomalous spikes related to these interruptions were discarded. The removal of both zero values and outliers was necessary to prevent distortions in the analysis, as they did not represent actual pollutant fluctuations.
Other causes of data loss included technical issues and extreme environmental conditions such as high humidity, temperature extremes, and sensor or connectivity failures. Additionally, anomalous values were excluded based on statistical thresholds: measurements exceeding the mean plus three times the standard deviation were removed after outlier patterns were detected in box plots for each site.
To quantify the impact of data gaps, we calculated the percentage of data completeness per sensor and pollutant (see Table 3). Most variables showed a completeness rate above 99%, with the lowest being 99.32% for CO at the church site. This corresponds to a maximum of 139 missing records (approximately 2.3 h) in the 1 min time resolution dataset. Given the minimal data loss, we chose not to apply data imputation methods, as this would not significantly affect the integrity of the analysis.
We also assessed the potential impact on spatial interpolation using a sensitivity test. We simulated a scenario with 10% artificial data loss, which resulted in up to a 6.5% change in average interpolated values and slight shifts in hotspot locations. In contrast, the actual missing data (<1%) in our dataset led to differences of less than 1.2% in spatial means, which is within an acceptable uncertainty margin for environmental monitoring.
After filtering, the cleaned data were used to generate time series for each pollutant, compared against Peru’s Air Quality Standards (ECA) and Air Quality Indices (AQI). Additionally, pollutant concentration patterns were visualized and analyzed using descriptive statistics to evaluate temporal and spatial variability. This comprehensive approach ensures robust insights into air quality dynamics across the study zones, despite minor data gaps.
2.1.2. Air Quality and Meteorological Station Specifications
The low-cost air quality stations (qHAWAX) measure atmospheric pollutants including particulate matter (PM2.5 and PM10), carbon monoxide (CO), sulfur dioxide (SO2), hydrogen sulfide (H2S), nitrogen dioxide (NO2), and ozone (O3). Additionally, the sensors recorded the following variables: ambient noise (dB), temperature (K), relative humidity (%), atmospheric pressure (hPa), and UV radiation.
The profiling LiDAR (Spidar) is a vertical profiler based on direct detection LiDAR technology, specifically designed to measure wind characteristics for energy applications. This device employs laser pulses to analyze the density of aerosols in the atmosphere and, using a cross-correlation method, accurately calculates wind speed and direction within a measurement range of 20 to 200 m. This equipment was configured to measure at the specific heights of 20 m, 40 m, 60 m, 80 m, 100 m, 120 m, 140 m, 160 m, 180 m, and 200 m. The Spidar stores data in ASCII format at configurable intervals, allowing its integration into SCADA networks or its export as CSV files. Furthermore, it is designed to operate in harsh environmental conditions, with an operating temperature range of −40 °C to 50 °C with an IP65 protection rating, making it highly resistant and reliable in demanding environments.
According to the national environmental protocol and the quality policy of qAIRA (brand of low-cost air quality stations), the use of low-cost monitoring technologies such as qAIRA sensors is valid for internal environmental monitoring, air quality improvement plans, and health risk prevention efforts. Although alternative measurement procedures—like low-cost sensors—are not permitted for formal environmental impact reports (which require reference or equivalent methods), they are explicitly recognized for generating useful environmental data for internal use and awareness []. qAIRA commits to producing reliable environmental data with validated low-cost technology, as stated in their quality policy and aligned with international standards (ISO 9001, ISO 14001, ISO 45001) [].
2.1.3. Pre-Processing and Data Analysis
The collected data was stored in CSV files and analyzed in RStudio (version 4.4.3), ensuring its quality before statistical analysis. Completeness checks were performed, and outliers or anomalous records associated with power supply failures and measurement errors were removed. Maximum thresholds were established for each pollutant, and unrealistic values were discarded (e.g., concentration values below 0).
Subsequently, time series and pollutant concentration graphs were created using ggplot2, applying the Generalized Additive Models (GAM) method to smooth trends. According to the ggplot2 documentation, when there are fewer than 1000 observations, the loess method is used by default; however, GAM smoothing can be manually applied by configuring the formula y ~ s(x, bs = “cs”). GAM was selected for this analysis due to its ability to handle large volumes of data and provide a robust fit to the observed trends in pollutant concentrations [].
In addition to pollutant data, meteorological variables such as temperature and relative humidity, as well as ambient noise levels, were considered in the analysis. These environmental factors influence pollutant behavior in various ways. For instance, lower temperatures and high relative humidity can enhance the persistence of particulate matter near ground level, while fluctuations in noise levels—often associated with traffic activity—may indirectly reflect changes in emissions.
2.2. Methodology Section of the Social Science
In order to link the social data with the atmospheric data, interviews were conducted in the same two areas where the atmospheric measurements were taken: the district of Cusco and the district of Santiago. The face-to-face interviews were conducted following a non-probabilistic snowball sampling design, in which a group of volunteer participants living in the areas where the equipment was installed were sought out, and these people in turn successively recommended the participation of other people who met the inclusion criteria. Tablets and Zohosurvey software were used to develop the survey. These surveys were fully anonymized and automatically coded, and only the lead researcher on the social side had access to the data during survey development, thus ensuring the security of the data. Furthermore, to support the reliability of the data, the questionnaires used were subjected to a statistical reliability test (Cronbach’s Alpha) to assess their internal consistency (Table A1, Table A2, Table A3 and Table A4), where high reliability indices were found. The study was approved by the IRB of the University of Engineering and Technology (IRB), Resolution No. 001-2024-CIEI-UTEC. All participants signed the informed consent form before answering the survey.
2.2.1. Participants
A total of 548 individuals over the age of 18 participated, from which a final sample of n = 534 was obtained based on inclusion and exclusion criteria. Of the collected sample, 50% were women (n = 267), and the other half were men (n = 267). In terms of age distribution, 56.9% (n = 304) were young adults between 18 and 35 years old, 38.95% (n = 208) were adults between 36 and 65 years old, and 4.12% (n = 22) were seniors over 65 years old.
Additionally, 62.9% (n = 336) had higher education (technical and/or university), 30.3% (n = 162) had completed secondary education (high school), 5.9% (n = 32) had primary education, and only four individuals had no formal education. Finally, 259 participants were from the Cusco district (48.5%), while 275 were from Santiago (51.5%).
2.2.2. Study Zone
The district of Cusco has an area of 617.00 km2 and a population density of 867.83 inhabitants per square kilometer as of 2023. It has the largest urban population (59.2%) in the region. As for the district of Santiago (−13.5239° S and −71.9797° W), it has an area of 69.72 km2, representing 9.3% of the province’s territory. According to the last census [], Santiago has a population of 94,756 inhabitants.
2.2.3. Description of Instruments
Risk Perception Questionnaire on Air Pollution []: This is a unidimensional instrument that assesses how individuals perceive, understand, and/or comprehend air pollution. It consists of 8 items with a Likert-type response scale ranging from 1 = Not at all to 7 = A lot. The instrument demonstrated excellent internal consistency of 0.91 in the studied sample.
Air Quality Perception Questionnaire for the Global Assessment of the Health Effects of Air Pollution []: This questionnaire evaluates the perception of air pollution on health. It consists of 22 items divided into two dimensions: (1) perceived discomfort and symptoms, and (2) risk perception regarding health and quality of life. The measurement scale is Likert-type: 0 = Never, 1 = Occasionally, 2 = Often, and 3 = Always. The instrument demonstrated good internal consistency (0.86) in the present study.
Green Space Perception Questionnaire []: This unidimensional questionnaire assesses perceived characteristics of green spaces. It consists of 7 items with a Likert-type response scale ranging from 1 = Not at all to 5 = A lot. Reliability analyses indicate good internal consistency of 0.89, demonstrating the instrument’s high reliability for the study.
Trust in Scientists Questionnaire []: This unidimensional instrument measures public trust in science. “Science” is understood as knowledge about the world derived from observation and testing, while “scientists” refer to individuals studying nature, medicine, physics, economics, history, psychology, and other fields. The questionnaire consists of 12 items with a Likert-type response scale ranging from 1 = Not at all to 5 = A lot. Analyses indicate excellent internal consistency of 0.90, demonstrating high instrument reliability in the studied sample.
2.2.4. Data Analysis
Survey data were analyzed in RStudio version 4.3.1, in which the mean and standard deviation (SD) were found for frequency tables; Spearman’s Rho test was used for correlation analysis; and the Mann–Whitney U test was used for group comparison, since the data distribution was not normal. In the group comparison, the p-value was considered to determine whether the difference between the groups was significant or not, where a p-value < 0.05 indicated a significant difference and a p > 0.05 indicated the opposite, considering the analyses at a 95% confidence interval.
3. Results
This section presents the findings obtained from data collection and analysis. First, the results of meteorological and air quality measurements are described. Subsequently, the results of the social study are shown, including the analysis of community perceptions of environmental risk in the evaluated areas. Finally, the relationship between both approaches is established, exploring how atmospheric conditions and the population’s perceived air quality can influence environmental risk perception and the development of mitigation strategies.
The ozone data was not included in the final analysis because a malfunction was detected in the electrical connections of the monitoring equipment. This issue compromised the proper functioning of the ozone sensor during the measurement period, making the collected data unreliable. As a result, and in order to preserve the integrity and accuracy of the overall results, the ozone readings were excluded from the analysis.
3.1. Descriptive Statistics Analysis
3.1.1. Time Series Analysis
In Zone 1, the district of Cusco, temperature follows a daily pattern with peaks during the day and drops at night. During the day, temperatures in urban areas (such as UNSAAC) tend to be higher compared to less urbanized zones (such as in front of UNSAAC), suggesting a heat retention effect. At night, temperatures tend to equalize, although in areas with less infrastructure (in front of UNSAAC), they are usually slightly lower. This indicates a possible urban heat island effect, where cement, asphalt, and other construction materials absorb and retain more heat compared to areas with greater vegetation. Maximum temperatures reached approximately 35 °C in front of UNSAAC and about 30 °C at UNSAAC. Minimum nighttime temperatures dropped to nearly 5 °C in both locations, as seen in Figure 2a.
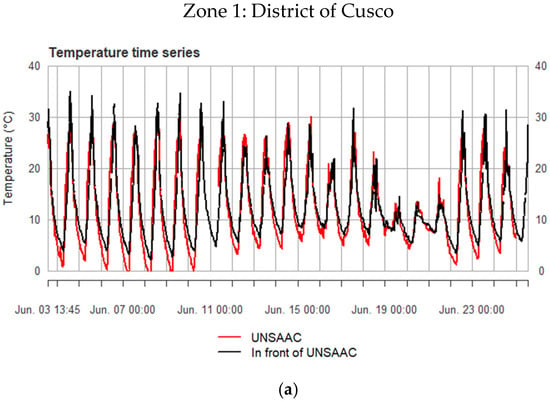
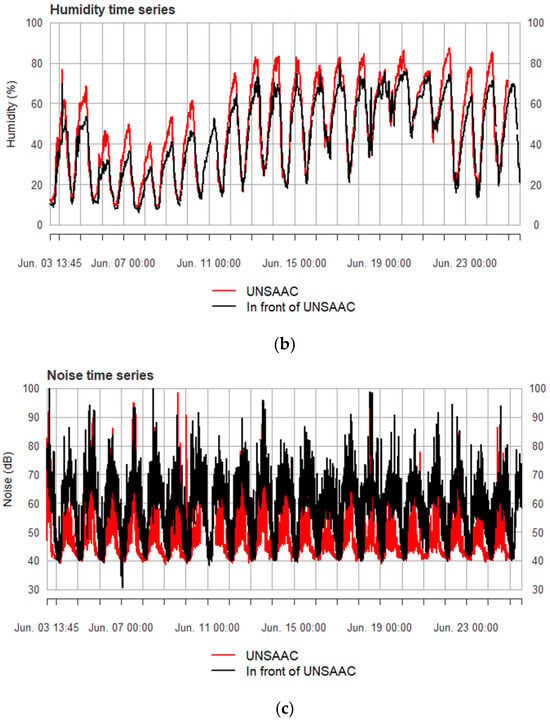
Figure 2.
Time series for the district of Cusco: (a) temperature, (b) humidity, and (c) noise.
Regarding humidity (Figure 2b), it shows an inverse relationship with temperature: when temperature rises, humidity decreases. In general, humidity levels in the more urbanized areas of Cusco (such as UNSAAC) are lower during the day, possibly due to the heat and the reduced presence of green spaces or water sources. However, from June 19 onward, humidity levels in different areas tended to equalize, which could be due to changes in weather conditions, rainfall, or meteorological events that increased humidity in the city. Humidity ranged from about 20% during dry, hot periods up to 95% during cooler or wetter moments, particularly in front of UNSAAC, where peaks were higher than at UNSAAC.
Noise levels (Figure 2c) exhibit the greatest variability among the three analyzed variables. It is observed that areas with higher traffic and commercial activity (such as UNSAAC) have higher noise levels compared to zones further from the city center (such as in front of UNSAAC). This suggests that the main sources of noise in Cusco include vehicular traffic, commercial activities, and large gatherings of people in markets and plazas. In contrast, in less urbanized areas or during nighttime hours, noise levels decrease significantly, indicating a quieter environment. Noise levels fluctuated between 40 dB and 95 dB, with the highest peaks recorded in front of UNSAAC, especially during the day. At night, values dropped to around 40–50 dB in both locations.
In the district of Cusco, CO (Figure 3a) displays high variability, with values ranging from below 200 µg/m3 during the early morning hours to peaks exceeding 2000 µg/m3 at various times throughout the month. These elevated concentrations could be linked to both incomplete engine combustion and other residential or commercial sources, such as cooking appliances or small-scale generators. This suggests that pollution does not stem exclusively from traffic, but rather from a combination of anthropogenic activities common in densely populated urban areas.
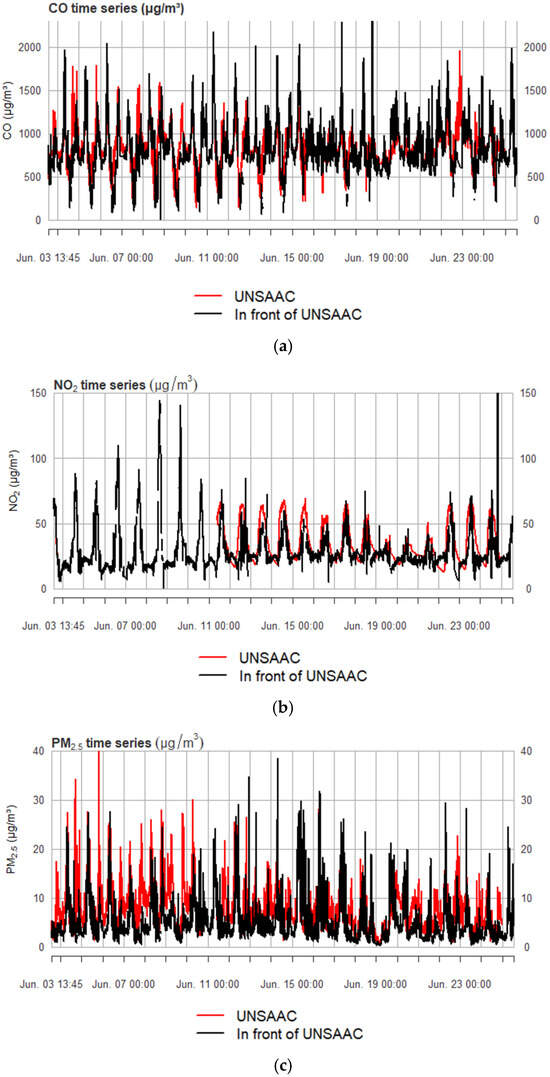
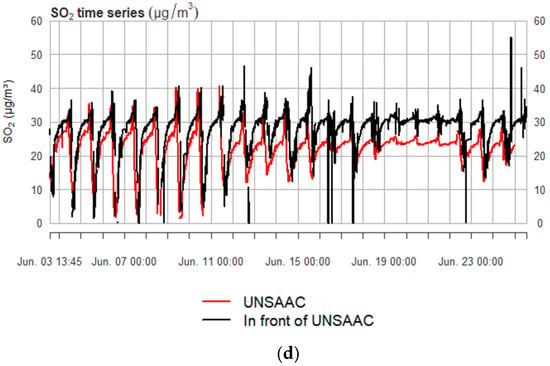
Figure 3.
Time series for the district of Cusco: (a) CO, (b) NO2, (c) PM2.5, and (d) SO2.
NO2 (Figure 3b), a pollutant closely associated with motor vehicle emissions, shows marked increases at specific times, often exceeding 100 µg/m3 and reaching up to more than 150 µg/m3 during morning rush hours. These peaks reflect periods of high traffic activity, suggesting that air quality in Cusco is strongly influenced by daily traffic flow, especially in high-density areas such as the historic center and the surroundings of UNSAAC. The accumulation of NO2 at certain times of the day may also be influenced by meteorological factors such as thermal inversion, which hinders pollutant dispersion and worsens air quality in the morning hours.
PM2.5 (Figure 3c), composed of fine particles capable of penetrating the respiratory system, exhibits peaks that frequently exceed 30 µg/m3, particularly in the morning and late afternoon. These periods coincide with increased vehicular circulation and potential biomass or waste burning activities. In Cusco, the mountainous topography and the presence of narrow streets may favor the accumulation of particulate matter in certain areas, especially under low ventilation conditions. Conversely, PM2.5 levels tend to drop below 5 µg/m3 during the early hours of the day, reflecting moments of lower human activity and better atmospheric dispersion.
Finally, SO2 (Figure 3d) exhibits daily fluctuations with recurrent peaks throughout the day, indicating its link to diesel combustion and other industrial sources. Concentrations frequently range between 20 and 40 µg/m3, with peaks reaching up to 60 µg/m3, particularly in the mornings and late afternoons. This pattern suggests a consistent source, possibly related to public and private transportation relying heavily on diesel fuel. Additionally, concentrations tend to rise during peak traffic hours, highlighting a direct relationship with urban mobility.
The temperature (Figure 4a) during the analyzed period shows very clear daily variations, with maximums reaching around 30 °C and minimums around 5 °C to 10 °C, depending on the location. These peaks typically coincide with the central hours of the day, while the lowest values are recorded during the early morning hours. As the period advances toward August, there is a slight downward trend in the maximum values, which could be associated with seasonal changes or fluctuations inherent to Andean climate.
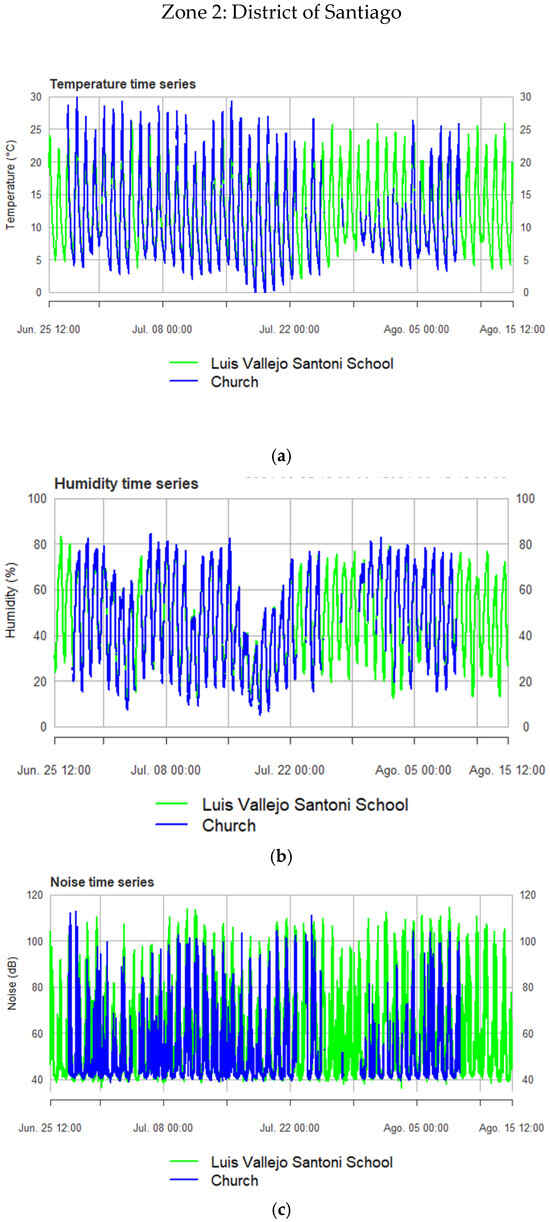
Figure 4.
Time series for the district of Santiago: (a) temperature, (b) humidity, and (c) noise.
Humidity (Figure 4b) fluctuated from approximately 20% to 80%, exhibiting behavior that is inverse to that of temperature. During the hottest hours, humidity decreases, and it increases at night and in the early morning. These extremes are slightly more pronounced at the church, where values frequently approach the upper limit. The graph indicates that these changes are primarily due to local meteorological dynamics and the influence of high-altitude climate, without showing a sustained trend of increase during the period.
Noise (Figure 4c) varies notably at the two points in the Santiago district, with values oscillating between 40 dB and peaks close to 110 dB, reflecting moments of high acoustic pollution. The difference between these points suggests that location and the nature of the activity influence noise levels. For example, the church (blue) is situated in an area with less traffic or with less intensive activity schedules, while the school (green) experiences more pronounced noise peaks, especially during the hours of student arrival and departure or on days with special events. Additionally, during the festivities in July, the increase in the flow of people and vehicles likely contributed to additional spikes in noise levels.
In Zone 2, in the district of Santiago, carbon monoxide (CO) (Figure 5a) fluctuated between 500 and 1500 µg/m3, with peaks coinciding with periods of heavy traffic. This pattern is consistent in both the school area (green) and the church area (blue). However, a slight downward trend is observed in the second half of the analyzed period, suggesting that after the peak activity, emissions stabilize at slightly lower levels. Moreover, these values are somewhat lower than the ones registered in the District of Cusco.
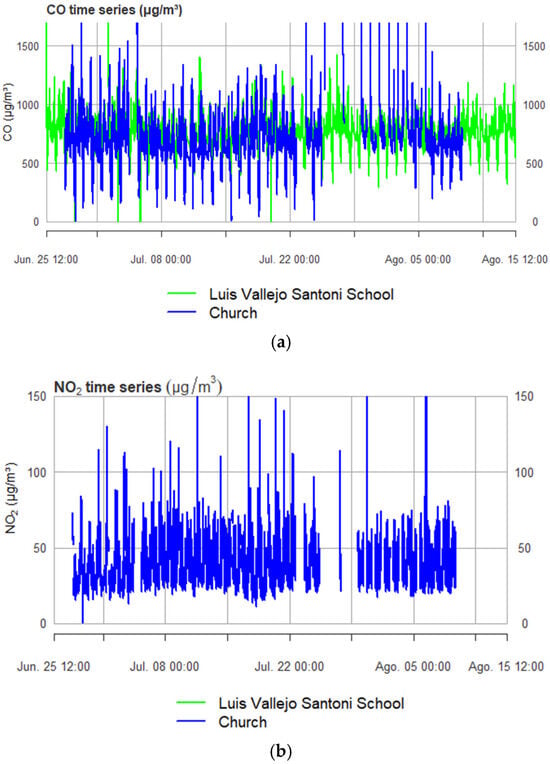
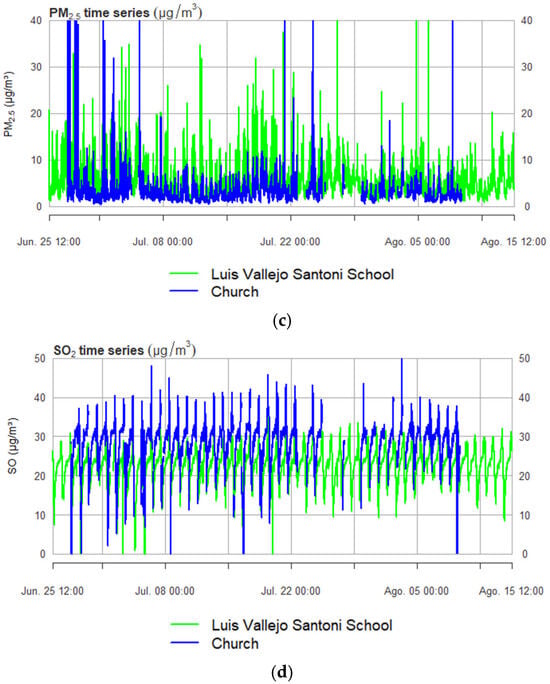
Figure 5.
Time series for the district of Santiago: (a) CO, (b) NO2, (c) PM2.5, and (d) SO2. Note: In the case of NO2, the graph for the school was not shown because the equipment failed to collect the information.
Nitrogen dioxide (NO2) (Figure 5b) shows episodes where concentrations exceeded 100 µg/m3, reflecting the impact of combustion in engines and other industrial activities. These sharp peaks indicate moments of intense vehicular activity and tend to be more noticeable in high-traffic areas, such as the school zone (green), compared to the church area (blue). Different from CO, NO2 shows values higher than the one registered in the district of Cusco.
The fine particulate matter (PM2.5) (Figure 5c) ranged between 5 and 40 µg/m3, with peaks higher than 30 µg/m3 r at certain times. These levels are particularly concerning for health, as fine particles can penetrate deep into the respiratory system. The daily variation suggests that factors such as fuel combustion, dust stirred up by traffic, and industrial activity influence its levels. For both SO2 and PM2.5, there is no visible difference compared to the values registered in the district of Cusco.
Sulfur dioxide (SO2) remains relatively stable, ranging between 10 and 40 µg/m3, without exhibiting abrupt peaks like NO2. This stability suggests a more constant emission source, generally associated with industry or the use of sulfur-containing fuels. In this case, the difference between the church and the school is less pronounced, as SO2 is more influenced by industrial sources rather than specific events or vehicular traffic.
Finally, sulfur dioxide (SO2) (Figure 5d) remained relatively stable, ranging between 10 and 40 µg/m3, without exhibiting abrupt peaks like NO2. This stability suggests a more constant emission source, generally associated with industry or the use of sulfur-containing fuels. In this case, the difference between the church and the school is less pronounced, as SO2 is more influenced by industrial sources rather than specific events or vehicular traffic.
3.1.2. Hourly Statistics and Weekend Effect
The behavior of air pollutants varies depending on the day of the week due to changes in mobility and urban activities. On weekdays, vehicular traffic is usually more intense during peak hours, while on weekends, different patterns can be observed, influenced by recreational activities and special events. The following analysis is focused on examining if there are noticeable differences between the hourly distribution of pollutants between weekdays and weekends (Figure 6).
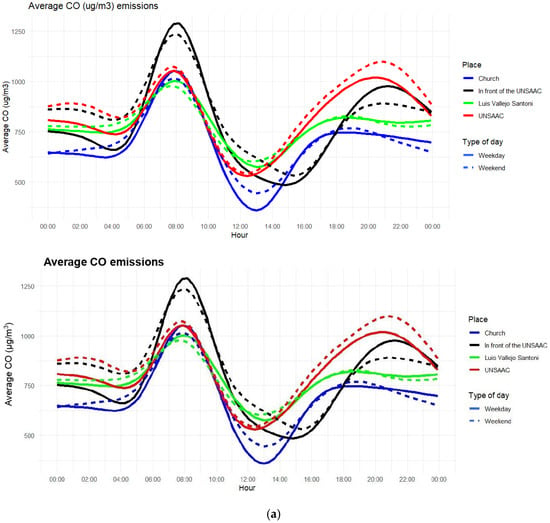
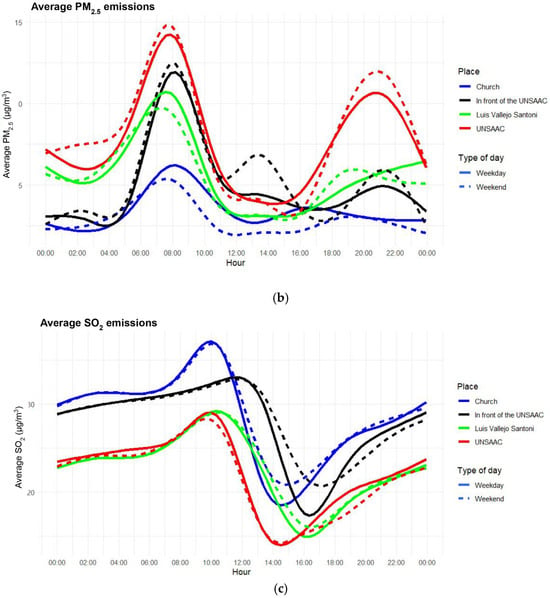
Figure 6.
Hourly concentrations differentiated between weekdays and weekends for (a) CO, (b) PM2.5, and (c) SO2.
In the Figure 6, each line in the figure corresponds to a specific location and type of day (weekday or weekend), as indicated by the combination of color and line style (solid for weekdays, dashed for weekends). This visual differentiation ensures a clear comparison of hourly pollutant behavior across the various sites.
For CO emissions (Figure 6a), there is a pronounced increase during the morning (peaking around 08:00) and evening (around 19:00) weekday rush hours, particularly in front of UNSAAC and at UNSAAC itself, where the highest concentrations exceeded 1200 µg/m3. This pattern strongly suggests a correlation with traffic activity. Weekend levels are generally lower—especially at the church—indicating reduced vehicular movement during those days.
PM2.5 emissions (Figure 6b) follow a similar trend, with sharp peaks during early morning hours (around 07:00) and in the evening (around 21:00), especially around UNSAAC, where concentrations can reach nearly 15 µg/m3. In contrast, the church location consistently shows the lowest levels across all hours (below 5 µg/m3), likely due to reduced traffic and fewer combustion sources in that area.
SO2 levels (Figure 6c) exhibit a distinct pattern: the church records the highest values during the late morning, peaking above 40 µg/m3 around 11:00, while other locations like UNSAAC and Luis Vallejo Santoni show lower concentrations (below 25 µg/m3). A pronounced decline in SO2 emissions begins between 11:00 and 12:00 across all locations and reaches its lowest point between 14:00 and 16:00. This trend may not solely reflect human activity patterns, such as midday breaks, but could also be influenced by meteorological factors like increased atmospheric mixing or wind patterns during the early afternoon.
It is important to note that NO2 levels were not analyzed in this study due to equipment malfunction, which limited the availability of reliable data for this pollutant.
3.1.3. Comparison of Air Quality Variables by District
The graphs compare air pollutant concentrations and are presented as violin plots, showing the distribution, median, and dispersion of the data. They also include the Mann–Whitney test to assess statistical differences between the districts (Figure 7).
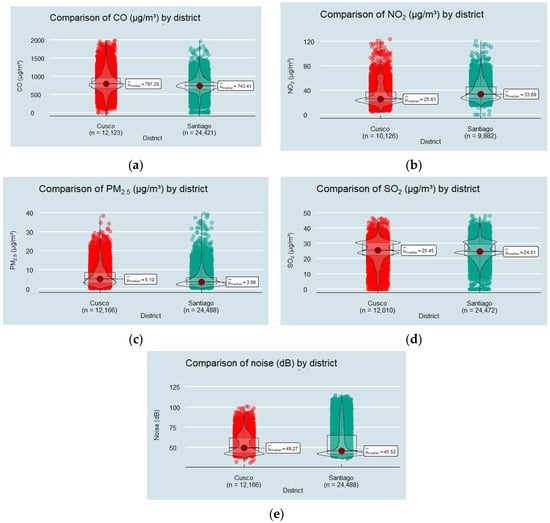
Figure 7.
Comparative density plot of (a) CO, (b) NO, (c) PM2.5, (d) SO2, and (e) noise in Cusco and Santiago.
The comparative analysis of pollution levels between Cusco and Santiago reveals statistically significant differences in CO, NO2, noise, and PM2.5 (Mann–Whitney test, p < 0.05 in all cases). Cusco exhibited higher CO concentrations (median = 797.29 μg/m3) compared to Santiago (median = 743.41 μg/m3), with a moderate effect size (r = 0.19), suggesting a greater incidence of incomplete combustion sources, such as vehicular traffic. In contrast, Santiago showed higher NO2 levels (median = 33.69 μg/m3) compared to Cusco (median = 25.61 μg/m3), with a moderate but inverse effect (r = −0.36), potentially linked to a higher number of diesel vehicles or greater traffic congestion. Regarding noise, Cusco recorded slightly higher values (median = 49.27 dB) than Santiago (median = 45.52 dB), although with a small effect size (r = 0.07), indicating a minor difference possibly related to traffic distribution and commercial activities.
Similarly, PM2.5 levels were significantly higher in Cusco (median = 5.10 μg/m3) compared to Santiago (median = 3.66 μg/m3), with a moderate effect (r = 0.25), suggesting greater accumulation of fine particles, possibly due to topographic conditions and lower atmospheric ventilation.
Finally, SO2 concentrations were slightly higher in Cusco (median = 25.45 μg/m3) compared to Santiago (median = 24.51 μg/m3), although the effect size was small (r = 0.03). This minimal difference suggests that sulfur dioxide emissions in both locations might originate from similar sources, such as industrial activities or fuel combustion, with environmental and meteorological factors influencing dispersion patterns.
These results reflect differences in emission sources and environmental conditions between both districts, highlighting the need for targeted mitigation measures based on the predominant pollutant in each locality.
However, it is important to interpret these differences cautiously, considering the distinct temporal and meteorological conditions under which the measurements were taken. The monitoring campaign in Cusco spanned approximately 20 days, while the Santiago dataset covered nearly two months, potentially introducing seasonal or climatic variability. Additionally, during the austral winter, differences in solar radiation and the angle of solar incidence—especially in high-altitude areas like Cusco—may affect ambient temperatures and the dispersion capacity of pollutants. The surrounding topography in Cusco, characterized by close mountainous terrain, could further limit atmospheric ventilation and contribute to pollutant accumulation. Therefore, these external factors may have influenced the observed values independently of emission sources. Future analyses should consider comparing equivalent time periods and integrating meteorological variables (e.g., temperature, wind speed, solar radiation) to control for confounding effects and better isolate the contribution of local sources.
3.1.4. Influence of Inti Raymi
The Inti Raymi is a traditional Andean festival celebrated in Cusco, Peru, on June 24th each year in honor of the Sun god. During this event, thousands of people gather at different locations throughout the city, which can lead to an increase in vehicular activity, use of fireworks, and other sources of atmospheric pollutants.
Analyzing air quality during this period is crucial to understanding the environmental impact of the festival. The following graphs show the concentrations of nitrogen dioxide and sulfur dioxide in the atmosphere before, during, and after the event, aiming to assess whether there is a significant increase in these pollutants associated with the celebration of Inti Raymi (Figure 8).
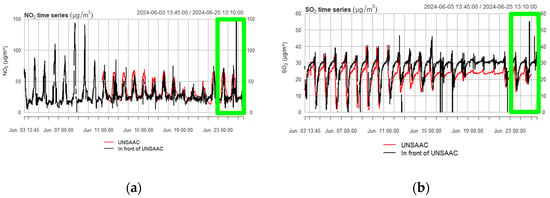
Figure 8.
Increase in (a) NO2 and (b) SO2 concentrations associated with the Inti Raymi Festival.
The Figure 8 shows the temporal evolution of nitrogen dioxide (NO2) and sulfur dioxide (SO2) concentrations at two locations in the district of Cusco: the National University of San Antonio Abad del Cusco (UNSAAC) and a point in front of it.
In the NO2 graph (left), daily variability is evident, with peaks likely linked to rush hours and higher vehicular activity. However, on 24 June—coinciding with the Inti Raymi festival—a significant spike in NO2 levels was recorded. The green box in both graphs highlights this specific period (23–25 June), during which emissions increased notably due to festivities, public gatherings, and related activities. The values observed during this peak were up to four times higher than the average concentration recorded during the preceding seven days, and also more than double the typical daily peaks from the previous week. This suggests intensified vehicular movement during and after the festivities, likely due to increased transportation demand and traffic congestion. The green-highlighted area shows a secondary peak following the main event, potentially related to post-event dispersion dynamics.
In the SO2 graph (right), a regular pattern of daily increases is observed. However, a pronounced rise was again recorded on 24 June. This surge, likely associated with the use of fireworks and combustion-based celebrations, reached values approximately twice as high as both the weekly average and the peak SO2 levels observed in the prior week. The consistent differences before and during the event suggest a direct contribution from festival-related activities.
The contrast between pollutant levels in the weeks leading up to Inti Raymi and those during the festival reinforces the hypothesis that this traditional celebration has a tangible and measurable impact on local air quality. These findings highlight the need to consider environmental implications when planning mass public events, especially in urban areas with topographic and climatic conditions that limit pollutant dispersion.
3.2. Air Quality Classification and Compliance with Environmental Standards
The results in Table 4 indicate that CO and SO2 levels remained predominantly within the Good category, with values exceeding 96% in both zones, suggesting minimal risk from these pollutants. However, NO2 and PM2.5 exhibited more variation, with NO2 in Zone 2 classified as Moderate for 56% of the recorded time, compared to only 11% in Zone 1. Similarly, PM2.5 levels in Zone 1 had a higher proportion in the Moderate range (22.97%) compared to Zone 2 (9.79%). Instances of pollution classified as Unhealthy for sensitive groups were limited but present, particularly for NO2 and PM2.5. This suggests that while air quality is generally within acceptable limits, short-term pollution events may pose risks to vulnerable populations.

Table 4.
Percentage of time data recorded in each category.
Table 5 shows that CO, PM2.5, and SO2 consistently meet regulatory limits, with compliance rates exceeding 98% in both zones. However, NO2 in Zone 1 shows a lower compliance rate (82.48%), indicating that exceedances of the national standard occurred more frequently in this area for this pollutant. The most concerning finding is related to noise pollution, which exhibited extremely low compliance levels, with values of 0.67% in Zone 1 and 2.14% in Zone 2. This indicates persistent noise levels above permissible limits, which could have negative impacts on public health and well-being.

Table 5.
Percentage of time data recorded that complied with the Peruvian Environmental Standard.
Although air quality in both zones remain largely within safe limits, the data suggest that NO2 and PM2.5 present the greatest challenges in terms of variability and intermittent risk. The occurrence of episodes classified as Moderate and, to a lesser extent, Unhealthy for sensitive groups, indicates that these pollutants can reach concentrations that, while not persistent, may affect vulnerable populations such as children, the elderly, and individuals with pre-existing respiratory conditions.
While these episodes do not indicate a sustained pollution concern, their recurrence could lead to cumulative health impacts, highlighting the importance of continuous monitoring and mitigation strategies to prevent prolonged exposure in sensitive populations.
3.3. Perception Analysis Results
As explained in Section 2.2, air quality and meteorological measurements were complemented by social studies focused on risk perception associated with atmospheric factors. A total of 534 responses were used for the following analysis. Out of the 534 responses, 259 belonged to the District of Cusco and 275 belonged to the district of Santiago.
Table 6 shows the results of air pollution risk perceptions. The majority of participants perceive that air pollution would have a serious negative impact worldwide (93.8%) and in Peru (90%). Similarly, 92% indicate that air pollution poses a strong threat to the natural environment, and that it will have very damaging impacts on society in the long term (89%). A total of 87% consider air pollution to be very serious on a personal level. Overall, the vast majority of respondents perceive the impacts of air pollution as a high risk. It is important to note that the population shows concern regarding air pollution, although the concentrations of pollutants do not show a high level of contamination.

Table 6.
Results of the questionnaire about risk perception of air pollution.
Table 7 shows the results of perceptions of the impact of air pollution on health. The majority of the participants showed a high concern for their health (95.3%) between occasionally, frequently, and always. A total of 94.2% felt the need to wash their hands and face occasionally, frequently and always. The same trends in frequency of times follow the other items, such as the fact that 92.2% aired their house, 90.2% observed that the sky is more cloudy lately, 90.3% indicated that recently they tend to drink more water than usual, 84.8% prefer to stay at home during their free time instead of going out, 86.1% of the participants think that their quality of life is deteriorating, and 88.6% of the participants indicated that they feel an unpleasant smell when they go outside. In terms of health symptoms, participants report experiencing symptoms at least occasionally as follows: red eyes (65%), sneezing (78%), coughing in the throat (66%), dry cough (58%), breathing difficulties (57%), and nose irritation (58%). Overall, the majority of participants indicated that their perception of air pollution on their health is a major concern.

Table 7.
Results of the questionnaire about air quality and health.
Table A5 shows the results of the perception of green areas. A total of 70.4% of the participants consider that green areas contribute to mitigating temperatures on sunny days; 70% of the participants indicated that these green areas are natural and contribute to the reduction of air pollution regularly, a great deal and quite a lot; 54% consider that green areas, to a large extent, fulfil the function of improving the visual appearance and image of the area; 43% indicate that green areas contribute significantly to recreation and, to a large extent, are a refuge for animals and plants; and 42% perceive green areas to be quiet in relation to traffic noise.
Table A6 shows the results of the survey on trust in scientists. A total of 74% of the participants indicated that they are intelligent; 65% reported that most are well prepared to execute high-quality research; 63% of participants reported that they are experts; 45% felt that scientists are interested in improving the lives of others; 40% indicated that scientists care about people’s wellbeing; and 39% of the participants support that scientists are honest and pay attention to public opinion. Overall, a regular percentage of participants reported that they trust scientists; on the other hand, a smaller percentage indicated that they do not trust the activities carried out by scientists.
The results mentioned were divided by district.
Figure 9 shows the group comparison of air pollution risk perception by district. The group comparison analyses indicated a difference between the Santiago and Cusco districts: Mann–Whitney = 29,130.50, p < 0.01 (p = 0.00027), rank biserial = −0.18, 95%CI [−0.27, −0.09], n = 534. These results imply that the inhabitants of the high populated areas of Santiago have a higher risk perception of air pollution compared to the inhabitants of the urban populated hills of Cusco, Although the difference in medians is comparatively small, it can be concluded that both districts have a high risk perception of the negative impacts of air pollution at the global, national, and local levels.
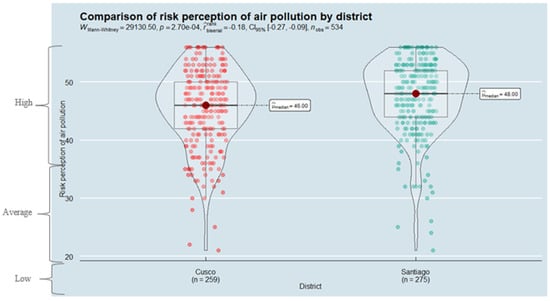
Figure 9.
Comparison of risk perception of air pollution by district.
Figure 10 shows the comparison of the risk perception of the impact of air pollution on health by district. A group comparison test was performed, and the results showed a difference between the district of Santiago and Cusco, Mann–Whitney = 40,952.00, =0.002, rank biserial = 0.15, CI 95% [0.05, 0.24], n = 534. In this case, the residents of the populated hills of Cusco have a higher perception of risk of the impact of air pollution on their health compared to the residents of the populated hills of Santiago. Although the difference in medians is relatively small, it can be concluded that both districts have a high concern about how air pollution is affecting their health thus weakening the health systems and the economy of the people.
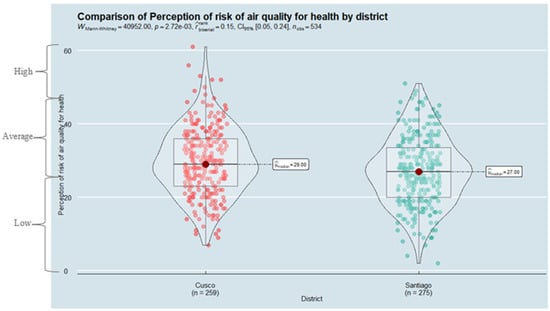
Figure 10.
Comparison of perception of risk of air quality for health by district.
Figure 11 shows the group comparison on the perception of green areas by district. The results of the group comparison test reported that there is a difference between the district of Santiago and Cusco, Mann–Whitney = 41,620.00, p = 0.0007, rank biserial = 0.17, CI 95% [0.07, 0.26], n = 534. This implies that the inhabitants of the populated hills of Cusco have more positive perceptions about green areas as spaces that can help reduce air pollution and provide protection to the inhabitants in heat wave scenarios.
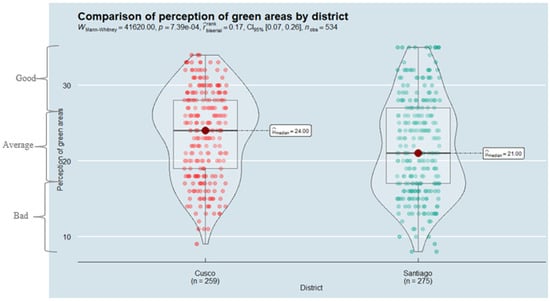
Figure 11.
Comparison of perception of green areas by district.
Figure 12 shows the comparison of trust in scientists by district. The results of the group comparison test reported that there is not a difference between the district of Santiago and Cusco, Mann–Whitney = 33,612.50, , rank biserial = −0.06, CI95% [−0.15, 0.04], n = 534. Therefore, the population of urban hilltop settlements in Cusco and Santiago have the same level of trust in scientists, whose trust is relatively high in some specific items and low in others.
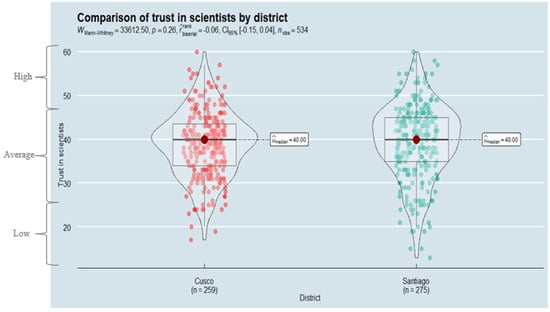
Figure 12.
Comparison of trust in scientists by district.
Table 8 shows the correlations between the variables, and most of the correlations were found to be positive and significant. Perceived Risk of Air Pollution (PRAP) is positively correlated with Perceived Health Risk of Air Pollution (PHRAP) r = 0.28 **. This indicates that as long as people have a higher risk perception of air pollution, it would be associated with a higher risk perception of the impact of air pollution on health. Similarly, the perception of air pollution perception on health is positively related to the perception of green areas (r = 0.32 **). Survey responders with a higher perception of health risk from air pollution have a higher positive perception of the presence of green areas. Lastly, the perception of green areas is positively related (r = 0.19 **) to trust in science; people with a positive perception of green areas are associated with greater trust in scientists.

Table 8.
Correlation between variables in social study.
4. Discussion
The primary objective was to conduct an experimental study about air pollution from two angles: environmental monitoring and data analysis, and social perception on environmental factors. The environmental results in terms of compliance with environmental standards are shown in Table 4 and Table 5.
These values, however, can change drastically during festivities, such as the Inti Raymi event during June. In this event, it was recorded that NO2 and SO2 values were four times and two times the average values recorded in the past 7 days accordingly.
These results are complemented by Figure 7, in which there is no noticeable long-term difference in all variables but environmental noise and NO2, where Zone 2 shows higher values compared to Zone 1. Given the fact that NO2 shows values that range up to the Unhealthy for sensitive groups air quality category, it is expected that activities related to the emission of this atmospheric contaminant play a major role in the risk perception in the two areas of study. Moreover, there is no major difference in the hourly distribution of pollutants between weekdays and weekends. One explanation for this result is that one of the major economic activities in the city of Cusco is tourism, which operates similarly on any day of the week, without discriminating if it is a weekday or weekend.
Additionally, there is a strong correlation between measured air quality and public concern, suggesting that residents are aware of the problem and its possible implications for health and well-being []. This alignment may be explained by several factors. First, exposure to elevated pollutant levels—such as NO2 concentrations that reached values categorized as Unhealthy for Sensitive Groups—likely generates perceptible symptoms (e.g., coughing, eye irritation, or breathing discomfort), which reinforce personal risk perceptions [,]. Second, residents’ heightened awareness may be influenced by cumulative experiences and observable environmental cues, such as visible haze or increased traffic emissions. These factors contribute to a more intuitive understanding of pollution-related risks, especially in areas like Cusco where tourism and urbanization increase pollutant loads consistently throughout the week. Moreover, a higher perception of risk is often associated with stronger support for environmental protection measures [], indicating that people are not only aware of the problem but also motivated to see action taken.
The social study evidenced for the first time that participants from urban populated hills in Cusco report that air pollution would have significant negative impacts globally and nationally, as well as for society at large and the natural environment. These findings support the idea that exposure to pollution is directly associated with risk perception [], so the key to managing air pollution risk perception is to examine the actual concentration of air pollutants []. On the other hand, they differ from Oltra and Sala’s [] study, where most participants did not perceive or pay attention to the quality of the air around them. However, each of these findings could be influenced by sociodemographic factors and self-reported experience []. The present findings highlight the idea that perceived risk of air pollution could generate positive behavioral responses towards the environment, such as a predisposition to support air pollution control measures [].
Regarding the perceived health risk of air pollution, a large proportion of the participants show a massive concern for their health, as evidenced by some frequent protective behaviors, for example, the need to wash their hands and face, ventilate the house, drink more water than usual, and stay indoors. Also, a high percentage (86.1%) of the participants consider that their quality of life is deteriorating due to pollution, as they report physical symptoms such as red eyes, sneezing, coughing throat, dry cough, breathing difficulties, and nose irritation. These findings support previous results [], in which the perception of pollution and health risks play an important role in the understanding of environmentally induced symptoms and illnesses. Another study [] highlights that perceptions of pollution and health risks play an important role in understanding and predicting the discomfort and health symptoms induced by the polluted environment. However, these perceptions could be influenced by other variables, such as health status and media [].
Concerning the perception of green areas, a substantial percentage (70%) consider that green areas contribute positively to reducing air pollution and mitigating temperatures on sunny days, being a refuge for plants and animals, as well as a recreational space for people. These findings are consistent with those of Kothencz et al. [], where participants perceived urban green spaces as positive and fundamental for well-being and quality of life as recreational and ecosystemic spaces, as well as with previous results [], which report a broad positive perception and strong support for urban green spaces.
Furthermore, citizen science initiatives and greater social awareness of environmental conditions have shown to play a key role in pollution mitigation efforts. The presence of green spaces not only reduces pollutant concentrations but also helps diminish the adverse health effects associated with air pollution, improving overall well-being. In this context, perceived air pollution risk is closely linked to health-related behaviors and willingness to support or pay for better environmental quality, especially in communities that feel directly exposed or affected. This reinforces the relevance of incorporating local perceptions into environmental assessments and interventions.
Given Cusco’s high altitude and rugged Andean topography, traditional ground-based monitoring can create spatial gaps. To address this, remote sensing techniques—such as satellite observations from MODIS and Sentinel-5P—have been successfully applied to track NO2, PM2.5, and ozone distributions over complex terrain in Peru []. These methods provide comprehensive spatial coverage, capturing valley-scale pollution patterns and thermally driven flows that are difficult to sample in situ. Importantly, satellite-based analysis typically follows ground-based measurements, as in situ data are essential to calibrate and extrapolate satellite observations to surface-level concentrations. In future work, integrating satellite-derived pollutant maps with local sensor data could enhance our understanding of pollution dynamics during events like Inti Raymi and improve air quality assessments in similarly challenging mountainous regions. It is important to note that remote sensing analysis should follow ground-based measurements, as field data are essential for calibrating and extrapolating satellite observations to near-surface pollutant concentrations. A key opportunity for improving our ground-based monitoring results can be based on citizen science, since a noticeable percentage of people in the study areas do not trust scientists completely.
On the other hand, with respect to trust in scientists, the majority of survey respondents consider people engaged in science to be intelligent and expert, as well as being well prepared to execute high quality research, thus demonstrating trust in scientists, which is fundamental for the adoption and acceptance of preventive and protective measures, such as care for the natural environment and mitigation measures []. These findings are similar to Krause et al. [], whose results argue that Americans have confidence in scientists, especially when it comes to controversial topics such as global warming and nuclear energy. In contrast, a considerable percentage (35%) indicate that scientists are not open to constructive criticism, and 30.7% consider them to be somewhat dishonest, demonstrating a certain distrust of scientists, which could lead to negative attitudes towards adaptation and mitigation measures [].
5. Conclusions
Air quality monitoring campaigns were carried out in different areas of the city of Cusco to assess population exposure to air pollutants. The results showed that fine particulate matter (PM2.5) and nitrogen dioxide (NO2) are particularly problematic, with approximately 40% to 60% of recorded values falling within the “Moderate” or “Unhealthy for sensitive groups” categories, according to international standards. Furthermore, it was found that city-wide festivities such as Inti Raymi can cause pollutant concentrations to rise up to three times compared to the weeks prior, highlighting the significant impact of large public events on air quality.
Public perception of air quality in Cusco is varied: while some residents recognize the health risks posed by air pollution and express concern about its long-term effects, others prioritize more immediate urban challenges. Pollution exposure is unevenly distributed, with the historic and densely populated city center (Zone 1) experiencing higher levels of air pollution and noise than the peripheral, less urbanized areas (Zone 2). This environmental inequality highlights the need for targeted interventions within urban planning.
Because the air quality recorded has shown moderate levels of pollution and inhabitants perceive a noticeable risk of exposure affecting their health, the main challenge is to find solutions that integrate both social and engineering perspectives. A considerable percentage of the population trusts scientists; however, a relatively smaller percentage expresses distrust. Therefore, the first crucial step is to rebuild this relationship by collaboratively developing initiatives that serve both the community and scientific goals. Without this foundational trust, projects risk being rejected or misunderstood by the population, potentially damaging the reputation of scientists and hindering effective interventions.
Improving air quality in Cusco is not only vital for protecting public health but also essential for sustainable urban development. As Peru continues to urbanize, addressing environmental risks through inclusive, community-based approaches can enhance residents’ well-being, reduce health burdens related to pollution, and promote resilient city growth. Balancing cultural preservation, economic development, and environmental health requires an integrated approach that recognizes the social dimensions of environmental challenges.
Author Contributions
Conceptualization, F.S.M.-R. and D.H.; methodology, F.S.M.-R. and D.H.; investigation, M.M.P., E.T.H. and E.I.; data analysis, M.M.P., E.T.H. and E.I.; data duration, M.M.P., E.T.H. and E.I.; complementary data analysis, E.T.H. and E.I.; writing—original draft, M.M.P., E.T.H. and E.I.; writing –review and editing, M.M.P., E.T.H., E.I. and D.L.M., supervision, D.L.M.; funding acquisition, D.L.M. All authors have read and agreed to the published version of the manuscript.
Funding
This research was funded by PROCIENCIA: Proyecto AIRE: contAmInación atmosféRica en cErros poblados (Air pollution in populated hills), grant number PE501082689-2023 in E041-2023-01.
Institutional Review Board Statement
Not applicable.
Informed Consent Statement
The study was approved by the IRB of the University of Engineering and Technology (IRB), Decision No. 001-2024-CIEI-UTEC. All participants signed the informed consent form before answering the survey.
Data Availability Statement
Data is available on request.
Acknowledgments
The authors would like to thank the following agencies and people. PROCIENCIA: Proyecto AIRE: contAmInación atmosféRica en cErros poblados (Air pollution in populated hills) through award number PE501082689-2023 in E041-2023-01 financial scheme. We also extend our gratitude to UNSAAC and the Institución Educativa Técnica Mixta “Luis Vallejo Santoni” School for their valuable support during the fieldwork and data collection phases of this study.
Conflicts of Interest
The authors declare no conflicts of interest.
Appendix A

Table A1.
Reliability indices of the air pollution risk perception questionnaire.
Table A1.
Reliability indices of the air pollution risk perception questionnaire.
| Items | Mean | SD | Skew | Kurtosis | Alpha-Item | citc | Alpha |
|---|---|---|---|---|---|---|---|
| item_1 | 5.63 | 1.21 | −0.77 | 0.36 | 0.9 | 0.67 | 0.91 |
| item_2 | 5.61 | 1.15 | −0.61 | 0.12 | 0.9 | 0.7 | 0.91 |
| item_3 | 5.93 | 1.04 | −0.77 | 0.01 | 0.89 | 0.76 | 0.91 |
| item_4 | 6.07 | 1.03 | −1.27 | 2.19 | 0.89 | 0.75 | 0.91 |
| item_5 | 6.23 | 0.98 | −1.52 | 2.83 | 0.9 | 0.71 | 0.91 |
| item_6 | 5.77 | 1.11 | −0.78 | 0.42 | 0.89 | 0.79 | 0.91 |
| item_7 | 6.02 | 1.05 | −0.92 | 0.18 | 0.89 | 0.74 | 0.91 |
| item_8 | 5.21 | 1.31 | −0.51 | −0.07 | 0.91 | 0.53 | 0.91 |

Table A2.
Reliability indices of the air quality perception questionnaire for the global assessment of the effects of air pollution on health.
Table A2.
Reliability indices of the air quality perception questionnaire for the global assessment of the effects of air pollution on health.
| Items | Mean | SD | Skew | Kutosis | Alpha-Item | citc | Alpha |
|---|---|---|---|---|---|---|---|
| item_1 | 1.94 | 0.82 | −0.4 | −0.43 | 0.86 | 0.45 | 0.86 |
| item_2 | 1.01 | 0.93 | 0.54 | −0.65 | 0.86 | 0.51 | 0.86 |
| Item_3 | 0.94 | 0.95 | 0.66 | −0.61 | 0.85 | 0.64 | 0.86 |
| Item_4 | 1.19 | 0.87 | 0.46 | −0.39 | 0.85 | 0.66 | 0.86 |
| Item_5 | 0.97 | 0.86 | 0.59 | −0.36 | 0.85 | 0.62 | 0.86 |
| Item_6 | 0.81 | 0.83 | 0.81 | 0.03 | 0.85 | 0.59 | 0.86 |
| Item_7 | 0.84 | 0.88 | 0.74 | −0.35 | 0.86 | 0.51 | 0.86 |
| Item_8 | 1.2 | 0.9 | 0.28 | −0.73 | 0.86 | 0.43 | 0.86 |
| Item_9 | 1.19 | 0.85 | 0.19 | −0.69 | 0.86 | 0.32 | 0.86 |
| Item_10 | 1.6 | 1 | −0.05 | −1.08 | 0.86 | 0.31 | 0.86 |
| Item_11 | 1.84 | 0.92 | −0.28 | −0.87 | 0.86 | 0.42 | 0.86 |
| Item_12 | 1.33 | 0.91 | 0.33 | −0.67 | 0.86 | 0.26 | 0.86 |
| Item_13 | 0.82 | 0.89 | 0.74 | −0.48 | 0.87 | 0.05 | 0.86 |
| Item_14 | 1.38 | 0.95 | 0.2 | −0.88 | 0.86 | 0.26 | 0.86 |
| Item_15 | 1.94 | 0.89 | −0.37 | −0.77 | 0.86 | 0.51 | 0.86 |
| Item_16 | 1.71 | 0.91 | −0.16 | −0.83 | 0.86 | 0.38 | 0.86 |
| Item_17 | 1.54 | 0.88 | 0 | −0.71 | 0.85 | 0.53 | 0.86 |
| Item_18 | 0.74 | 0.8 | 0.81 | −0.08 | 0.86 | 0.4 | 0.86 |
| Item_19 | 1.25 | 0.91 | 0.33 | −0.66 | 0.86 | 0.47 | 0.86 |
| Item_20 | 1.78 | 0.92 | −0.3 | −0.74 | 0.86 | 0.49 | 0.86 |
| Item_21 | 1.52 | 0.86 | −0.04 | −0.65 | 0.85 | 0.56 | 0.86 |
| Item_22 | 0.86 | 0.93 | 0.81 | −0.33 | 0.86 | 0.31 | 0.86 |

Table A3.
Reliability indices of the perception of green areas questionnaire.
Table A3.
Reliability indices of the perception of green areas questionnaire.
| Items | Mean | SD | Skew | Kurtosis | Alpha-Item | citc | Alpha |
|---|---|---|---|---|---|---|---|
| item_1 | 3.17 | 1.11 | 0 | −0.89 | 0.9 | 0.61 | 0.9 |
| item_2 | 3.06 | 1.28 | −0.14 | −1.09 | 0.9 | 0.62 | 0.9 |
| item_3 | 3.27 | 1.07 | −0.07 | −0.78 | 0.89 | 0.7 | 0.9 |
| item_4 | 3.14 | 1.09 | 0.06 | −0.74 | 0.88 | 0.76 | 0.9 |
| item_5 | 3.26 | 1.16 | −0.1 | −0.86 | 0.88 | 0.77 | 0.9 |
| item_6 | 3.21 | 1.15 | −0.01 | −0.91 | 0.88 | 0.74 | 0.9 |
| item_7 | 3.53 | 1.17 | −0.28 | −1.03 | 0.88 | 0.78 | 0.9 |

Table A4.
Reliability indices of the trust in the scientists questionnaire.
Table A4.
Reliability indices of the trust in the scientists questionnaire.
| Items | Mean | SD | Skew | Kurtosis | Alpha-Item | citc | Alpha |
|---|---|---|---|---|---|---|---|
| item_1 | 3.69 | 0.97 | −0.55 | −0.11 | 0.92 | 0.42 | 0.92 |
| ítem_2 | 3.07 | 1.02 | −0.18 | −0.72 | 0.91 | 0.7 | 0.92 |
| item_3 | 3.12 | 1.02 | −0.3 | −0.58 | 0.91 | 0.77 | 0.92 |
| item_4 | 2.99 | 1.06 | −0.01 | −0.76 | 0.91 | 0.59 | 0.92 |
| item_5 | 3.9 | 0.88 | −0.76 | 0.49 | 0.92 | 0.49 | 0.92 |
| item_6 | 3.1 | 0.97 | −0.23 | −0.49 | 0.91 | 0.67 | 0.92 |
| item_7 | 3.25 | 0.98 | −0.32 | −0.51 | 0.91 | 0.73 | 0.92 |
| item_8 | 3.09 | 0.94 | −0.1 | −0.52 | 0.91 | 0.75 | 0.92 |
| item_9 | 3.64 | 0.95 | −0.75 | 0.35 | 0.91 | 0.61 | 0.92 |
| item_10 | 3.1 | 0.97 | −0.21 | −0.5 | 0.91 | 0.75 | 0.92 |
| item_11 | 3.14 | 0.93 | −0.22 | −0.45 | 0.91 | 0.73 | 0.92 |
| item_12 | 3.09 | 1.01 | −0.18 | −0.68 | 0.91 | 0.71 | 0.92 |

Table A5.
Results of the questionnaire about vegetation.
Table A5.
Results of the questionnaire about vegetation.
| Items | M | SD | |||||
|---|---|---|---|---|---|---|---|
| 1. How natural do you think the area is? | 3.17 | 1.1 | Nothing natural | Something natural | Natural | Very natural | Quite natural |
| 5.1% | 26.2% | 28.1% | 27.7% | 12.9% | |||
| 2. How quiet is the green area in terms of traffic noise? | 3.06 | 1.3 | Nothing calm | Something quiet | Quiet | Very quiet | Quite quiet |
| 14.8% | 20.6% | 22.5% | 28.5% | 13.7% | |||
| 3. To what extent does the green area satisfy the recreational function? | 3.27 | 1.1 | Nothing | Little | Something | A lot | Quite |
| 3.9% | 22.1% | 30.9% | 29.5% | 13.7% | |||
| 4. To what extent does the green area satisfy the function: cooler temperatures in summer or sunny days? | 3.14 | 1.1 | 5.3% | 24.4% | 33.8% | 23.8% | 12.8% |
| 5. To what extent does the green area satisfy the function: shelter for a variety of plants and animals? | 3.26 | 1.2 | 6.4% | 21.2% | 30.0% | 25.5% | 17.0% |
| 6. To what extent does the green area satisfy the function: reduction of air pollution? | 3.21 | 1.2 | 5.8% | 24.2% | 29.2% | 24.7% | 16.1% |
| 7. To what extent does the green area satisfy the function: visual appearance or improve the image of the area? | 3.53 | 1.2 | 3.2% | 20.6% | 21.9% | 29.0% | 25.3% |

Table A6.
Results of the questionnaire about trust in scientists.
Table A6.
Results of the questionnaire about trust in scientists.
| Items | M | SD | |||||
|---|---|---|---|---|---|---|---|
| 1. To what extent are most scientists experts or inexperienced? | 3.69 | 0.97 | Very inexperienced | Somewhat inexperienced | Neither experts nor inexperienced | Somewhat experts | Very expert |
| 2.1% | 10.1% | 24.7% | 43.4% | 19.7% | |||
| 2. To what extent are most scientists honest or dishonest? | 3.07 | 1.02 | Very dishonest | Somewhat dishonest | Neither honest nor dishonest | Somewhat honest | Very expert |
| 6.0% | 24.7% | 30.7% | 33.1% | 5.4% | |||
| 3. To what extent are most scientists concerned or not concerned about people’s well-being? | 3.12 | 1.02 | They don’t care at all | They care little | They neither care nor stop caring | They are worried about something | They are very concerned |
| 6.9% | 20.4% | 32.2% | 34.6% | 5.8% | |||
| 4. To what extent are most scientists open to receiving constructive criticism? | 2.99 | 1.06 | Nothing open | Little open | Neither open nor closed | Somewhat open | Very open |
| 7.3% | 27.7% | 30.5% | 27.7% | 6.7% | |||
| 5. To what extent are most scientists intelligent or not? | 3.9 | 0.88 | Very unintelligent | Unintelligent | Neither intelligent nor unintelligent | Somewhat intelligent | Very intelligent |
| 1.1% | 6.4% | 18.4% | 49.4% | 24.7% | |||
| 6. To what extent are most scientists ethical or not? | 3.1 | 0.97 | Very unethical | Unethical | Neither ethical nor unethical | Somewhat ethical | Very ethical |
| 5.2% | 21.3% | 36.1% | 32.4% | 4.9% | |||
| 7. To what extent are most scientists interested in improving the lives of others? | 3.25 | 0.98 | Not interested at all | Little interested | Neither interested nor not interested | Somewhat interested | Very interested |
| 3.9% | 19.5% | 31.5% | 38.2% | 6.9% | |||
| 8. To what extent are most scientists willing or unwilling to be transparent? | 3.09 | 0.94 | Not at all willing | Unwilling | Neither willing nor unwilling | Somewhat willing | Very willing |
| 3.9% | 23.4% | 37.5% | 30.1% | 5.1% | |||
| 9. How qualified or unqualified are most scientists to carry out high-quality research? | 3.64 | 0.95 | Very little qualified | Little qualified | Neither qualified nor unqualified | Something qualified | Very qualified |
| 3.2% | 9.4% | 22.8% | 49.6% | 15.0% | |||
| 10. To what extent are most scientists insincere or sincere? | 3.1 | 0.97 | Very insincere | Somewhat insincere | Neither sincere nor insincere | Somewhat sincere | Very sincere |
| 5.3% | 21.6% | 36.2% | 31.9% | 5.1% | |||
| 11. To what extent are most scientists considerate or inconsiderate of the interests of others? | 3.14 | 0.93 | Very inconsiderate | Somewhat inconsiderate | Neither considered nor inconsiderate | Somewhat considerate | Very considerate |
| 3.9% | 20.8% | 37.3% | 33.1% | 4.9% | |||
| 12. To what extent do scientists pay attention to the opinions of others? | 3.09 | 1.01 | Very little attention | Little attention | Neither too much nor too little attention | Some attention | Lots of attention |
| 5.6% | 24.0% | 31.6% | 33.1% | 5.6% |
References
- Shairsingh, K.; Barrera, M.; Wolf, J.; Prüss-Ustün, A.; Künzli, N. WHO air quality database: Relevance, history and future developments. Bull. World Health Organ. 2023, 101, 356–358. [Google Scholar] [CrossRef] [PubMed]
- Costa, S.; Ferreira, J.; Silveira, C.; Costa, C.; Lopes, D.; Relvas, H.; Borrego, C.; Roebeling, P.; Miranda, A. Integrating health on air quality assessment—Review report on health risks of two major European outdoor air pollutants: PM and NO2. J. Toxicol. Environ. Health Part B 2014, 17, 307–340. [Google Scholar] [CrossRef] [PubMed]
- Wang, Y.; Ding, D.; Kang, N.; Xu, Z.; Yuan, H.; Ji, X.; Dou, Y.; Guo, L.; Shu, M.; Wang, X. Effects of combined exposure to PM2.5, O3, and NO2 on health risks of different disease populations in the Beijing-Tianjin-Hebei region. Sci. Total Environ. 2024, 912, 178103. [Google Scholar] [CrossRef]
- Mak, H.W.L.; Ng, D.C.Y. Spatial and socio-classification of traffic pollutant emissions and associated mortality rates in high-density Hong Kong via improved data analytic approaches. Int. J. Environ. Res. Public Health 2021, 18, 6532. [Google Scholar] [CrossRef]
- Conry, P.; Sharma, A.; Potosnak, M.; Leo, L.S.; Feng, X.; Kotamarthi, V.R.; Wuebbles, D.J. Chicago’s heat island and climate change: Bridging the scales via dynamical downscaling. J. Appl. Meteorol. Climatol. 2015, 54, 1439–1459. [Google Scholar] [CrossRef]
- Lee, S.-M.; Fernando, H.J.S. Dispersion of an urban photochemical plume in Phoenix metropolitan area. Atmos. Environ. 2013, 81, 525–533. [Google Scholar] [CrossRef]
- Vos, P.E.J.; Maiheu, B.; Vankerkom, J.; Janssen, S. Improving local air quality in cities: To tree or not to tree? Environ. Pollut. 2012, 183, 113–122. [Google Scholar] [CrossRef]
- Wang, L.; Niu, D.; Fan, H.; Long, X. Urban configuration and PM2.5 concentrations: Evidence from 330 Chinese cities. Environ. Int. 2022, 158, 107129. [Google Scholar] [CrossRef]
- Vu, B.N.; McNabola, A.; Gill, L.W. Developing an advanced PM2.5 exposure model in Lima, Peru. Remote Sens. 2019, 11, 641. [Google Scholar] [CrossRef]
- Underhill, L.J.; Joshi, R.; Gladson, L.A.; Miranda, J.J.; Tavera, J.D.; Naeher, L.P.; Gonzales, G.F.; Breysse, P.N. Association of roadway proximity with indoor air pollution in a peri-urban community in Lima, Peru. Int. J. Environ. Res. Public Health 2015, 12, 13466–13481. [Google Scholar] [CrossRef]
- Thompson, W.T.; Holt, T.; Pullen, J. Investigation of a sea breeze front in an urban environment. Q. J. R. Meteorol. Soc. 2007, 133, 579–594. [Google Scholar] [CrossRef]
- Warthon, B.; Miranda, I.; Quispe, I.; Ponce, R.E.; Ramos, V.; Zamalloa, A.; Tupayachi, R.; Warthon, L. Evaluación de la contaminación del aire por material particulado PM2.5 en la ciudad del Cusco respecto de los índices de calidad del aire entre 2017 y 2018. Ambiente Comport. Y Soc. 2023, 6, 1–15. [Google Scholar] [CrossRef]
- Montalvo, L.; Fosca, D.; Paredes, D.; Abarca, M.; Saito, C.; Villanueva, E. An air quality monitoring and forecasting system for Lima city with low-cost sensors and artificial intelligence models. Front. Sustain. Cities 2022, 4, 849762. [Google Scholar] [CrossRef]
- Jennings, V.; Reid, C.E.; Fuller, C.H. Green infrastructure can limit but not solve air pollution injustice. Nat. Commun. 2021, 12, 4681. [Google Scholar] [CrossRef] [PubMed]
- Di Sabatino, S.; Buccolieri, R.; Pulvirenti, B.; Britter, R. Simulations of pollutant dispersion within idealised urban-type geometries with CFD and integral models. Atmos. Environ. 2007, 41, 5484–5496. [Google Scholar] [CrossRef]
- Villafuerte, L.B.; Hartinger, S.; Steenland, K.; Naeher, L.P.; Checkley, W. Evaluating the performance of low-cost air quality monitors in Lima, Peru. In ISEE Conference Abstracts, Proceedings of the ISEE 2024: 36th Annual Conference of the International Society of Environmental Epidemiology, Santiago, Chile, 25–28 August 2024; EHP Publishing: Research Triangle Park, NC, USA, 2024; Volume 2024. [Google Scholar] [CrossRef]
- Buccolieri, R.; Sandberg, M.; Di Sabatino, S. City breathability and its link to pollutant concentration distribution within urban-like geometries. Atmos. Environ. 2010, 44, 1894–1903. [Google Scholar] [CrossRef]
- Keeler, B.L.; Wood, S.A.; Polasky, S.; Kling, C.L.; Filstrup, C.T.; Downing, J.A. Social-ecological and technological factors moderate the value of urban nature. Nat. Sustain. 2019, 2, 29–38. [Google Scholar] [CrossRef]
- Renn, O. Perception of risks. Geneva Pap. Risk Insur. Issues Pract. 2004, 29, 102–114. [Google Scholar] [CrossRef]
- Oltra, C.; Sala, R. Communicating the risks of urban air pollution to the public: A study of urban air pollution information services. Rev. Int. Contam. Ambient. 2015, 31, 361–375. [Google Scholar]
- Long, Y.; He, S.Y.; Liu, Q.; Yang, J.; Zhang, X. Impact of risk perception on intrapersonal heterogeneity in decision-making processes by air pollution context: A latent variable and latent class regret-utility approach. J. Clean. Prod. 2023, 405, 139305. [Google Scholar] [CrossRef]
- Liu, C.; Zhang, X.; Zhang, Y.; Wu, S.; Bai, C.; Song, Y. Effect of neighbourhood greenness on the association between air pollution and risk of stroke first onset: A case-crossover study in Shandong Province, China. Int. J. Hyg. Environ. Health 2023, 254, 114262. [Google Scholar] [CrossRef]
- Cori, L.; Bianchi, F.; Ranucci, G.; Sebastiani, F.; Bianchi, N. Risk perception of air pollution: A systematic review focused on particulate matter exposure. Int. J. Environ. Res. Public Health 2020, 17, 6424. [Google Scholar] [CrossRef] [PubMed]
- Sahrir, S.; Yalçınkaya, N.M.; Say, N. Exploring risk perception and intention to improve the air quality. Plan. Malays. J. 2022, 20, 1140. [Google Scholar] [CrossRef]
- Abhijith, K.; Kumar, P.; Omidvarborna, H.; Mendez, M.; McCallan, A.; Carpenter-Lomax, D. Improving air pollution awareness of the general public through citizen science approach. Sustain. Horiz. 2024, 10, 100086. [Google Scholar] [CrossRef]
- Mak, H.W.L.; Lam, Y.F. Comparative assessments and insights of data openness of 50 smart cities in air quality aspects. Sustain. Cities Soc. 2021, 69, 102868. [Google Scholar] [CrossRef]
- Relvas, H.; Lopes, D.; Armengol, J. Empowering communities: Advancements in air quality monitoring and citizen engagement. Urban. Clim. 2025, 60, 102344. [Google Scholar] [CrossRef]
- Hu, X.; Li, X.; Zhou, B.; Xue, M. Air Pollution Meteorology; Elsevier BV: Amsterdam, The Netherlands, 2024. [Google Scholar]
- U.S. Environmental Protection Agency. Quality Assurance Handbook for Air Pollution Measurement Systems, Volume II: Ambient Air Quality Monitoring Program; RTP, NC 27711; U.S. Environmental Protection Agency: Washington, DC, USA.
- Ministerio del Ambiente. Protocolo Nacional de Monitoreo de la Calidad Ambiental del Aire; Ministerio del Ambiente: Lima, Perú, 2019.
- Qaira. Política del Sistema de Gestión de Calidad. Available online: https://www.qairadrones.com/assets/Reports/Politica-de-Calidad-V02.pdf (accessed on 17 August 2024).
- R Core Team. Smoothed Conditional Means—Geom_Smooth. ggplot2.tidyverse.org. 2023. Available online: https://ggplot2.tidyverse.org/reference/geom_smooth.html (accessed on 5 June 2024).
- INEI. Instituto Nacional de Estadística e Informática Cusco: Resultados Definitivos—Población Económicamente Activa. 2017. Available online: https://www.inei.gob.pe/media/MenuRecursivo/publicaciones_digitales/Est/Lib1613/08TOMO_01.pdf (accessed on 5 June 2024).
- Carrasco, J.; Monge-Rodríguez, F.; y Landázuri, V. Validation and adaptation of the scale of risk perception of air pollution in Peru. PsyArXiv 2024. Available online: https://osf.io/preprints/psyarxiv/cs7fa_v1 (accessed on 13 May 2024).
- Séverine, D.; Ségala, C.; Pédrono, G.; y Mesbah, M. A new air quality perception scale for global assessment of air pollution health effects. Risk Anal. 2012, 32, 2043–2054. [Google Scholar] [CrossRef]
- Kothencz, G.; Kolcsár, R.; Cabrera-Barona, P.; y Szilassi, P. Urban green space perception and its contribution to well-being. Int. J. Environ. Res. Public Health 2017, 14, 766. [Google Scholar] [CrossRef]
- Cologna, V.; Mede, N.G.; Berger, S.; Besley, J.; Brick, C.; Joubert, M.; Maibach, E.W.; Mihelj, S.; Oreskes, N.; Schäfer, M.S.; et al. Trust in scientists and their role in society across 68 countries. Nat. Hum. Behav. 2025, 9, 713–730. [Google Scholar] [CrossRef]
- Cumming, G. The new statistics: Why and how. Psychol. Sci. 2014, 25, 7–29. [Google Scholar] [CrossRef] [PubMed]
- Pu, S.; Shao, Z.; Fang, M.; Yang, L.; Liu, R.; Bi, J.; y Ma, Z. Spatial distribution of the public’s risk perception for air pollution: A nationwide study in China. Sci. Total Environ. 2019, 655, 454–462. [Google Scholar] [CrossRef] [PubMed]
- Orru, K.; Nordin, S.; Harzia, H.; Orru, H. The role of perceived air pollution and health risk perception in health symptoms and disease: A population-based study combined with modelled levels of PM10. Int. Arch. Occup. Environ. Health 2018, 91, 581–589. [Google Scholar] [CrossRef]
- Oltra, C.; y Sala, R. Percepción Pública de la Contaminación Atmosférica Urbana en Cuatro Ciudades Españolas (Informe Técnico CIEMAT No. 1359), CIEMAT. 2015. Available online: http://documenta.ciemat.es/handle/123456789/255 (accessed on 13 May 2024).
- Sahrir, S.; Yalçınkaya, N.; Say, N.; y Abdullah, A. Risk perception of the public towards air pollution in urban Turkey. Solid State Technol. 2020, 63. Available online: https://solidstatetechnology.us/index.php/JSST/article/view/874 (accessed on 13 May 2024).
- Claeson, A.S.; Lidén, E.; Nordin, M.; Nordin, S. The role of perceived pollution and health risk perception in annoyance and health symptoms: A population-based study of odorous air pollution. Int. Arch. Occup. Environ. Health 2013, 86, 367–374. [Google Scholar] [CrossRef] [PubMed]
- Zeng, X.; Yang, G. Influencing factors of air-quality perception in China: What is constructed? What is hidden? Front. Environ. Sci. 2023, 10. [Google Scholar] [CrossRef]
- Jim, C.Y.; Chen, W.Y. Perception and Attitude of Residents Toward Urban Green Spaces in Guangzhou (China). Environ. Manag. 2006, 38, 338–349. [Google Scholar] [CrossRef]
- Vargas-Cuentas, N.I.; Ramos-Cosi, S.J.; Roman-Gonzalez, A. Air Quality Analysis in Pasco, Peru Using Remote Sensing. Int. J. Eng. Trends Technol. 2021, 69, 30–38. [Google Scholar] [CrossRef]
- Dohle, S.; Wingen, T.; Schreiber, M. Acceptance and Adoption of Protective Measures During the COVID-19 Pandemic: The Role of Trust in Politics and Trust in Science. Soc. Psychol. Bull. 2020, 15, 1–23. [Google Scholar] [CrossRef]
- Krause, N.M.; Brossard, D.; Scheufele, D.A.; Xenos, M.A.; Franke, K. Trends—Americans’ trust in science and scientists. Public Opin. Q. 2019, 83, 817–836. [Google Scholar]
- Spaccatini, F.; Richetin, J.; Riva, P.; Pancani, L.; Ariccio, S.; Sacchi, S. Trust in science and pollution aversion: Attitudes toward adaptation measures predict flood risk perception. Int. J. Disaster Risk Reduct. 2022, 76, 103024. [Google Scholar] [CrossRef]
Disclaimer/Publisher’s Note: The statements, opinions and data contained in all publications are solely those of the individual author(s) and contributor(s) and not of MDPI and/or the editor(s). MDPI and/or the editor(s) disclaim responsibility for any injury to people or property resulting from any ideas, methods, instructions or products referred to in the content. |
© 2025 by the authors. Licensee MDPI, Basel, Switzerland. This article is an open access article distributed under the terms and conditions of the Creative Commons Attribution (CC BY) license (https://creativecommons.org/licenses/by/4.0/).

