
Emission Rates for Light-Duty Truck Towing Operations in Real-World Conditions

 ,
,  , , ,
, , ,
Abstract
1. Introduction
1.1. Background and Scope
1.2. Literature Review
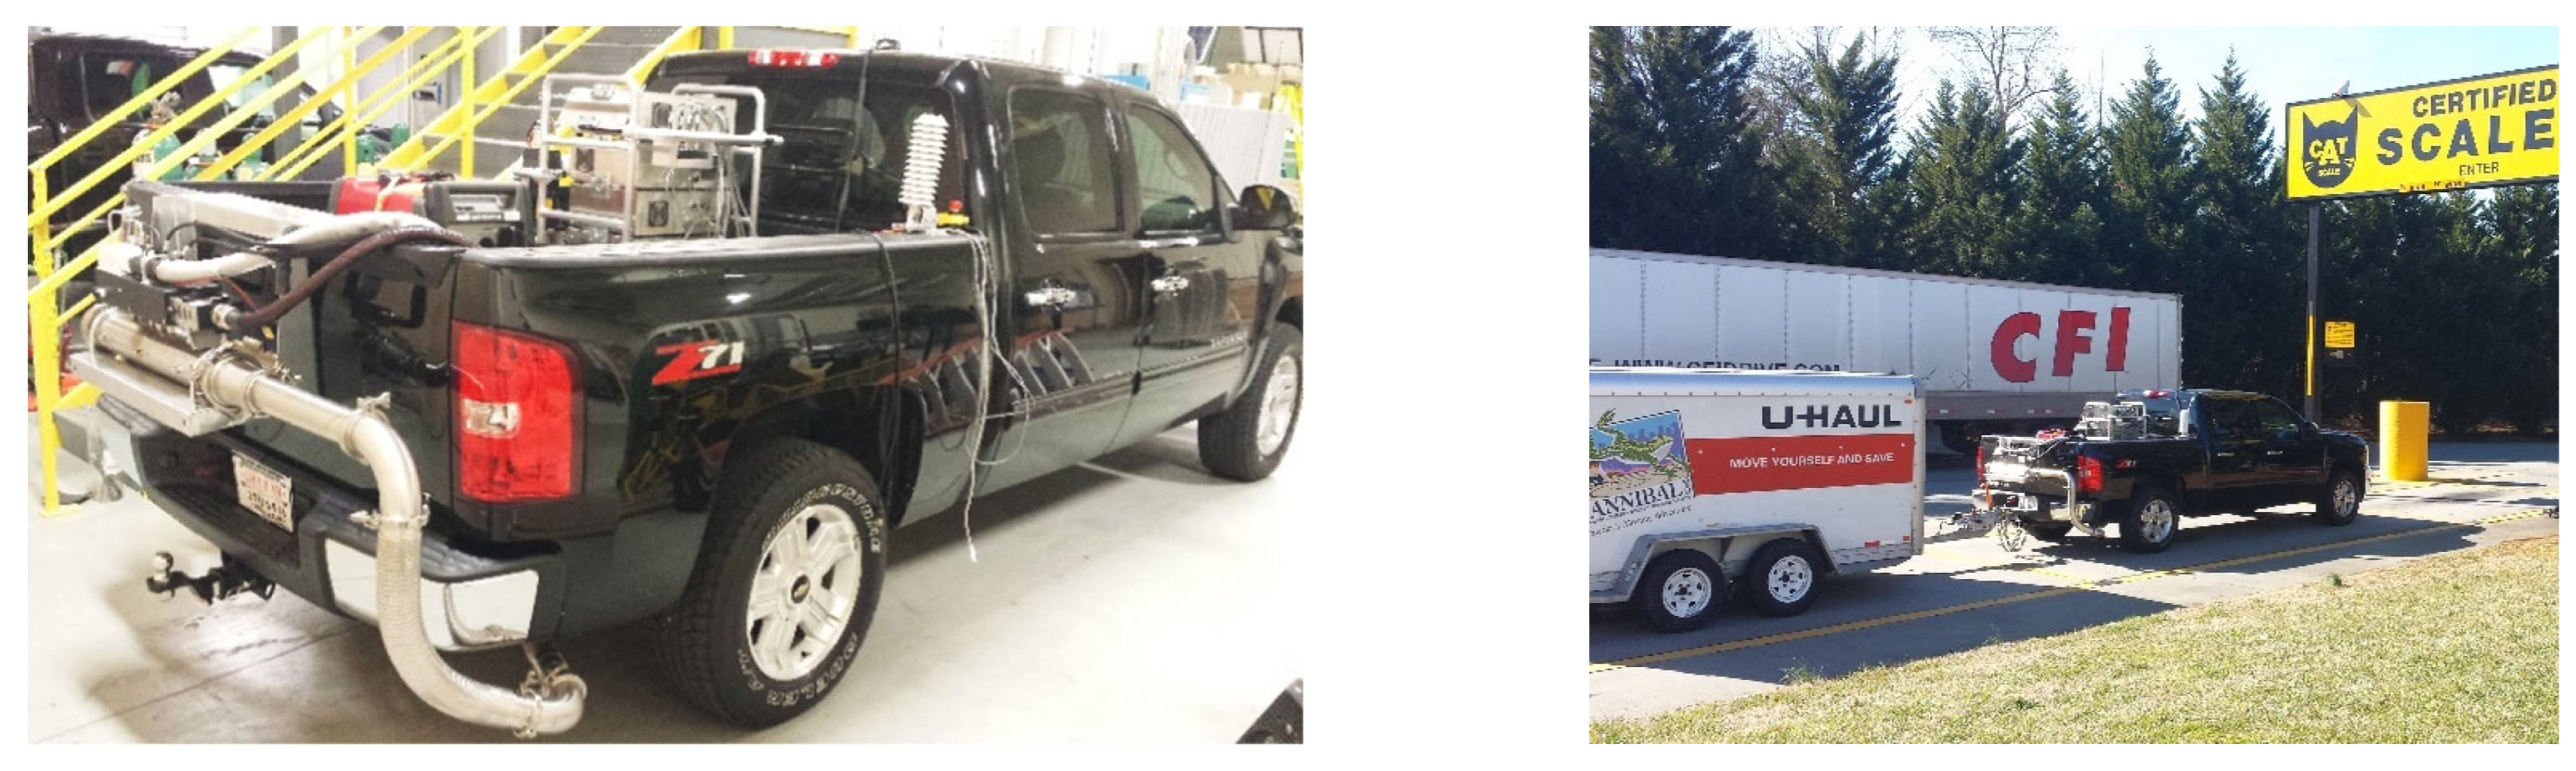
2. Materials and Methods
2.1. Data Processing
2.2. Analytical Approach
2.3. Calculating MOVES Operating Modes
2.4. Comparing Instantaneous Emission Rates
- Instantaneous VSP values of three light-duty trucks under different hauling operations (i.e., “with trailer” or “without trailer”) were calculated using Equation (1), where variables A, B, C, and M were input according to each load state.
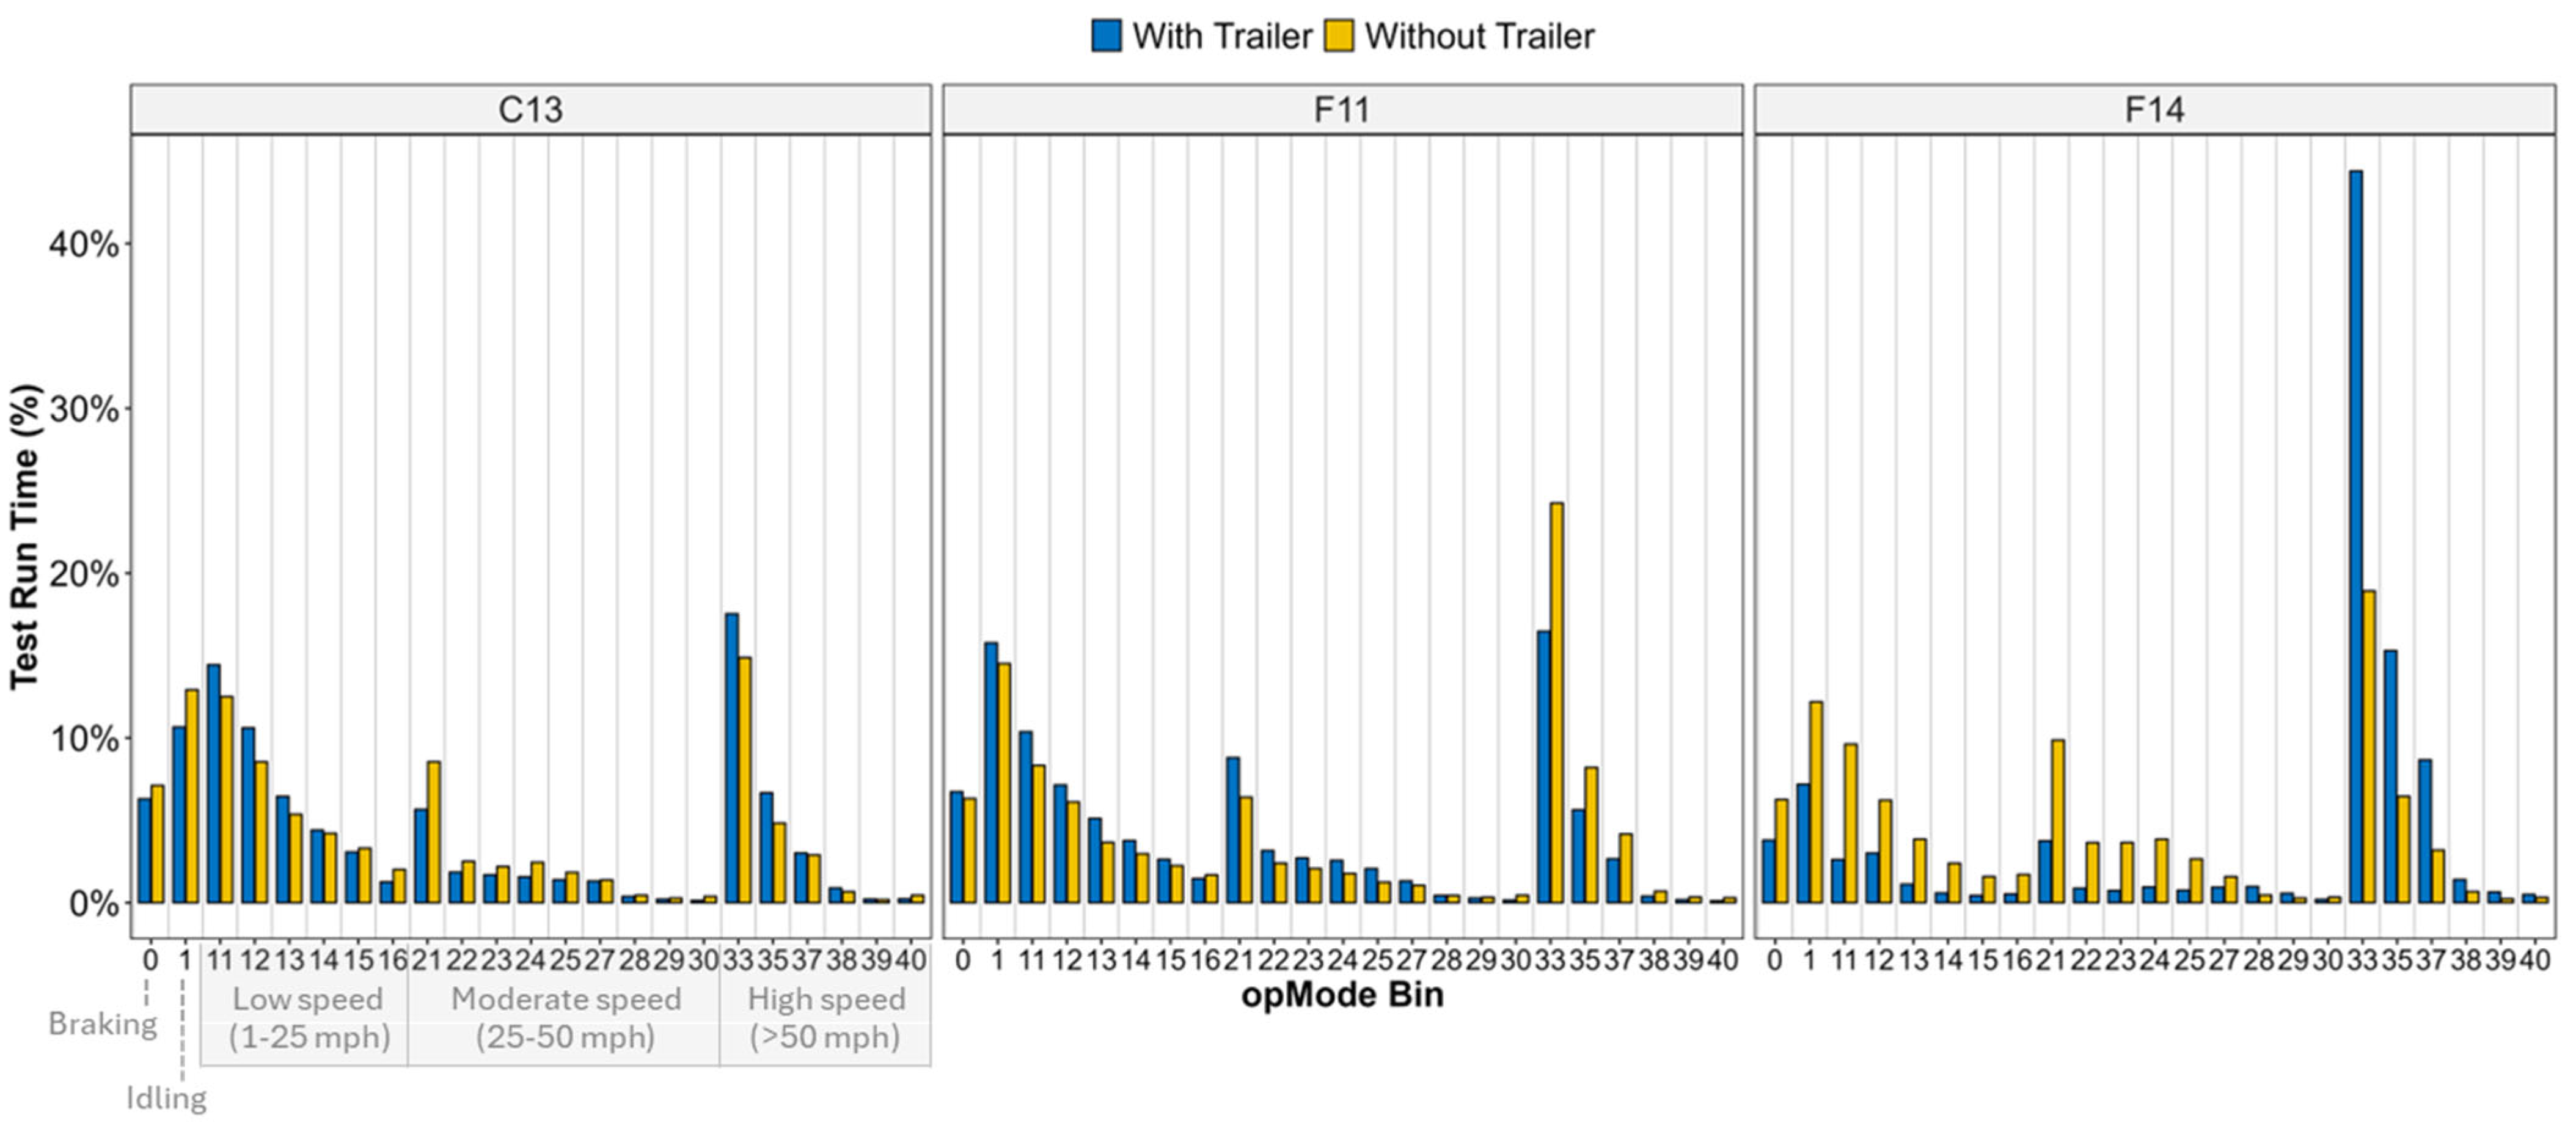
- VSP values were clustered to generate the opmode bins based on MOVES opmode definitions.
- Opmode distributions were calculated by calculating the percent of time spent per bin for each truck with and without trailers in tow.
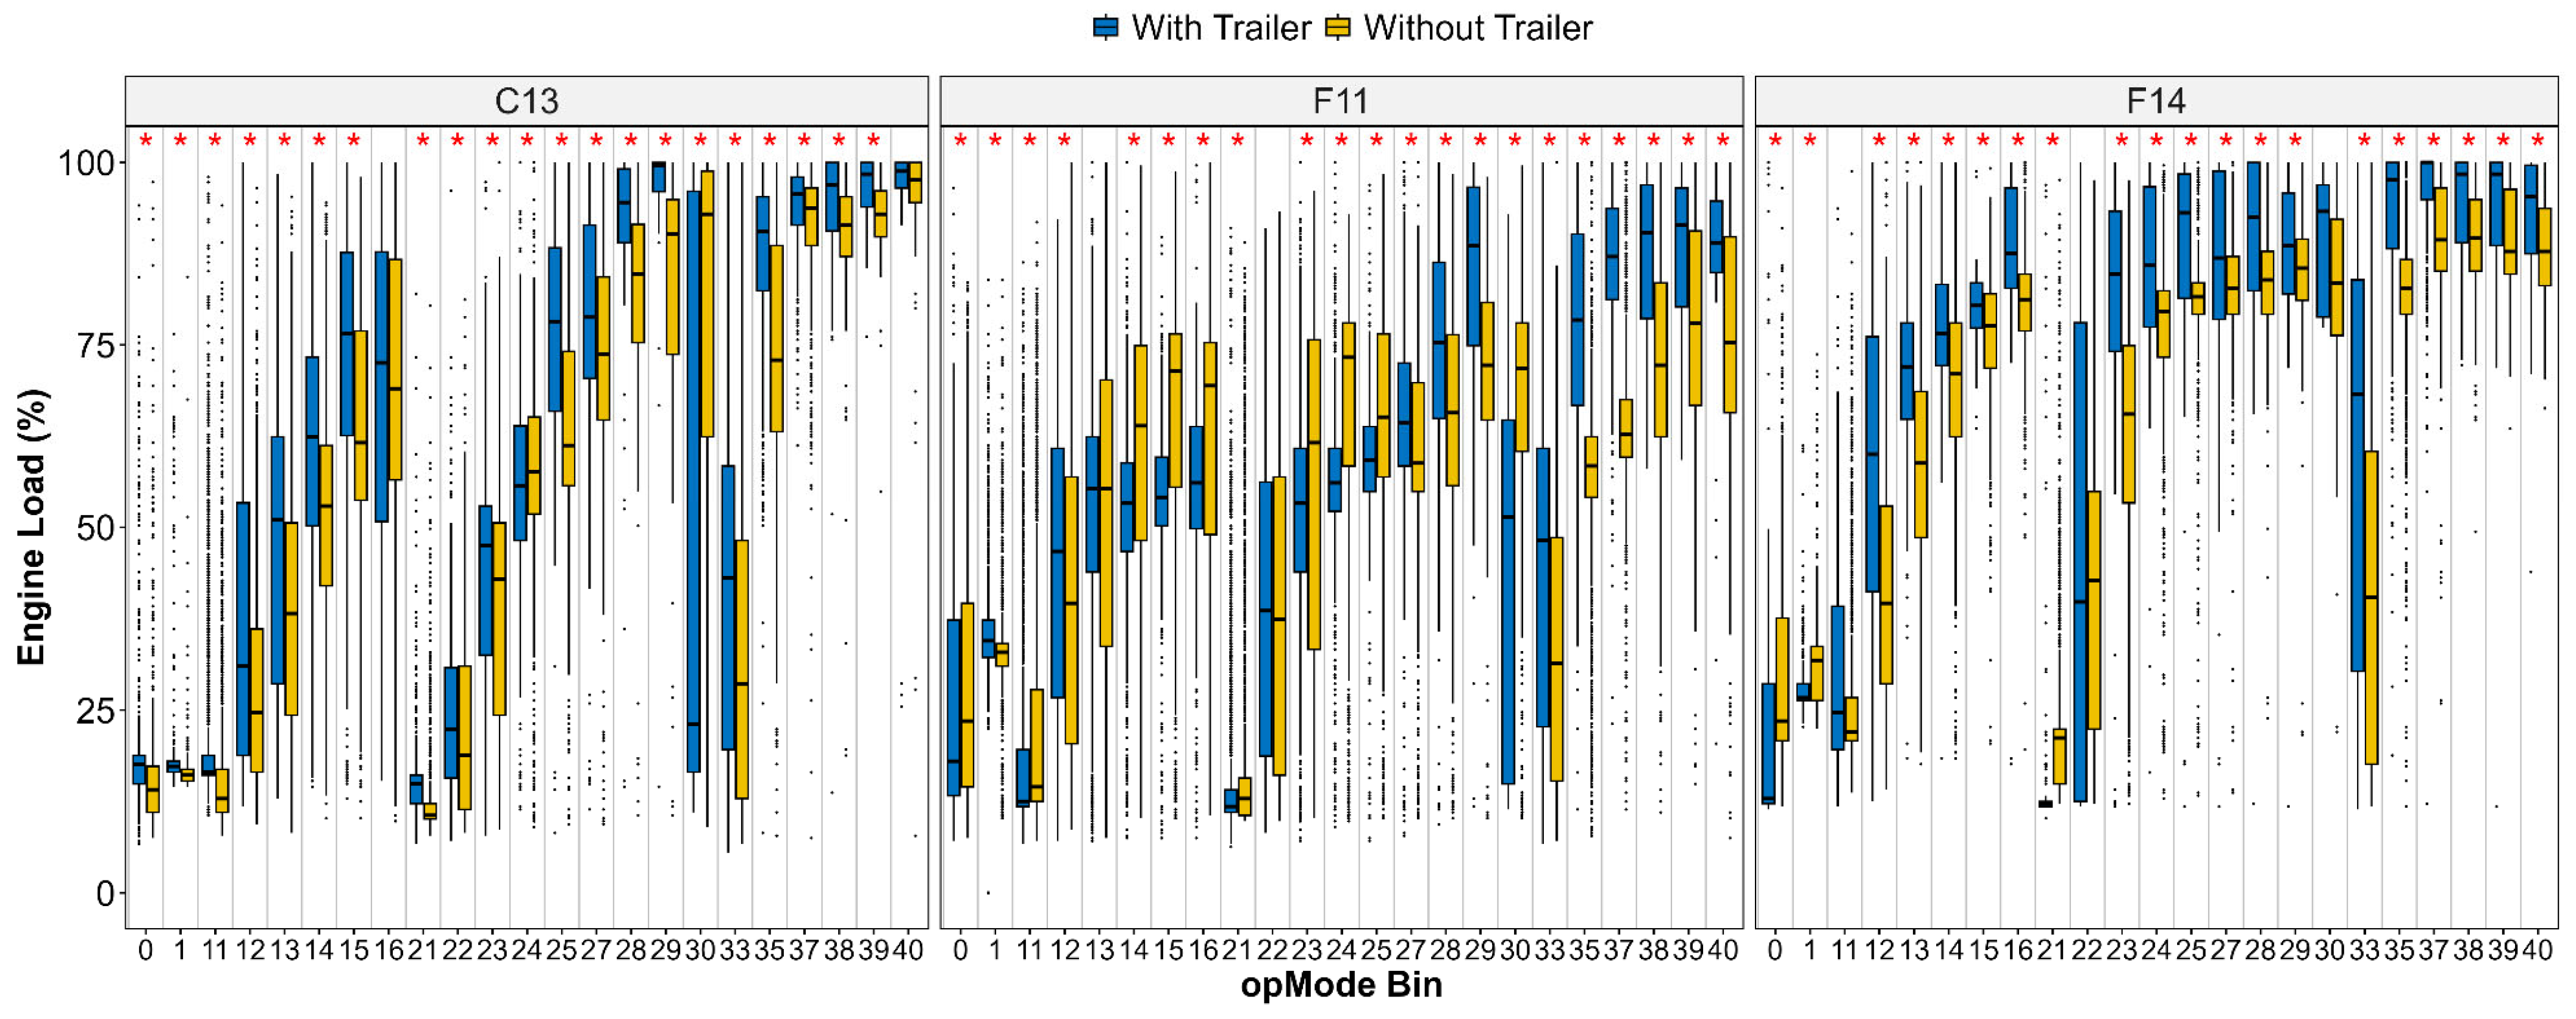
- Shapiro–Wilk tests were used to assess the normality of the data at different operating modes to determine the appropriate way to compare the distributions between the towing operations of the trucks.
- As data was found to be nonparametric, Mann–Whitney U tests were used to evaluate significant distinctions between “with trailer” vs. “without trailer” groups per opmode bin at the 0.05 significance level (p < 0.05).
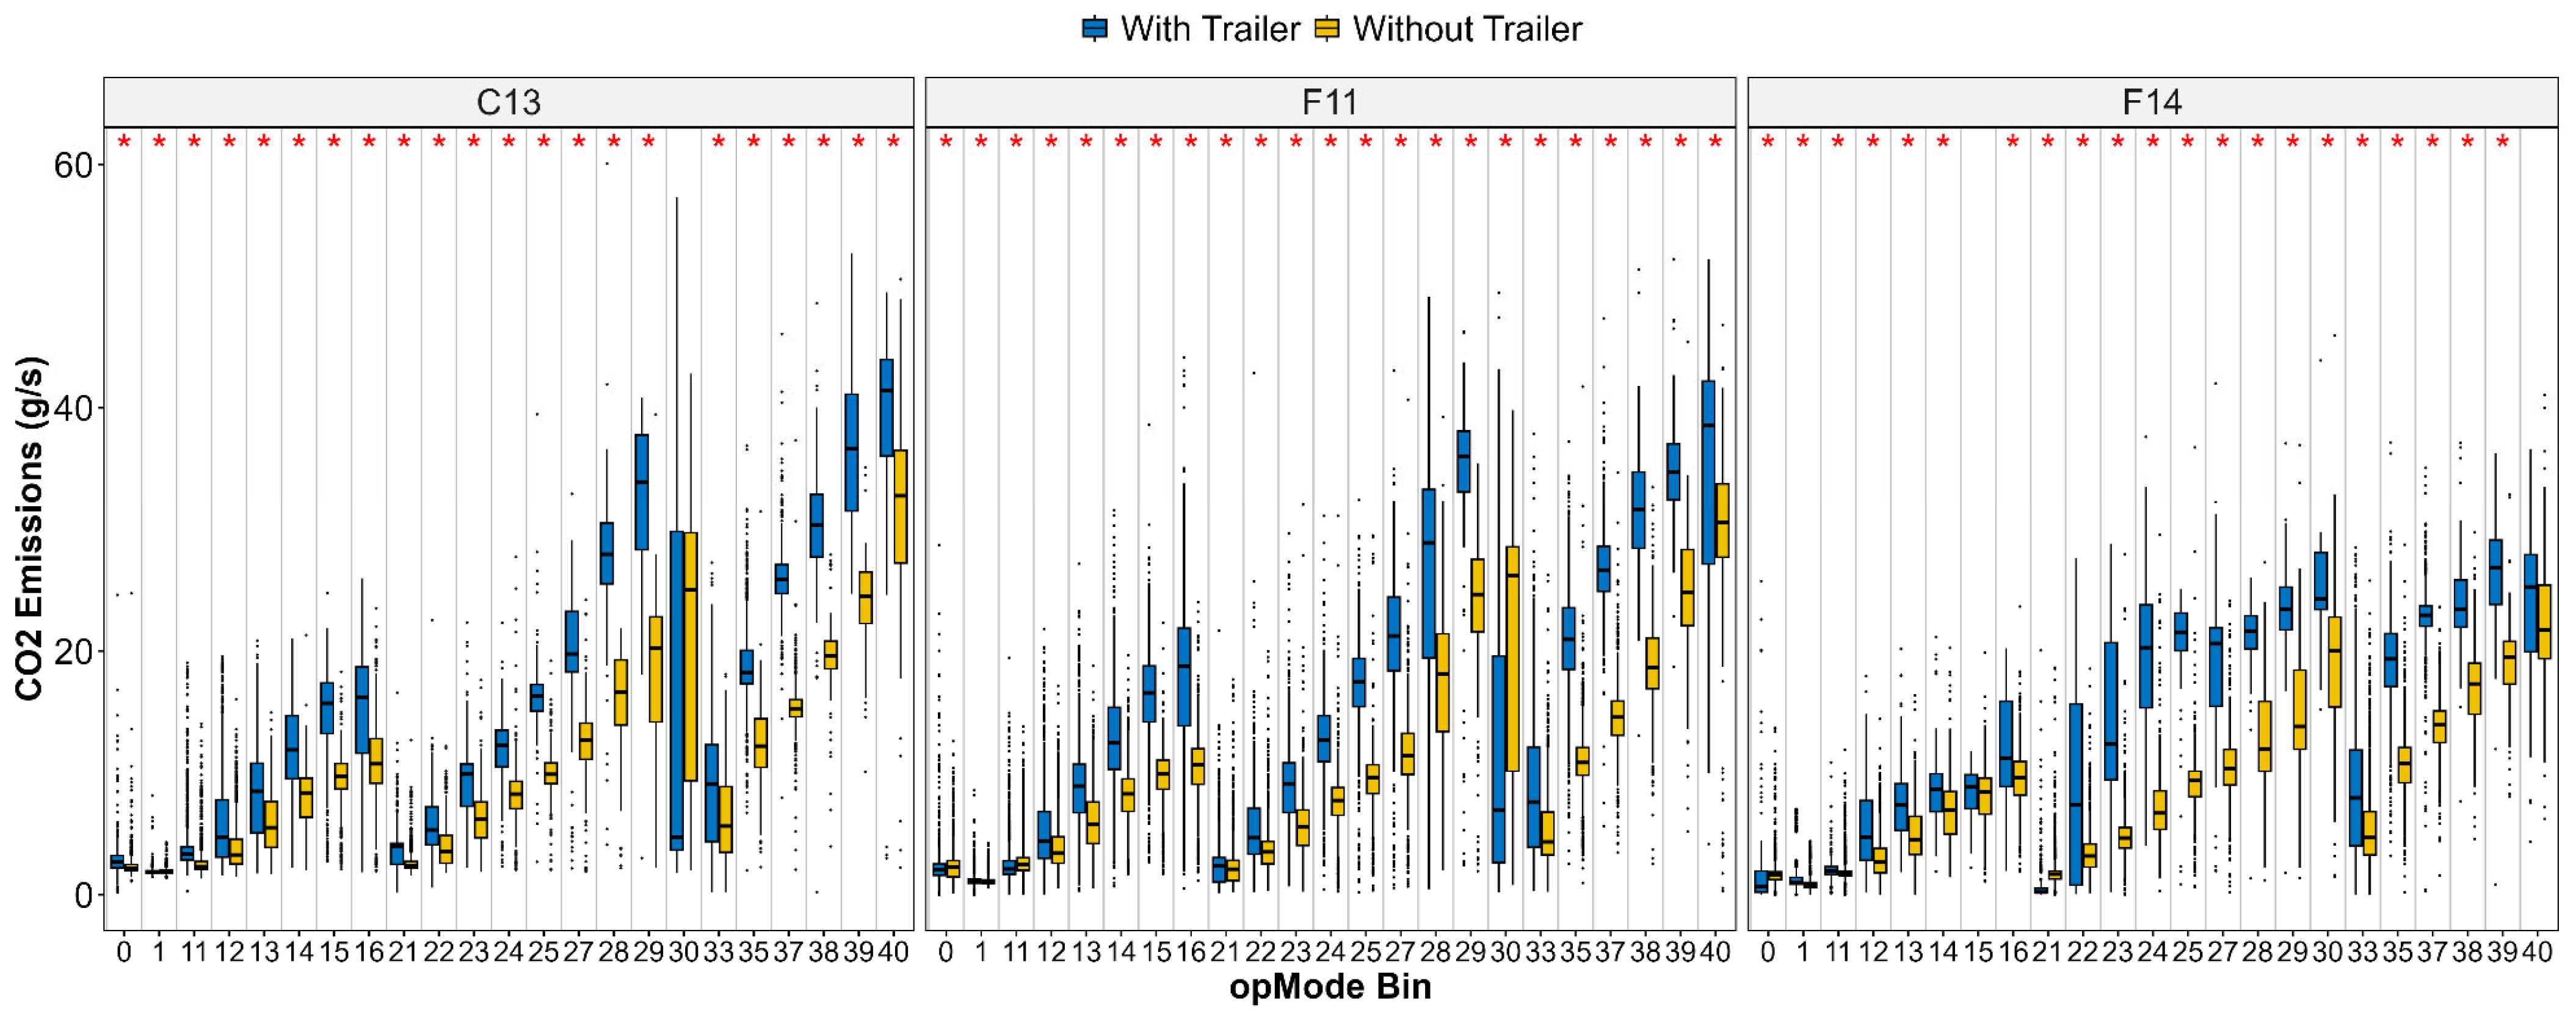
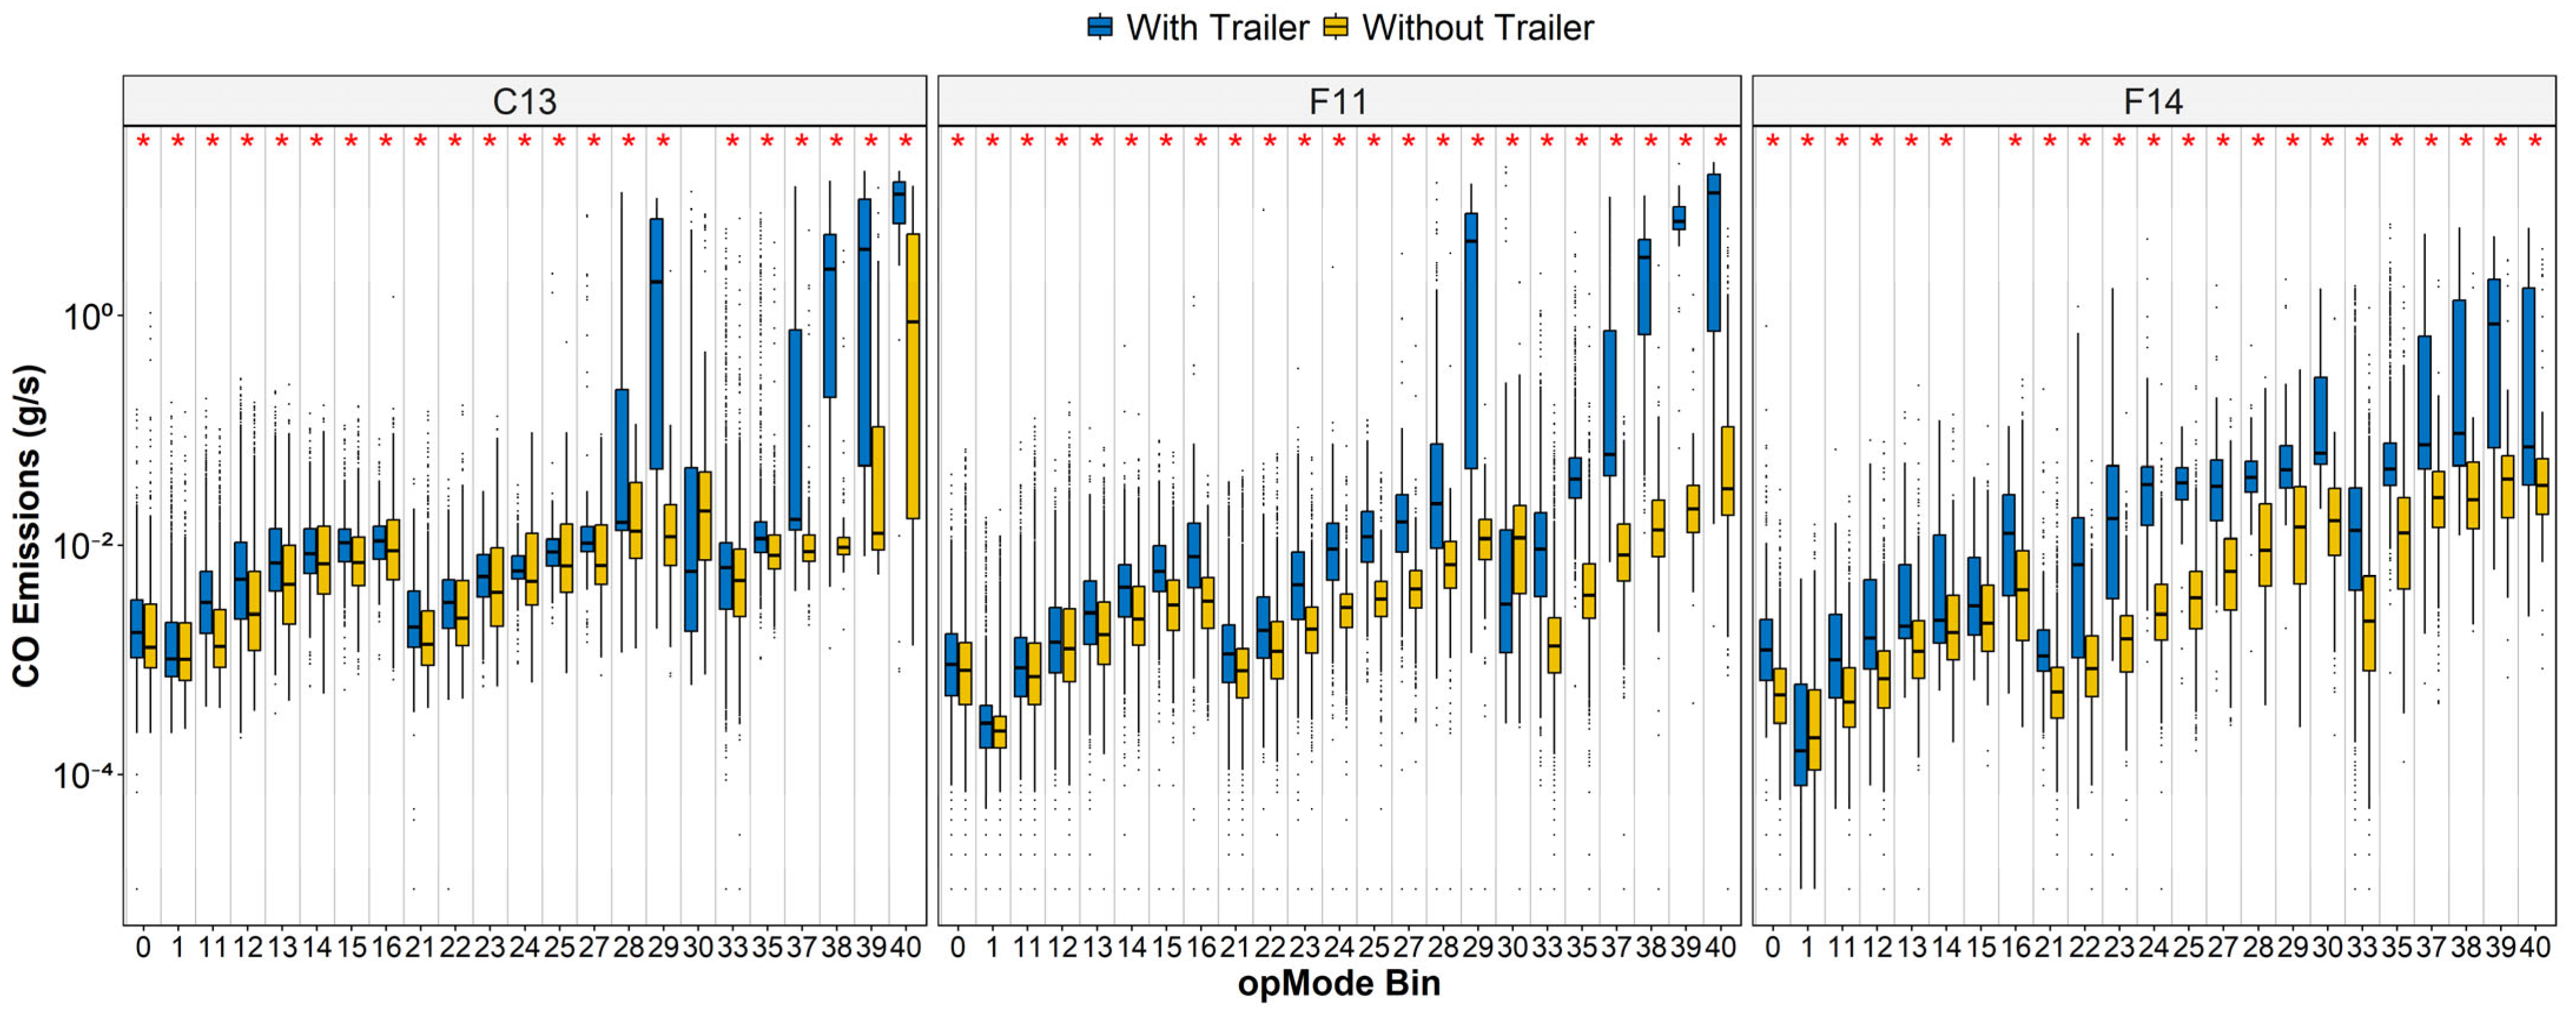
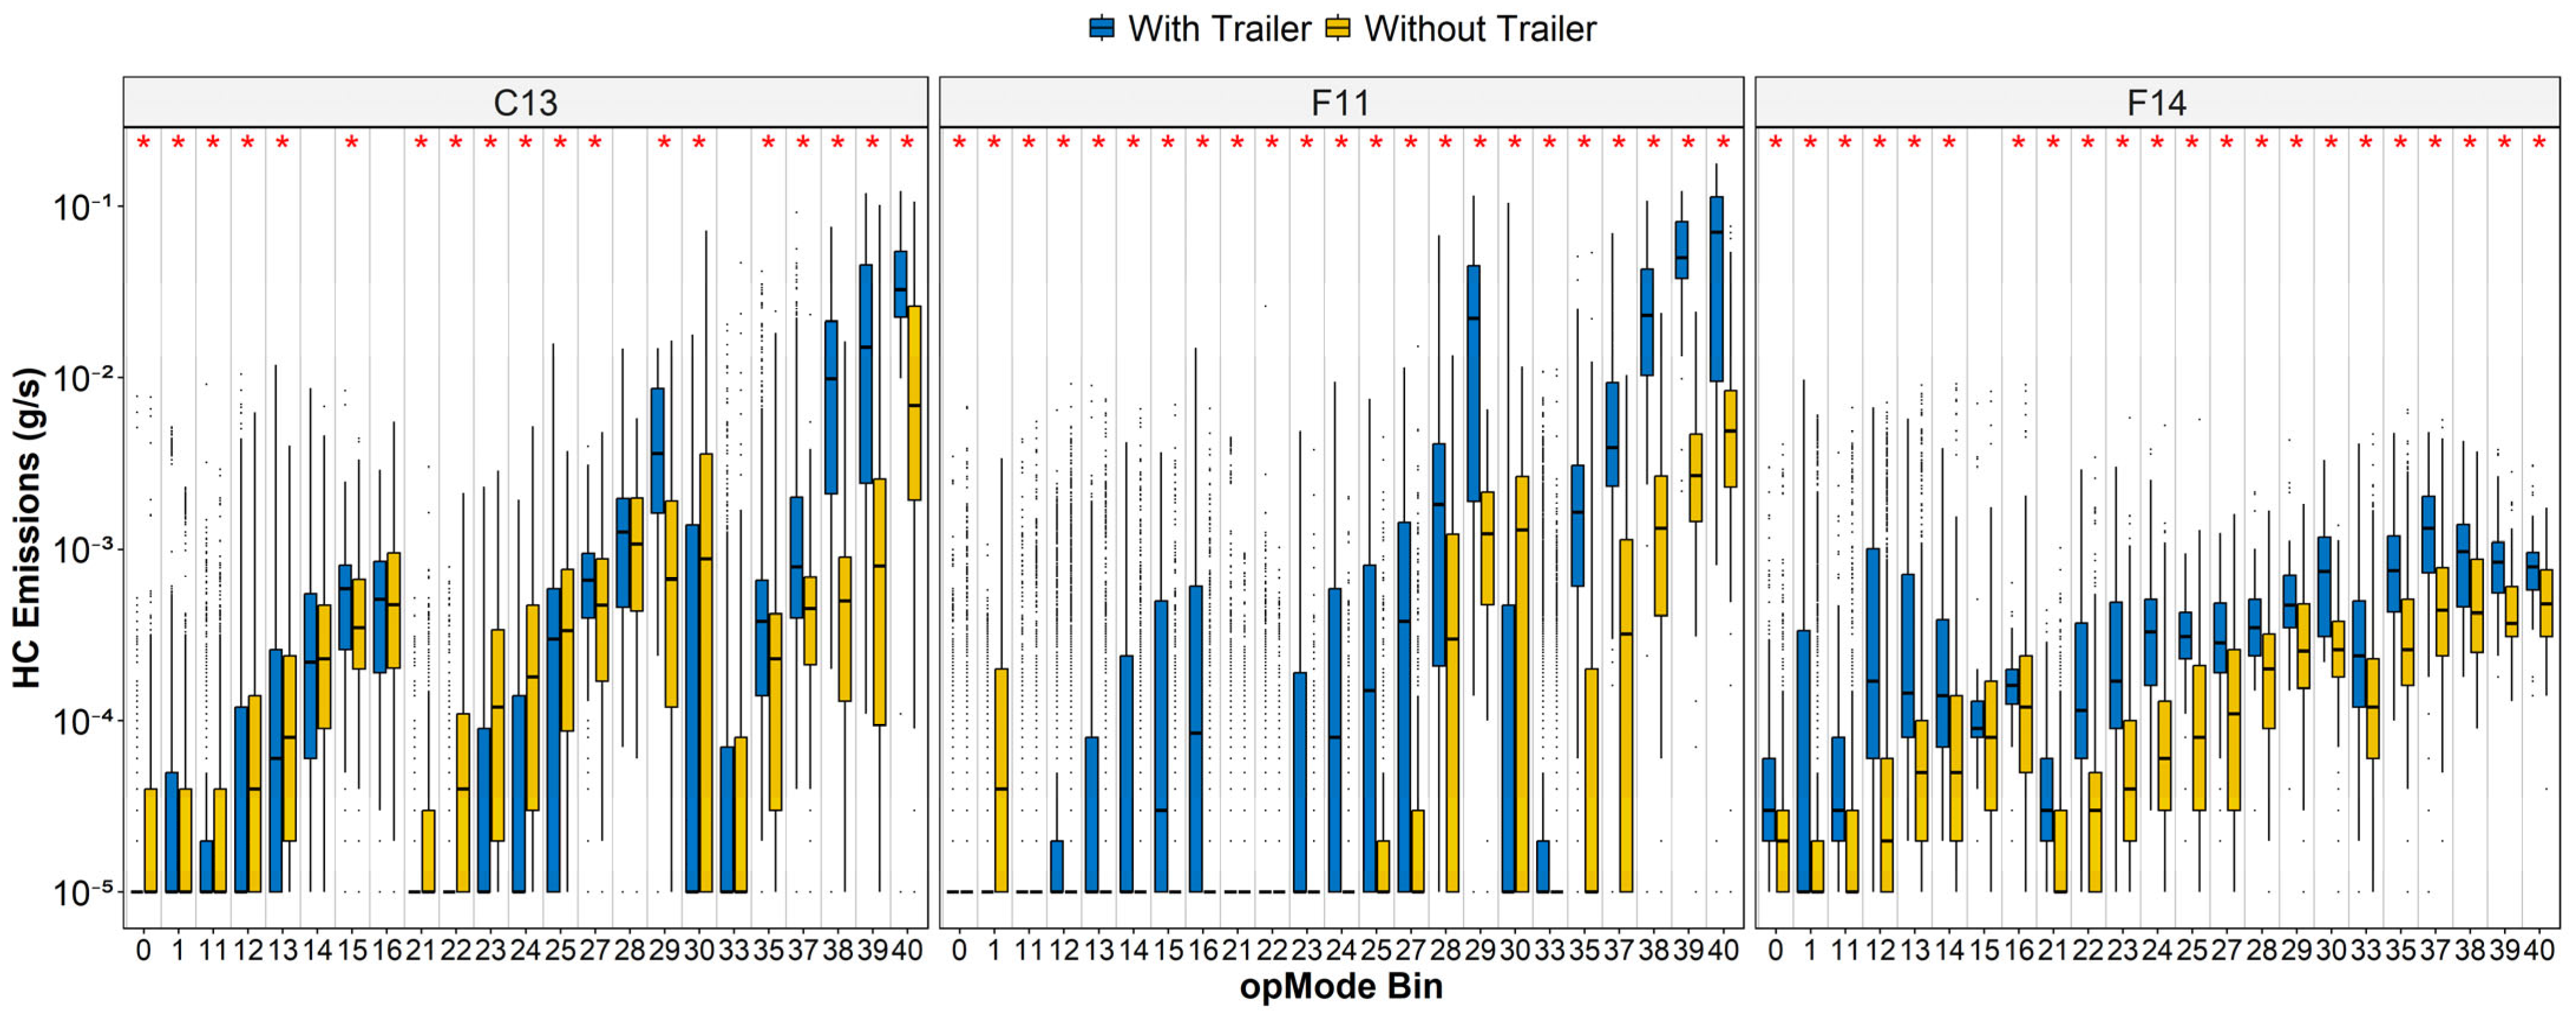
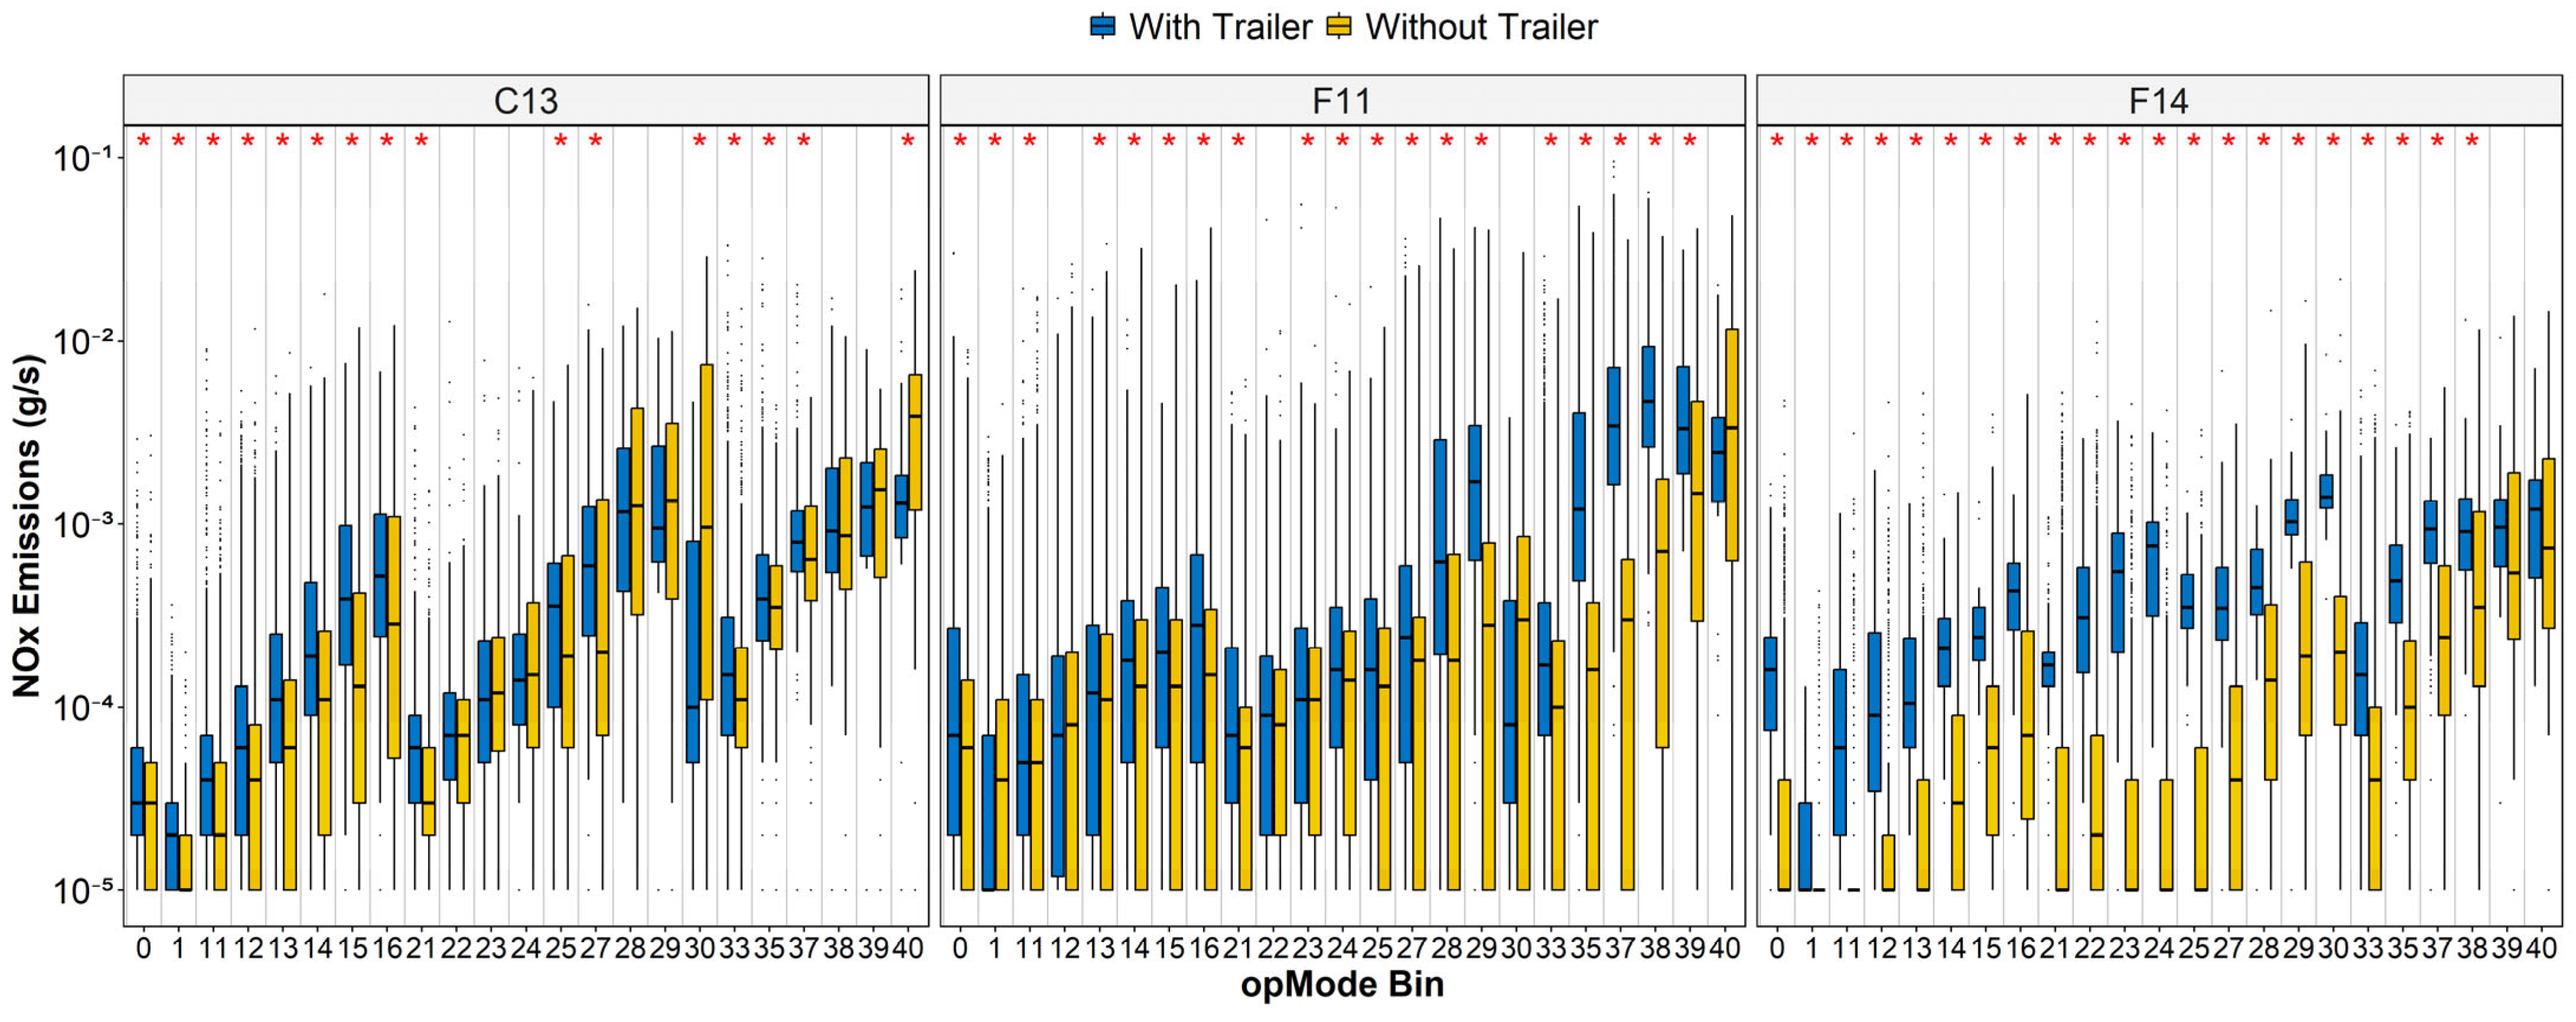
- Finally, the instantaneous emission rate distributions were plotted by opmode bin, with significant distinctions (between with vs. without trailer groups) denoted by “*” to permit visual comparison of towing operations between the three trucks.
3. Results and Discussion
3.1. Comparison of with vs. Without Trailer Towing
3.1.1. Opmode and Engine Load Distributions
3.1.2. Percent Differences in Emission Rates
3.1.3. Instantaneous Emission Rate Distributions
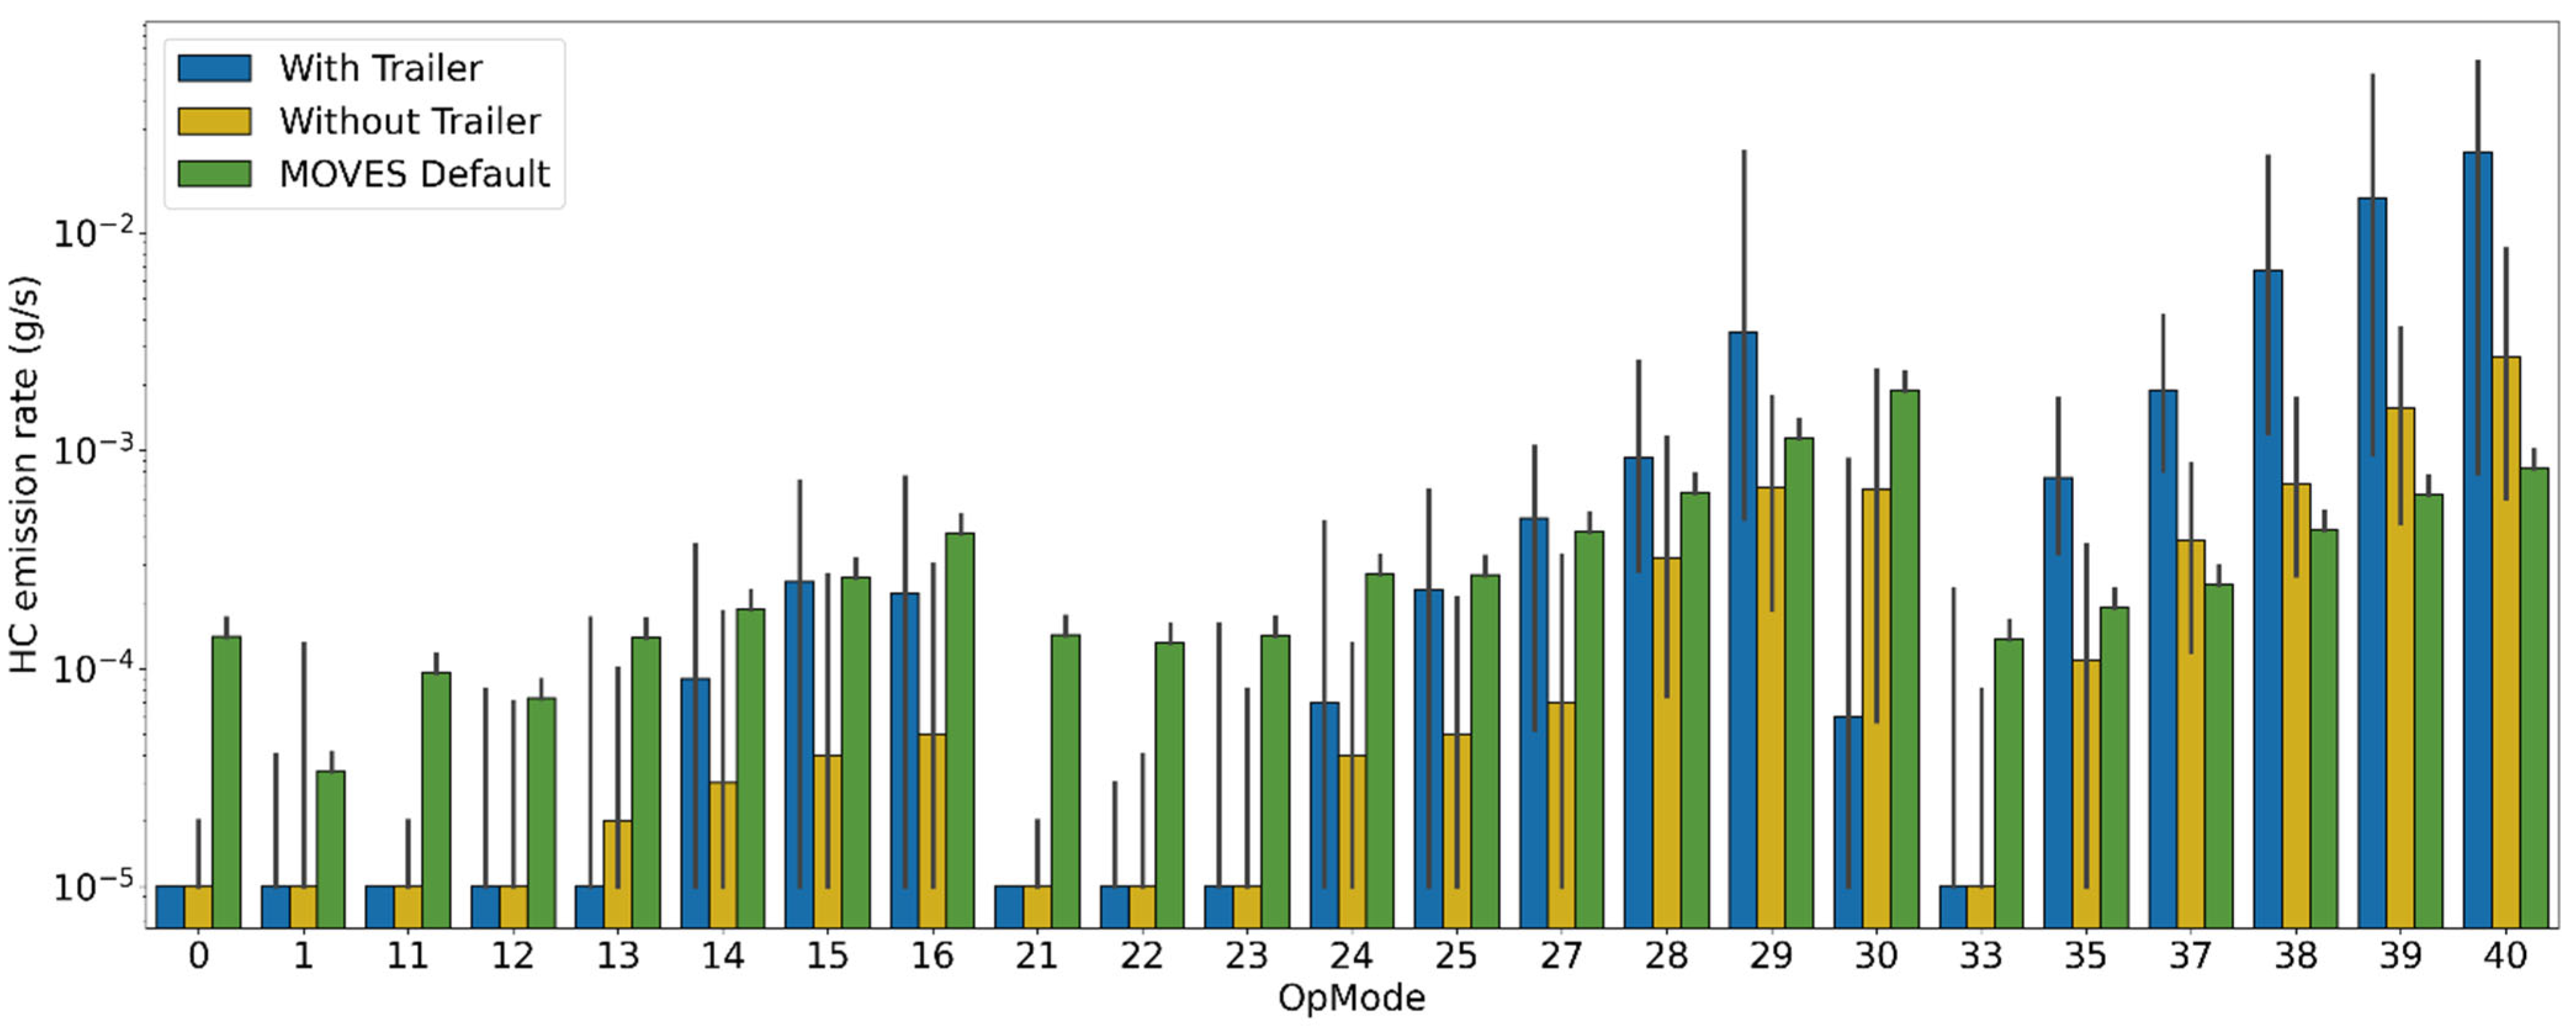
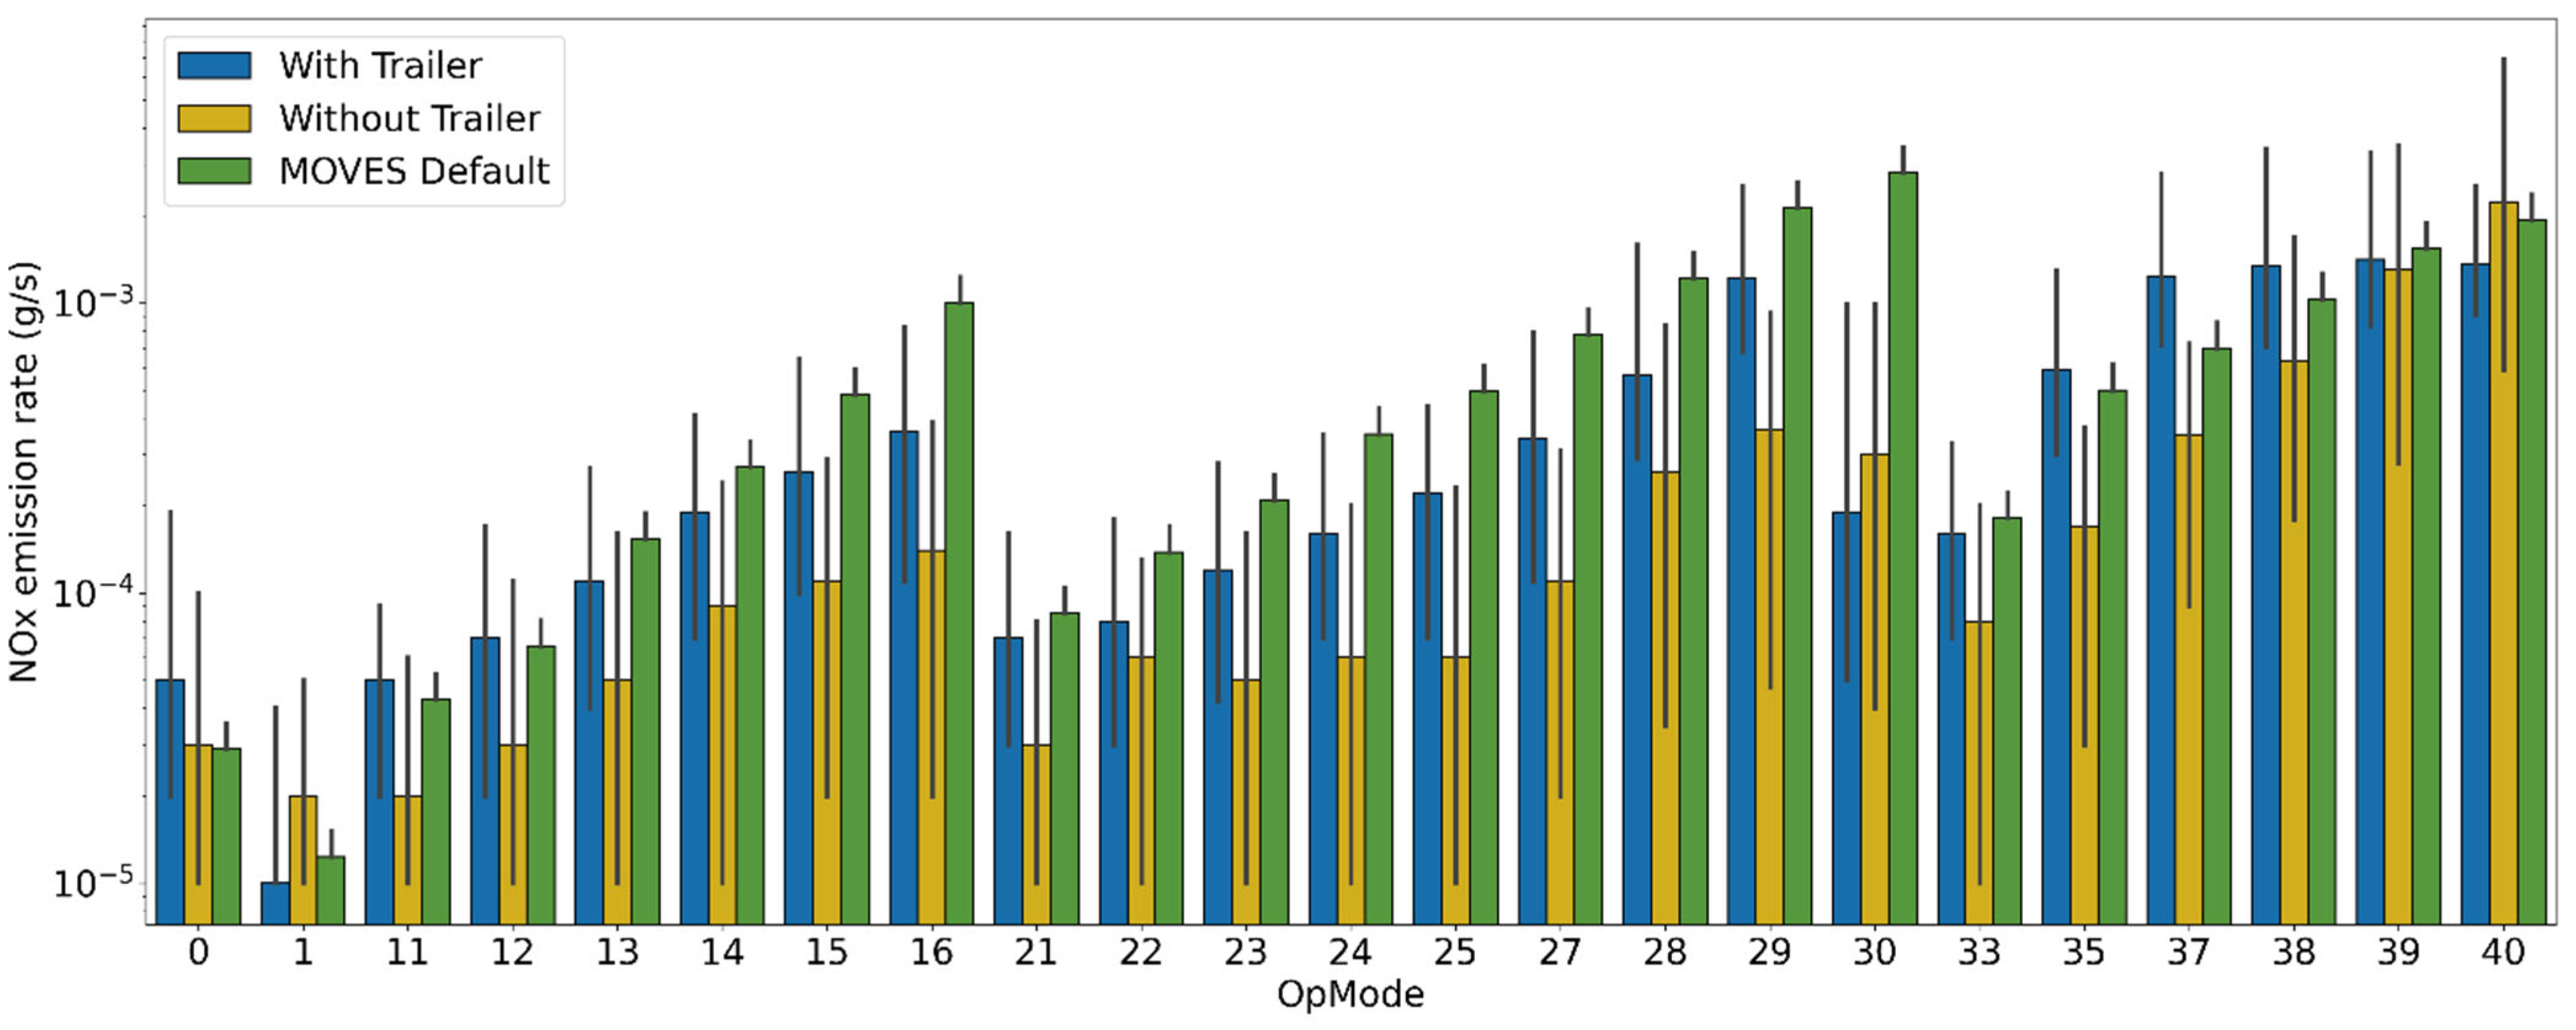
3.2. Comparison to MOVES Base Emission Rates
4. Conclusions
Supplementary Materials
Author Contributions
Funding
Institutional Review Board Statement
Informed Consent Statement
Data Availability Statement
Acknowledgments
Conflicts of Interest
Disclaimer Statement
References
- Bureau of Transportation Statistics. New and Used Passenger Car and Light Truck Sales and Leases 2023. Available online: https://www.bts.gov/content/new-and-used-passenger-car-sales-and-leases-thousands-vehicles (accessed on 16 June 2025).
- U.S. Environmental Protection Agency MOVES4. Latest Version of Motor Vehicle Emission Simulator. Available online: https://www.epa.gov/moves/latest-version-motor-vehicle-emission-simulator-moves (accessed on 16 June 2025).
- Smit, R.; Ntziachristos, L.; Boulter, P. Validation of Road Vehicle and Traffic Emission Models—A Review and Meta-Analysis. Atmos. Environ. 2010, 44, 2943–2953. [Google Scholar] [CrossRef]
- Ropkins, K.; Ibarra-Espinosa, S.; Bernard, Y. Vehicle Emissions Measurement and Modeling. In Traffic-Related Air Pollution; Elsevier: Amsterdam, The Netherlands, 2020; pp. 75–109. [Google Scholar]
- Lyu, P.; Wang, P.S.; Liu, Y.; Wang, Y. Review of the Studies on Emission Evaluation Approaches for Operating Vehicles. J. Traffic Transp. Eng. Engl. Ed. 2021, 8, 493–509. [Google Scholar] [CrossRef]
- National Research Council. Modeling Mobile-Source Emissions; National Academies Press: Washington DC, USA, 2020. [Google Scholar]
- Smit, R.; Dia, H.; Morawska, L. Road Traffic Emission and Fuel Consumption Modelling: Trends, New Developments and Future Challenges. In Traffic Related Air Pollution and Internal Combustion Engines; Nova Publishers: New York, NY, USA, 2009; pp. 29–68. ISBN 978-1-60741-145-1. [Google Scholar]
- Bishop, G.A.; Holubowitch, N.E.; Stedman, D.H. Remote Measurements of On-Road Emissions from Heavy-Duty Diesel Vehicles in California; Year 1, 2008; National Renewable Energy Laboratory: Denver, CO, USA, 2009. [Google Scholar]
- John, C.; Friedrich, R.; Staehelin, J.; Schläpfer, K.; Stahel, W.A. Comparison of Emission Factors for Road Traffic from a Tunnel Study (Gubrist Tunnel, Switzerland) and from Emission Modeling. Atmos. Environ. 1999, 33, 3367–3376. [Google Scholar] [CrossRef]
- Geller, M.D.; Sardar, S.B.; Phuleria, H.; Fine, P.M.; Sioutas, C. Measurements of Particle Number and Mass Concentrations and Size Distributions in a Tunnel Environment. Environ. Sci. Technol. 2005, 39, 8653–8663. [Google Scholar] [CrossRef]
- Baldauf, R.; Thoma, E.; Hays, M.; Shores, R.; Kinsey, J.; Gullett, B.; Kimbrough, S.; Isakov, V.; Long, T.; Snow, R.; et al. Traffic and Meteorological Impacts on Near-Road Air Quality: Summary of Methods and Trends from the Raleigh near-Road Study. J. Air Waste Manag. Assoc. 2008, 58, 865–878. [Google Scholar] [CrossRef] [PubMed]
- Moutinho, J.L.; Liang, D.; Golan, R.; Sarnat, S.E.; Weber, R.; Sarnat, J.A.; Russell, A.G. Near-Road Vehicle Emissions Air Quality Monitoring for Exposure Modeling. Atmos. Environ. 2020, 224, 117318. [Google Scholar] [CrossRef] [PubMed]
- Wang, J.M.; Jeong, C.-H.; Hilker, N.; Shairsingh, K.K.; Healy, R.M.; Sofowote, U.; Debosz, J.; Su, Y.; McGaughey, M.; Doerksen, G.; et al. Near-Road Air Pollutant Measurements: Accounting for Inter-Site Variability Using Emission Factors. Environ. Sci. Technol. 2018, 52, 9495–9504. [Google Scholar] [CrossRef]
- Guo, H.; Zhang, Q.; Shi, Y.; Wang, D. On-Road Remote Sensing Measurements and Fuel-Based Motor Vehicle Emission Inventory in Hangzhou, China. Atmos. Environ. 2007, 41, 3095–3107. [Google Scholar] [CrossRef]
- Carslaw, D.C. Evidence of an Increasing NO2/NOx Emissions Ratio from Road Traffic Emissions. Atmos. Environ. 2005, 39, 4793–4802. [Google Scholar] [CrossRef]
- Burgard, D.A.; Bishop, G.A.; Stedman, D.H.; Gessner, V.H.; Daeschlein, C. Remote Sensing of In-Use Heavy-Duty Diesel Trucks. Environ. Sci. Technol. 2006, 40, 6938–6942. [Google Scholar] [CrossRef]
- North, R.J.; Noland, R.B.; Ochieng, W.Y.; Polak, J.W. Modelling of Particulate Matter Mass Emissions from a Light-Duty Diesel Vehicle. Transp. Res. Part Transp. Environ. 2006, 11, 344–357. [Google Scholar] [CrossRef]
- Silva, C.; Farias, T.; Frey, H.C.; Rouphail, N.M. Evaluation of Numerical Models for Simulation of Real-World Hot-Stabilized Fuel Consumption and Emissions of Gasoline Light-Duty Vehicles. Transp. Res. Part Transp. Environ. 2006, 11, 377–385. [Google Scholar] [CrossRef]
- Gallus, J.; Kirchner, U.; Vogt, R.; Börensen, C.; Benter, T. On-Road Particle Number Measurements Using a Portable Emission Measurement System (PEMS). Atmos. Environ. 2016, 124, 37–45. [Google Scholar] [CrossRef]
- Kousoulidou, M.; Fontaras, G.; Ntziachristos, L.; Bonnel, P.; Samaras, Z.; Dilara, P. Use of Portable Emissions Measurement System (PEMS) for the Development and Validation of Passenger Car Emission Factors. Atmos. Environ. 2013, 64, 329–338. [Google Scholar] [CrossRef]
- Meena, S.; Singh, S.K. Assessment of Real Driving Emissions from Vehicles Using Portable Emission Measurement Systems: A Systematic Review. Appl. Ecol. Environ. Sci. 2022, 10, 273–280. [Google Scholar]
- Brodrick, C.-J.; Laca, E.A.; Burke, A.F.; Farshchi, M.; Li, L.; Deaton, M. Effect of Vehicle Operation, Weight, and Accessory Use on Emissions from a Modern Heavy-Duty Diesel Truck. Transp. Res. Rec. 2004, 1880, 119–125. [Google Scholar] [CrossRef]
- Frey, H.C.; Rouphail, N.M.; Zhai, H. Link-Based Emission Factors for Heavy-Duty Diesel Trucks Based on Real-World Data. Transp. Res. Rec. 2008, 2058, 23–32. [Google Scholar] [CrossRef]
- Yu, L.; Wang, Z.; Shi, Q. PEMS-Based Approach to Developing and Evaluating Driving Cycles for Air Quality Assessment; Center for Transportation Training and Research, Texas Southern University: Houston, TX, USA, 2010. [Google Scholar]
- Mahesh, S.; Ramadurai, G. Effect of Load on Fuel Consumption and Real-World Emissions from Light-Duty Trucks Using Portable Emission Measurement Systems (PEMS). In Proceedings of the Transportation Research Board 97th Annual Meeting, Washington, DC, USA, 7 January 2018–11 January 2018. [Google Scholar]
- Lv, L.; Ge, Y.; Ji, Z.; Tan, J.; Wang, X.; Hao, L.; Wang, Z.; Zhang, M.; Wang, C.; Liu, H. Regulated Emission Characteristics of In-Use LNG and Diesel Semi-Trailer Towing Vehicles under Real Driving Conditions Using PEMS. J. Environ. Sci. 2020, 88, 155–164. [Google Scholar] [CrossRef] [PubMed]
- Song, J.; He, L.; Hu, J.; Hu, K.; Du, Q.; Zu, L.; Bao, X. Actual Road Emission Characteristics of China II Heavy Duty Diesel Trucks under Different Load Conditions. Environ. Pollut. Control 2019, 41, 34–40. [Google Scholar] [CrossRef]
- Wang, X.; Song, G.; Zhai, Z.; Wu, Y.; Yin, H.; Yu, L. Effects of Vehicle Load on Emissions of Heavy-Duty Diesel Trucks: A Study Based on Real-World Data. Int. J. Environ. Res. Public Health 2021, 18, 3877. [Google Scholar] [CrossRef]
- Jimenez-Palacios, J.L. Understanding and Quantifying Motor Vehicle Emissions with Vehicle Specific Power and TILDAS Remote Sensing. Ph.D. Thesis, Massachusetts Institute of Technology, Cambridge, MA, USA, 1998. [Google Scholar]
- U.S. Environmental Protection Agency. What Is Vehicle Specific Power (VSP)? Available online: https://www.epa.gov/moves/what-vehicle-specific-power-vsp (accessed on 16 June 2025).
- Song, G.; Yu, L.; Tu, Z. Distribution Characteristics of Vehicle-Specific Power on Urban Restricted-Access Roadways. J. Transp. Eng. 2012, 138, 202–209. [Google Scholar] [CrossRef]
- Chong, H.S.; Kwon, S.; Lim, Y.; Lee, J. Real-World Fuel Consumption, Gaseous Pollutants, and CO2 Emission of Light-Duty Diesel Vehicles. Sustain. Cities Soc. 2020, 53, 101925. [Google Scholar] [CrossRef]
- Ng, E.C.; Huang, Y.; Hong, G.; Zhou, J.L.; Surawski, N.C. Reducing Vehicle Fuel Consumption and Exhaust Emissions from the Application of a Green-Safety Device under Real Driving. Sci. Total Environ. 2021, 793, 148602. [Google Scholar] [CrossRef]
- Zhai, Z.; Tu, R.; Xu, J.; Wang, A.; Hatzopoulou, M. Capturing the Variability in Instantaneous Vehicle Emissions Based on Field Test Data. Atmosphere 2020, 11, 765. [Google Scholar] [CrossRef]
- Zhang, L.; Lin, J.; Qiu, R. Characterizing the Toxic Gaseous Emissions of Gasoline and Diesel Vehicles Based on a Real-World on-Road Investigation. J. Clean. Prod. 2021, 286, 124957. [Google Scholar] [CrossRef]
- Lai, J.; Yu, L.; Song, G.; Guo, P.; Chen, X. Development of City-Specific Driving Cycles for Transit Buses Based on VSP Distributions: Case of Beijing. J. Transp. Eng. 2013, 139, 749–757. [Google Scholar] [CrossRef]
- Rosero, F.; Fonseca, N.; López, J.-M.; Casanova, J. Effects of Passenger Load, Road Grade, and Congestion Level on Real-World Fuel Consumption and Emissions from Compressed Natural Gas and Diesel Urban Buses. Appl. Energy 2021, 282, 116195. [Google Scholar] [CrossRef]
- Rosero, F.; Fonseca, N.; López, J.-M.; Casanova, J. Real-World Fuel Efficiency and Emissions from an Urban Diesel Bus Engine under Transient Operating Conditions. Appl. Energy 2020, 261, 114442. [Google Scholar] [CrossRef]
- Zhang, S.; Yu, L.; Song, G. Emissions Characteristics for Heavy-Duty Diesel Trucks under Different Loads Based on Vehicle-Specific Power. Transp. Res. Rec. 2017, 2627, 77–85. [Google Scholar] [CrossRef]
- Dhital, N.B.; Wang, S.-X.; Lee, C.-H.; Su, J.; Tsai, M.-Y.; Jhou, Y.-J.; Yang, H.-H. Effects of Driving Behavior on Real-World Emissions of Particulate Matter, Gaseous Pollutants and Particle-Bound PAHs for Diesel Trucks. Environ. Pollut. 2021, 286, 117292. [Google Scholar] [CrossRef]
- He, L.; Zhang, S.; Hu, J.; Li, Z.; Zheng, X.; Cao, Y.; Xu, G.; Yan, M.; Wu, Y. On-Road Emission Measurements of Reactive Nitrogen Compounds from Heavy-Duty Diesel Trucks in China. Environ. Pollut. 2020, 262, 114280. [Google Scholar] [CrossRef] [PubMed]
- Code of Federal Regulation 40 CFR §1065 Subpart J—Field Testing and Portable Emission Measurement Systems. Available online: https://www.ecfr.gov/current/title-40/part-1065/subpart-J (accessed on 9 May 2025).
- SEMTECH SEMTECH DS+ for Light Duty—Gaseous and Exhaust Flow Analyzer. Available online: https://sensors-inc.com/Products/SEMTECH/DS_Plus_Light_Duty (accessed on 16 June 2025).
- U.S. Geological Survey. What Is Lidar Data and Where Can I Download It? Available online: https://www.usgs.gov/faqs/what-lidar-data-and-where-can-i-download-it#faq (accessed on 16 June 2025).
- North Carolina Spatial Data Download. Available online: https://sdd.nc.gov/DataDownload.aspx (accessed on 16 June 2025).
- U.S. Environmental Protection Agency. Exhaust Emission Rates for Light-Duty Onroad Vehicles in MOVES4; U.S. Environmental Protection Agency: Washington, DC, USA, 2023. [Google Scholar]


| Vehicle Specifications | “C13” 2013 Chevy Silverado | “F11” 2011 Ford F150 | “F14” 2014 Ford F150 |
|---|---|---|---|
| Engine size (liters) | 5.3 | 3.5 | 3.7 |
| Number of cylinders | 8 | 6 | 6 |
| Fuel injection | Port fuel injection (PFI) | Gasoline direct injection (GDI) | Port fuel injection (PFI) |
| Horsepower (hp) | 315 @ 5200 rpm | 365 @ 5500 rpm | 302 @ 6500 rpm |
| Torque (lb-ft) | 335 @ 4000 rpm | 420 @ 2500 rpm | 278 @ 4000 rpm |
| GVWR (lbs) | 7000 | 7650 | 6900 |
| GCWR (lbs) | 11,500 | 14,000 | 11,700 |
| Test weight without trailer (lbs) | 6283 | 6345 | 6150 |
| Test weight with trailer (lbs) | 10,795 | 10,856 | 10,660 |
| Vehicles | Low-Speed Route (0–25 mph) | Mid-Speed Route (25–50 mph) | High-Speed Route (>50 mph) | Total (All Routes) |
|---|---|---|---|---|
| Chevy 2013, PFI (“C13”) | No trailer: 2 runs With trailer: 2 runs | No trailer: 2 runs With trailer: 1 runs | No trailer: 2 runs With trailer: 2 runs | No trailer: 6 runs With trailer: 5 runs |
| Ford 2011, GDI (“F11”) | No trailer: 3 runs With trailer: 2 runs | No trailer: 3 runs With trailer: 3 runs | No trailer: 7 runs With trailer: 4 runs | No trailer: 13 runs With trailer: 9 runs |
| Ford 2014, PFI (“F14”) | No trailer: 2 runs With trailer: 2 runs | No trailer: 3 runs With trailer: 2 runs | No trailer: 4 runs With trailer: 4 runs | No trailer: 9 runs With trailer: 8 runs |
| Identifiers | |
|
|
| PEMS Instrument Data | |
|
|
| Engine Control Module Data (from OBD) | |
|
|
| WAAS-Capable GPS Data | |
|
|
| LiDAR Data | |
| |
| Calculated Fields | |
|
|
| Vehicle | Trailer Attached? | A (kW-s/m) | B (kW-s2/m2) | C (kW-s3/m3) | m (metric ton) |
|---|---|---|---|---|---|
| C13 | None | 0.184 | 0 | 9.5 × 10⁻⁵ | 2.85 |
| C13 | With trailer | 0.342 | 0 | 2.1 × 10⁻⁴ | 4.90 |
| F11 | None | 0.176 | 0 | 1.2 × 10⁻⁴ | 2.88 |
| F11 | With trailer | 0.260 | 0 | 2.2 × 10⁻⁴ | 4.92 |
| F14 | None | 0.176 | 0 | 1.2 × 10⁻⁴ | 2.79 |
| F14 | With trailer | 0.288 | 0 | 2.4 × 10⁻⁴ | 4.84 |
| Opmode Bin | Vehicle Specific Power, VSP, (kW/metric ton) | Description | Acceleration, a, (m/s2) | Speed Class |
|---|---|---|---|---|
| 0 | Deceleration/braking | at ≤ −2.0 or (at−1 < −1.0 and at−2 < −1.0 and at−3 < −1.0) | Braking | |
| 1 | Idle | Not moving | ||
| 11 | VSP <0 | Coast (low speed) | 1–25 (mph) | |
| 12 | 0 ≤ VSP < 3 | Cruise/acceleration | ||
| 13 | 3 ≤ VSP < 6 | |||
| 14 | 6 ≤ VSP < 9 | |||
| 15 | 9 ≤ VSP < 12 | |||
| 16 | 12 ≤ VSP | |||
| 21 | VSP < 0 | Coast (moderate speed) | 25–50 (mph) | |
| 22 | 0 ≤ VSP < 3 | Cruise/acceleration | ||
| 23 | 3 ≤ VSP < 6 | |||
| 24 | 6 ≤ VSP < 9 | |||
| 25 | 9 ≤ VSP < 12 | |||
| 27 | 12 ≤ VSP < 18 | |||
| 28 | 18 ≤ VSP < 24 | |||
| 29 | 24 ≤ VSP < 30 | |||
| 30 | 30 ≤ VSP | |||
| 33 | VSP < 6 | Cruise/acceleration | 50+ (mph) | |
| 35 | 6 ≤ VSP < 12 | |||
| 37 | 12 ≤ VSP < 18 | |||
| 38 | 18 ≤ VSP < 24 | |||
| 39 | 24 ≤ VSP < 30 | |||
| 40 | 30 ≤ VSP |
| MOVES Parameter | Selected Values |
|---|---|
| Fuel type | 1 (gasoline) |
| regClass | 30 (light-duty trucks) |
| Model year | 2011, 2013, and 2014 |
| ageGroup ID | 3 |
| Pollutants | CO, NOx, and THC |
| Opmode Bin | CO2 | CO | NOx | HC | ||||||||
|---|---|---|---|---|---|---|---|---|---|---|---|---|
| C13 | F11 | F14 | C13 | F11 | F14 | C13 | F11 | F14 | C13 | F11 | F14 | |
| 0 | 20% | −10% | −88% | 29% | 12% | 85% | 0% | 15% | 176% | 0% | 0% | 40% |
| 1 | −1% | 8% | 26% | 1% | 15% | −27% | 67% | −120% | 0% | 0% | −120% | 0% |
| 11 | 37% | −16% | 11% | 83% | 18% | 80% | 67% | 0% | 143% | 0% | 0% | 100% |
| 12 | 37% | 25% | 55% | 67% | 13% | 78% | 40% | −13% | 160% | −120% | 0% | 158% |
| 13 | 43% | 42% | 48% | 42% | 43% | 50% | 59% | 9% | 165% | −29% | 0% | 97% |
| 14 | 35% | 41% | 22% | 21% | 61% | 25% | 53% | 32% | 150% | −4% | 0% | 95% |
| 15 | 47% | 51% | 5% | 40% | 64% | 34% | 100% | 42% | 120% | 51% | 100% | 12% |
| 16 | 41% | 55% | 15% | 19% | 84% | 102% | 58% | 60% | 144% | 7% | 158% | 29% |
| 21 | 49% | 11% | −157% | 34% | 34% | 68% | 67% | 15% | 178% | 0% | 0% | 100% |
| 22 | 40% | 28% | 80% | 31% | 41% | 156% | 0% | 12% | 176% | −120% | 0% | 117% |
| 23 | 46% | 48% | 91% | 31% | 84% | 167% | −9% | 0% | 193% | −169% | 0% | 124% |
| 24 | 39% | 49% | 101% | 21% | 106% | 172% | −7% | 13% | 195% | −179% | 156% | 138% |
| 25 | 49% | 58% | 79% | 28% | 111% | 164% | 61% | 21% | 189% | −11% | 175% | 118% |
| 27 | 44% | 60% | 66% | 45% | 117% | 139% | 99% | 29% | 158% | 34% | 190% | 89% |
| 28 | 51% | 46% | 58% | 18% | 109% | 125% | −8% | 110% | 105% | 15% | 143% | 55% |
| 29 | 50% | 37% | 52% | 198% | 199% | 104% | −34% | 143% | 138% | 138% | 179% | 59% |
| 30 | −137% | −116% | 19% | −108% | −117% | 118% | −162% | −116% | 150% | −196% | −197% | 96% |
| 33 | 47% | 55% | 52% | 25% | 150% | 144% | 31% | 52% | 116% | 0% | 0% | 67% |
| 35 | 40% | 64% | 57% | 33% | 165% | 114% | 11% | 153% | 132% | 49% | 198% | 97% |
| 37 | 52% | 59% | 49% | 61% | 153% | 97% | 22% | 168% | 119% | 55% | 170% | 100% |
| 38 | 43% | 52% | 30% | 198% | 198% | 117% | 6% | 147% | 89% | 181% | 178% | 78% |
| 39 | 40% | 33% | 32% | 199% | 199% | 183% | −22% | 77% | 56% | 180% | 180% | 78% |
| 40 | 23% | 23% | 15% | 170% | 199% | 74% | −100% | −31% | 48% | 130% | 174% | 49% |
Disclaimer/Publisher’s Note: The statements, opinions and data contained in all publications are solely those of the individual author(s) and contributor(s) and not of MDPI and/or the editor(s). MDPI and/or the editor(s) disclaim responsibility for any injury to people or property resulting from any ideas, methods, instructions or products referred to in the content. |
© 2025 by the authors. Licensee MDPI, Basel, Switzerland. This article is an open access article distributed under the terms and conditions of the Creative Commons Attribution (CC BY) license (https://creativecommons.org/licenses/by/4.0/).
Share and Cite
Kim, B.; Jaikumar, R.; Souza, R.; Xu, M.; Johnson, J.; Fulper, C.R.; Faircloth, J.; Venugopal, M.; Gu, C.; Ramani, T.; et al. Emission Rates for Light-Duty Truck Towing Operations in Real-World Conditions. Atmosphere 2025, 16, 749. https://doi.org/10.3390/atmos16060749
Kim B, Jaikumar R, Souza R, Xu M, Johnson J, Fulper CR, Faircloth J, Venugopal M, Gu C, Ramani T, et al. Emission Rates for Light-Duty Truck Towing Operations in Real-World Conditions. Atmosphere. 2025; 16(6):749. https://doi.org/10.3390/atmos16060749
Chicago/Turabian StyleKim, Bumsik, Rohit Jaikumar, Rodolfo Souza, Minjie Xu, Jeremy Johnson, Carl R. Fulper, James Faircloth, Madhusudhan Venugopal, Chaoyi Gu, Tara Ramani, and et al. 2025. "Emission Rates for Light-Duty Truck Towing Operations in Real-World Conditions" Atmosphere 16, no. 6: 749. https://doi.org/10.3390/atmos16060749
APA StyleKim, B., Jaikumar, R., Souza, R., Xu, M., Johnson, J., Fulper, C. R., Faircloth, J., Venugopal, M., Gu, C., Ramani, T., Aldridge, M., Baldauf, R. W., Fernandez, A., Long, T., Snow, R., Williams, C., Logan, R., & Vreeland, H. (2025). Emission Rates for Light-Duty Truck Towing Operations in Real-World Conditions. Atmosphere, 16(6), 749. https://doi.org/10.3390/atmos16060749