Abstract
Using multi-source precipitation datasets including NASA GPM (IMERG), GPCP, ECMWF ERA5, and station precipitation data from the China Meteorological Administration (CMA), along with ERA5 reanalysis fields for atmospheric circulation analysis, this study investigates the extreme precipitation events during the “Dragon-Boat Precipitation” period from 20 May to 21 June over South China in 2022 using the synoptic diagnostic method. The results indicate that the total precipitation during this period significantly exceeded the climatological average, with multiple large-scale extreme rainfall events characterized by high intensity, extensive coverage, and prolonged duration. The spatial distribution of precipitation exhibited a north-more-south-less pattern, with the maximum rainfall center located in the Nanling Mountains, particularly in the Shaoguan–Qingyuan–Heyuan region of Guangdong Province, where peak precipitation exceeded 1100 mm, and the mean precipitation was approximately 1.7 times the climatology from the GPM data. The average daily precipitation throughout the period was 17.5 mm/day, which was 6 mm/day higher than the climatological mean, while the heaviest rainfall on 13 June reached 39 mm/day above the average, exceeding two standard deviations. The extreme precipitation during the “Dragon-Boat Precipitation” period in 2022 was associated with an anomalous deep East Asian trough, an intensified South Asian High, a stronger-than-usual Western Pacific Subtropical High, an enhanced South Asian monsoon and South China Sea monsoon, and the dominance of a strong Southwesterly Low-Level Jet (SLLJ) over South China. Two major moisture transport pathways were established: one from the Bay of Bengal to South China and another from the South China Sea, with the latter contributing a little higher amount of water vapor transport than the former. The widespread extreme precipitation on 13 June 2022 was triggered by the anomalous atmospheric circulation conditions. In the upper levels, South China was located at the northwestern periphery of the slightly stronger-than-normal Western Pacific Subtropical High, intersecting with the base of a deep trough associated with an anomalous intense Northeast China Cold Vortex (NCCV). At lower levels, the region was positioned along a shear line formed by anomalous southwesterly and northerly winds, where exceptionally strong southwesterly moisture transport, significant moisture convergence, and intense vertical updraft led to the widespread extreme rainfall event on that day.
1. Introduction
From 20 May to 21 June each year, with the onset of the South China Sea monsoon, South China experiences widespread heavy precipitation, a phenomenon known as “Dragon-Boat Precipitation”. During this period, persistent and widespread rainstorms frequently occur, leading to severe hydrometeorological hazards such as the soil erosion and ecological degradation. These extreme precipitation events exert significant impacts on the local hydrological cycle, disrupt ecosystem stability, and pose serious threats to biodiversity and regional ecological security.
Studies by Wu et al. [1,2] and Qin et al. [3] have shown that the intensity and duration of the heavy rain during the “Dragon-Boat Precipitation” period have increased significantly in recent years. Under the influence of climate change [4], the frequency and intensity of the heavy rain events in South China have exhibited a notable upward trend. Particularly, the occurrence of extreme precipitation events in recent years has risen, with the amount of precipitation far exceeding the climatological levels [5,6]. The 2022 “Dragon-Boat Precipitation” rainstorm event in South China was a prominent manifestation of this trend, with the regional average precipitation reached 472.5 mm, ranking the second since 1951. Severe floods impacted the Pearl River Basin, Beijiang River, and Xijiang River, causing 35 fatalities and disappearances and resulting in economic losses exceeding CNY 20 billion [5,7]. The driving mechanisms behind this extreme precipitation event involved the combined effects of multiple climatic factors, particularly the South China Sea monsoon, large-scale atmospheric circulation anomalies, and sea surface temperature (SST) variations [7,8,9,10,11,12].
Hu et al. [13] concluded that the “Dragon-Boat Precipitation” in South China exhibits distinct spatiotemporal characteristics, with significant regional differences in precipitation types. These characteristics [14] are largely influenced by the southwestern monsoon, particularly under the impact of tropical cyclones [15] and low-pressure systems [16], which enhance moisture transport and intensify heavy precipitation events [17,18,19,20]. Recent studies have further explored the complex drivers of the extreme rainstorms during the “Dragon-Boat Precipitation” period in 2022. Wang et al. [19] found that this extreme precipitation event was not only associated with the anomalous atmospheric circulation but also strongly linked to land–sea interactions, particularly sea surface temperature (SST) anomalies and surface air pressure variations, which jointly intensified the precipitation. The occurrence of extreme precipitation is closely tied to the anomalous water vapor transport [21,22,23], with strong southerly winds and southwestern monsoon flows significantly increasing moisture convergence, thereby leading to intensified precipitation [24,25]. The extreme rainstorms in June 2022 were largely driven by the combined effects of strong monsoon winds and enhanced moisture transport. These findings further confirm the critical roles of the monsoon dynamics and water vapor transport in shaping extreme precipitation events. In addition, the role of meridional atmospheric circulation in extreme precipitation cannot be overlooked. Cheng et al. [25] demonstrated that the 2022 heavy precipitation event in South China was closely associated with anomalous circulation patterns in the mid-to-lower troposphere, particularly variations in meridional circulation, which enhanced north–south moisture transport and convective activity, thereby intensifying precipitation. Moreover, Liu et al. [26] revealed that the record-breaking pre-season precipitation in South China during 2022 was primarily influenced by the abnormal warming in the Northeast Pacific and the Maritime Continent, which triggered anomalously persistent heavy rainfall by stimulating intra-seasonal atmospheric oscillations (ISO) and modifying the intensity and positioning of the Northwest Pacific subtropical high.
Meanwhile, Dong et al. [27] analyzed precipitation anomalies during the “Dragon-Boat Precipitation” in 2022 and explored the limitations of meteorological forecasting models in predicting this extreme precipitation event. The results indicate that while meteorological models can identify regional precipitation trends, they exhibit significant errors in predicting specific precipitation amounts and time periods, particularly with respect to the prediction of high-intensity precipitation events. These models fail to account for small changes in atmospheric circulation and the complexity of oceanic conditions.
In this study, we examine the spatiotemporal distribution characteristics of the precipitation during the “Dragon-Boat Precipitation” period in South China in 2022, and investigate the factors contributing to the formation of one of the most intense precipitation events during this period. We aim to provide insights that could inform heavy rainfall forecasting, as well as flood prediction and water resource management during the dragon-boat precipitation period.
2. Data and Methods
This study uses daily precipitation from the NASA Global Precipitation Measurement (GPM) version 07B data set [28], with the covering period from 1998 to 2024, a temporal resolution of 30 min, spatial accuracy of 0.1° × 0.1°, and global coverage from 90° N to 90° S. The GPCP (Global Precipitation Climatology Project) Version 2.3 daily precipitation data [29] from 1998 to 2024, with a spatial resolution of 2.5° × 2.5°, are also used for comparison purpose. The station-based daily precipitation observations are used for further check. The station-based observations are quality-controlled by the National Meteorological Information Center of the China Meteorological Administration (CMA) through climatological limit check and temporal and spatial consistency check [30]. The ECMWF (European Centre for Medium-Range Weather Forecast) atmospheric reanalysis ERA5 [31] data are utilized, including variables such as geopotential height, horizontal wind, relative vorticity, divergence, and vertically integrated moisture fluxes, with a horizontal resolution of 0.25° × 0.25°.
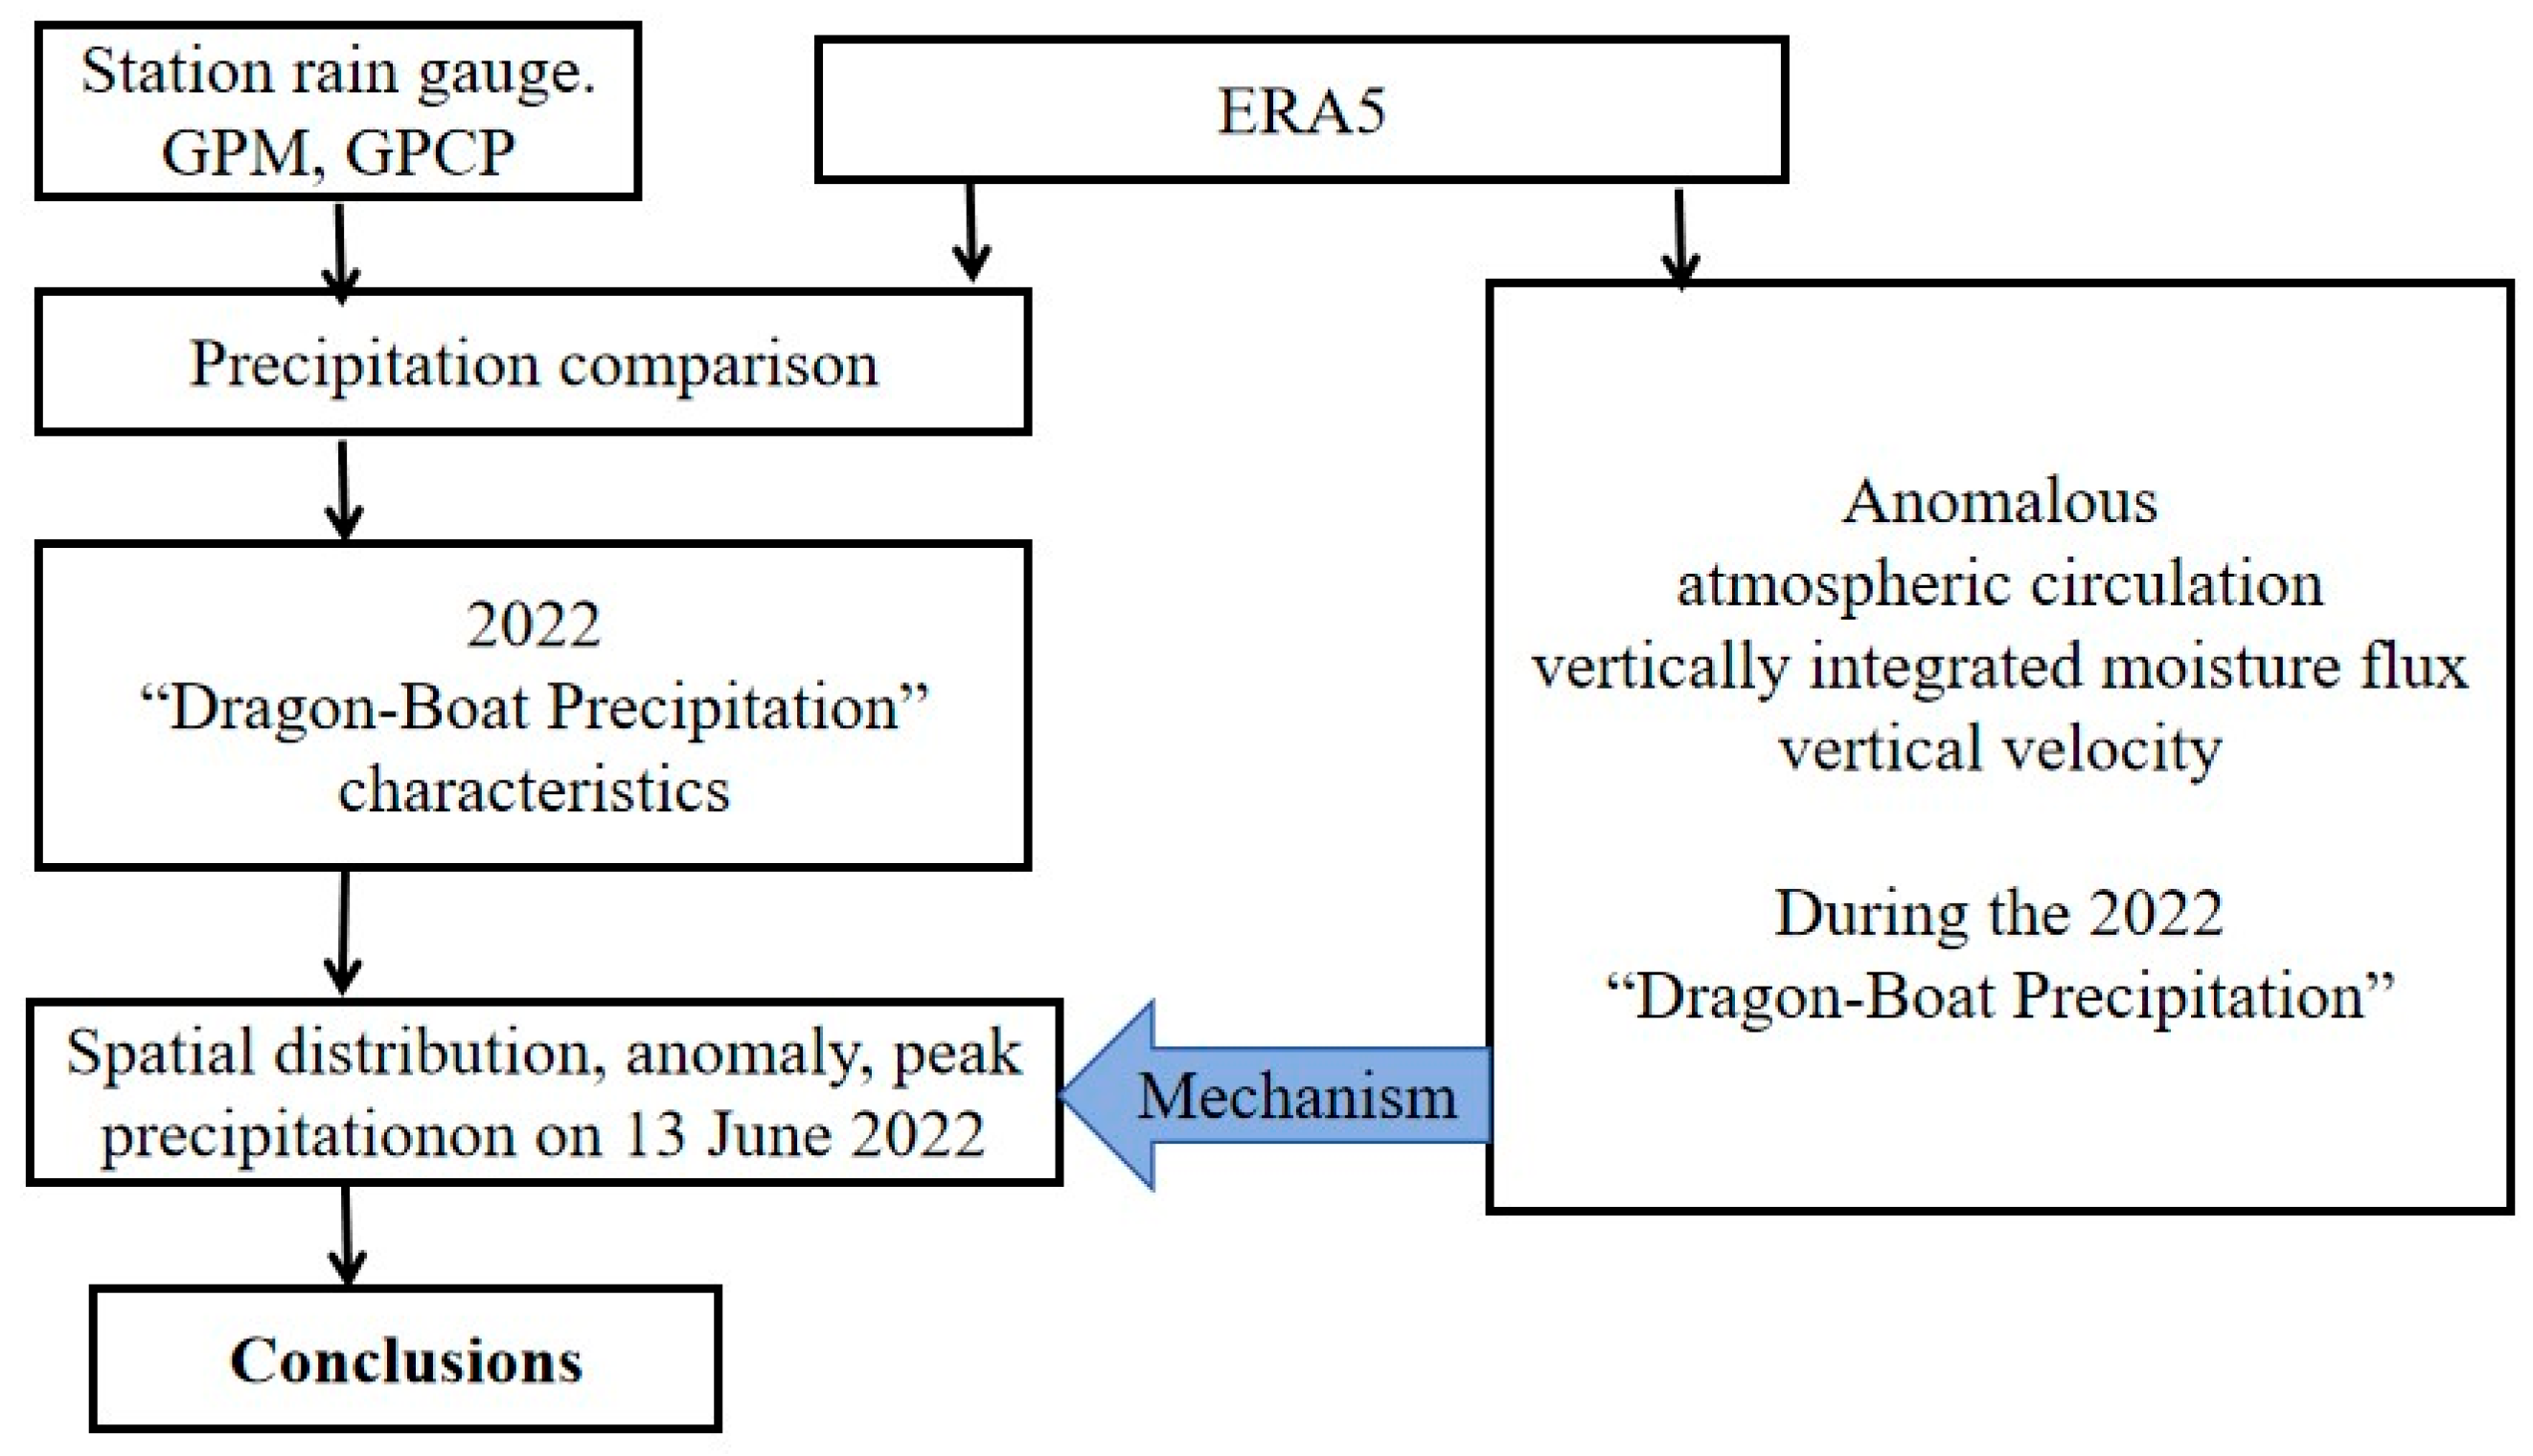
In this paper, a weather diagnostic and statistical analysis method is employed to examine the precipitation characteristics of the “Dragon-Boat Precipitation” in South China during 2022, along with the causes of the heaviest rainfall event during this period. The data processing and analysis workflow is summarized in Figure 1. The study region is the land area in (20–26° N, 10–117° E) as showed in Figure 2, including mainly Guangdong and Guangxi provinces. The “Dragon-Boat Precipitation” period is defined as the period from 20 May to 21 June, the climatology is defined as the 27-year average from 1998 to 2024, and the time is given in local (Beijing) time.
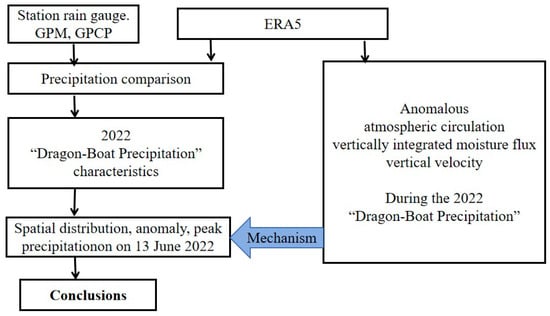
Figure 1.
Flowchart of the data processing and analysis in this study.
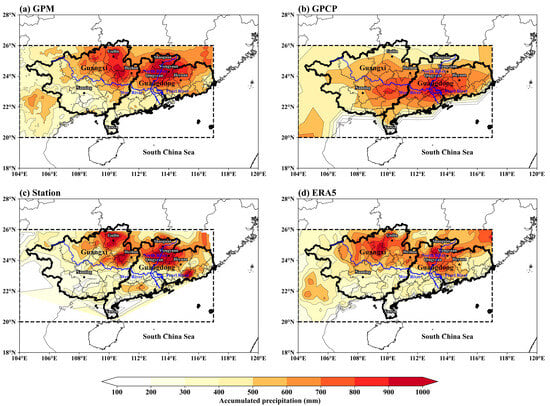
Figure 2.
Spatial distribution of cumulative precipitation during the “Dragon-Boat Precipitation” period from 20 May to 21 June over South China in 2022. The precipitation data are from (a) GPM, (b) GPCP, (c) station data and (d) ERA5. The provincial boundaries are shown with thick black lines, and major rivers are highlighted in blue. The dashed box (20–26° N, 104–117° E) indicates the study region.
3. Characteristics of the Spatial and Temporal Distribution of Precipitation During the “Dragon-Boat Precipitation”
3.1. Spatial Distribution of Precipitation During the “Dragon-Boat Precipitation”
The GPM, ERA5, and station observation datasets show high consistency in characterizing the spatial distribution of “Dragon-Boat Precipitation” over South China (Figure 2). All datasets reveal a pronounced north–south precipitation gradient, with significantly higher rainfall in northern regions than in the south. Except for the eastern and western flanks where precipitation remains below 500 mm, the rainfall generally increases progressively from south to north. The lowest precipitation (approximately 300 mm) occurs along the Nanning (Guangxi) to Xuwen (Guangdong) corridor. Precipitation exceeds 500 mm across the Pearl River Basin and its northern areas, with extreme rainfall events occurring in the mountainous regions of northeastern Guangxi and northern Guangdong. Specifically, Hezhou and Guilin in Guangxi recorded over 800 mm, while Shaoguan, Qingyuan, and Heyuan along the southern foothills of the Nanling Mountains received nearly 1000 mm. The maximum precipitation center, located at the border between southwestern Shaoguan and Wengyuan County, accumulated over 1100 mm.
The GPCP data exhibit slight deviations from the other three datasets (particularly station observations), its heavy rainfall belt shifted southward and concentrated mainly over central Guangxi and Guangdong. The precipitation exceeds 600 mm in central-eastern Guangxi and central Guangdong, with the Pearl River Delta region receiving the highest rainfall (>800 mm). In contrast, northern Guangxi and northern Guangdong show relatively lower precipitation amounts.
3.2. Temporal Evolution of Precipitation During the “Dragon-Boat Precipitation”
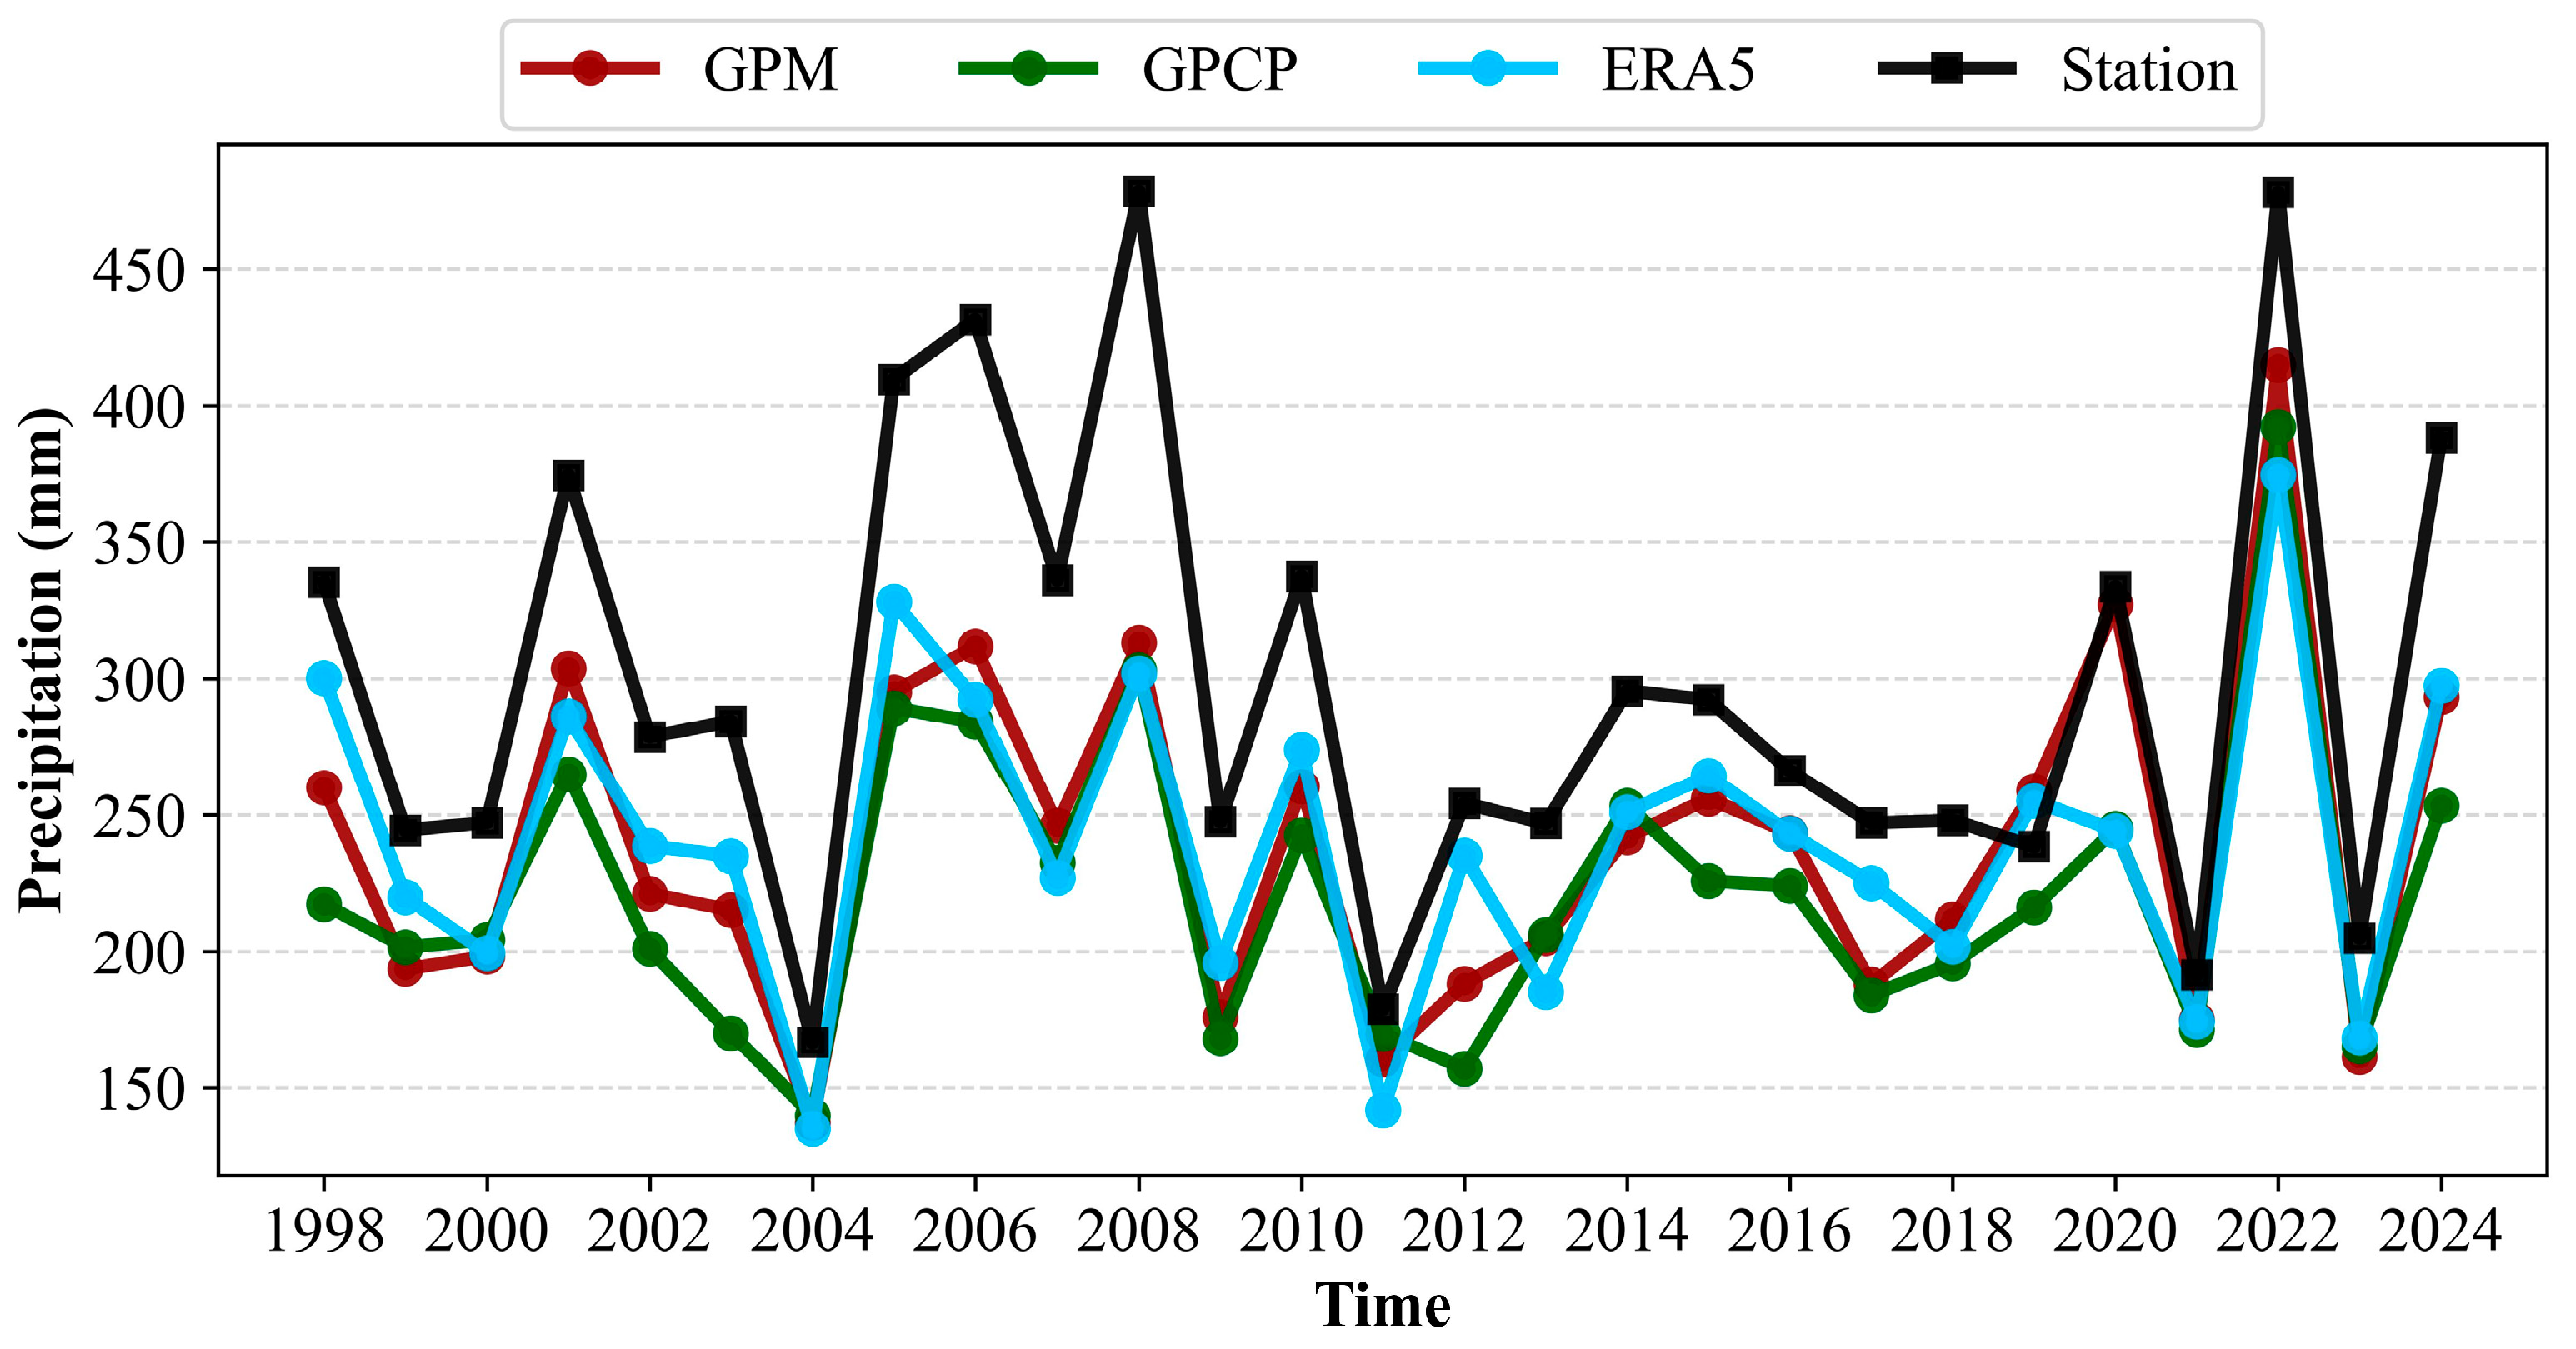
The interannual variability in accumulated area mean precipitation over “Dragon-Boat Precipitation” period from four datasets (GPM, ERA5, GPCP and station observations) are plotted in Figure 3. Although the station observations show higher precipitation than other three datasets, the variability is highly consistent across datasets, with correlation coefficients between station observations and other three datasets greater than 0.9, which is significant at the confidence level of 0.05 using Student’s t-test. All datasets captured the extreme precipitation in 2022.

Figure 3.
Interannual variation of the accumulated area mean land precipitation during the “Dragon-Boat Precipitation” period (20 May to 21 June) from 1998 to 2024 over the study area. Results are shown for GPM (purple line), GPCP (darkgreen line), ERA5 (cyan line), and station data (black line).
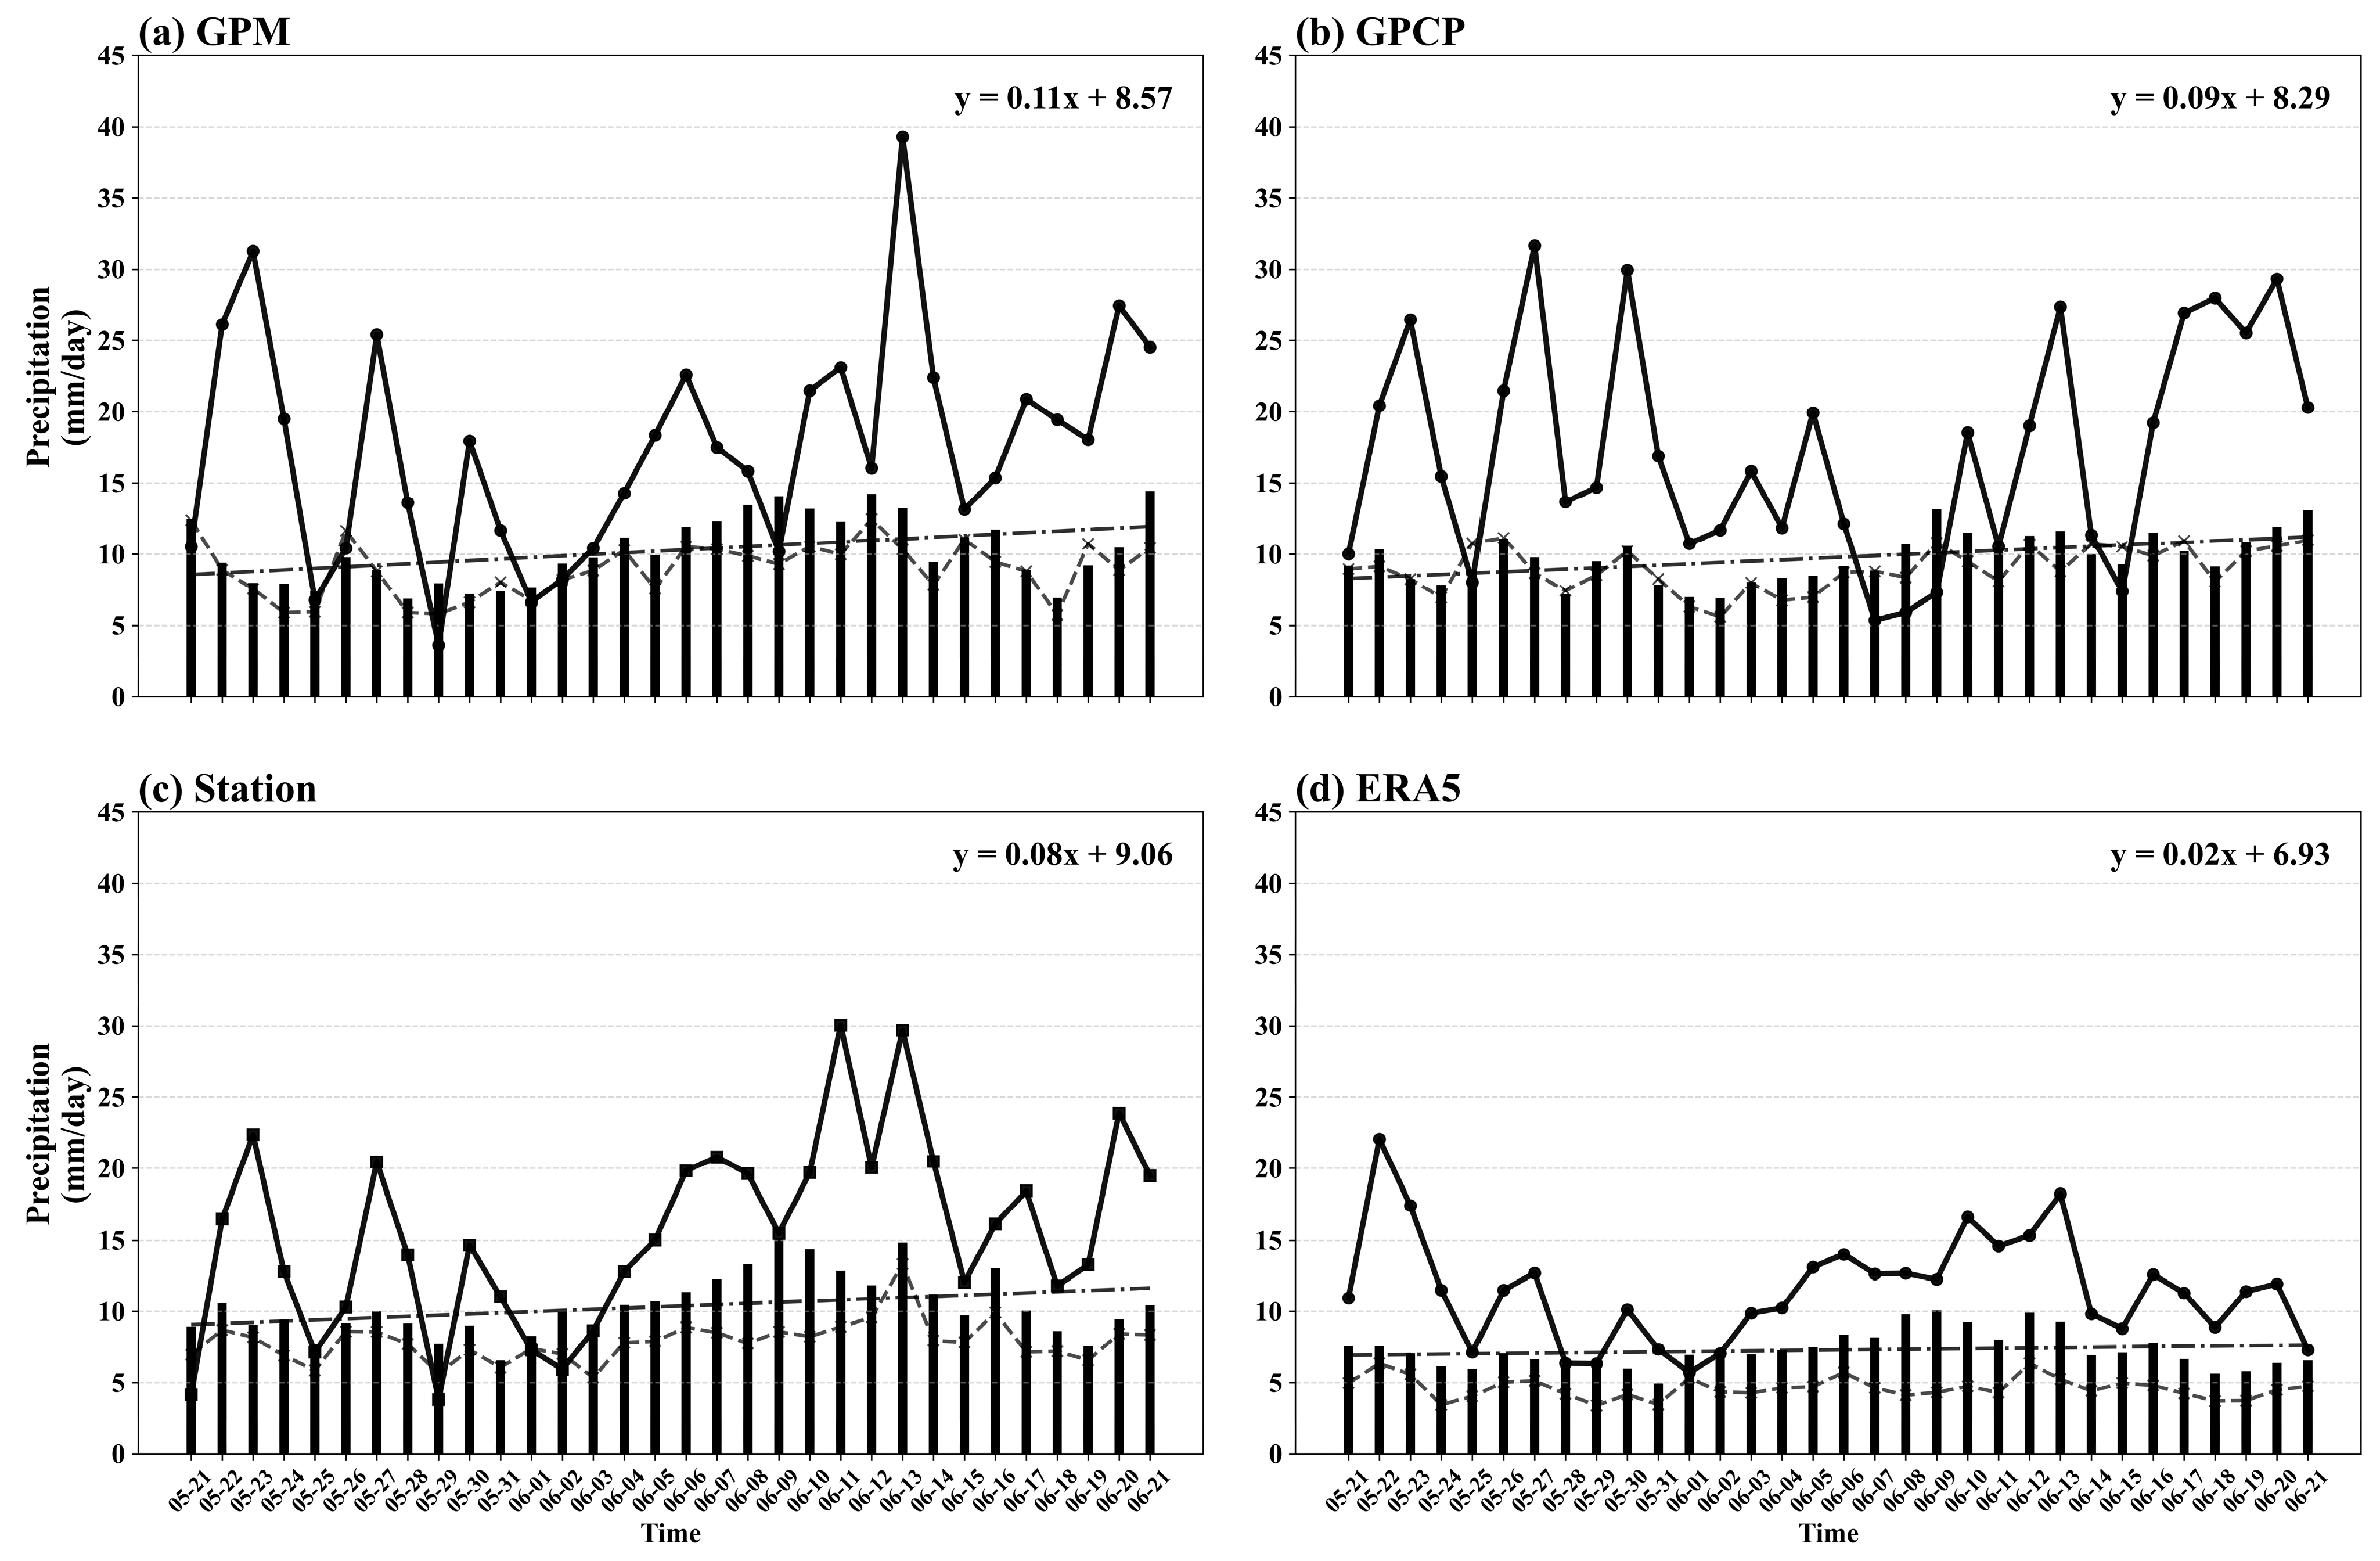
Figure 4 shows the multiannual mean daily precipitation variations in the study area. The GPM, GPCP, and station observations all exhibit an upward trend in precipitation during the “Dragon-Boat Precipitation” period, while ERA5 shows only a slight increase. The linear growth rates are 0.11 mm/day (GPM), 0.09 mm/day (GPCP), 0.09 mm/day (stations), and 0.02 mm/day (ERA5), respectively. All four datasets show a precipitation trough over 29–31 May, with daily minimum precipitation ranging between 5 and 8 mm/day, while there is a peak period with daily maximum precipitation of 10–17 mm/day over 9–13 June. The exact values of maximum/minimum precipitation and their corresponding dates vary slightly among datasets, but GPM results align most closely with station observations.

Figure 4.
Daily variation of the area mean precipitation during the “Dragon-Boat Precipitation” period (20 May to 21 June) over the study area. The precipitation is from (a) GPM, (b) GPCP, (c) station observations, and (d) ERA5. The black bars represent the multiannual (1998–2024) mean daily precipitation, the dashed black line shows the linear trend, and the solid black line is the daily precipitation in 2022.
During the 2022 “Dragon-Boat Precipitation”, daily precipitation fluctuations in South China were particularly pronounced, with almost all daily precipitation significantly higher than the climatology, a feature consistently captured by all four datasets. According to GPM data, the 2022 event was anomalously intense, with mean daily precipitation reaching 17.5 mm/day, exceeding the climatology by 6 mm/day, except for the precipitation on 21, 25, and 29 May and 1, 2, and 9 June, when it was slightly below the climatology. Notably, the precipitation on 22, 23, and 27 May and 13 and 20 June all reached or exceeded 25 mm/day, with 13 June recording the highest daily value of 39 mm/day in GPM data. The ratios between the mean 2022 “Dragon-Boat Precipitation” and the corresponding climatology are 1.71, 1.77, 1.58, and 1.51 for GPM, GPCP, ERA5, and station data, respectively.
4. Analysis of Background Field Characteristics
4.1. Circulation Pattern
Figure 5 shows the mean geopotential height field in the middle and upper troposphere during the “Dragon-Boat Precipitation” period in 2002 and the anomalous geopotential height distribution in 2022 relative to the 1998–2024 climatology. At the 200 hPa (Figure 5a), the mid-to-high latitude region of East Asia exhibits a synoptic pattern characterized by “one trough and one ridge” (Figure 5a). Over most regions of China, the atmospheric circulation is dominated by northwesterly flow situated between the rear of a trough and the leading edge of a ridge. An anomalously intensified high-pressure ridge, with geopotential height values exceeding the climatological mean by 45 gpm, extends from northwestern China to central-western Mongolia. A pronounced trough, characterized by geopotential height anomalies about 45 gpm below the climatological mean, is observed over the Korean Peninsula and extends eastward, indicating an anomalously intensified low-pressure system in the region. In the low-latitude region, the South Asian High exhibits a slight intensification and a northward displacement. Southern China lies to the northeastern sector of the South Asian High and to the south of the subtropical westerly jet stream, a configuration conducive to the development of divergent flow patterns in the area. This upper-tropospheric divergent flow pattern favors the enhancement of convective activity and precipitation intensification.
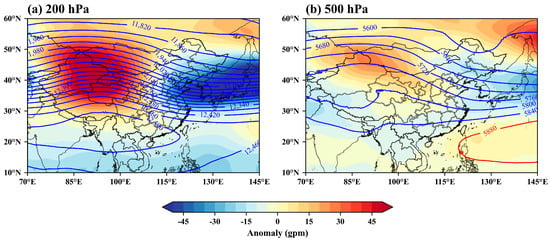
Figure 5.
Mean geopotential height over the “Dragon-Boat Precipitation” period in 2022 at (a) 200 hPa and (b) 500 hPa. The solid blue lines represent the contours, the solid red line represents the 5880 gpm contour, and the shaded area represents the geopotential height anomaly relative to 1998–2024. The unit is gpm.
At 500 hPa (Figure 5b), the mid-to-high latitude circulation pattern resembles that observed at 200 hPa, with a high-pressure ridge extending from Xinjiang to western Mongolia that exhibits an intensity approximately 25 gpm above the climatological mean. Meanwhile, the East Asian trough extending from Japan eastward shows much lower intensity than normal, with geopotential height values approximately 30 gpm below the climatological mean. The ridge line of the western Pacific subtropical high is positioned at 18–19° N, exhibiting 5 to 10 gpm above the climatology. South China exhibits negative geopotential height anomalies, with values approximately 10 gpm below the climatology. This spatial pattern aligns with the characteristic geopotential height anomalies observed during years of enhanced “Dragon-Boat Precipitation” rainfall in Guangdong province, as reported by Wang et al. [32].
Figure 6a is the mean 850 hPa wind fields over the “Dragon-Boat Precipitation” period in 2022; it shows the development of an exceptionally strong anticyclonic circulation spanning from the central-eastern South China Sea to the western Pacific region. The southerly flow associated with the anticyclonic circulation over the central-eastern South China Sea exhibited an intensity approximately 3 m/s greater than the climatology. Additionally, a robust southwesterly flow prevailed from the Bay of Bengal through the Indochina Peninsula to southern China and the East China Sea region. Positive anomalies in southwesterly winds (Figure 6b), with wind speeds exceeding 4 m/s above the climatology, were observed across South China, the southern region of the Yangtze River, and the East China Sea. This circulation pattern led to the formation of a southwest low-level jet stream extending from the southern China to northeastern Taiwan. Northern Guangdong and Guangxi provinces were situated within the cyclonic convergence zone to the left of the jet stream axis. These observations indicate that the lower-level monsoon circulation was exceptionally active during the 2022 “Dragon-Boat Precipitation” period, establishing a persistent moisture transport channel conducive to heavy precipitation events.

Figure 6.
(a) Composite plot of 850 hPa mean wind velocity during the 2022 “Dragon-Boat Precipitation” period. (b) The vector is the wind velocity anomaly relative to 1998–2024 and the shaded regions represent anomalies of the wind speed. The unit is m/s.
4.2. Moisture Transport
During the 2022 “Dragon-Boat Precipitation” period, the southwest monsoon established a persistent moisture transport channel from the Bay of Bengal to South China and the southern region of the Yangtze River (Figure 7a). A prominent moisture flux axis exceeding 50 kg/(m·s) developed from the Beibu Gulf through Guangxi to northern Guangdong province. Additionally, coastal areas of eastern Guangdong and Fujian province received substantial moisture contributions from the South China Sea. The moisture flux anomaly fields reveal an anticyclonic moisture flux anomaly pattern over the South China Sea to western Pacific region (Figure 7b), indicating that the South China Sea monsoon transported an anomalously high amount of moisture for precipitation during the 2022 “Dragon-Boat Precipitation” period. Furthermore, the moisture flux divergence fields reveal extensive moisture convergence zones extending from southwest China through southern China to the southern region of the Yangtze River and East China Sea (Figure 7c). Notably, the convergence centers over northern Guangxi, central-northern Guangdong, and the Taiwan Strait exhibit moisture flux convergence reaching 30 × 10 −5 kg/(m2 s). This intense moisture convergence contributed to extreme precipitation events in these regions, consistent with the anomalous high rainfall observed in northeastern Guangxi and northern Guangdong during the 2022 “Dragon-Boat Precipitation” period (Figure 2).
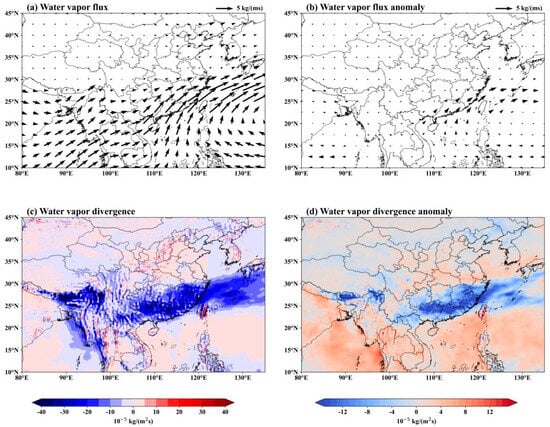
Figure 7.
(a) Mean vertically integrated water vapor flux over the 2022 “Dragon-Boat Precipitation” period and (b) the corresponding anomaly relative to 1998–2024. (c) The moisture flux divergence over the 2022 “Dragon-Boat Precipitation” period and (d) the corresponding anomaly relative to 1998–2024.
The extreme precipitation events during the “Dragon-Boat Precipitation” period over southern China in 2022 occurred under a distinctive synoptic configuration characterized by an anomalous deep East Asian trough, intensified South Asian High, and the strengthened western Pacific subtropical high. This atmospheric pattern, coupled with the establishment of dual moisture transport channels from the Bay of Bengal and South China Sea to southern China, was primarily driven by anomalously strong moisture transport via the South China Sea monsoon, resulting in precipitation extremes across the region.
5. Case Analysis
5.1. Precipitation Distribution
The intensity of the “Dragon-Boat Precipitation” over the study area on the 13 June in 2022 was notably strong across datasets, particularly in GPM dataset; therefore, it will be used for the case study.
During the “Dragon-Boat Precipitation” period in South China in 2022, the average daily precipitation on the 13 June reached 55.9 mm/day, marking the heaviest precipitation day in this event. It is selected as a case study for further analysis. The analysis of the 24 h cumulative precipitation in South China on 13 June (Figure 8) reveals significant spatial heterogeneity in precipitation distribution. The precipitation was widespread across the region, with heavy rainfall event (exceeding 50 mm/day) primarily concentrated in central-northern and southwestern Guangxi, and central-northern Guangdong. The most intense precipitation occurred in a belt extending from Nanning in northeastern Guangxi to Chongzuo in southwestern Guangxi, and from Shaoguan to Qingyuan and Heyuan in Guangdong (see Figure 1 for locations), where 24 h accumulation generally exceeded 100 mm. Notably, mountainous areas between Shaoguan and Heyuan in Guangdong experienced extreme precipitation events surpassing 250 mm. In contrast, the southern coast of Guangdong and the Leizhou Peninsula received little or no precipitation.
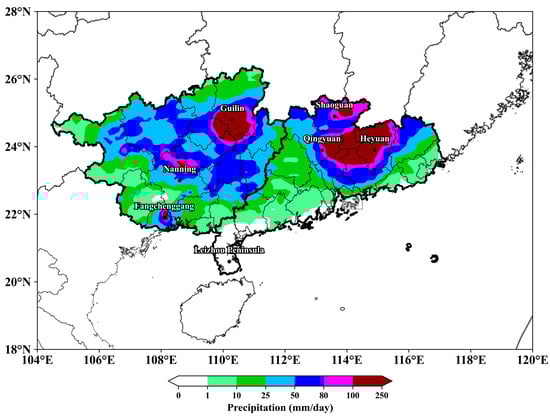
Figure 8.
Accumulated precipitation over 24 h on 13 June 2022 using GPM IMERG data. The unit is mm/day.
5.2. Analysis of Weather Patterns and Precipitation Conditions
5.2.1. Synoptic Field
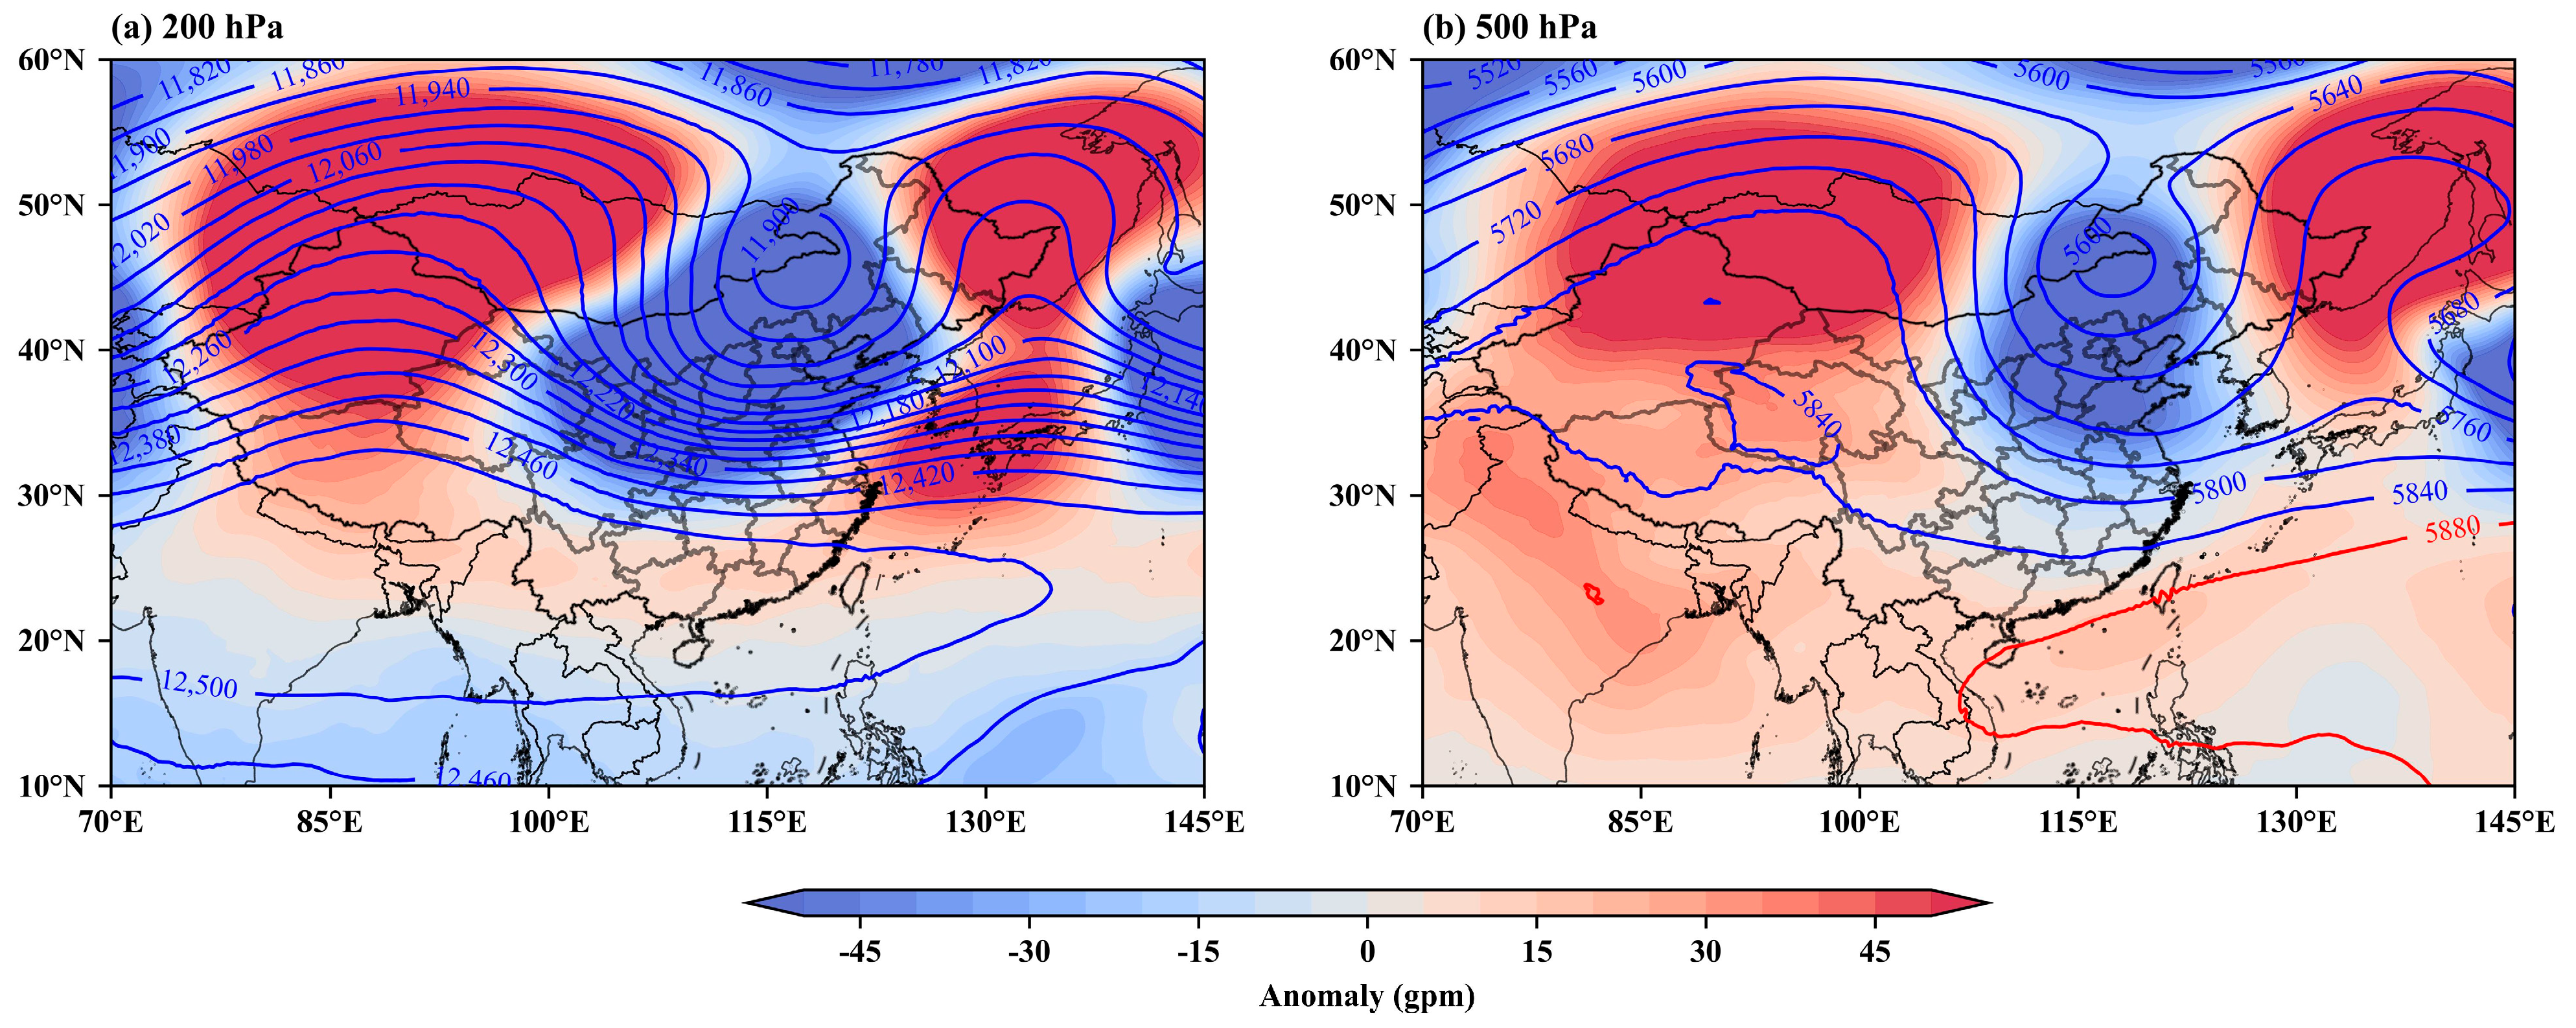
Figure 9a is the daily mean 200 hPa geopotential height on 13 June 2022: it exhibits a “two-ridge, one-trough” pattern across the mid-high latitude Eurasian region. The eastern Mongolian Plateau was under the influence of a low-pressure vortex, while high-pressure ridges dominated near the Sea of Okhotsk and the Altai Mountains, with both systems showing greater intensity than the climatology. In the low-latitude subtropical region, the South Asian High system was exceptionally strong, covering the western Indus Plain and extending through the Bay of Bengal and the Hengduan Mountains to the east, as well as the southwestern part of China, southern China, and the western Pacific region east of Taiwan. Under the influence of this abnormally strong South Asian High system, the geopotential height from the Tibetan Plateau to South China and the south of the Yangtze River was higher than normal. Guangdong and Guangxi province were situated at the northern edge of the South Asian high-pressure system and the southern end of the subtropical westerly jet stream, facilitating the establishment of a high-altitude divergent flow.
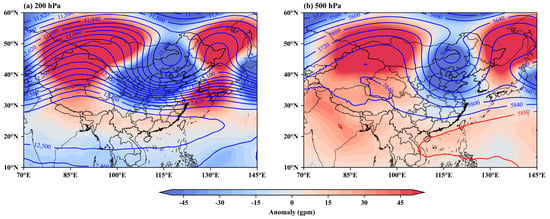
Figure 9.
Daily mean geopotential height on the 13 June 2022 at (a) 200 hPa and (b) 500 hPa. The shading is the corresponding anomaly relative to the multiannual (1998–2024) mean on the 13 June. Solid blue lines represent contours, and the red solid line indicates the 5880 gpm contour.
At 500 hPa (Figure 9b), the mid-tropospheric circulation pattern over mid-high latitude Eurasia mirrored that observed at 200 hPa. Two high-pressure ridges were evident, extending from Qinghai to western Mongolia and from Japan to the Sea of Okhotsk, respectively. A Northeast Cold Vortex was situated over eastern Inner Mongolia, with its associated trough extending southward to northern southern China. This exceptionally intense cold vortex, exhibiting negative geopotential height anomalies exceeding −45 gpm, induced widespread negative height anomalies across most of the central and eastern China. Northern Guangxi and Guangdong regions also showed slightly lower geopotential heights compared to the climatology. The western Pacific subtropical high exhibited its ridge line near 18°N, with its western extension reaching the coastal areas of Vietnam. South China was under the influence of southwesterly flow at the periphery of the subtropical high. The system showed slightly greater intensity than the climatology, as indicated by positive geopotential height anomalies.
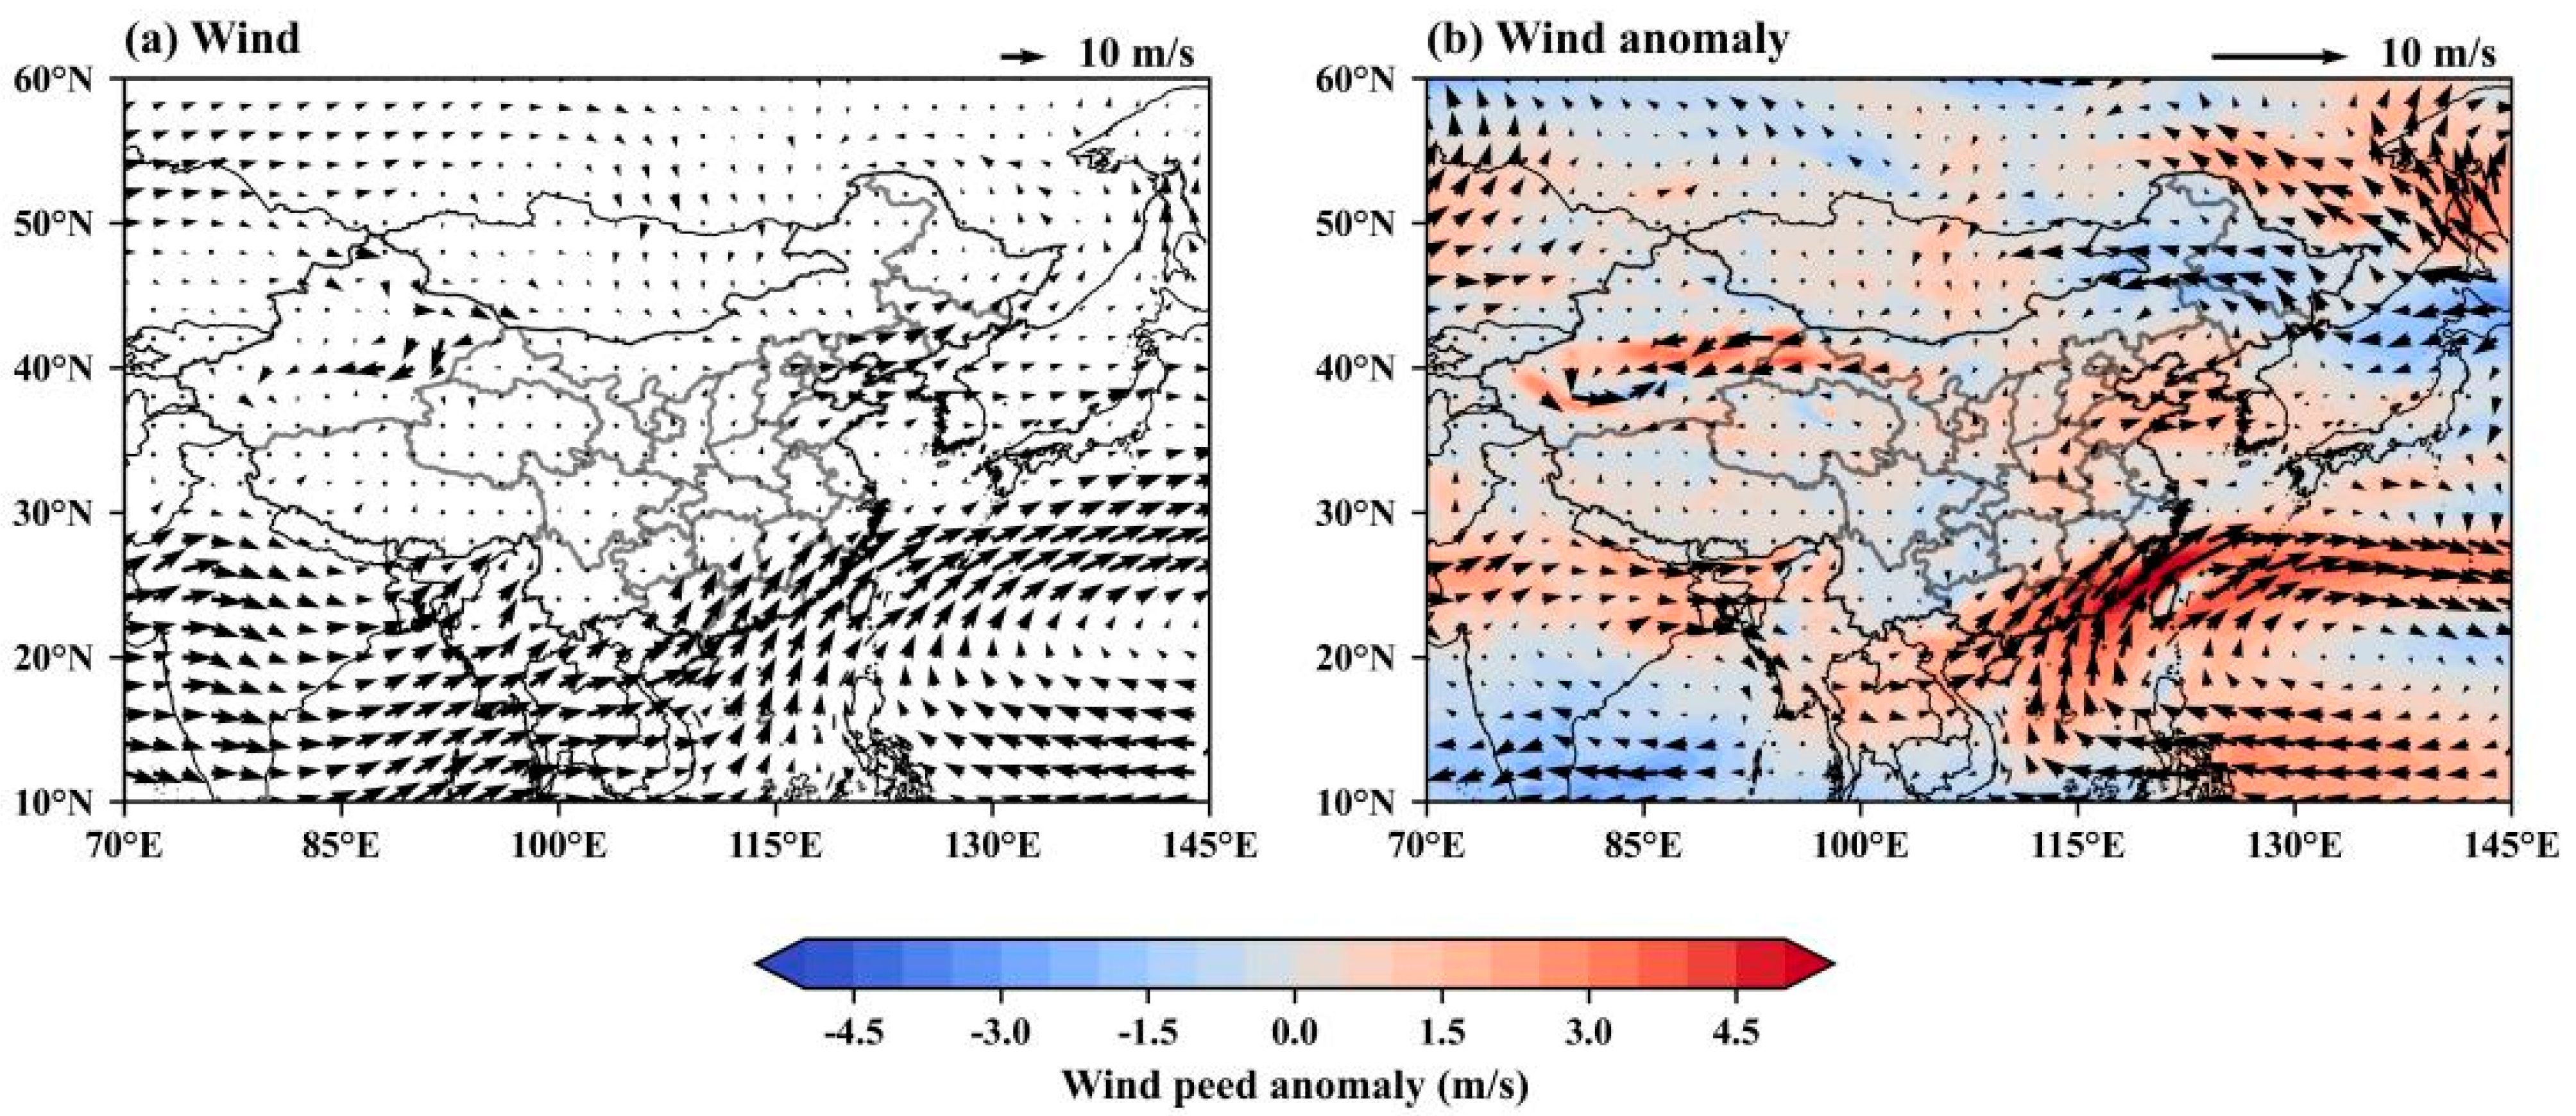
At 850 hPa (Figure 10a), the low-latitude region from the Indian Peninsula through the Bay of Bengal, the Indochina Peninsula, the Gulf of Tonkin, and most areas of South China and the southern region of the Yangtze River were controlled by the southwest monsoon. The southwesterly winds from the anticyclonic circulation of the western Pacific subtropical high-pressure ridge, located in the South China Sea, converged with the southwesterly monsoon flow along the South China coast, forming a low-level jet (LLJ) of over 12 m/s across the South China region. Northern Guangxi and central Guangdong province were situated in the cyclonic convergence zone to the north of the jet axis. The wind field anomalies reveal distinct regional patterns (Figure 10b), with southwesterly anomalies over Guangdong province and northerly anomalies over Guangxi province, generating cyclonic shear across northern South China. The most intense precipitation in northeastern Guangxi and central-northern Guangdong occurred in the proximity to this anomalous shear line.
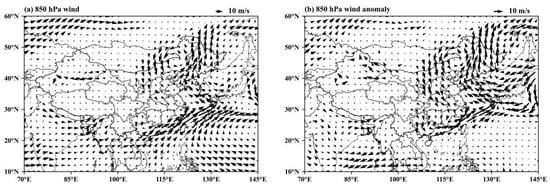
Figure 10.
At 850 hPa, (a) wind and (b) corresponding anomalies on 13 June 2022 The reference data are the multiannual (1998–2024) mean on the 13 June and the unit is m/s.
5.2.2. Water Vapor
The water vapor flux on the 13 June (Figure 11a) reveals a persistent southwest–northeast moisture transport channel extending from the Bay of Bengal through the Indochina Peninsula, Beibu Gulf, to South China and the southern region of the Yangtze River. The southwesterly flow continuously transported moisture from the Bay of Bengal to these regions, while southerly flow at the western periphery of the western Pacific subtropical high concurrently delivered moisture from the South China Sea to the coastal areas of South China, Fujian province, and around Taiwan Island. The water vapor flux anomaly indicates distinct regional moisture transport patterns (Figure 11b), with Guangdong dominated by enhanced southwesterly flow, while Guangxi received moisture from both southwesterly and anomalous northerly flows. Both provinces have moisture flux anomalies 20–50 kg/(m·s) above the climatological mean, providing abundant moisture supply for the extreme precipitation on this day.
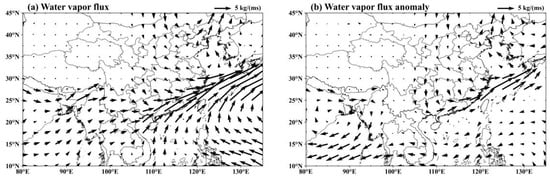
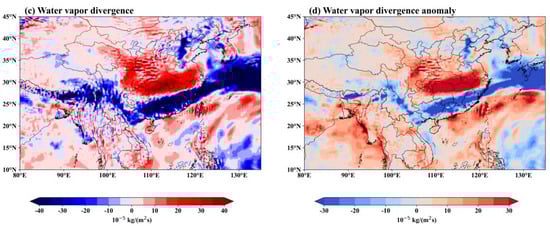
Figure 11.
(a) Vertically integrated water vapor flux and (b) the corresponding anomaly on the 13 June 2022. (c) The moisture flux divergence and (d) the corresponding anomaly on the 13 June 2022. The reference data are the multiannual (1998–2024) mean on the 13 June and the unit is 10 kg/(m s) for water vapor flux and 10−5 kg/(m2 s) for moisture divergence.
The moisture flux divergence (Figure 11c) and the corresponding anomaly (Figure 11d) reveal a zonally oriented moisture convergence belt extending from Guangxi through Guangdong to Fujian province. Notably, central Guangxi and central-northern Guangdong exhibited exceptionally strong moisture convergence, particularly in the Shaoguan–Qingyuan–Heyuan region of Guangdong, where moisture flux convergence reached 80 × 10−5 kg/(m2 s), with anomaly exceeding 27 × 10−5 kg/(m2 s), indicating anomalously intense moisture convergence. Therefore, the extreme precipitation event in South China on 13 June 2022 was closely associated with anomalously intense moisture transport by southwesterly flow and pronounced moisture convergence.
5.2.3. Vertical Motion
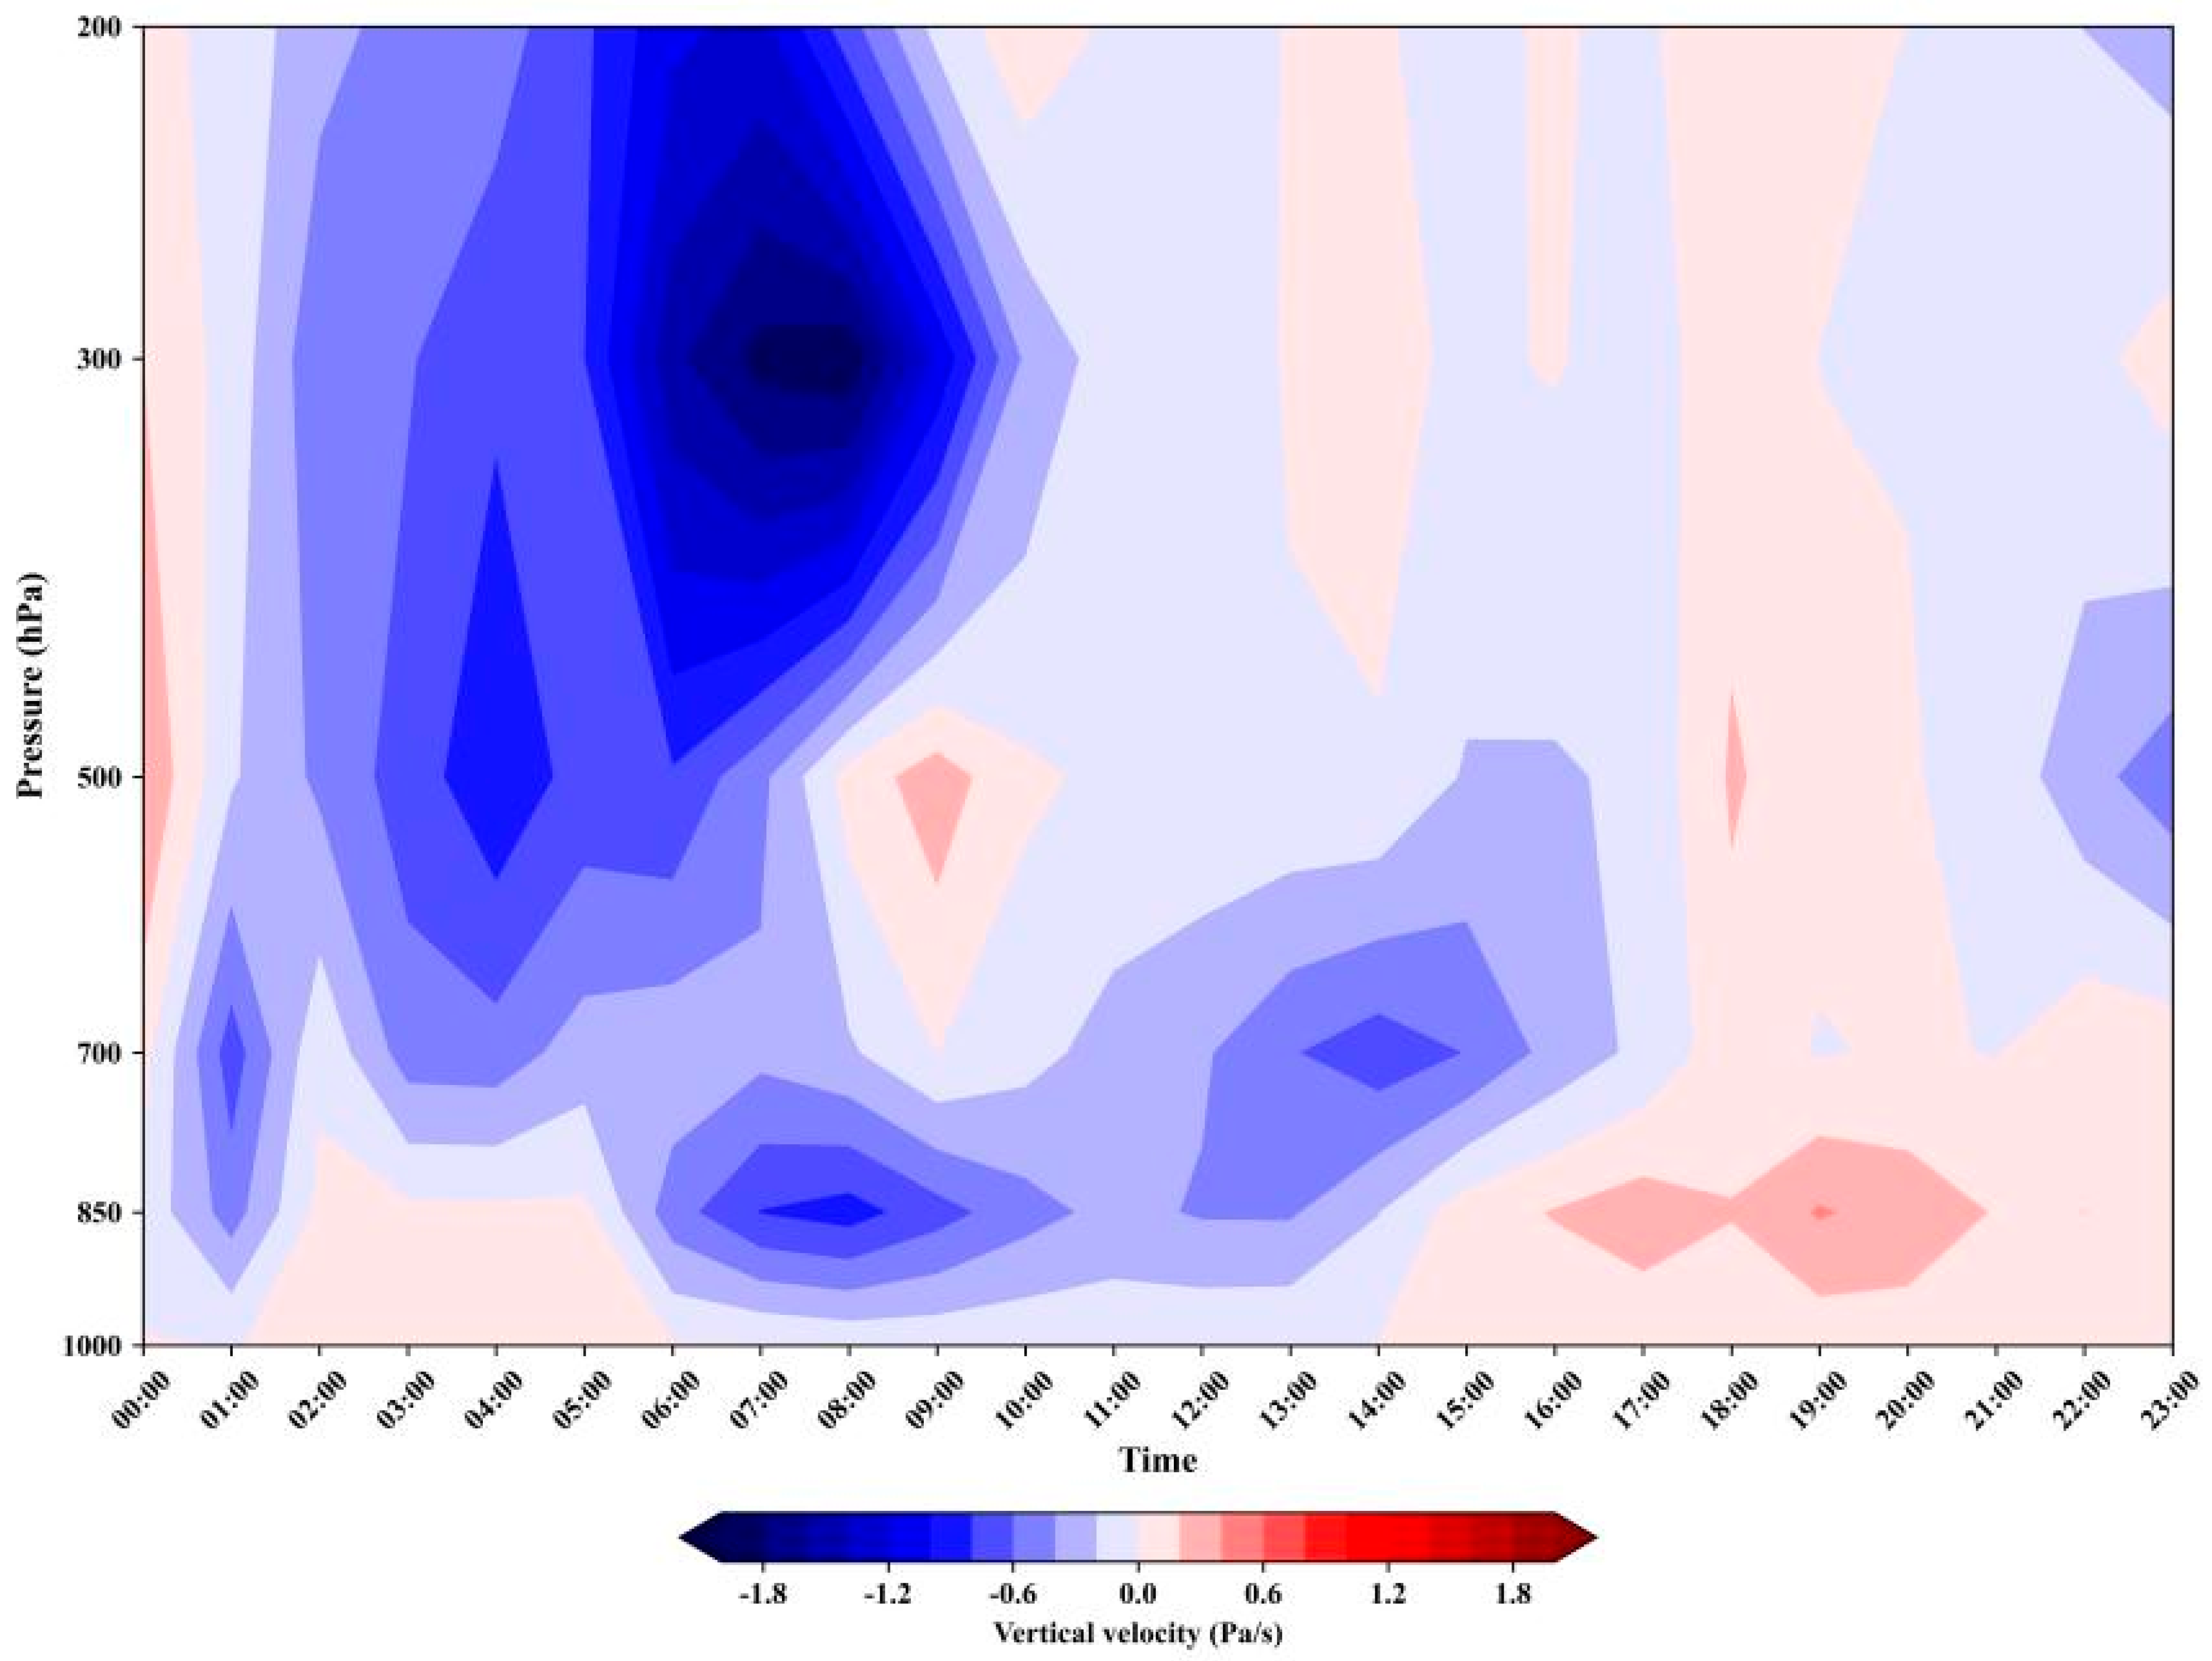
Analysis of the hourly vertical velocity profile at a grid point (110.1° E, 24.65° N), corresponding to the maximum 24 h rainfall on the 13 June, reveals predominantly ascending motion throughout the day except for weak subsidence between 1700–2000 local time (Figure 12). Notably, strong upward motion in the mid-upper troposphere (above 700 hPa) was observed between 0200 and 0500. During the 0500–0900 period, intense ascending motion was observed throughout the atmospheric column, with dual maxima at 850 hPa and 300 hPa. The upper-level maximum at 300 hPa exceeded −1.8 Pa/s, significantly stronger than the low-level maximum at 850 hPa. This period coincided with the most intense rainfall on the 13th, indicating the characteristics nocturnal nature of this precipitation event. A distinct ascending motion center developed between 600 hPa and 850 hPa during the 12:00–15:00 period, indicating enhanced convective activity in the afternoon that generated another episode of intense precipitation.

Figure 12.
Hourly vertical velocity profile at a grid point (110.1° E, 24.65° N) on the 13 June. The unit is Pa/s.
Synthesis of these analyses reveals that the widespread extreme precipitation event in South China on the 13 June 2022 during the “Dragon-Boat Precipitation” period occurred under exceptionally anomalous atmospheric circulation conditions. The region was situated beneath the northwestern periphery of the western Pacific subtropical high, which was displaced westward and exhibited slightly greater intensity than the climatological mean, intersecting with the base of a deep trough formed by an exceptionally strong northeast cold vortex. At lower levels, the region was positioned along a shear line between anomalous southwesterly and northerly flows. The combination of anomalously intense southwesterly moisture transport, pronounced moisture convergence, and exceptionally strong vertical ascent collectively contributed to the widespread extreme rainfall event.
6. Conclusions
The “Dragon-Boat Precipitation” period in South China in 2022 was characterized by rainfall totals substantially exceeding climatological mean (1998–2024), featuring multiple episodes of widespread extreme precipitation events. These events exhibited exceptional intensity, extensive spatial coverage, and prolonged duration. The following conclusions can be drawn from the analysis of the circulation patterns and physical fields:
(1) During the “Dragon-Boat Precipitation” period in 2022, the total precipitation in South China exhibited a distinct spatial distribution pattern with higher precipitation in northern regions and lower amounts in southern areas. The maximum precipitation center was located in the Nanling Mountain region, specifically in the Shaoguan–Qingyuan–Heyuan area of Guangdong province, where the peak accumulation reached 1100 mm over 20 May to 21 June, and the mean precipitation was approximately 1.7 times the climatology.
(2) The 2022 “Dragon-Boat Precipitation” period was characterized by the anomalously high precipitation, with a mean daily rainfall of 17.5 mm/day throughout the event, exceeding the long-term average by 6 mm/day. The most intense rainfall occurred on the 13 June, with the total precipitation surpassing the climatology by 48 mm/day, more than two standard deviations above the normal.
(3) The extreme precipitation events during the “Dragon-Boat Precipitation” period in 2022 in South China occurred under a distinctive synoptic configuration characterized by an anomalously deep East Asian trough, intensified South Asian High, and the strengthened western Pacific subtropical high. This atmospheric pattern, coupled with the establishment of dual moisture transport channels from the Bay of Bengal and South China Sea to South China, was primarily driven by the anomalous strong moisture transport via the South China Sea monsoon, resulting in precipitation extremes across the region.
(4) The widespread extreme precipitation event on 13 June 2022 occurred under exceptionally anomalous atmospheric circulation conditions. South China was situated south of the northwestern periphery of the western Pacific subtropical high, which was displaced westward and exhibited slightly greater intensity than the climatological mean, intersecting with the base of a deep trough formed by an exceptionally strong northeast cold vortex. At lower levels, the region was positioned along a shear line between anomalous southwesterly and northerly flows. The combination of anomalously intense southwesterly moisture transport, pronounced moisture convergence, and exceptionally strong vertical ascent collectively contributed to this widespread extreme rainfall event.
Author Contributions
M.C., Y.X. and C.L. contributed to the conceptualization, supervision, paper writing—editing; Y.X. and C.L. contributed to the funding acquisition and writing—review; M.C. and J.Q. contributed to the validation and visualization; M.C., Y.X., J.Q., C.L., S.Z., J.X. and Z.Z. All contributed to the supervision, writing—review and discussion. All authors have read and agreed to the published version of the manuscript.
Funding
This work is supported by National Key Research and Development Program of China (Grant No. 2018YFC1506902) and the National Natural Science Foundation of China (42275017, 42075036).
Institutional Review Board Statement
Not applicable.
Informed Consent Statement
Not applicable.
Data Availability Statement
The GPM IMERG precipitation data are available at https://gpm.nasa.gov/data/directory, accessed on 5 April 2025. ERA5 reanalysis data can be accessed from the Copernicus Climate Data Store at https://cds.climate.copernicus.eu/datasets, accessed on 5 April 2025. GPCP daily precipitation data are available from NOAA at https://www.ncei.noaa.gov/data/global-precipitation-climatology-project-gpcp-daily/access/, accessed on 5 April 2025. Station-based precipitation data were obtained from the National Meteorological Information Center of the China Meteorological Administration and are available at http://www.nmic.cn/, accessed on 5 April 2025.
Acknowledgments
The authors acknowledge the NASA Goddard Space Flight Center for providing the GPM IMERG precipitation data, the ECMWF for the ERA5 reanalysis dataset, and NOAA for the GPCP daily precipitation product. The station data were provided by the National Meteorological Information Center, China Meteorological Administration (CMA).
Conflicts of Interest
The authors declare no conflicts of interest.
References
- Wu, H.; Li, C.; Wang, D. Abnormal characteristics and causes of Dragon-Boat Precipitation in Guangdong over the past 55 years. J. Trop. Meteorol. 2017, 33, 608–616. (In Chinese) [Google Scholar]
- Wu, H.; Guo, Y.; Wu, Y. Climatic characteristics and changes of Dragon-Boat Precipitation in South China over the past 62 years. J. Heavy Rain Disasters 2024, 43, 84–92. (In Chinese) [Google Scholar]
- Qin, W.; He, L.; Cai, Y.; Liao, X. Research progress on Dragon-Boat Precipitation heavy rainfall in South China over the past 30 years. Meteorol. Res. Appl. 2023, 44, 1–6. (In Chinese) [Google Scholar]
- Miao, C.; Wu, Z.; He, J.; Chi, Y. The anomalous features of the northeast cold vortex during the first flood period in the last 50 years and its correlation with rainfall in South China. Chin. J. Atmos. Sci. 2006, 30, 1249. (In Chinese) [Google Scholar]
- Wu, H.Y.; Wu, Y.; Zheng, J. The relationship between the extreme dragon-boat Precipitation and atmospheric circulation and SST anomaly in South China in 2022. Trans. Atmos. Sci. 2024, 47, 450–459. (In Chinese) [Google Scholar] [CrossRef]
- Su, Q.; Lu, R.; Li, C. Large-scale circulation anomalies associated with interannual variation in monthly rainfall over South China from May to August. Adv. Atmos. Sci. 2014, 31, 273–282. [Google Scholar] [CrossRef]
- Bao, Z. Advances in research on pre-flood season rainfall in South China. Acta Oceanol. Sin. 1986, 1, 31–40. (In Chinese) [Google Scholar]
- Liang, J.; Wu, S. Discussion on the causes of drought and flood during the flood season in Guangdong Province and the influencing factors in the earlier period. J. Trop. Meteorol. 2001, 17, 97–108. (In Chinese) [Google Scholar]
- Wang, Y.; Gao, J.; Chi, Y.; Tang, Z.; Chen, S. Statistical characteristics of persistent heavy rainfall during the first rainy season in South China under the background of Pacific sea temperature fields on different time scales. Trans. Atmos. Sci. 2015, 38, 126–431. (In Chinese) [Google Scholar]
- Zhao, Y.; Wang, Y. Overview of the study on the pre-flood season heavy rainfall in South China during the past 30 years. Rainstorm Disaster 2009, 28, 193–202+228. (In Chinese) [Google Scholar]
- Jin, D.; Guan, Z.; Huo, L.; Wang, X. Possible impacts of spring sea surface temperature anomalies over South Indian Ocean on summer rainfall in Guangdong-Guangxi region of China. Clim. Dyn. 2017, 49, 3075–3090. [Google Scholar] [CrossRef]
- Papalexiou, S.M.; Montanari, A. Global and regional increase of precipitation extremes under global warming. Water Resour. Res. 2019, 55, 4901–4914. [Google Scholar] [CrossRef]
- Hu, Y.; Du, Y.; Luo, X. Precipitation classification of “Dragon-Boat Precipitation” in South China during the past 49 years. Meteorology 2013, 39, 1031–1041. (In Chinese) [Google Scholar] [CrossRef]
- Ze, C.; Zou, X.; Cholaw, B.; Yuan, G.; Jun, J.; Sheng, L. Spatiotemporal Characteristics of Extreme Pecipitation in the lndochina Peninsula and South China. Chin. J. Atmos. Sci. 2023, 47, 957–974. (In Chinese) [Google Scholar] [CrossRef]
- Lee, M.H.; Ho, C.H.; Kim, J.H. Influence of tropical cyclone landfalls on spatiotemporal variations in typhoon season rainfall over South China. Adv. Atmos. Sci. 2010, 27, 443–454. [Google Scholar] [CrossRef]
- Gimeno, L.; Nieto, R.; Vázquez, M.; Lavers, D.A. Atmospheric rivers: A mini-review. Front. Earth Sci. 2014, 2, 2. [Google Scholar] [CrossRef]
- Simmonds, I.; Bi, D.; Hope, P. Atmospheric water vapor flux and its association with rainfall overchina in summer. J. Clim. 1999, 12, 1353–1367. [Google Scholar] [CrossRef]
- Zhou, T.J.; Yu, R.C. Atmospheric water vapor transport associated with typical anomalous summer rainfall patterns in China. J. Geophys. Res. Atmos. 2005, 110, D08104. [Google Scholar] [CrossRef]
- Wang, Z.; Xu, J.; Zeng, Z.; Ke, M.; Feng, X. Understanding the 2022 extreme dragon-boat rainfall in South China from the combined land and oceanic forcing. Asia-Pac. J. Atmos. Sci. 2024, 60, 1–14. [Google Scholar] [CrossRef]
- Yao, S.; Huang, Q.; Zhao, C. Variation characteristics of rainfall in the pre-flood season of South China and its correlation with sea surface temperature of Pacific. Atmosphere 2015, 7, 5. [Google Scholar] [CrossRef]
- Gimeno-Sotelo, L.; Gimeno, L. Where does the link between atmospheric moisture transport and extreme precipitation matter? Weather Clim. Extrem. 2023, 39, 100536. [Google Scholar] [CrossRef]
- Zhou, X.; Ding, Y.; Wang, P. Moisture transport in the Asian summer monsoon region and its relationship with summer precipitation in China. Acta Meteorol. Sin. 2010, 24, 31–42. [Google Scholar]
- Sheng, B.; Wang, H.; Li, H.; Wu, K.; Li, Q. Thermodynamic and dynamic effects of anomalous dragon boat water over South China in 2022. Weather. Clim. Extrem. 2023, 40, 100560. [Google Scholar] [CrossRef]
- Deng, W.-J.; Ren, P.-F.; Zhang, D.; Sun, Y.; Wu, N.-G. An extreme monsoonal heavy rainfall event over inland South China in June 2022: A synoptic causes analysis. J. Trop. Meteorol. 2023, 29, 16–25. [Google Scholar]
- Cheng, J.; Zhao, Y.; Zhi, R.; Feng, G. Meridional circulation dominates the record-breaking “Dragon Boat Water” rainfall over south China in 2022. Front. Earth Sci. 2023, 10, 1032313. [Google Scholar] [CrossRef]
- Liu, B.; Zhu, C.; Xu, K.; Ma, S.; Lu, M.; Han, X.; Hua, L. Record-breaking pre-flood rainfall over South China in 2022: Role of historic warming over the Northeast Pacific and Maritime Continent. Clim. Dyn. 2023, 61, 3147–3163. [Google Scholar] [CrossRef]
- Dong, S.-R.; Yang, S.; Liu, W.; Hu, Y.-M.; Wang, M.-S.; Liu, Y. Analysis of Precipitation Anomaly and a Failed Prediction During the Dragon-boat Rain Period in 2022. J. Trop. Meteorol. 2023, 29, 115–127. [Google Scholar]
- Huffman, G.J.; Stocker, E.F.; Bolvin, D.T.; Nelkin, E.J.; Tan, J. GPM IMERG Final Precipitation L3 Half Hourly 0.1 Degree x 0.1 Degree V07 Dataset; Goddard Earth Sciences Data and Information Services Center (GES DISC): Greenbelt, MD, USA, 2023. [Google Scholar] [CrossRef]
- Huffman, G.J.; Adler, R.F.; Behrangi, A.; Bolvin, D.T.; Nelkin, E.J.; Gu, G.; Ehsani, M.R. The new version 3.2 global precipitation climatology project (GPCP) monthly and daily precipitation products. J. Clim. 2023, 36, 7635–7655. [Google Scholar] [CrossRef]
- Qiu, J.; Luo, Y.; Wu, C.; Gao, Y.; Yu, S. Macro-and microphysical characteristics of extreme hourly precipitation over the pearl river Delta on the monsoon coast (south China). J. Geophys. Res. Atmos. 2024, 129, e2023JD039929. [Google Scholar] [CrossRef]
- Hersbach, H.; Bell, B.; Berrisford, P.; Hirahara, S.; Horányi, A.; Muñoz-Sabater, J.; Nicolas, J.; Peubey, C.; Radu, R.; Schepers, D.; et al. The ERA5 global reanalysis. Q. J. R. Meteorol. Soc. 2020, 146, 1999–2049. [Google Scholar] [CrossRef]
- Wang, J.; Yang, S.; Wei, Z.; Hu, Y. Changes in characteristics of Dragon-Boat Precipitation in Guangdong under global warming. Guangdong Meteorol. 2018, 40, 4–8. (In Chinese) [Google Scholar]


Disclaimer/Publisher’s Note: The statements, opinions and data contained in all publications are solely those of the individual author(s) and contributor(s) and not of MDPI and/or the editor(s). MDPI and/or the editor(s) disclaim responsibility for any injury to people or property resulting from any ideas, methods, instructions or products referred to in the content. |
© 2025 by the authors. Licensee MDPI, Basel, Switzerland. This article is an open access article distributed under the terms and conditions of the Creative Commons Attribution (CC BY) license (https://creativecommons.org/licenses/by/4.0/).