Abstract
This systematic literature review (SLR) focuses on indoor environmental quality (IEQ) in passenger transport vehicles within tropical and subtropical regions. It specifically examines indoor air quality (IAQ), thermal comfort (TC), acoustic comfort (AC), and visual comfort (VC) of passenger vehicle cabins (PVCs) in auto rickshaws, sedans, trucks, bus rapid transits (BRTs), buses, trains, trams, metro systems, aircraft and ferries of tropical and subtropical regions. The SLR used the PRISMA approach to identify and review scientific studies between 2000 and 2024 on the IEQ of PVCs in the tropics. Studies reviewed were found in SCOPUS, Web of Science, Science Direct, and EBSCO databases including relevant citation references. Findings reveal a significant geographical imbalance in research, with most studies concentrated in tropical Asia (78.2%), while sub-Saharan Africa (8.2%), South America (11.8%), and Oceania (1.8%) are considerably underrepresented. In 113 studies, most addressed IAQ and TC but limited attention to AC and VC. Moreover, fewer studies have jointly addressed all the IEQ parameters, highlighting the need for a more comprehensive approach to IEQ for tropical PVCs. Several studies alluded to in-cabin commuter risk linked to PM2.5, PM10, carbon monoxide (CO), and volatile organic compounds (VOCs). These risks are exacerbated by traffic hotspots, poor ventilation, ambient pollution, overcrowding, and poor vehicle conditions. Additionally, thermal discomfort is compounded by extreme heat loads, inefficient HVAC systems, and high vehicle occupancy. Common gaps include a paucity of IEQ studies and inadequate IEQ regulations or adapted standards in developing tropics. Infrastructural and regulatory deficiencies have been identified, along with strategies for mitigation. Recommendations are for more holistic IEQ studies in the tropics, including exposure studies for emerging gaps in new indoor pollutants, integration of AI and IoT for sustainable ventilation strategies, and development of effective regulatory frameworks considering region-specific conditions. Finally, Policymakers are encouraged to establish localized IEQ standards, enforce regulations, and prioritize upgrades to transport infrastructure. The SLR findings emphasize the urgent need for targeted interventions in developing tropical regions to address disparities in IEQ, ensuring healthier and more sustainable transport environments that could be replicated across transport systems worldwide.
1. Introduction
Indoor environmental quality (IEQ) consists of the combined conditions of indoor air quality (IAQ), thermal comfort (TC), acoustic comfort (AC), and visual comfort (VC) [1]. Since modern man spends more time indoors, coupled with the increasing awareness of the negative impacts of defective IEQ on exposed occupants, there is a growing demand to ensure adequate IEQ conditions in buildings and transport micro-environments. Although people spend more time in buildings, they travel 45 km daily and spend at least 5% of their daily time traveling [2], including in many megacities where daily travel can exceed 2 h [3,4]. Considering the domination of motorized transport in daily commuting [5] and commuter traffic, ensuring adequate IEQ in transport microenvironments (MEs) is crucial. The demands to ensure adequate IEQ have hitherto been more catered for in the context of developed countries, especially with non-tropical climatic conditions. Comparatively, less attention has been given to IEQ considering the tropics and even less to developing tropical countries [6]. The current study is a systematic literature review (SLR) and, unlike conventional reviews, it was limited to inclusion and exclusion criteria, following the PRISMA guidelines for SLR [7]. It aimed to comprehensively understand the IEQ challenges, identify research gaps, and inform opportunities for future studies in tropical transport micro-environments. Moreover, it has focused on IEQ in passenger vehicles (PVs) within tropical regions, where rapid urbanization, population growth, and challenges such as pollution and motorized transport are prevalent. Understanding IEQ in transport is essential for enhancing public health and safety.
Notably, a significant percentage of tropical countries are still characterized by infrastructural, socioeconomic, and policy deficits, which contribute to a negative development impact, including a marked risk in public health, safety, and environmental conditions [8]. Furthermore, for IEQ in the tropical context, findings have shown that there is a paucity of scientific studies [9], including comparatively lower attention to IEQ in transport micro-environments than reported for buildings. The findings in a review study showed that knowledge gaps exist quantitatively and qualitatively for the tropics [9], and even more so in IEQ studies for vehicles than buildings. It was reported that at least 106 countries with tropical zones within their borders, referring to tropics as regions between latitudes between 23.5 N and 23.5 S, and of four main types by inherent seasonal variabilities of dryness and wetness such as tropical rainforests, monsoonal zones, and savannah zones [10]. Notably, as far back as 1948, ref. [11] discussed the population growth trend in the tropics, including an indication to address the potential risks to public health. These indications align with discussions highlighting concerns in the tropics about rapid urbanization, climate change and rising temperatures, environmental pollution, and geometric population growth [8,11,12,13].
Meanwhile, reports indicate that Tropical Asia, South America, and Africa already host several megacities and will host many more by 2050 [14]. Reports have also stated a higher population growth trend in the tropics and subtropics like China, India, Indonesia, Nigeria, Ethiopia, Egypt, the Democratic Republic of the Congo (DRC), and Tanzania. Accordingly, ref. [15] says that geometric population growth, rapid urbanization, and increased motorized transport in the tropics imply increased commuters and pollution, including increased risk to public health besides infrastructure and regulatory burdens [16]. Regarding disease and health burdens in the tropics, the unsafe level of outdoor pollution constitutes and contributes to the increased risk [11,17]. Reports have shown that 58% of all PM2.5-related deaths globally in 2019 were in India and China alone, whereas, for India alone, the PM2.5 death toll was 980,000 deaths [18]. Additionally, risks to health and comfort have been linked to extreme temperatures (due to climate change) besides the typically hot and humid climatic peculiarities in tropical zones [19], which commuters are also prone to. Consequently, since ambient outdoors impacts indoor spaces, the condition of defects in IEQ, which occupants are exposed to in building and transport indoor spaces, suggests existential risks to health, well-being, and safety.
As urbanization and population growth continue, particularly in tropical areas where suburbs are expanding rapidly, the rise in motorized commuting requires careful attention. The condition of outdoor infrastructures (namely air quality conditioned by road infrastructures and traffic and temperature) and indoor conditions (air quality, thermal, acoustic, and visual comfort) affect public health, comfort, and safety deserve special care. Ensuring adequate vehicle indoor conditions requires efficient heating, ventilation, and air conditioning (HVAC) systems, which have been reported as the highest secondary consumer of energy in vehicles [20]. Meanwhile, studies have reported higher ambient pollution levels in many tropical cities relating to noise and air quality [21,22,23,24] intruding indoor spaces of buildings and transport microenvironments (MEs). Thus, assuring optimal IEQ in transport vehicles will contribute to sustainability, public health, and safety.
The current focus of our study regards PVs due to the significant role motorized transport has played in disease and influenza transmission in-vehicle, both aircraft and land passenger transport vehicles [25,26,27]. Studies have shown that passengers’ and drivers’ exposure to defective IEQ conditions accounts for myriads of health problems, disease spread in the case of influenza, road safety, and discomfort [26,28]. Moreover, tropical cities’ prevailing urban trends have enhanced the health and comfort risk in exposed commuters due to a decrease in air quality based on the increase of sources related to traffic air pollution (TRAP), resulting in increased levels of particulate matter (PM), black carbon, dust, and volatile inorganic compounds. Besides, acute traffic congestion adds to high in-cabin thermal loads caused by solar irradiation and the effects of in-cabin thermal insulation. According to [29,30,31], in-cabin thermal load determines the energy consumption in vehicles, which applies significantly to PVCs in the tropics. Moreover, besides the existential effects on total vehicle heat load due to ambient load, HVAC load, engine load, exhaust load, and metabolic load, PVCs in the tropics are prone to significant solar thermal load by soaking and heat gains (consequently, rises above in-cabin temperature level ranging from 15 °C to 20 °C) [32]. Considering that in many developing tropics, public mass transits are densely occupied, high metabolic load (given that human heat load, both latent heat and sensible heat, constitutes an average of 105 watts per hour per person [33]) will impact the thermal and IAQ parameters of PVCs. The risk of occupancy density affects IAQ parameters; hence, there is a dire need for a cursory analysis of ventilation settings in PVCs, including its effect on the spread of pathogenic agents as reported in [28]. This reinforces the current interest in studying the IEQ of tropical PVCs. Thus, enhancing optimal thermal performance (thermal loads and thermal comfort) in tropical PVCs will benefit the energy, cost, and sustainability agenda.
These inherent risks of commuter exposure to poor IEQ conditions can impact the socioeconomic situation. For instance, increased discomfort in mass transit vehicles may result in lower patronage. The prolonged exposure to poor IAQ in PVCs can impact health vis-a-vis absenteeism from work. The loss of man-hours may be linked to traffic delays and health risks. Infectious disease spread, loss of lives, and epidemics, as seen in the recent COVID-19 scenario, may also contribute to significant disease burdens. Furthermore, many studies in the tropics have reported high tolls of road traffic accidents (RTAs), reporting that thermal discomfort and poor IAQ contribute to RTAs [34], considering that vehicle IEQ impacts drivers’ behavior. Ensuring adequate IEQ in passenger transport is crucial for public health, community well-being, and safety. The high population density and increasing numbers in many developing tropical regions affect vehicle occupancy levels in passenger transport cabins. This scenario poses the risk of passengers and drivers experiencing unacceptable levels of thermal discomfort, noise disturbances, and poor air quality—whether in closed cabins or naturally ventilated vehicles exposed to ambient air pollution. Also, many developing tropical countries have poor vehicle and road infrastructure [12], which increases risk and exposure to poor IAQ and AC. Additionally, as reported by [26,28], the prevalent vehicle conditions associated with poor maintenance, a high number of imported second-hand vehicles in poor condition combined with defective roads, heavy traffic, and insufficient regulation of vehicle and industrial emissions, significantly increase the risk of commuters being exposed to IEQ in developing tropical regions.
Regarding the survey of relevant previous reviews on IEQ parameters in PV in tropics or developing countries, one study focused on personal exposure and IAQ parameters in Asian countries [35] while recent studies from China were on thermal comfort models [4] and human thermal sensations [36]. They have acknowledged that physiological and physical parameters determine thermal comfort and sensations, including the effects of the inhomogeneity of vehicular ME, which contributes to transient thermal states. Other reviews have addressed IAQ in vehicles. Some common findings have acknowledged ventilation settings and air filtration, occupancy density, vehicle speed, route peculiarities, air quality and vehicular emissions (fuel type), and vehicle age and engines as common factors that impact vehicle IAQ [37,38,39]. Also, particulate matter (PM), carbon oxides, air bacteria, fungi, high molecular weight plasticizers, novel brominated flame retardants, and organo-phosphate flame retardants were reported by [39] to negatively affect car air quality. Notably, only the study for exposure in vehicles of Asian countries seemed most relevant in conclusions to the current SLR focus on tropics, since several Asian countries aligned with tropical context [35]. Their findings showed existential commuter exposure risk in vehicles considering the WHO short-term (24-h) exposure limits of 15 μgm−3 for PM2.5 and 45 μgm−3 for PM10. The reported pollutant ranges in the reviewed studies were PM10 (21–503 μgm−3), PM2.5 (12 to 370), PM1 (15 to 222 μgm−3), CO2 (414–1574 ppm), and TVOC (77–101 μgm−3) in buses. Also, pollutant ranges for taxis and cars were PM10 (34 to 408 μgm−3), PM2.5 (from 4 to 356 μgm−3), PM1 (16–182 μgm−3), CO2 (1515 to 356 ppm), and TVOC (0 to 69.1 ppb), including tropics like Malaysia, Thailand, Vietnam, and India besides other Asian countries [35]. They also found that elevated pollutant exposure levels in subways and trains could be associated with densely populated areas. Their referenced VOCs limit was 50 ppb by WHO, but, for CO2 limits, many studies have followed the ASHRAE 55 [40] recommendation that CO2 should not exceed 1000–1200 ppm in indoor spaces.
To the authors’ knowledge, no studies had collectively examined the IEQ of PVs in tropical countries during this SLR. Other reviews on IEQ parameters in tropical and subtropical regions have focused on indoor spaces in buildings. Therefore, the primary aim of this SLR was to investigate accessible, peer-reviewed scientific IEQ studies published between 2000 and 2024, which are explicitly related to passenger transport micro-environments in tropical contexts.
2. Materials and Methods
The current SLR follows the PRISMA guidelines [7], which outline specific inclusion and exclusion criteria for selecting a secondary group of articles from a primary database. This research focused on IEQ parameters in passenger transport vehicles, particularly in tropical and subtropical regions, including sub-Saharan African (SSA) countries. These regions have been notably underdeveloped and understudied regarding IEQ (including IAQ, thermal comfort, noise, and lighting), lacking adequate awareness, regulations, interventions, and sustainable measures. Table 1 presents an overview of the research questions (R1, R2, R3, and R4 listed in Table 1) addressed by the SLR. At the same time, Figure 1 summarizes the SLR phases and protocols followed to achieve the report, conclusions, and recommendations accordingly.

Table 1.
The specific SLR research questions.
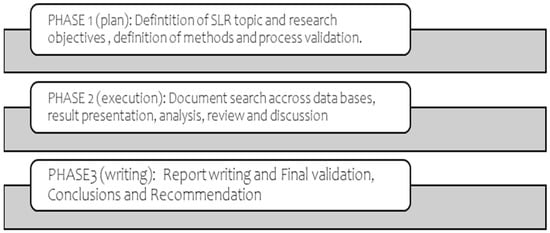
Figure 1.
The sequence of phases and steps followed in the SLR process.
2.1. Search Protocol and Strategy
Based on prior knowledge and expertise of the authors on the SLR subject area, a preliminary search was conducted in September 2024 using a string of relevant keywords; (“indoor climate” OR “indoor environmental quality” OR “indoor air quality” OR “indoor pollution” OR particulate matter “thermal comfort” OR “thermal sensation” OR “Noise” OR acoustic comfort OR “visual comfort*”) AND (vehicle OR “in-vehicle” OR “in-cabin” OR “transport micro-environment OR bus OR train OR passenger cabin OR passenger car” OR “transport vehicle”) AND (“developing tropic*” OR “developing tropic* country*” OR “tropic* country*” OR tropic* OR “Sub-Saharan country*” OR “sub-Sahara*” OR “sub-tropic*” OR “Sub-Sahara* Africa*” OR “Hot-humid climate*” OR “hot and humid climate*” OR “tropic* climate” OR “Hot climate*”) AND NOT (building* OR “outdoor environment*” OR “school building*” OR classroom* OR “office building*” OR “hospital building*” OR home* OR “residential buildings” OR “commercial building*”) across the databases Scopus (SC), Web of Science (WOS), and Science Direct (SD) to evaluate in overview the accessible scientific literature regarding the subject area.
The authors formulated Table 2, focusing on key aspects of IEQ, particularly the four main parameters, IAQ, TC, AC, and VC, in the context of tropical countries’ PTV. The goal was to prioritize journal articles. However, considering the risk of low publication article outcomes for the SSA region, the SLR has included peer-reviewed conference articles, published technical articles, and book chapters according to the SLR scope. Also, further search was conducted in the WOS, SD, and EBSCO following their respective advanced search constraints, still implementing the validated keyword search strings used in the SC database.
Table 2.
The SLR search string.
Table 2 shows the search syntax implemented in the SC and EBSCO databases according to the advanced search constraints. Supplementary Materials File S1 presents the modified search protocols for the SD and WOS databases based on the respective constraints for keywords and Boolean, compared to the search syntax of the SC database. In WOS, the search was implemented twice, as though one-half of what was the previously defined single search string was used for the SC database. Notably, in SD, Boolean usage was limited to eight for a single string in the search syntax, hence implementing 62 search strings.
2.2. Inclusion and Exclusion Criteria
Following the PRISMA guidelines for SLR [7], relevant inclusion and exclusion criteria were defined, focusing on the type of publication, language, publication year, and the relevance of the study to the defined SLR topic, particularly studies on IEQ in tropical climates. The results from each of the four databases were individually screened for duplicates, and irrelevant documents were removed based on the predefined inclusion and exclusion criteria for the SLR. Only documents published in English between 2000 and 2024 were considered. This date range was chosen to capture the most recent and relevant research, reflecting advancements in IEQ while ensuring an adequate body of literature for analysis. After duplicates were removed and irrelevant documents excluded based on their titles, a further evaluation was conducted using the full document titles, abstracts, and keywords. A second screening phase was then applied to the combined results from all databases, eliminating duplicates and leaving only a reduced set of relevant documents for the final evaluation. The authors conducted this final phase of screening. Given the paucity of data or scientific articles regarding developing tropics and SSA countries, the inclusion criteria were broadened to include book chapters, published technical papers, peer-reviewed conference proceedings, and original scientific articles and review papers. Table 3 summarizes the inclusion and exclusion parameters implemented during the document search across all databases.
Table 3.
The exclusion and inclusion criteria used in the SLR.
The PRISMA diagram in Figure 2 presents the results of the initial broad search across multiple databases, which yielded 2963 records. Despite the thoroughness of the initial search, a review of the retrieved articles led to the identification of relevant citations, including references to tropical Asia studies reported in a previous SLR paper [35]. Hence, the modifications introduced, as shown in the PRISMA (Figure 2), are like modifications implemented by [41] in their reported methods.
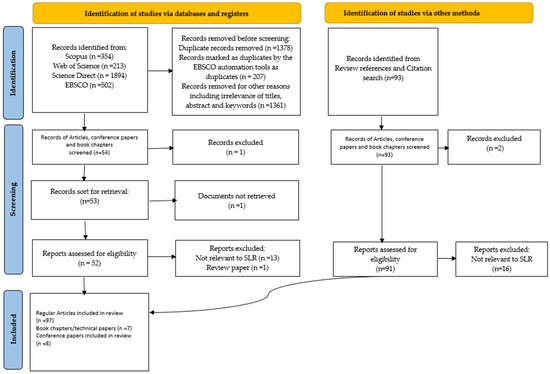
Figure 2.
The PRISMA diagram of databases search and selection of final studies.
Notably, 93 reports were identified via citation references. An initial screening led to excluding two review articles by abstract and titles. Furthermore, 16 reports were excluded after thoroughly scrutinizing the full texts for inadequate relevance to the current SLR criteria. A total of 34 reports of all 141 initially selected reports (after duplicate removals and preliminary screening by title and abstract) were screened during various stages, owing to the rigorous implementation of the applied SLR criteria until the final 113 articles, book chapters, and peer-reviewed conference papers. Moreover, some countries, such as China and Australia, have relevant studies on the subject matter of the SLR. Still, these studies have not been performed in cities with tropical or subtropical climates. These kinds of articles from such countries were also excluded owing to the criteria that the SLR focused on studies of tropical/subtropical cities and regions. Studies excluded were also field studies performed in clearly defined desert-hot climate regions.
3. Results
RQ1: The results are hereby presented in the table below. Table 4 presents 113 studies, including published peer-reviewed articles, conference papers, book chapters, and journal-published technical papers on the IEQ of PVCs in tropical/subtropical countries.
3.1. Visualization of Results
Figure 3 Presents, by map, the percentage distribution of the SLR studies found for each continent, of which nearly 81.4% were in Asia and about 1.8% in Oceania.
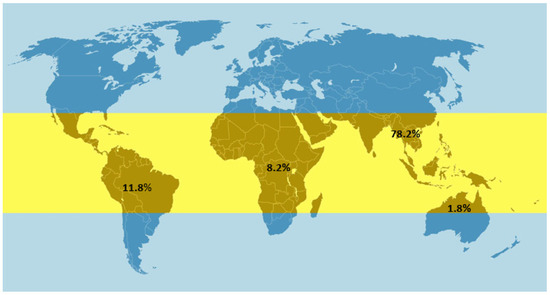
Figure 3.
Percentage distribution of studies in tropics and subtropics regions.
Figure 4 presents a graphical overview of study locations, IEQ parameters, vehicle types, and IAQ pollutants. Asia (78.2%) has the highest record of relevant studies regarding the IEQ in PVCs. South America (11.8%), Africa (8.2%), and Oceania (1.8%) were significantly lower. It is important to clarify that the percentages by continent were based on 110 of all 113 studies reviewed. Three studies [26,42,43] were excluded from the percentage report because they were cross-continental studies. Two of the studies [42,43] reported field surveys of countries situated on three continents while one study [25], had field studies from all four continents.
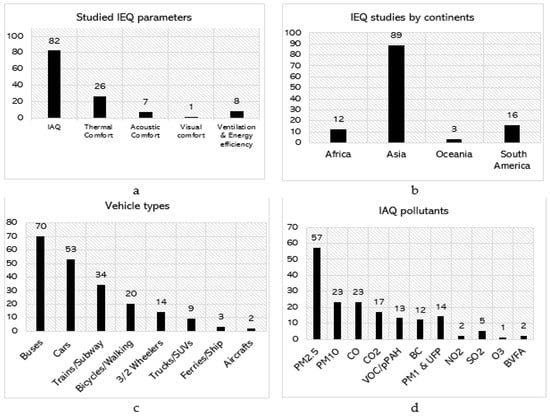
Figure 4.
Overview of study locations, IEQ parameters, vehicle types, and IAQ pollutants (a–d).
Figure 4a presents the frequency of IEQ parameters studied so far, affirming that IAQ has been most studied in the reviewed literature but visual comfort (lighting parameters) has been least studied. In Figure 4b, corroborates the percentile distribution of studies by continents presented earlier in which Oceania, Africa and South America had significantly low records accordingly. However, the records for Oceania implied studies found in Australia for tropical cities since several regions in the Oceania continent are not tropical or subtropical. Notably, the comparative implications by population density suggest that Africa, which includes populous developing tropical countries (DTCs) such as Nigeria, DRC, Tanzania, Uganda, Angola, and Kenya, to mention a few, records poorly for IEQ studies in PVCs found. In Figure 4c, we observe that buses, cars and train have the highest frequency in studies unlike ferries and aircrafts which were the least to have been studied in the reviewed literatures. Finally, as shown in Figure 4d, considering only IAQ pollutants, PM2.5 was the most studied, whereas NO2, bacteria, viruses, fungi and allergens (BVFA), SO2, and O3 pollutants were the least, accordingly. The frequency of studies that addressed PM10 and CO was the same. The frequency of studies that addressed other pollutants is comparable, ranging from 12 to 17 studies.
Table 4.
Summary of the Reviewed Study.
Table 4.
Summary of the Reviewed Study.
| Authors | Title | Year | Study Location | Vehicle Type | Method | IEQ Parameters | Occupant | Ventilation | Standard | Main Findings |
|---|---|---|---|---|---|---|---|---|---|---|
| [44] | In-cabin Particulate Matter Exposure of Heavy Earth Moving Machinery Operators in Indian Opencast Coal Mine | 2024 | India | 3 Heavy earth moving machinery (HEMM): dumper, shovel, and drill | Real-time Experimental measurements | The study measured IAQ parameters: PM10, PM2.5, and PM1. | Driver | Air-conditioning with internal circulation (AC + IC) and non-air-conditioned (NAC) | NA | The study found that in-cabin PM exposure was highest in drills (1992 μg/m3), followed by shovels and dumpers (600–650 μg/m3). HEMM type influenced exposure, with AC cabins reducing in-cabin PM levels by approximately 50% and lowering operator exposure by 21%. |
| [45] | In-car occupants’ exposure to airborne fine particles under different ventilation settings: Practical implications | 2024 | Singapore | Sedan car | Real-time Experimental and CFD | The study measured IAQ parameters: CO2 (ppm), PM2.5, Ta, RH, Air Speed | Driver | window open (WO), Windows closed (WC) + AC-IC and WC+ air-conditioning | NA | The study found AC-IC and AC-EC settings reduced PM2.5 levels by 67% and 56%, respectively, compared to NV mode. Open windows increased exposure, while hybrid AC with closed windows minimized it. Back passengers faced higher PM2.5 in AC + WO settings. |
| [46] | Air Pollution Inside Vehicles: Making a Bad Situation Worse | 2023 | Thailand | Sedan (4-door) and Pickup trucks (2-door and 4-door). | Real-time Experimental measurements | IAQ Measured: PM2.5 | Driver | Four conditions of WC and WO in dynamic and stationary with Fan and AC for all conditions. | WHO, AQG, Thailand. | The findings revealed mean PM2.5 levels were higher for front seats (72 μg/m3) than for back seats (49 μg/m3). Levels peaked at 124.5 μg/m3 during WC and stationary mode, exceeding applied standards. High PM2.5 exposure highlights the need to limit in-vehicle smoking to reduce second-hand smoke (SHS) risks. |
| [47] | In-vehicle and pedestrian exposure to carbon monoxide and volatile organic compounds in a mega city | 2017 | Nigeria | Cars, buses, and Bus Rapid Transit (BRT) | Experimental measurements | The study measured IAQ Measured: CO and VOCs | commuters | NA | NA | The study found average CO levels (4.40–39.78 ppm) were highest in cars, 1.36 times higher than buses, 2.17 times higher than BRT, and 3.67 times higher than pedestrians. VOCs ranged from 0.00 to 0.39 ppm, with vehicle commuters more exposed than pedestrians. |
| [48] | Improving cabin comfort with smart auto-flap HVAC control | 2023 | India | Sedan car | Experimental measurements | The study measured Indoor Air Quality parameters: CO2 and PM2.5 | Passengers and Driver | Only AC but varied for IC and EC settings | ASHRAE, WHO and OSHA | The study found that HVAC in IC mode reduced PM levels but raised CO2 (500–4000 ppm), while EC mode lowered CO2 but peaked PM near 350 μg/m3. IC mode with SCL intervention reduced PM to below 60 μg/m3. |
| [49] | Noise Exposure Inside a Passenger Car Cabin in Tropical Environmental Condition | 2017 | Malaysia | truck | Experimental measurements | The study measured Noise level: Sound pressure level (SPL) | Diver | NA | ISO 51228 [50] | The study found that SPL ranged from 44 to 49 dB(A) in vehicles. Noise levels were higher on dirt roads (55–75 dB(A)) than on tarmac (55–68 dB(A)), increasing with speed. A smart HVAC flap improved cabin comfort. |
| [51] | Challenges in evaluating PM concentration levels, commuting exposure, and mask efficacy in reducing PM exposure in growing, urban communities in a developing country | 2015 | Indonesia | Sedan (car), motorcycle and Minibus (“Pete-Pete”) | Experimental measurements | IAQ Measured: PM2.5 and PM10 | commuters | NV (for the minibuses) and AC (in Cars) | WHO | The study found surgical masks to be the most effective, reducing PM2.5 by 30% and PM10 by 71%. Cars had the lowest PM levels, and minibuses and motorcycles had the highest. Younger children were most vulnerable to PM exposure, with males having higher inhalation rates. |
| [1] | Indoor Environmental Quality Assessment of Train Cabins and Passenger Waiting Areas: A Case Study of Nigeria | 2024 | Nigeria | Trains | Experimental measurements | IAQ, TC, AC, VC, Measured: CO2, RH, To, SPL, PM, VOCs, NO2 and Illuminance, air changes per hour (ACH) | Passenger | AC (closed cabin and curtains) | EN16798-1 [52], EN13272 [53], ASHRAE, OSHA, WHO, NESREA. | The findings indicate that indoor climate, noise, and illuminance were deficient in 9 of the 15 trains surveyed. All Indoor Environmental Quality (IEQ) parameters revealed significant gaps, with inadequate ventilation. PM levels exceeded the referenced limits, suggesting insufficient filtration and ACH in the trains. |
| [54] | Assessment of Thermal Comfort in a Car Cabin Under Sun Radiation Exposure | 2018 | Malaysia | Sedan car | EM | The study measured TC parameters: Solar irradiance, Ta, RH | NA | WC, partially Open windows by 20 mm (about 0.79 in), varied shading conditions | DOSH, Malaysia and IAE, Singapore | The study found higher interior temperatures in unshaded parking, with M2 reaching 57.1 °C. Shaded parking had the highest relative humidity (57.7%), while M2 had the lowest at 22%. |
| [55] | Mite and cat allergen exposure in Brazilian public transport vehicles | 2004 | Brazil | Buses (public buses) and sedans (taxis) | EM | The study measured IAQ parameters such as dust and Indoor allergens like Dermatophilosis | Passenger and driver | NV and AC ventilation | NA | The study found high mite allergens across all vehicles. AVBs had higher Der p 1 (4.3 μg/g) and Der f 1 (2.4 μg/g) than NVBs. Fel d 1 levels (1.5–1.6 μg/g) were consistent across buses, while taxis posed allergenic risks, making public transport allergen reservoirs contributing to indoor contamination. |
| [56] | Passengers’ Thermal Comfort in Private Car Cabin in Hot Climate | 2018 | Egypt | Sedan (simulated) | Computational fluid dynamics | TC and HVAC systems Measured: Ta, solar irradiation, PMV, PPD, AV | NA | AC | ASHRAE 55 [57] and ISO 7730 [58] | Using CFD the study investigated airflow patterns and TC with the effect of solar emission in car cabins. PPD and PMV are decreased with an increase in discharge angles. Also, PMV and PPD parameters were used to evaluate the discharge Va, and angle effects in-cabin. They concluded that a bigger air flow rate at the same Ta enhances TC, and discharge orientation affects TC |
| [58,59] | Development of novel control strategy for multiple circuit, roof top bus air conditioning system in hot humid countries | 2008 | Malaysia | Bus (simulated bus) | EM | TC, HVAC control systems, and Energy saving/cost. RH, Ta, Pressure, and Air flow rate. | NA | AC (Varied settings) | ASHRAE | The study developed an automatic controller for a multiple-circuit AC system in Malaysian buses, achieving 31.6–51.4% energy savings, $656 annual cost savings, and PMV (0.66–0.07) with PPD (15.3–5.1%), maintaining thermal comfort better than conventional systems. |
| [19] | Assessment of thermal comfort parameters in various car models and mitigation strategies for extreme heat-health risks in the tropical climate | 2020 | India | Sedan, SUV, and Hatchback | EM | IAQ and TC Measured: CO2, RH, Ta, CO, mean radiant, Tr PMV and PPD | Virtual occupant | AC and WC | ASHRAE 55, EN 15251 [60] ISHRAE [61] | The study found CO, Ta, and Tr exceeded comfort limits in all vehicle models. PMV values (SUVs: 8.36–16.75, hatchbacks: 8.54–17.38) were inadequate per ASHRAE standard but met ISHRAE standards, highlighting thermal discomfort. |
| [25] | Aerosol influenza transmission risk contours: A study of humid tropics versus winter temperate zone | 2010 | Costa Rica, El Salvador, Nicaragua, Panama, Peru, Thailand, Singapore, New Guinea, Australia. | Sedans, buses, aircraft, and buildings | EM | IAQ, Measured: T and RH. | Passengers and patrons | AC, WC, and WO | NA | The study assessed contagion risks in tropical buildings and transport modes. Old taxis and new cars had low risks due to efficient HVAC systems. Luxury buses posed higher risks from in-cabin aerosols, while aircraft had the lowest risk due to short exposure times and effective ventilation. |
| [62] | Enhancement of Thermal Comfort Inside the Kitchen of Non-Air-conditioned Railway Pantry Car | 2020 | India | Train (kitchen Pantry cars) | EM and NS via CFD | TC, ventilation and energy efficiency Measured: Ta, globe temperature (Tg), Va, RH | Chefs | NAC, Exhaust Fans, Carriage fans and Air-vent | ASHRAE | The study developed a Standard Effective Temperature (SET index (28.6–30 °C) for train pantry kitchens using CFD. An improved design with optimized ventilation and air temperature significantly enhanced thermal comfort during cooking. |
| [29] | Indoor thermal management of a public transport with phase change material (PCM) | 2023 | Bangladesh | three-wheeler | EM and NS | Thermal comfort Measured: Ta | passengers | NAC, | NA | The study evaluated PCM (sodium sulfate decahydrate) in three-wheelers, achieving temperature reductions of 3.8 °C (single layer) and 7.5 °C (double layer). PCM reduced interior temperatures by 4 °C but was ineffective with occupants or engines running, suggesting additional PCM layers near engines for better control. |
| [63] | Thin Ceiling Circulator to Enhance Thermal Comfort and Cabin Space | 2019 | Japan | Sedan (compact 3-row seaters) | EM and NS via CFD | TC and ventilation parameters Ta, RH, radiation, and Va solar radiation, vehicle speed. | Thermal manikins | AC and circulator and air blower | NA | The study evaluated a new circulator, improving rear-seat thermal comfort by enhancing air distribution. CFD and experiments showed increased AV (+0.3 m/s), reduced temperature (−1.4 °C), improved thermal sensation (~1.5 points), and 30% height reduction for more cabin space. |
| [31] | In-Situ Studies on the Effect of Solar Control Glazings on In-Cabin Thermal Environment in Hot and Humid Climatic Zones | 2020 | India | Two sedan model vehicles | EM | Thermal comfort Measured: Va, RH, Ta, Tg, solar irradiance. | NA | NA | ISO 7726 [64] and ISO 14505 [65] | The study evaluated solar thermal load control via glazing, finding reductions in Ta (2–4 °C), Teq (4–8 °C), cooling time (5–7 min), and heating time (11–16 min). Absorbent glazing was more cost-effective, lowering Ta, Tr, and Teq effectively. |
| [30] | Environmental conditions driven method for automobile cabin pre-conditioning with multi-satisfaction objectives | 2022 | Saudi Arabia. | sport utility vehicle (SUV) | EM and MLA | IAQ, TC, and Energy consumption solar radiation intensity, RH, and atmospheric temperature. | NA | AC | NA | The study developed a comprehensive evaluation index (CEI) to assess thermal environments, achieving 92.3% accuracy with a Cubic SVM algorithm. Tcabin was highest during decreasing solar radiation. The CEI integrated PMV, temperature, air quality, and energy efficiency for passenger satisfaction evaluation. |
| [32] | Improvement of AC System for Bus with Tropical/Hot Ambient Application | 2023 | Kuwait, KSA, Qatar and UAE | Bus | EM and NS via CFD | TC and AC efficiency Measured: irradiance, in cabin Ta and Va | Thermal manikins | AC (recirculation mode) | NA | The study’s three DOE experiments improved heat load reduction (3%) and airflow (1.2 m/s). DOE1 optimized duct layouts, boosting air discharge by 20%. DOE2 enhanced airflow control (1–10%) with a blower and BLDC motors. DOE3 added insulation and solar green glass. |
| [66] | Improvements in energy saving and thermal comfort for electric vehicles in summer through coupled electrochromic and radiative cooling smart windows | 2024 | China | EV—Sedan | EM, NS and MM | TC and energy savings Measured: Ta, RH, solar radiation (surface, direct, and diffused) | NA | AC | ASHRAE-55, GB7258 [67] | The study found SET* higher for front passengers and near windows. Electrochromic coloration targeted 26 °C SET*, saving 762 W. Radiative cooling lowered TWS by 10.7 °C and SET* by ~7 °C. Scattered solar radiation significantly increased cooling loads. |
| [68] | Impact of Different Types of Glazing on Thermal Comfort of Vehicle Occupants | 2020 | India | Hatchback -sedan | EM | Thermal comfort Measured: Ta, Solar radiation, RH | 4 passengers | AC (recirculation) | IS 2553 [69] | The study evaluated spectral transmissivity and heat transmittance of various vehicle glazing options. The dark grey glass showed the highest IR and UV blocking, followed by dark green and green. For Tropical India, recommended configurations included green glass for back doors, WS IR cut for windscreens, and dark green for windows. |
| [70] | Numerical Evaluation of Vehicle Orientation and Glazing Material Impact on Cabin Climate and Occupant Thermal Comfort | 2017 | India | Sports Utility vehicle (SUV) model | NS (1D/3D CFD) | TC Measured: Ta, irradiance Including transmissivity, absorptivity, conductivity, density | NA | AC | ASHRAE | The study evaluated six vehicle heat load cases, finding thermal sensation ranged from slightly warm (0.37) to slightly cool (−0.58), improving with IRR glazing and closed blinds. North-facing vehicles had higher solar heat loads than east-facing, with AC pull-down cycles simulated at 50, 100, and 0 km/h. |
| [42] | Potential health risks due to in-car aerosol exposure across ten global cities | 2021 | Bangladesh, India, China, Brazil, Egypt, Columbia, Iraq, Ethiopia, Malawi and Tanzania | Sedan | EM | IAQ and PE Measured: PM2.5 (PM ≤ 2.5 μm) | NA | WO, WC+ Fan and WC+ AC-IC mode | WHO | The study evaluated the relationship of exposure to PM2.5 in 10 global cities, highlighting hotspots like Dar-es-Salaam (81.6 μg/m3), Blantyre (82.9 μg/m3), and Dhaka (62.3 μg/m3), with significant health burdens. It found correlations between pollution, socioeconomic disparity, and economic losses in low-GDP cities. |
| [71] | Experimental Study on the Improvement of Thermal Comfort Inside a Car Cabin | 2023 | Malaysia | sedan | EM | Thermal comfort Measured: Ta in cabin, Va | NA | Cooling fans, WO, | NA | The study found cooling fans reduced in-cabin Tcabin by 4.8 °C in S1 (WC + Fan), but temperatures rose quickly. S2 (WO + fan + green blankets) achieved a stable 3 °C drop, while S3 (shaded windscreen + fans) showed a stable Ta reduction, maintaining effectiveness. |
| [72] | A pilot study on thermal comfort in Indian Railway pantry car chefs | 2019 | India | Railway pantry car | EM and SM | Thermal comfort Measured: Ta, Tr, Tg, Va, RH | chefs | NAC and AC | ASHARE 55 and BEE, India | The study found higher thermal discomfort in non-AC rail pantry cars (PMV: 2.93, PPD: 99%) versus AC cars (PMV: 2.17, PPD: 84%). Cooking temperatures exceeded ASHRAE limits, with 86% of chefs reporting discomfort and warm sensations. |
| [73] | Study on Human Comfort of Military Vehicles in Malaysian Tropical Environment | 2023 | Malaysia | Military vehicles (logistic, utility, and armored) | EM | Human comfort; noise, vibration, and heat stress | NA | NA | ISO 5128 DOSH, [50] | The study assessed military vehicles for noise (76.4–84.3 dB(A)), WBV (0.4–0.9 m/s2), and heat stress, highest in logistics vehicles. All were within comfort limits, with utility vehicles rated most comfortable. |
| [74] | Improving microbial air quality in air-conditioned mass transport buses by opening the bus exhaust ventilation fans | 2005 | Thailand | Buses | EM | IAQ Measured: bacterial and fungal counts | Passengers and drivers | AC, Opened exhaust ventilation fans (OEVF) | WHO | The study found bacterial and fungal counts significantly lower in buses with OEVF (83.8 ± 70.7, 38.0 ± 42.8 cfu/m3) than without (199.0 ± 138.8, 294.1 ± 178.7 cfu/m3). Among 39 AC buses, 17 met acceptable microbial levels (<500 cfu/m3), while 4.6% exceeded limits. |
| [18] | Variation of PM2.5 and inhalation dose across transport microenvironments in Delhi | 2024 | India | Bicycle, sedan, hatchback, auto-rickshaws, MTW, buses, metro. | EM | IAQ Measured: PM1-PM10, RH, Ta, Pressure, Wind Speed, Direction. | Passengers and drivers | AC and NAC, NV, | NA | The study found PM2.5 highest in bicycles (59.8 μg/m3) and metro 55.7 μg/m3, lowest in AC cars (40.1 μg/m3). Exposure: Bicycle Metro MTW non-AC modes, Cycling had the highest inhalation doses, worsened during peak hours and hotspots. |
| [75] | Improving Thermal Comfort and Ventilation in Commercial Buses in Nigeria in COVID-19 Era | 2022 | Nigeria | Minibus and big bus | EM | Thermal Comfort Measured: Ta, RH, Va | Passengers and drivers | NV, WO, door (opened) | ASHRAE 55 | The study found peak in-cabin temperatures of 40 °C due to open windows, with heat load decreasing as air inflow increases with bus speed. Overcrowding (60–80 passengers) contributed to higher heat. |
| [76] | Evaluating the influence of ambient conditions in the cooking space of railway pantry car using selected thermal indices and physiological parameter | 2024 | India | Railway pantry car (RPC) | EM | Heat stress index Measured: | chefs | NA | The study found mean heat stress indices: UTCI (37.77 °C), WBGT (30.42 °C), DI (30.05 °C), TSI (33.21 °C), and HI (48.53 °C), indicating inadequate thermal conditions for chefs in RPC environments. | |
| [43] | In-car particulate matter exposure across ten global cities | 2020 | Bangladesh, India, China, Brazil, Egypt, Columbia, Iraq, Ethiopia, Malawi and Tanzania | Sedan | EM | IAQ and PE Measured: PM ≤ 2.5 μm (PM2.5) and ≤10 μm (PM2.5–10) | Driver and passengers | FAN, WO and WC (fan-on and recirculation) | WHO | The study found PM2.5 exposures lower during off-peak hours, with WO settings showing the highest PM2.5 and PM10 levels. Fan-on and recirculation modes reduced exposure, highlighting the influence of hotspots, journey time, and in-car PM on inhaled doses. |
| [77] | Effect of ambient concentration of Carbon monoxide (CO) on the in-vehicle concentration of Carbon monoxide in Chennai, India | 2020 | India | Sedan and bus | EM | IAQ and PE Measured: Carbon monoxide (CO) | commuters | AC + REC, AC-FA, and WO | NAAQS, India. | The study found in-vehicle CO levels (mg/m3) lowest in AC-IC (2.4) and highest in WO (5.7). AC + REC minimized CO ingress, which is ideal for short trips, while AC + EC or WO is suitable for long journeys. |
| [78] | Exposure to fine particulate, black carbon, and particle number concentration in transportation microenvironments | 2017 | Colombia | Walking, cycling bus, car, taxi, motorcycle and Bus Rapid Transit (BRT) | EM | IAQ and PE Measured: PM2.5, black carbon, and number of sub-micron particles | commuters | AC + REC, WO, NV | NA | The study revealed the highest PM2.5 and eBC levels in diesel-powered BRT buses. Pedestrians experienced three times higher doses in street canyons, while BRT buses had the highest pollution exposure. |
| [79] | Personal Exposure to PM2.5 in the Massive Transport System of Bogotá and Medellín, Colombia | 2020 | Colombia | BRT (diesel), metro (electric), cable metro, metro plus (CNG trams). | EM | IAQ and PE Measured: PM2.5 | commuters | AC, WC and WO (90% WO) | WHO | The study found that mean PM2.5 levels and personal dose in diesel-powered TM vehicles were 167 μg/m3 and 2.3 μg/min, respectively, compared to 41 μg/m3 and 0.53 μg/min in SITVA (electric/CNG). TM users faced four times higher doses than SITVA, while tramcars had the lowest exposure. |
| [80] | Variations in individuals’ exposure to black carbon particles during their daily activities: a screening study in Brazil | 2018 | Brazil | Sedan, bus, walking | EM | IAQ and PE Measured: BC | 12 volunteers | WO and WC | NA | The study found transport modes contributed 7% to total exposure, with highest BC levels in buses (5.80 μg/m3) and walking (5.34 μg/m3). Transport accounted for 17% of exposure. |
| [81] | Commuter exposure to black carbon particles on diesel buses, bicycles and on foot: A case study in a Brazilian city | 2017 | Brazil | bus, walking and bicycle | EM | IAQ and PE Measured: BC | Commuters | WO and WC | NA | The study found mean BC levels of 9.6 μg/m3 (buses) and 5.1 μg/m3 (walking/bicycling), with bus peaks at 60.0 μg/m3. Cyclists (2.6 μg) and pedestrians (3.5 μg) had higher inhalation doses over 1.5 km than bus commuters. |
| [82] | Commuter exposure to particulate matters in four common transportation modes in Nanjing | 2019 | China | Subway cabins and stations, bicycles, buses, and walking | EM | IAQ and PE Measured: CO2, PM1 and PM2.5 | Commuters | HVAC | NA | The study found subway cabins had the lowest PM levels (PM1: 38.3 μg/m3, PM2.5: 54.4 μg/m3), while bus cabins had higher levels (PM1: 56.0 μg/m3, PM2.5: 74.4 μg/m3). Pedestrians had the highest PM1, with no seasonal impact on PM levels. |
| [83] | Exposures to multiple air pollutants while commuting: Evidence from Zhengzhou, China | 2020 | China | bike, taxi, subway and bus | EM | IAQ and Personal exposure. Measured: PM2.5, PM10, SO2, CO, O3 and NO2, Ta, RH | Commuters | WC, AC and NAC | NA | The study found PM2.5 inhalation doses (mg): taxi (3120), bus (12,636), bike (32,643), subway (19,500). PM2.5 and PM10 levels peaked in bikes and subways, with taxis and buses showing higher mean PM, O3, SO2, and CO levels. |
| [84] | Bus commuter exposure and the impact of switching from diesel to biodiesel for routes of complex urban geometry | 2020 | Brazil | BRT buses | EM | IAQ and PE Measured: PM2.5 | Commuters | WC settings | NA | The study found that mean in-cabin PM2.5 levels in diesel buses were 20.1 ± 20.0 μg/m3, while for biodiesel buses they were 3.9 ± 26.0 μg/m3. The Particle Number Concentration (PNC) was lower in diesel buses (43.3/cm3) compared to biodiesel buses (56.6/cm3). |
| [85] | Car users exposure to particulate matter and gaseous air pollutants in megacity Cairo | 2020 | Egypt | Sedan car | EM | IAQ and PE Measured: PM2.5, PM10 NO2, CO | Commuters | WC, WO, AC and | NA | The study found PM10 (227 μg/m3) and PM2.5 (119 μg/m3) highest with windows open, exceeding AC mode. PM2.5 peaked in evening rush hours, showing coarser in-cabin particles. |
| [86] | Commuter exposure concentrations and inhalation doses in traffic and residential routes of Vellore city, India | 2020 | India | Bicycle, walking, motorbike, car, auto-rickshaw (AR), and bus | EM | IAQ and PE Measured: PM1, PM2.5, wind speed, RH and Ta | Commuters | WO | NA | The study found higher PM2.5 levels on traffic routes, with morning levels (212 μg/m3) exceeding afternoon (124 μg/m3) for buses. Motorbikes had the highest PM1 exposure (172 μg/m3), while active commuting modes had four to eight times higher inhaled doses than passive modes. |
| [87] | PM2.5 exposure in highly polluted cities: A case study from New Delhi, India | 2017 | India | auto-rickshaw (AR), cars and bus | EM | IAQ and PE Measured: PM2.5 and BC | Commuters | WC, WO | NA | The study found PM2.5 and BC levels (μg/m3) were higher in winter 489.2 than summer 53.9. Transport contributed most to BC, while cooking and cleaning increased PM2.5. |
| [88] | Environmental justice in the context of commuters’ exposure to CO and PM10 in Bangalore, India | 2014 | India | car, two-wheeler, bus, company vehicle and walk | EM and SM | IAQ and PE Measured: PM10, CO and RH | Commuters | WO, NAC, AC | NA | The study found two-wheelers had the highest PM10 375 μg/m3 and CO 5.4 ppm levels, followed by cabs. In-cabin pollutants stemmed from vehicular emissions and background PM10. |
| [89] | Probabilistic health risk of volatile organic compounds (VOCs): Comparison among different commuting modes in Guangzhou, China | 2018 | China | car, airbus, subway, and bicycle | EM | IAQ and PE Measured: VOCs | Commuters | AC, NAC | USEPA | The study found that the risk probability for bus, car, bicycle, non-AC bus, and subway exposure to pollutants greater than 10−6 was approximately 90% and 92%, respectively. Formaldehyde, benzene, and acrolein had the highest risk. |
| [90] | Health risk assessment and personal exposure to volatile organic compounds (VOCs) in metro carriages—A case study in Shanghai, China | 2016 | China | Metro carriages (trains) | EM | IAQ and PE Measured: VOCs (benzene, toluene, ethylbenzene, xylene) | Commuters | AC, NAC | WHO | The study found higher VOC levels in old metro carriages. Underground acetone and acrolein exceeded above-ground by 10%, rising with commuter density, reaching 26.2 μg/m3. |
| [91] | Investigation of volatile organic compounds exposure inside vehicle cabins in China | 2015 | China | Sedan cars | EM | IAQ and PE Measured: CO2, TVOC, CO and H2S | Commuters | No-fan + no-RC, fan + no-RC and fan +RC | NA | The study reported mean VOC levels (μg/m3): benzene (16.73), toluene (66.0), xylene (14.2), ethylbenzene 6.7, styrene (28.09), formaldehyde 16.4, acetaldehyde 12.4, acetone 20.6. VOCs were higher in new vehicles and leather interiors. |
| [92] | The commuters’ exposure to volatile chemicals and carcinogenic risk in Mexico City | 2005 | Mexico | Private car, microbus, bus, and metro | EM | IAQ and PE Measured: VOCs | Commuters | WO (microbus), WC (bus, car) | NIOSH, TO-11A | The study found lifetime carcinogenic risks highest in microbuses (3.1 × 10⁻⁵–4.0 × 10⁻⁵) and lowest in metros (1.3 × 10⁻⁵–1.7 × 10⁻⁵). VOC exposure was highest in cars. |
| [93] | Commuters’ exposure to PM2.5, CO, and benzene in public transport in the metropolitan area of Mexico City | 2004 | Mexico | Minibus, bus, metro | EM | IAQ and PE Measured: PM2.5, CO, and benzene | commuters | NA | USEPA | The study found that PM2.5 was mostly carbon (50%), with in-cabin levels ranging from 12 to 137 μg/m3. The highest levels were observed on buses during evening trips (137 μg/m3), followed by minibusses and metros. |
| [94] | Carbon monoxide levels in popular passenger commuting modes traversing major commuting routes in Hong Kong | 2001 | Hong Kong | bus, minibus and taxi | EM | IAQ and PE Measured: CO | Commuters | AC (buses) NAC (buses) | NA | The study found mean in-cabin CO levels of 1.8 ppm (bus), 2.9 ppm (minibus), and 3.3 ppm (taxi), influenced by breathing height. CO levels peaked on urban–suburban routes, with no significant differences between AC and non-AC buses. |
| [95] | Analysis of various transport modes to evaluate personal exposure to PM2.5 pollution in Delhi | 2021 | India | rickshaw, bus, metro, car and walking | EM | IAQ and PE Measured: PM2.5 | Commuters | AC | NAAQS | The study found the highest PM2.5 levels in rickshaws (266 ± 159 μg/m3) and the lowest in metros (72 ± 11 μg/m3). AC cars exceeded the 24-h NAAQS. Walking had the highest respiratory deposit dose, and rickshaws and non-AC cars. |
| [96] | Exposure to traffic-related particulate matter and deposition dose to auto rickshaw driver in Dhanbad, India | 2019 | India | auto rickshaw | EMand SM | IAQ and PE Measured: PM10, PM2.5 and PM1 | Drivers | NA | NA | The study found in-cabin PM levels were 3.3 times higher than ambient, with PM10 at 844 μg/m3 the highest. PM1 had the highest levels, causing body pain, eye irritation, and headaches in drivers. |
| [97] | On-road PM2.5 pollution exposure in multiple transport microenvironments in Delhi | 2015 | India | Bicycle, auto-rickshaw, two-wheeler car, bus, metro | EM | IAQ and PE Measured: PM2.5 | Commuters | AC and WO (car and bus) | NA | The study found on-road PM2.5 levels exceeded ambient levels by 10–40%, with cycling exposure nine times higher than AC cars. Ambient PM2.5 ranged from 130 to 250 μg/m3, highlighting significant exposure risks across modes. |
| [98] | A comparison of personal exposure to air pollutants in different travel modes on national highways in India | 2017 | India | Car (AC and non-AC) and bus | EM | IAQ and PE Measured: PM2.5, CO, and CO2 | commuters | AC + REC +WC and NAC+ WO | WHO | The study found that the mean PE for PM2.5 (μg/m3) was highest in cars (85.41 ± 61.85), followed by buses (75.08 ± 55.39), and AC cars (54.43 ± 34.09). CO exposures were highest in AC cars, while PM2.5 was lowest in these vehicles. |
| [99] | Effect of modes of transportation on commuters’ exposure to fine particulate matter (PM2.5) and nitrogen dioxide (NO2) in Chennai, India | 2019 | India | Bus, car, and motorbike | EM and SM | IAQ and PE Measured: PM2.5 and NO2 | Commuter | AC + WC (cars) | NA | The study found mean PM2.5 levels were highest for motorbikes (251 μg/m3), followed by cars (224 μg/m3) and buses (225 μg/m3). Motorbikes also had the highest PM2.5 exposure rate (2.00 μg/m3/min) and NO2 exposure (1.04 μg/m3/min). |
| [100] | Commuter exposure to Air Pollution in Newcastle, U.K., and Mumbai, India | 2014 | U.K and India | Bus, car, bicycle, and train, | EM | IAQ and PE Measured: PM10 and CO | Commuter | AC (taxi), non-AC (car) | NA | They found that Mumbai buses had the highest PM10 levels, 502.7 μg/m3, and NAC cars had the highest CO levels, 6.4 mg/m3, making overall pollution exposure higher than in Newcastle. |
| [101] | Traffic-related occupational exposures to PM2.5, CO, and VOCs in Trujillo, Peru | 2005 | Peru | Car (taxi) bus and Van | EM and SM | IAQ and occupational exposure: PM2.5, CO, and VOC: benzene/toluene | Driver and workers | NA | NIOSH, OSHA, ACGIH | They found bus commuters had the highest PM2.5 exposures (161 ± 8.9 μg/m3), followed by gas station attendants (64 ± 26.5) and office workers (65 ± 8.5). BTEX levels exceeded safe thresholds, with smokers at higher risk. |
| [102] | Coconut oil as phase change material to maintain thermal comfort in passenger vehicles | 2018 | Saudi Arabia | Sedan | EM | Thermal comfort Measured: Temperature | NA | NA | NA | Coconut oil as PCM can potentially lower Tcabin to ~15 °C enhancing in-cabin thermal climate depending on time, duration, and parking location. |
| [103] | Human Health Implications of Vehicular Indoor Air Pollution for Commuters in Selected Road Routes in Port Harcourt Metropolis | 2024 | Nigeria | Bus | SM | Surveyed IAQ and Noise and health risks | Drivers | NA | NA | The study found that 42.7% of respondents were exposed to in-vehicle pollutants for 1–5 h daily, 46.8% for 6–10 h, and 10.5% for over 10 h. Health impacts included cough, shortness of breath, respiratory infections, stress disorders, heart ailments, and pneumonia. |
| [104] | Indoor Environmental Quality: Sampling in One of the Sao Carlos’ Public Buses | 2016 | Brazil | Buses | EM | IEQ Measured: Ta, RH, noise, CO, CO2, PM2.5 and PM10 | Driver and passengers | NV via WO | NR:15 [105], NHO, CONAM, ANVISA and WHO | The study reported air temperature (17–38 °C), relative humidity (19–87%), and heat index (69–104 °F). CO2 ranged from 491 to 1959 ppm (mean: 920 ppm), and PM2.5 levels were 24–48 μg/m3, deeming bus environments unhealthy for drivers and collectors due to pollutants. |
| [106] | Personal exposures to particulate matter in various modes of transport in Lagos city, Nigeria | 2016 | Nigeria | cars, buses, Bus Rapid Transit (BRT), and walking | EM | IAQ and PE Measured: PM10 and PM2.5 | Driver and passengers | WO and NAC | NA | The study found mean PM10 and PM2.5 levels (μg/m3) highest in pedestrians (476.35 and 206.83) and exceeded WHO limits, with rush hour levels (PM10: 413.4, PM2.5: 167.35) posing significant commuter health risks. |
| [107] | Air pollutant concentrations and comfort index in commercial buses within Abeokuta Metropolis, South-Western Nigeria | 2024 | Nigeria | buses | EM | TC, IAQ and PE Measured: Ta RH, CO, PM2.5 and PM10. | Driver and passengers | WO and NAC | WHO and USEPA | The study found mean thermal parameters: Ta (35.6–36.0 °C) and RH (57.9–62.4%). Air pollutants exceeded WHO IAQ limits: CO (29.8–32.7 mg/m3), PM2.5 (25.3–44.2 μg/m3), and PM10 (108.3–117.4 μg/m3). |
| [108] | Study of Noise, Vibration and Harshness (NVH) for Malaysian Army (MA) 3-Tonne Trucks | 2014 | Malaysia | Military truck (3-tonne) | EM | Comfort: Noise Vibration and Harshness (NVH) | NA | Driver | The study found maximum vehicle speed at 60 km/h. Sound pressure levels were 65.5 dB(A) in idle mode and 73 dB(A) while moving. Vibration levels peaked at 4.28 m/s2 on the steering wheel during motion. | |
| [109] | Noise, Vibration and Harshness (NVH) Study on Malaysian Armed Forces (MAF) Tactical Vehicle | 2012 | Malaysia | 4 × 4 Troop Transporter vehicle | EM | Comfort: Noise Vibration and Harshness, whole body vibration and hand-arm vibration. | NA | Driver and passengers | OSHA | The study found tolerable sound pressure levels (SPL) at 84 dB(A) in the rear and 78 dB(A) in the front cabin at speeds of 0–90 km/h. Hand-arm vibration (HAV) remained below 1.5 m/s2, but whole-body vibration (WBV) exceeded 1.15 m/s2 for passenger 1 at 90 km/h. |
| [110] | Exposure to ultrafine particles and PM2.5 in four Sydney transport modes | 2010 | Australia | Train (electric), bus(diesel), ferry and automobile | EM | IAQ and PE Measured: UFP, PM1 PM2.5 | Commuters | NV (ferry) and AC (car, trains and buses) | NA | The study found the highest UFP (8.4 × 10⁴ particles/cm3) and PM2.5 (29.6 μg/m3) in buses, with ferries exposing occupants to 3.7 times more PM2.5. |
| [111] | Commuter exposure to particulate matter for different transportation modes in Xi’an, China | 2017 | China | Car, subway (trains and station, bus, walking | EM | IAQ and PE Measured: PM10, PM2.5, PM1 | Commuters | WC + AC, WC + AC +REC | NA | The study found lowest PM exposure in cars with WC + AC + REC (PM10: 11.83 μg/m3, PM2.5: 10.09 μg/m3), and highest while walking (PM10: 127.23 μg/m3, PM2.5: 71.59 μg/m3). PM exposure varied by mode and ventilation. |
| [112] | Particle exposure and inhaled dose during commuting in Singapore | 2017 | Singapore | Walking, subway bus, taxi | EM | IAQ and PE Measured: PM2.5, UFP, BC, PAHs, PN, CO, RH, Ta | Commuter | WC + AC (used in MRT, Bus, car), | NA | The study ranked exposure levels as walking > subway > buses > taxis. Sidewalks had the highest PM2.5 (36 μg/m3), PN (44,038 cm−3), and BC (6.7 μg/m3). Pedestrians inhaled 2.6–3.2 times more PM2.5 and UFP than subway commuters. |
| [113] | Daily personal exposure to black carbon: A pilot study | 2016 | Australia | Bus, train, sedan car, cycling and residential building, | EM | IAQ and PE Measured: BC | A person | WO, WC, FAN, AC + REC, | NA | The study found that the arithmetic mean 24-h BC exposure was 603 ± 1550 μg/m3, with a geometric mean of 306 ± 3.7 μg/m3. BC levels were highest in cars and non-AC buses, highlighting ventilation effectiveness in reducing in-cabin BC. |
| [114] | Black Carbon Personal Exposure during Commuting in the Metropolis of Karachi | 2022 | Pakistan | Motorbikes, auto-rickshaws (AR), cars, and buses | EM | IAQ and PE Measured: BC | Commuter | WO + FAN, NAC | USEPA | The study found that motorbikes had the highest BC exposure (26.9 μg/m3 peak-time), buses the lowest, and auto-rickshaws the highest inhalation doses, with commuting significantly contributing to daily BC exposure despite 87.6% time indoors. |
| [115] | Personal exposure to black carbon during commuting in peak and off-peak hours in Shanghai | 2015 | China | taxi, bus, subway, cycling and walking | EM | IAQ and PE Measured: BC | Commuters | WC + AC-REC (bus, taxi), WO+ NAC (taxi), AC (trains). | NA | The study found the highest mean BC exposure in subways (9.43 ± 2.89 μg/m3) and lowest while walking (5.59 ± 1.02 μg/m3). Inhalation doses and PE levels followed the same pattern: taxi < subway < cycling < bus < walking. |
| [116] | Heterogeneity of passenger exposure to air pollutants in public transport microenvironment. | 2015 | Hong Kong | Bus, trains, subway, termini, platforms, MTR. | EM | IAQ and personal exposure Measured: BC, CO, PM2.5 and UFP | Commuters | NA | NA | The study found higher mean PM2.5 and BC levels in buses than in MTR. Diesel buses had the highest BC and UFP levels. PE doses for PM2.5, BC, UFP, and CO was higher in buses. |
| [117] | Exposure level of carbon monoxide and respirable suspended particulate in public transportation modes while commuting in urban area of Guangzhou, China | 2002 | China | Bus, subway trains, and taxi | EM | IAQ and personal exposure Measured: CO, CO2 PM10, PM2.5 | Commuters | WC + AC and NAC (bus and taxi) | USEPA | The study found mean CO levels of 3.1 ppm in the subway. PM10 and PM2.5 levels were highest in non-AC buses (203 μg/m3, 145 μg/m3) and lowest in the subway (67 μg/m3, 44 μg/m3). The PM2.5/PM10 ratio was 76–83%. |
| [118] | Influences of commuting mode, air conditioning mode and meteorological parameters on fine particle (PM2.5) exposure levels in traffic microenvironments. | 2012 | China | bus, taxi (AC and non-AC) and metro, walking, bicycle, and motorcycle | EM | IAQ and personal exposure Measured: PM2.5, Ta, RH, Wind speed | commuter | WC + AC and WO + NAC | NA | The study found that mean PM2.5 levels (μg/m3) were highest for buses (75.9) and motorcycles (77.1), followed by bicycles (76.8), walking (74.1), taxis (56.8), and metro (27.9). On-road commutes had higher PM2.5 levels, reaching up to 76 μg/m3. |
| [119] | Comparisons of commuter’s exposure to particulate matters while using different transportation modes | 2005 | Taiwan | motorcycle, car, bus and MRT | EM | IAQ and personal exposure Measured: PM10, PM2.5, PM1. | Commuters | AC and NAC | NA | The study found the highest PM levels in buses (PM10: 69.6 μg/m3), with greater idling-driving differences for motorcycles (PM10: 5) than buses (PM10: 3), compared to cars and MRT. |
| [120] | Commuter exposure to particulate matter in public transportation modes in Hong Kong | 2002 | Hong Kong | bus, tram, public light bus, taxi, ferry, and Railway (3 types) | EM | IAQ and personal exposure Measured: PM10 | Commuters | AC and NAC | The study found that mean PM10 levels (μg/m3): AC bus (74), non-AC bus (112), subway (44), taxi (58), marine transport (50), railway (145), and road trams (175). The upper deck PM10 levels were lower than the lower deck. AC vehicles and railways were recommended over NAC options. | |
| [121] | Carbon monoxide levels measured in major commuting corridors covering different landuse and roadway microenvironments in Hong Kong | 2002 | Hong Kong | Sedan (light good) | EM | IAQ and PE Measured: CO | Commuters | AC and NAC | NA | The study compared in-vehicle to out of vehicle CO levels. The mean in-vehicle CO levels reported was tunnel (8.0 ppm) highway (1.5 ppm) on-road (2.4 ppm) on-road (2.4 ppm) in-vehicle (1.9 ppm). In-vehicle, variations were affected by ambient outdoor affirming the effect of ambient pollution in vehicle ME. Also, they found that the route and time of day affected indoor CO exposure levels. |
| [122] | Relationship Between Indoor Air Pollutants Exposure and Respiratory Symptoms Among Bus Drivers in a Malaysian Public University | 2023 | Malaysia | Bus (diesel-fueled) | EM and SM | IAQ and PE Measured: PM2.5, PM10 and NO2 and occupants surveying | Drivers | NA | OSHA, ICOP, Malaysia | The study found bus drivers had higher risks of respiratory symptoms than office workers: cough (OR = 2.5), chronic cough (OR = 2.2), and chronic phlegm (OR = 4.6). PM2.5 and PM10 were identified as key pollutant exposure determinants. |
| [123] | Nanoparticles on electric, gas, and diesel buses in mass transit buses of Bogotá Colombia | 2023 | Colombia | Buses (electric, CNG, and diesel), | EM | IAQ and PE Measured: nanoparticles of TRAP | Driver and passengers | NA | NA | The study found that nanoparticle levels in electric buses were 47% and 27% lower compared to diesel and CNG buses, respectively. PM sizes were smaller in BEVs. Mean nanoparticle levels and Lung-Deposited Surface Area were lowest in BEVs. |
| [124] | Exposure to particulate matter, CO2, CO, VOCs among bus drivers in Bangkok | 2012 | Thailand | Bus | EM and SM | IAQ and PE. CO, CO2, VOCs, Ta RH, M2.5 | Bus drivers | AC and NAC | WHO, ASHRAE, NAAQS | The study found higher CO2 levels but lower PM2.5 in AC buses, while NAC buses had lower CO2 and higher CO levels, reflecting outdoor air impacts. |
| [125] | Exploring the effects of ventilation practices in mitigating in-vehicle exposure to traffic-related air pollutants in China | 2019 | China | Sedan cars (mid-normal sized) | EM | IAQ and PE Measured: CO2, TRAP (PM2.5 and UFP) | Driver and passengers | AC + FA AC + REC, NV + AC + REC | NA | The study found higher mean in-vehicle PM2.5 levels on freeways (119 μg/m3) than on local roadways (93 μg/m3). UFPs averaged 97,227 cm−3 on freeways versus 42,829 cm−3 on local roads, highlighting significant TRAP exposure from polluted ambient air conditions. |
| [126] | The threshold effects of bus micro-environmental exposures on passengers’ momentary mood | 2020 | China | Bus | EM and SM | Indoor climate Measured: Noise, PM2.5, Ta, RH, Occupancy survey. | Passengers | AC + FA | WHO, GB 18883 [127] | The study reported averages: noise levels 71.7 dB, PM2.5 23.4 μg/m3, Ta 28.7 °C, RH 45%, passenger load 20, and mood 23.0%. Noise levels exceeded WHO limits, and concerns over environmental conditions in public transport settings. |
| [128] | Evaluation of bus driver exposure to nitrogen dioxide levels during working hours | 2019 | Brazil | Bus | EM | IAQ Measured: Nitrogen dioxide (NO2) | Drivers | WO + AC (Hybrid) | ISO/IEC 17025 [129] | The study found higher mean NO2 levels in winter: bus commuters (47.7 ± 16 μg/m3) vs. office workers (23.9 ± 6.5 μg/m3), compared to summer: bus commuters (39.0 ± 12.8 μg/m3) vs. office workers 11.9 ± 6.3 μg/m3 WO ventilation increased NO2 intrusion. |
| [130] | Effect of air velocity and relative humidity on passengers’ thermal comfort in naturally ventilated railway coach in hot-dry Indian climate | 2024 | India | Train | EM and SM | Thermal comfort Measured: Va, Ta, RH, Tg | Passengers | AC | ASHRAE | The study found a mean threshold air velocity of 2 m/s, with an acceptable range of 1.1–2 m/s. Only 43% found RH acceptable, and WO settings were common at Ta > 30 °C. |
| [131] | Passenger thermal perceptions, thermal comfort requirements, and adaptations in short- and long-haul vehicles | 2009 | Taiwan | Bus and Train | EM and SM | Thermal comfort Measured: Va, Ta, RH, Tg | passengers | WO | ISO 10551 and ISO 14505 [65] | The study found neutral temperatures of 26.2 °C in short-haul and 27.4 °C in long-haul vehicles, with comfort zones of 22.4–28.9 °C and 22.4–30.1 °C, respectively. High temperatures, solar radiation, and low airflow increased thermal discomfort for 2,129 surveyed passengers. |
| [132] | Overall and thermal comfort under different temperature, noise, and vibration exposures | 2021 | China | Bus and subway | EM and SM | TC, AC, and sensation. physical and temperature, noise, and vibration. | passengers | FAN, NV | ISO 9886 [133] | The study found noise levels of 70.8 ± 14.4 dB(A) in buses and 73.5 ± 6.1 dB(A) in subways, with vibration levels of 0.66 ± 0.46 m/s2 and 0.18 ± 0.13 m/s2, respectively. Noise and vibration reduced satisfaction and induced warmer sensations. |
| [134] | A Comparative Analysis Between Indoor and Outdoor Thermal Comfort Parameters of Railway Pantry Car | 2020 | India | Railway pantry car (RPC) | EM | Thermal comfort Measured: RH, Va, and Ta | Chefs and kitchen staff | (WC, WO, partial- WO) | ASHRAE 55 | The study found indoor parameters: Ta (30.42 °C), Tg (28.68 °C), RH (68.98%), and Va (0.03 m/s). While no significant differences were observed in summer, winter showed variations except for RH and Va. Lunch and snack cooking periods were thermally inadequate. |
| [135] | A Field Investigation of the Average Indoor Thermal Comfort Parameters on the Railway Pantry Car Kitchen at the Different Cooking Period | 2021 | India | Railway pantry car (RPC) | EM | Thermal comfort: Measured: RH, Va, Ta, and Tg | Chefs | AC | ASHRAE 55 | The study found TC parameters exceeded ASHRAE 55 limits. Mean indoor values: Ta (30.42 °C), Tg (28.68 °C), RH (68.98%), Va (0.03 m/s). Outdoor values: Ta (25.78 °C), Tg (25.94 °C), RH (66.84%), Va (1.49 m/s). Significant differences existed for Ta, Tg, and Va. |
| [136] | Appraisal of Thermal Comfort in Non-Air-conditioned and Air-conditioned Railway Pantry Car Kitchens | 2020 | India | Railway pantry car (RPC) | EM and SM | TC Measured: Va, Ta, and Tr | Chefs | AC | ASHRAE 55 and ISO 7730 and NBC, India | The findings revealed mean Ta values of 29.30 °C for AC and 34.58 °C for non-AC environments, with mean Tr values of 29.57 °C (AC) and 34.05 °C (NAC). Mean RH values were 75% (AC) and 76% (NAC), both exceeding ASHRAE-prescribed limits. |
| [137] | Thermal comfort assessment of non-air-conditioned railway coach in Central India during extreme summer | 2023 | India | trains | EM and SM | Thermal comfort: Measured: RH, Va, Ta, and occupants survey. | passengers | NAC | ASHRAE | The study found higher Passenger Comfort Vote for males 1.4 than females (1.3). PCV distribution: fans off (1%), fans on 86%, WO 89%, neutral thermal sensation was at Va = 1.7 m/s, To = 33.2 °C, highlighting ventilation improvements. |
| [138] | Thermal comfort of the kitchen in pantry cars on Indian railways | 2019 | India | RPC | EM and SM | Thermal comfort: Measured RH, Va, Ta, Tg, and survey. | chefs | NAC | ASHRAE 55 and ISO 7730 | The study found indoor temperatures of 32 °C (summer) and 29 °C (winter) during cooking, exceeding comfort limits. Thermal neutrality was 23 °C (summer) and 21.62 °C (winter), with comfort ranges of 18.50–27.80 °C and 17.80–25.50 °C, respectively. Improved ventilation was recommended. |
| [139] | Characterization and risk assessment of particulate matter and volatile organic compounds in metro carriage in shanghai | 2019 | China | Trains (metro) | EM | IAQ and PE Measured VOCs and PM2.5. | commuters | Central ventilation and AC | WHO, GB 3095 [140] | In this study, VOC levels, PM2.5 concentrations, and LCR of VOCs were higher on the underground tracks than on the above-ground track. PM2.5 and VOCs were 3× higher in old metro carriages, with LCR doubling compared to new ones. |
| [141] | Exposure to carbon monoxide, fine particle mass, and ultrafine particle number in Jakarta, Indonesia: Effect of commute mode | 2012 | Indonesia | Car (private) and bus, minibus (public) | EM | IAQ and PE Measured: CO and PM2.5 and UFP particle number (PN) | Commuters | AC (cars, public transport), Non-AC (public transport) | NA | The study measured commuters’ exposure, finding mean car exposures: CO (22 ± 9.4 ppm), PM2.5 (91 ± 38 μg/m3), and particles (290 ± 150 × 103 cm−3). Public transport showed the highest exposure, with CO levels 180–700% higher on-road. |
| [142] | Assessment and mitigation of personal exposure to particulate air pollution in cities: an exploratory study | 2021 | Singapore | Walking Bus Taxi/car MRT train | EM | IAQ and personal exposure Measured: CO2 | Staff and student | WC+ PAC, NV (homes), NV+ PAC, AC (MRT, bus, AC+ REC. | NA | The study measured mean exposure levels for different transport modes. Public transport (bus, MRT) and active modes (walking, cycling) showed higher pollutant levels. PM2.5, BC, and UFP were highest in cycling and walking, while CO2 and CO varied across modes. |
| [143] | Characterization of PM2.5 exposure concentration in transport microenvironments using portable monitors | 2017 | Hong Kong | minibus, double-decker bus, MTR train | EM | IAQ and personal exposure Measured: PM2.5 | Commuters | NA | NA | The study found higher mean PM2.5 levels in winter (31–47 μg/m3) than in summer (10–23 μg/m3) across transport. In-cabin levels ranged from 31 to 47 μg/m3 (winter) to 12–23 μg/m3 (summer), with outdoor levels similarly elevated in winter. |
| [144] | Commuter exposure to inhalable, thoracic and alveolic particles in various transportation modes in Delhi. | 2016 | India | AR, bus, car, motorcycle | EM | IAQ and PE Measured: PM10, PM2.5, PM1 | commuters | WC | NA | The study revealed varying in-vehicle pollutant levels by mode and time, with cars showing the highest PM exposure. Evening commutes posed greater risks across all modes, with PM10, PM2.5, and PM1 levels higher during this period. |
| [145] | Commuter exposure to particulate matter in urban public transportation of Xi’an, China | 2020 | China | Subway, bus (CNG and pure electric) and Walking | EM | IAQ and personal exposure Measured: PM10, PM2.5, PM1 | Commuters | WO (CNG bus) AC+ WC (electric bus) | NA | The study showed varying pollutant levels: CNG bus (PM10: 130, PM2.5: 58), pure electric bus (PM10: 24.3, PM2.5: 16.7), subway (PM10: 68, PM2.5: 46.3), and walking (PM10: 149.4, PM2.5: 69.8). Exposure was highest at bus stops and walking. |
| [146] | Commuters’ exposure to particulate matter and carbon monoxide in Hanoi, Vietnam | 2008 | Vietnam | Motorbikes, buses, cars, and walking | EM | IAQ and PE Measured: PM10, CO | Commuters | AC (bus and cars) WO (cars) | WHO | The study found mean PM exposure of 455 μg/m3 and CO levels of 15.7 ppm. In-cabin PM10 levels were highest in motorbikes, and AC reduced PM by 62%, but not CO levels. |
| [147] | Commuters’ exposure to PM1 by common travel modes in Shanghai | 2012 | China | Diesel buses Gasoline taxi | EM | IAQ and PE Measured: PM1 | Commuters | WC (taxi, buses) | NA | The study revealed highest PM1 concentrations in buses (155 μg/m3), followed by stations, taxis, and trains. Inhalation doses were highest for cycling, walking, and buses, respectively. |
| [148] | Effects of commuting mode on air pollution exposure and cardiovascular health among young adults in Taipei, Taiwan. | 2012 | Taiwan | Car, walking, subway (electric), Bus (gas-powered and gasoline), | EM | IAQ and PE Measured: CO, CO2, PM2.5, Temperature, RH, Noise | Commuters | AC and NAC | NA | The study found the highest PM2.5 exposures in walking (42.1 μg/m3), followed by buses and cars. Walking also had the highest noise and TVOCs, with PM2.5 linked to decreased HVR and cardiovascular risks. |
| [149] | Estimating the total exposure to air pollutants for different population age groups in Hong Kong. | 2002 | Hong Kong | Subway, Railway, Car/taxi and Bus/minibus, truck/van, Airplane, | EM and SM | IAQ and PE Measured: CO2, PM10, NO2 | commuters | AC (enclosed transit) | NS-Hong Kong | The study found highest PM10 levels in bus/minibus (137.5 μg/m3), NO2 in truck/van and bus/minibus, and CO in bus/minibus (3150 μg/m3), with risks increasing after 2 h of daily commuting. |
| [150] | In-cabin exposure levels of carbon monoxide, carbon dioxide and airborne particulate matter in air-conditioned buses of Hong Kong | 2011 | Hong Kong | Bus | EM | IAQ and PE Measure: CO, CO2 and PM10 | Commuter s | AC | NS-Hong Kong | The study found that mean in-bus CO levels (ppm) were highest in Euro IV buses (1510), followed by Euro II (1226) and Euro III (1143). CO2 levels were similar across Euro II, Euro III, and Euro IV (2.2–2.5 ppm), while PM10 levels were highest in Euro III (240 μg/m3). |
| [151] | Particulate matter exposures under five different transportation modes during spring festival travel rush in China. | 2021 | China | CRH Trains (short Haul and (long haul) Bus, Car and subway | EM | IAQ and PE Measure: PM2.5, PM10 and PM1 | Commuters | Bus (WC + AC) Car (WC + AC) | WHO | The study found highest PM2.5 levels in cars (166.7 μg/m3) and walking (141.1 μg/m3) during festivals, with post-festival PM reductions across modes. High-speed trains had the lowest exposure risks. |
| [152] | Personal exposures to PM during short distance highway travel in India | 2020 | India | Car, bus | EM | IAQ and PE Measured: PM10, PM2.5 and PM1 | commuter | AC bus, Car (NV), AC + FA (car), AC + REC (car) | USEPA, EN 12341 [153] | The study found that AC + REC mode in cars significantly reduced PM levels (PM10: 20, PM2.5: 10, PM1: 7), outperforming buses and other car modes, ideal for short trips. |
| [154] | Sequential measurement of intermodal variability in public transportation PM2.5 and CO exposure concentrations | 2016 | Hong Kong | Train, bus (double-deck), Minibus, Train station, Bus stop, Walking, | EM | IAQ and PE Measured: PM2.5 and CO | commuters | NA | The study found mean pollutant exposure levels: PM2.5 in-vehicle (Train: 23 μg/m3, Double-decker bus: 30 μg/m3, Minibus: 27 μg/m3) and at bus stops (40 μg/m3) and train stations (28 μg/m3). CO and CO2 levels were similar across vehicles (23–30 ppm). | |
| [3] | The effect of COVID-19 restrictions on particulate matter on different modes of transport in China | 2022 | China | Subway, High-speed train (HST), Bus, Intercity bus (ICB) | EM | IAQ and personal exposure Measured: PM10, PM2.5 and PM1, and BC | Commuter | HVAC + HEPA (airplane, HST), WO (bus), WC/WO(Bus) Car (AC + REC) | WHO | The study found varying mean PM exposure levels across different transport modes: Subway had low PM levels, followed by high-speed trains (HST), buses with higher exposure, and intercity buses (ICB). Airplanes had the lowest levels of PM and BC. |
| [155] | Concentrations of fine, ultrafine, and black carbon particles in auto-rickshaws in New Delhi, India | 2011 | India | auto-rickshaw, Car | EM | IAQ and personal exposure Measured: PM2.5, BC | Commuters | WO AC + WC + REC | NA | The study found in-vehicle pollutant levels of PM2.5 (190 μg/m3), BC (42 μg/m3), and PN (280 × 103 cm−3), exceeding ambient concentrations by 1.5, 3.6, and 8.4 times, respectively. |
| [156] | In-vehicle carbon dioxide concentration in commuting cars in Bangkok, Thailand | 2016 | Thailand | Sedan | EM | IAQ Measured: CO2, Tcabin, RH | Occupants (2, 3, 4 person) | AC + REC NAC AC + FA | ASHRAE | The study found CO2 levels reached 10,000 ppm in AC + REC mode (0–1885 s). CO2 decreased with AC + FA (3675–4180 s), while NAC and long-term parking caused CO2 levels to increase over time. |
| [157] | Exposure levels of particulate matter in long-distance buses in Taiwan | 2009 | Taiwan | Bus | EM | IAQ Measured: PM2.5, PM10, CO2, RH | Passengers and drivers | AC and WO | EPA, USA EPA and WHO | The study found mean pollutant levels PM10 (39.2 μg/m3), PM2.5 (24.4 μg/m3), and CO2 (959 ppm) below Taiwan EPA IAQ guidelines. PM2.5 and PM10 were elevated with window opening, and CO2 increased with passenger numbers. |
| [158] | Inequality in personal exposure to air pollution in transport microenvironments for commuters in Bogotá | 2023 | Columbia | Pedestrian, bus, BRT, car, motorcycle, | EM | IAQ, Measure: PM2.5, black BC and (CO) | Commuter | NA | USEPA | The study found a significant disparity in air pollutant doses between the lowest and highest socioeconomic quintiles. Passive modes, especially BRT, had the highest pollutant levels (PM2.5: 164.6 μg/m3, CO: 4305.8 μg/m3). Active modes had lower levels but higher inhalation risks. |
| [159] | Indoor Air Quality (IAQ) Onboard A Naval Ship: A Comparative Study Between Compartments | 2023 | Malaysia | Naval ship | EM | IAQ, Measured: RH, CO2, CO, TVOC, and PM10, CH2O, NO2 | Naval crew | NA | ICOP, USEPA, MAAQS | This study analyzed four compartments: wardroom, cabin, MCR, and Bridge. The temperature was highest on the Bridge (26.3 °C) and lowest in the Cabin (22.2 °C). CO2 peaked in the MCR (510 ppm), with TVOC and PM10 also varying significantly across locations. |
| [160] | Exposure to Fine Particles Among Bangkok Mass Transit Authority Bus Drivers | 2011 | Thailand | Bus | EM | IAQ, Measured: PM2.5, black CO and CO2 | Bus drivers | AC and NAC | ASHRAE, WHO and NAAQs | The study found that PM2.5 levels exceeded limits, averaging 208.42 μg/m3 in AC buses and 322.01 μg/m3 in non-AC buses. Also, CO2 and CO levels varied significantly between AC and non-AC buses. Mean CO2 was higher in the AC buses. |
| [161] | Evaluation of In-Cabin Levels of Fine Particulates and Carbon Monoxide in Shuttle Buses Along a Major Intra-City Route in Benin City, Nigeria | 2016 | Nigeria | Bus | EM | IAQ Measured:PM2.5, CO, Tcabin | commuter | NA | NA | In this study, mean in-cabin pollutants were reported as follows: Diesel Fuel Buses had PM2.5 (85.01 ± 44.79 μg/m3) and CO (4.39 ± 2.14 ppm), while Gasoline Fuel Buses had PM2.5 (115.40 ± 36.98 μg/m3) and CO (9.54 ± 3.63 ppm). |
| [162] | In-vehicle air quality in public buses during real-world trips in Kathmandu Valley, Nepal | 2024 | Nepal | Bus | EM | IAQ Measure d: Ta, PM2.5, PM1 and CO2 | commuter | NAC, WO | WHO | The study found in-cabin PM2.5 concentrations of 95.9 ± 40.4 μg/m3, with higher ACH and VPP for diesel buses. Inhalation doses were 5.65 ± 2.32 μg/km for PM2.5 and 4.27 ± 1.79 μg/km for PM1. |
An analysis of the IEQ parameters studied shows that IAQ was the most studied parameter, appearing in 82 studies. Thermal comfort (TC) was the second most studied, found in 26 of the SLR studies. Other IEQ parameters, such as AC and VC, were found to have been least reported concerning the IEQ of tropical PVCs, making it readily deducible that little attention has been paid to the other IEQ parameters besides IAQ and TC of tropical PVCs. Also, the implications of ventilation and energy efficiency have only been addressed in 5 of the 113 studies, which reflect significantly low attention to the direct/indirect impacts of ventilation settings and energy efficiency on IEQ, environment, and sustainability concerns. We have clustered them into eight classes by the vehicle categories given to the various vehicle types. Buses include BRTs and public buses of diverse sizes, including studies that simulated such vehicle types of indoor spaces. The car has been used to represent taxis, private cars, automobiles, and sedan cars. Trucks include regular trucks, military passenger vehicles, vans, and sport utility vehicles (SUVs) reported. The active modes included bicycles and walking, while motorized three-wheelers and two-wheelers, like auto-rickshaws and motorbikes/cycles, have been clustered in one category. Trains, trams, and subway carriages have been grouped into the same category. Across all categories, buses have been the most studied, while car and train categories have ranked second and third most studied, respectively. Very few tropical studies have been reported for trucks and other motorized modes, although 14 studies have studied three/two-wheelers, including motorbikes, in the context of IAQ and personal exposure investigations. Smooth active modes, such as cycling and walking, were reported since many studies approached IAQ and personal exposure assessments using comparative evaluations, including building indoor or outdoor environments, which have been excluded considering the main scope of the current SLR. The vehicle type studied the most highlights the areas of attention and hints as relevant since public buses are a stapled means of mobility. However, considering the campaign to ensure sustainability and minimize environmental pollution due to transport, attention should be given to trains and subway systems. In contrast, individual transport modes should be discouraged to optimize energy use and reduce road congestion and pollution. These findings help to identify key pollutants, focus areas, vehicle types, and geographical trends in IEQ studies, aligning with R1 of the current SLR objectives.
3.2. Overview of Text Occurrence in Titles and Abstracts of SLR Studies
In Figure S1 of the Supplementary Materials, the screenshot image is a network visualization created using the VOS viewer visualization tool by [150], which shows the relationships between various keywords and abstracts of the chosen SLR studies. The visualization used colors to show the clusters of related terms while the lines represent the interconnectedness of keyword terms that frequently co-occurred in the study keywords and abstracts. Three main clusters have been visualized in red, blue, and green. Key clusters and main terms include “exposure concentration”, “transport mode”, “fine particle”, “pm-exposure”, and related terms (for red cluster), “VOCs concentration”, “formaldehyde”, “benzene”, “air quality”, and “health risk”. (for blue cluster) and then, “passenger”, “thermal comfort”, “temperature”, “relative humidity”, “comfort”, and “noise” (for green clusters). The main terms concern IAQ, personal exposure concentration, and thermal comfort. The existing interrelations between them are also studied. The keyword “exposure concentration” appeared with the strongest network, implying that it was addressed in the select SLR studies. “Passenger” and “temperature” have also appeared significantly in the evaluated titles and abstracts of the SLR studies. “Exposure” is associated with the evolution of IAQ, which aligns with the study findings in Figure 4a, indicating that most SLR studies have investigated IAQ and personal exposure parameters during commutes. Also, regarding commuters, the network visuals suggest that most studies have addressed passenger and thermal comfort parameters. Moreover, the recurrence of exposure concentration aligns with the frequency of traffic-related air pollutants (TRAP) distribution, as shown in Figure 4d, where PM2.5, PM10, and CO have appeared highest in studies. In this SLR, most studies have addressed personal exposure to TRAP.
4. Discussion
This section discusses the SLR following the research questions R2, R3, and R4, in the sub-sections below.
4.1. RQ2. Overview and Characterization of the IEQ Studies Presented in RQ1
Nearly 80% of all the studies were in tropical Asian countries and cities [3,18,19,25,29,30,31,32,42,43,44,45,46,48,49,51,54,59,62,63,66,68,70,71,72,74,76,77,82,83,86,87,88,89,90,91,94,95,96,97,98,99,100,102,108,109,111,112,114,115,116,117,118,119,120,121,122,124,125,126,130,131,132,134,135,136,137,138,139,141,142,143,144,145,147,148,149,150,151,152,154,155,156,157,159,160,162,163] whereas the least number of studies were in tropical Oceania [25,110,113] and African regions [1,25,42,43,47,56,75,85,103,106,107,161]. The next most studied region has been the South American region [25,42,43,55,78,79,80,81,84,92,93,101,104,123,128,158]. About 73% of all studies have evaluated IAQ parameters, followed by 23% for thermal comfort, but only one study, in Nigeria [1], reported on visual comfort as part of their field survey of IEQ in trains. Only eight studies, found in Malaysia, Nigeria, Brazil, China [1,49,73,103,104,108,109,126], have addressed noise exposure in tropic PVCs. Also, another eight addressed ventilation and energy parameters [1,25,30,32,56,59,63,66] but one study particularly addressed the related health risks to socioeconomic burdens [42] and inequality [158], besides several others which highlighted the negative impacts on health and the socioeconomic implications of commuter exposure to adequate IAQ in PVCs. Several studies have emphasized the risk to commuters linked to in-vehicle presence and the spread of infectious aerosols, as evidenced by the recent pandemic [164,165], alluding to the need to ensure adequate RH (between 40 and 60%), ventilation settings, occupancy density control, adequate thermal ranges, and ventilation settings, including the use of protective masks [51]. Notably, two of the SLR studies have addressed the exposure risk of bacterial, fungal [74], and allergens [55] in PVCs of the tropics.
Most studies have employed experimental methods (EM) and numerical simulations (NS) via computational fluid dynamics (CFD), including mathematical models (MM). Also, a few have employed methods, including subjective evaluations of bus drivers and commuters. All other IAQ studies conducted experimentally by these studies [88,96,99,101,122,124,126,149] have employed both mixed methods using EM and SM, while one study [103] used only SM to assess IAQ and noise parameters. The limited use of subjective methods can be attributed to the common absence of institutional awareness and regulatory or policy gaps to support the rigors and approval of deploying subjective methods and scientific ethics, especially for developing tropics where problems are inherent. Hence, there is a need to leverage mixed methods, including machine learning algorithms (MLA), NS, and MM, which have also had limited use but are somewhat independent of cost, institutional, and regulatory policy requirements, especially for IEQ in developing tropics. However, a few studies [72,130,131,132,136,137,138,149] have assessed TC using mixed methods of EM and SM, whereas these studies, [29,32,45,56,62,63,66,70,72] have used EM, NS, and MLA to study TC parameters.
4.1.1. Indoor Air Quality in Tropical PVCs
Regarding IAQ, most studies focused on commuter exposure to pollutants like PM2.5, PM10, CO, and BC, emphasizing that higher in-cabin exposure levels were associated with elevated levels of ambient pollution, ventilation settings, fuel types, and route peculiarities. Moreover, vehicle fuel type contributes to the commuter exposure risk via self-pollution and the significant contribution of vehicular emissions. In several field surveys that compared the impact of fuel types, electric vehicles (EVs) posed a significantly lesser risk compared to compressed natural gas- (CNG) fueled vehicles, gasoline-fueled vehicles (GFVs), and diesel-fueled vehicles (DFVS), including hybrid engines. Several studies [79,81,84,116,122,123,147,160,161] revealed that many tropical mass transit vehicles investigated are mostly fueled by either gasoline, diesel, or CNG, which compares differently to the mass transits in many of the developed non-tropic regions, where there are more EVs in their vehicle mix. In the studies [79,81,116,145,160], ambient traffic load, number of stops, route, speed, vehicular emissions, and self-pollution are key factors that impact in-cabin exposure levels, especially for high in-cabin BC levels [73,81] including vehicle technology, fuel type, and vehicle age [161]. The findings by [123] indicated that vehicle technology, such as battery electric vehicles, impacted the lower number of in-cabin pollutants measured. The study by [84], a comparative survey of in-cabin BC levels in diesel vs. biodiesel-fueled buses, suggested that biodiesel buses coupled with other after treatments will reduce emissions risk, including travel route changes. Also, street geometry and ingress of ambient BC were found to affect in-cabin BC levels. In contrast to the effects of tailpipe emissions emphasized by other studies, a study [161] in southern Nigeria reported the effect of tailpipe emissions as less significant compared to effects from resuspension of particles. However, mean CO levels in DFBs indicated higher levels than those in GFBs during traffic build-ups. They assessed in-cabin PM2.5 and CO with findings that GFVs had higher cumulative mean in-cabin levels of PM2.5 and CO than DFVs. In contrast, the traffic effect was insignificant, considering the outcomes of their statistical correlations. Notably, the study was performed in the Nigerian context due to the existential issues of heavy traffic, many used vehicles or second-hand vehicles, high commuter traffic, and time spent in vehicles, including poor road infrastructure and conditions impacting traffic and idling emissions. These conclusions align with similar conclusions in other Nigerian studies related to overcrowding, ambient pollution, heavy traffic, and length of exposure hours [1,75,106]. Regarding exposure risk linked to occupational exposure to poor in-cabin IAQ and tropic PVCs, a Malaysian study [122] compared pollutant exposure in bus drivers and office workers. Drivers had more respiratory symptoms due to air pollutants. Their findings affirm occupational in-cabin risk to drivers, recommending frequent monitoring and interventions; similarly, the observational assessment of in-cabin NO2 exposure in drivers vs. office workers by [117] showed that drivers were at risk of NO2 and other anthropogenic pollutants. Notably, their results showed higher NO2 levels in winter than in summer, highlighting the impacts of seasonality and ambient sources. The findings suggested that the WO ventilation setting contributed to the intrusion of ambient NO2 levels, whereas in-cabin levels significantly exceeded ambient levels, aligning with several study conclusions of the in-cabin IAQ. Also, ref. [160] surveyed and evaluated PM2.5, CO, and CO2 in-vehicle exposures specifically for bus drivers in Bangkok. The in-vehicle values exceeded by 12 times the WHO Limits (25 μg/m3 24-h) and were approximately 9 times higher than the NAAQS limits (35 μg/m3 24-h), which reinforces the study conclusions of in-cabin risk of the studied bus drivers in both AC- and non-AC (NAC) buses considering PM2.5 exposure levels. Meanwhile, their findings also showed the effect of AC, typically with closed windows, resulting in higher in-cabin CO2 levels compared to NAC due to the effect of opened windows, while for CO, the non-AC in-cabin levels exceeded, for most cases, the AC buses. Another Bangkok study [124] reported less risk to drivers for CO and CO2, following the NAAQS and ASHRAE 9 ppm CO limits in 8-h; the mean levels showed compliance but not for the mean PM2.5 exposures, which exceeded the WHO limit. Notably, fuel type did not portray significance in evaluating driver exposures [124]. In Peru [101], they reported exposure risk to drivers linked to PM2.5, and VOCs. At the same time, unacceptable noise levels were in-cabin risk factors for drivers besides other IAQ parameters in Brazil [104] and Nigeria [1]. In Dhanbad, the study experimentally and subjectively assessed PE risk in auto rickshaws (AR), affirming that there are exposure and health risks to AR drivers. Exposure and risks were linked to fuel type, overcrowded cabins, traffic congestion (ambient MEs), and tailpipe emissions [103]. The in-cabin risk to drivers informs that passengers and commuters are also at risk, as found in many tropical Asia transport MEs [96]. Significant commuter exposure risks have been reported for buses, cars, and other modes of transportation. Ref. [35] showed risk linked to alarming levels of CO2. The main findings suggest that, without proper HVAC settings and occupancy regulations, there is the in-vehicle risk of high CO2 build-ups at full passenger loads since occupants are major CO2 sources, particularly in AC+REC (Air conditioning plus recirculation) mode with minimal fresh air inflow. In Hong Kong, the public bus and minibuses showed the highest PE risk of the transport mode, while NO2 exposure 24-h limits were exceeded, affirming potential risks. About 82% of people are in buildings indoors, whereas 7% are in enclosed transport. They found that, regardless of age, spending more than 2 h daily commuting poses an elevated risk due to NO2 levels exceeding standard limits [156]. The study [149] of 120 healthy persons in Taipei suggested that drivers’ risk might be lower than passengers and walkers. Tailpipe emissions, doors opening, and particle resuspension can increase exposure risk in public transit MEs and closed cabins. They emphasized the need for effective ventilation during commutes to enhance lower pollutant exposure and cardiovascular health issues. Their findings reinforce the evidence that exposure to elevated levels of respiratory particles poses significant health risks and socioeconomic burdens, aligning with findings by [43,148]. Moreover, a study [158] assessed the PE of PM, BC and PN in AR (CNG-fueled) and cars in New Delhi, India, a tropical city. The findings align with several study findings that in-vehicle exposure poses risks to commuters. The highlighted factors of traffic and ambient on-road conditions contribute significantly to in-vehicle pollutant levels. The incremental increase of in-vehicle pollutants found (30%, 68% and 86% of time-averaged in-vehicle PM2.5, BC, and PN concentrations, respectively) suggest significant risk of respiratory, thoracic, and alveolic particles in public PVCs of tropical cities similar to [155], suggesting implications of health burdens; the implications of fuel types and vehicular emissions were highlighted as common proxy sources of in-vehicle pollutants in many tropical Asian cities. Similarly, in a comparative evaluation of personal PM2.5 exposures in two cities’ metro vehicles by [79] fuel type, exclusivity of lane, and ventilation settings influenced the in-vehicle PM levels and personal inhalation doses. Also, comparing PM exposure in the new vs. old vehicles showed that, with newer ventilation technologies, the reduced emissions of new vehicles enhanced reduced PM levels and mitigated self-contamination. Moreover, the rise in PM (~300 μg/m3) when in proximity to city center areas verifies that ambient PM levels significantly impact in-vehicle PM exposure but also depends on vehicle ventilation settings. Vehicles on exclusive lanes had lesser PM2.5 ingress levels, alluding to the effect of route parameters on the in-cabin exposure level. In Kathmandu Valley, Nepal, ref. [162] analyzed cabin air quality and ventilation in public buses during real-time travels and found that PM levels were inadequate, exceeding recommended thresholds by the WHO, whereas the PM1 to PM2.5 ratios >0.75 suggests that PM mostly consisted of the sub-micron size range. Moreover, both the mean ACH and ventilation rates were higher for diesel buses than for electric buses (being newer and more airtight). Also, traffic hours significantly affected both in-cabin and ambient PM levels, concluding that there was an existential risk of airborne disease spread in bus cabins surveyed. Notably, they remarked on the absence of national guidelines on air quality and ventilation rates for public bus cabins and other transport-related MEs, hence the need to develop relevant guidelines, like recommendations by [1,6] for developing tropics. Interestingly, the study [114] evaluated exposure levels and risk in various modes of transport owing to the COVID-19 pandemic. The risk in PM across all modes complied with WHO limits. Due to the pandemic measures, cities reported lower ambient pollution for the special period of COVID-19. Also, the implemented ventilation across the modes seemed efficient; hence, a significantly reduced risk was reported, unlike previous studies conducted during normal periods. The study highlights the use of HEPA filters, efficient ventilation, and face masks to reduce passengers’ in-cabin risk, especially in the context of the pandemic besides PM. In the context of the current SLR, the implications of highly reduced in-cabin PM levels due to efficient ventilation strategies and remarkable ambient conditions reinforce the insight that indoor regulatory strategies can be better achieved in tropical cities in consonance with regulatory measures of ambient conditions, such as for traffic, emission controls, ventilation protocols in mass transit vehicles, occupancy controls and region-specific policies that enhance compliance to IEQ measured in PVCs. There is the benefit of reduced health burdens and positive socioeconomic implications.
Some studies have assessed carcinogenic risks linked to unacceptable levels of in-cabin VOCs in buses [89] and metro carriages [82] in Shanghai, whereas the WHO carcinogenic risk limit was exceeded. Meanwhile, ref. [92] found non-fatal carcinogenic risks in Mexican PVCs yet recommended the use of mass transit vehicles for reduced cancer risks. Moreover, in Singapore, ref. [142] used personal monitors in two categories of persons (office staff and university students) to assess PE, with findings that potential carcinogenic risks were associated with long-term exposure to elevated levels of PM2.5-bound toxic trace elements. Regarding in-vehicle IAQ risks of disease spread and influenza, ref. [25] estimated the risk of influenza spread by adopting and developing an aerosol influenza transmission risk contours (ITRC) considering the indoor levels of Ta and RH in sedans, buses, aircraft, and buildings from eight countries. In contrast, the surveys were compared with temperate climate cities in Australia. Leveraging the findings of previous studies by [160,161] on aerosol infection between guinea pigs in a cabinet, a risk model was adapted for indoor infectious aerosol spread in humans. They estimated the contagious probability by time expressed in days using the ITRC parameters. Influenza transmission was strongly linked to temperature, RH, and indoor ventilation parameters by the study; results for motor vehicles (AC and WC), classified as old and new, showed minimal risk for old taxis, tour, and hotel cars (above the 25% G7 transmission risk line). Also, most new cars showed low risk. The luxury buses showed higher risk AC and WC with recirculation favored minimal risk. AC and WC with recirculation were efficiently linked to improved HVAC designs in new cars. Main infectious aerosol sources are linked to commuters, including in-cabin passengers and vendors, at high risk during travel. Aircraft had minimal risk linked to short exposure time and downtime of HVAC systems during deplaning and effective ventilation parameters. The study [47] recommended the improved climate of the tropics and temperate indoor spaces to minimize the risk of influenza spread, public health crises, and ultimate economic benefits for nations. Moreover, the health risk probabilities associated with VOCs have been assessed, and exposure time was reported as the main effect of carcinogenic and non-carcinogenic risk [89]. Poor air circulation and ventilation in underground tracks were linked to higher VOC levels, with carriage age affecting VOC levels due to painting quality [90]. The study on in-cabin VOCs showed that fabric type influences VOC levels, affecting Ta. Notably, in Uberlandia [55], elevated levels of mite allergens were found in all vehicle types surveyed. In AVBs, Mite and cat allergens were higher in the seats than in AC filters. Their findings showed that the indoor environment of public vehicles has these contaminants, suggesting the risk of allergenic sensitization or allergic respiratory symptoms in genetically predisposed commuters. Considering that two categories of public buses (120) and taxis (60) were surveyed, as per ventilation parameters, the study findings highlight that regulatory measures are required for transport vehicles. They found that using natural ventilation reduced allergen levels in the buses since ACH is higher. Upholstered seats and AC filters in PVCs are reported to harbor mite allergens, as found in many trains and buses, posing continuous indoor contamination risks.
Studies evaluated IAQ and PE in trains, trams, and metro carriages [3,79,82,89,90,92,93,95,97,110,111,112,115,116,117,119,120,139,148,151,154], mainly in the context of comparative evaluations of commuter exposure across modes, with most findings alluding to better in-cabin conditions than other modes. An IEQ survey in Nigeria by [1] reported in-cabin risk and above-limit PM levels due to inadequate filtration and air exchange rate (AER) in surveyed trains of Nigeria, whereas in Hong Kong, ref. [120] evaluated commuter exposure to PM in various public transport modes. They reported that road trams (175 μgm−3) were three to four times higher than trains. Also, in a comparative study across four modes of Sydney transport [110], the variable range of mean PM values in trains suggests the impact of ventilation type compared to other modes. In Shanghai, ref. [115] has highlighted that ventilation settings affected the reported pollutant levels in vehicles and BC in underground trains. Meanwhile, in Guangzhou, China, ref. [89] assessed the health risk probability associated with eight types of VOCs. The study reported that formaldehyde, benzene, and acrolein had the highest risk contribution and that exposure time contributed to in-carriage VOC levels. Their findings allude to the fact that poor air circulation and ventilation in the underground track were likely to be the cause of higher VOCs underground. Also, carriage age seems to be a major factor for carcinogenic and non-carcinogenic risk. Similarly, in Shanghai, China, a study reported exposure risk to health in the surveyed metro carriages. Also, aromatic VOC levels in the old metro carriage were one to two times higher than in the new, and metro interior surface and commuters affect in-cabin VOC levels linked to better painting. The findings show that metro carriages have health risks, as the WHO carcinogenic risk limit was exceeded [90]. Notably, in several studies [1,44,45,46,47], comparisons between in-cabin and out-cabin PM conditions were reported, focusing mostly on comparison between mobility modes or in and outdoor exposure levels, omitting analyses and implications concerning IAQ thresholds or outdoor regulations of the surveyed pollutants. Additionally, some reported findings lacked clarity on the implications of PM level exceedances and did not discuss risk implications for exposed passengers [45,46]. Some studies [1,47] have reported seasonal or long-term surveys. Some did not clarify the season nor report clearly when the field surveys conducted occurred. Also, vehicle cabin ventilation settings were not clarified as to how they impacted in-cabin PM levels. These are crucial factors that ought to be reported concerning IEQ field surveys in the tropics, given the climatic peculiarities and ambient environmental variabilities of tropical regions.
4.1.2. Thermal Comfort in Tropical PVCs
TC was the second most assessed parameter in various PVCs by 26 reviewed studies. Besides common commute modes like cars, buses, and trains, special transport MEs such as railway pantry cars (RPC) and AR were investigated. ARs or three-wheelers and two-wheelers, including motorcycles and active commute modes, are staple means of mobility in several tropical Asian and African countries, owing to the huge populations, road infrastructure deficit, dependence on fossils, and socioeconomic factors. Auto rickshaws and three-wheelers, which are more appropriate for last-mile commutes, are seen to be used for first-mile commutes, especially for developing tropical countries. Several studies have reported negative outcomes for thermal comfort in tropical PVCs. In Nigeria, ref. [1] reported that by PMV and PPD evaluations for thermal comfort parameters, with conclusions that the PMV index implied inadequate regarding the rain cabins surveyed experienced cooling sensation, an over-compensation from settings in the air conditioners, recommending the need for better HVAC settings and adequate use of in-cabin curtains for shading can reduce overall thermal loads vis-a-vis energy used for climatization. An Egyptian study [56], using numerical simulations implemented via the CFD approach, investigated airflow patterns and thermal comfort with the effect of solar emission in car cabins, yielding results that showed PPD and PMV is decreased with an increase in discharge angles. Also, PMV and PPD parameters were used to evaluate a cabin’s discharge air, velocity, and angle effects. They concluded that a bigger air flow rate and the same air temperature enhance achieving in-cabin thermal comfort and that discharge orientation significantly affects thermal comfort. Their finding emphasizes the need to ensure adequate HVAC settings for vehicles considering the effects of airflow rate and distribution, including solar irradiation. Also, ambient thermal conditions impact interior cabin thermal comfort since the increase in Ta by 1.5 °C was attributed to solar radiation effects. A study [19], assessed thermal comfort in various car models, finding that CO, To, and Tr values exceeded the comfort limit in all cases for all vehicle models. PMV was reported to be inadequate for all cases (<40 °C), per the ASHRAE 55and EN15251 guidelines, but acceptable per ISHRAE requirements. The study findings affirm the existential risk in PVCs as per extreme thermal loads and poor IAQ for a tropical/sub-tropical Indian context. Besides the study-measured parameters, car material, color, parking location, and ambient environmental conditions are suggested to influence in-cabin TC. The study recommends mitigation strategies, including incorporating the Internet of Things (IoT) and artificial intelligence (AI), WO, and shaded parking, besides HVAC use. There was no passenger occupancy presence in the investigated PVCs, nor were objective surveys implemented, although the study refers to the implication of vehicle occupant thermal comfort study. Also, it was mentioned that exposed PVC occupants’ risk-averse health was due to higher draught rating due to hurried use of AC, whereas in-cabin temperatures (<40 °C) take longer to regulate for comfort. Recommendations were made for in-cabin surveys with/without occupants, including a study of arterial pressure as a biomarker to evaluate the PMV–PVCs better.
In several studies, [62,76,134,135,136] the TC conditions of railway pantry car (RPC) kitchens were investigated. The pilot study by [72] assessed thermal comfort and sensation in chefs of RPC kitchens of an Indian railway train (the world’s second and largest railway in Asia), using experimental and subjective approaches to evaluate TC in AC and non-AC RPC kitchens. The TS result assessment showed that RPC with AC use was slightly better, but most chefs perceived discomfort for both ventilation settings. This aligns with the indoor thermal risk in a tropical context and the need for better indoors. There was an exceedance of ASHRAE comfort limits, whereas a subjective survey showed that almost all chefs were dissatisfied. Similarly, the appraisal of TC in RPC by [136], comparing physical levels of TC parameters in RPC kitchens with NAC and AC ventilation systems, reported significant thermal discomfort according to the PMV and PPD index. The ASHRAE and ISO 7730 limits were exceeded, and TS affirmed the reported discomfort. Moreover, employing EM and SM, 69 chefs across 14 RCPs were assessed by PMV and PPD indices, concluding that ambient conditions affected indoor environments. However, they remarked that the PMV–PPD index was unsuitable for RPC kitchens due to severe indoor temperatures. Also, neutral temperature ranges were compared to ranges reported in referenced previous studies in Hong Kong, China, Taiwan, Indonesia, Malaysia, and Chennai, India (23.3–31.93 °C) of tropical kitchens. They suggested that redesigning ventilation and airflow systems would improve TC in tropical kitchens, noting differences from non-tropical contexts [138]. Another survey of TCs at different cooking times found that TC parameters exceeded the ASHRAE 55 limit, including outdoor conditions, hence the need for adequate HVAC interventions and management in RPCs [135]. In yet another comparison of RPC kitchens’ outdoor and indoor TC parameters [122], they found that TC parameters did not comply with ASHRAE limits. Also, the findings showed that lunchtime and snack time cooking periods were most thermally inadequate, which aligns with several reports [166,167] on the role of indoor activities on thermal discomfort and poor IAQ, especially in tropical kitchens indoors, considering cooking frequency, duration, intensity, fuel types (e.g., biomass), and inadequate ventilation. The findings emphasized the need for adequate ventilation systems in RPC kitchens [134]. In central India, a study of NAC train cabins found correlations in physical measurements of operative temperature TO (°C) to the survey responses on passengers’ comfort. In-coach air velocity (Va) significantly affects thermal comfort, passenger seat, fans, and window settings. An optimal thermal comfort temperature was reported as 33.2 °C. PCV showed that most wanted fan on and WO due to elevated indoor thermal load and NAC coaches. The findings emphasize that adequate ventilation settings are required to mitigate the thermal discomfort of tropical PVCs. Notably, the optimal thermal parameter values found exceeded ASHRAE recommendations but less than Griffith’s mean optimal temperature of 35.81 °C [137].
Most of the reviewed study findings allude to the inadequacy of thermal comfort in tropical cabins, highlighting the factors of severe thermal loads linked to irradiation, parking location, need for vehicle window and windscreen shadings, poor ventilation settings and air distribution, high level of ambient temperatures and climate peculiarities, occupancy density (human thermal impact), indoor activities (such as cooking and equipment in the RPC kitchens), high in-cabin noise effects [132], absence and implementation of national guidelines.
4.1.3. Acoustic Comfort and Visual Comfort in Tropic PVCs
In PVCs, in-cabin noise impacts the well-being and comfort of exposed passengers and drivers’ wellbeing, health, and safety. A few studies reported noise surveys in tropical cabins alluding to health and comfort risks [49,103,104,108,109,132,148]. In Port Harcourt, Nigeria, ref. [103] used a subject approach by survey questionnaires to assess IAQ, noise, and health risks. Their findings allude to in-cabin risk linked to in-cabin, ambient, vehicular, and industrial pollution in sub-Saharan African (SSA) countries that align with EM findings [1]. Notably, 52% of respondents reported hearing loss, suggesting the risk of noise exposure. Vehicle maintenance, besides other factors, is recommended for risk mitigation. The IEQ sampling in Sao Paulo, Brazil [104] reported noise level (ranges of 68 dB(A)–92 dB(A) as consistently above 68 dB(A)). Considering Bryan’s proposed criteria for noise equivalent levels (Leq) in vehicles as mostly quiet at 67 dB(A), noticeable at 73 dB(A), intrusive at 79 dB(A), annoying at 85 dB(A), and very annoying at 91 dB(A) [163] there was risk to commuters in the buses surveyed besides the high mean PM levels and heat stress indices reported by [104]. In Malaysia, ref. [49] evaluated a car cabin exposed to tropical conditions, highlighted the climatic and regional peculiarities including unpaved road conditions, and buttressed the study rationale. However, regarding the evaluation of average SPL values, it was not clear if mean SPL values were computed via arithmetic means or via noise equivalent, given that the noise equivalent is a more appropriate representation of the noise evolution surveyed for the defined time series. Their conclusions indicate that road conditions impact in-cabin noise levels and that noise was higher on harsher road conditions concerning vehicle speed. Meanwhile, in military vehicles [73], noise levels were found within permissible limits for human comfort, although utility vehicles were most comfortable. They have experimentally assessed noise levels and heat stress index which are relevant parameters for IEQ including the conditions of whole-body vibration (WBV). In contrasts, ref. [108] found that NVH exposure levels were not according to OSHA limits for Malaysian army 3-tonne trucks, and such discomfort implies that the risk to exposed occupants is existential. Also, ref. [109] a study of NVH Malaysian army tactical vehicle reported that speed impacted NVH parameters enhancing risk of higher exposure levels. Vibration levels did not exceed the OSHA limits evaluated, although the rear cabin noise and WBV were significant and required mitigation since passengers are potentially exposed to health risks. Since, as many tropics are developing and characterized by poor vehicle and road infrastructure, evaluating NVH is crucial to ensuring adequate IEQ in vehicles of these regions, necessitating adequate policy and regulatory measures, besides improved vehicle, and road conditions. In the scope of this SLR, few studies have assessed NVH in vehicles whereas discomforts linked to NVH affect IEQ conditions and hence pose occupational risk to drivers or passengers that are frequently exposed to these conditions. Also, as many tropics are developing and characterized by poor vehicle and road infrastructure, evaluating NVH is crucial to ensuring adequate IEQ in vehicles of these regions, necessitating adequate policy and regulatory measures, besides improved vehicle and road conditions. A study’s rationale was buttressed by the climatic and regional peculiarities of such a tropical climate and unpaved road conditions, and their conclusion was that road conditions impacted in-cabin noise levels whereas noise was higher on harsher road conditions with respect to vehicle speed. However, concerning the reported SPL values, it was not clear if mean SPL values were computed as arithmetic mean or noise equivalents [51], hence the need for clarifications since noise equivalent level the appropriate representation of the noise evolution surveyed for a defined time series [1]. Only the IEQ survey in Nigeria by [1] has reported on in/cabin lighting or visual comfort parameters citing the limitation of the survey to have been only for horizontal illuminance, without measurements of vertical illuminance and other parameters like glare in the train cabins evaluated. It is important to highlight that passenger travels in trains include many long-distance travels which can impact commuter comfort. Passengers require good lighting on these kinds of journeys more than on short haul trips. Visual comfort also contributes to the overall comfort of passengers during commute [168].
Summarily, several studies found noise risk in cabins owing to ambient noise levels linked to effects from factors like road conditions, travel route, vehicle speed and intrusion of ambient traffic noise. Also, other noise sources are due to interior noise levels linked to vehicle engines, structural noise and vibration, HVAC systems and vehicle occupants. While vehicular sources are important, the peculiarity of severe ambient noise levels and occupant behavior are significant sources in developing tropics. Sociocultural differences and inadequate regulations can enhance the noise exposure parameters of commuters including the related health risk from occupational exposure experienced by drivers and transport workers. Passengers in public mass transit are also at risk, especially with the risk of long-time commute including commute frequency. Since several studies have highlighted the in-cabin risk of commuter exposure to higher pollutant levels, such as PM and CO, in city hotspots and heavy traffic zones, there is need to evaluate noise exposure risk in hotspot or traffic zones due to the tendency of indiscriminate noise from use of vehicle horns, ambient traffic and roadside commercial activities, prominent in developing tropics.
4.1.4. Ventilation and Energy Efficiency
Several studies indicated the need for adequate ventilation systems and settings tropical PVCs. Also, the implications of energy efficiency have been addressed in some studies. A study emphasized the importance of reducing thermal loads and improving IAQ in PV, suggesting the use of shading and other measures to lower operational energy needs and enhance occupant comfort. This includes potential energy savings and risks associated with high thermal loads, especially in parked vehicles [19,54]. In a study, regulatory measures for transport vehicles were recommended due to contaminants in public vehicles, which can lead to allergenic sensitization or respiratory symptoms but remarked that increased natural ventilation and monitoring of upholstered seats and AC filters are necessary to mitigate continuous indoor contamination [55]. In a Nigerian study, thermal adequacy was linked to natural ventilation from windows and doors, but heat loads were observed to have increased during traffic stops and loading, causing discomfort. Overcrowding and heavy traffic were the main discomfort factors, with a suggested mixed approach for better human comfort assessment and viral spread risk evaluation [75]. Another Nigerian study, ref. [1] found ventilation gaps in train cabins, evaluating air exchange rate (AER) and fresh air flow rate parameters. Adequate ventilation strategies in public mass transit were affirmed to reduce microbial counts and improve IAQ, especially in overcrowded tropical cities [74] while [18], recommended that AC should be used in recirculation mode to limit PM penetration.
The common conclusions allude to ensuring adequate ventilation settings in PVCs. Studies have reported that open window settings significantly reduced in-vehicle CO2 levels. However, surveys have shown that hazardous pollutants like BC, PM (fine and ultrafine particles) are prone to rise in-cabin, especially when windows are completely open and ambient pollutant levels are severe. There are recommendations to engage hybrid settings of ventilation while considering IAQ and thermal comfort parameters. Vehicle interiors are prone to high thermal loads during open parking conditions that expose them to high solar irradiation. In the tropics, the ambient temperatures warrant the use of air conditioners for most seasons in the year, hence the need for adequate cabin management strategies to ensure comfortable indoor climate in tropical PVCs.
Interestingly, ref. [59] investigated and developed a control strategy for an automatic controller to enable the new multiple circuit AC system response to varied imposed-cooling loads. Energy savings coupled with compliance with thermal comfort range in the passenger bus cabin was achieved in tropical settings. The study findings suggest that the inlet and set temperature (imposed cooling loads) influenced comfort outcomes and energy savings. Also [62] investigated the temperature distribution inside two three-wheeler vehicle models and minimized the peak temperature and rapid temperature rise by utilizing Na2SO4·10-H2O as a PCM. three-wheeler vehicles are commonly used in tropics and south Asian countries, the study findings are of huge relevance given the indoor climate and energy implications. Their investigations focused on the applicability of PCM to reduced thermal loads in these vehicles, mitigating vehicle indoor thermal discomfort vis-a-vis energy savings for AC and more driving mileage benefits in EV, besides the inherent sustainability advantage as thermal storage in motorized transport. Another study [31] evaluated the effect of solar control glazing to enhance the thermal comfort of PV occupants in tropical climates. This approach is innovative as it assures better IEQ, energy efficiency, and sustainability measures. The study objectives allude to reports that 50% of AC work on thermal loads are from solar thermal loads, hence the use of glazing to reduce in-cabin solar loads which also impacts vehicle fuel consumption in the case of 3.4% with IR reflecting windshield lone over SCO3 driving cycle. Glazing car windows, windshields, and rooftops are veritable IEQ interventions for in-cabin solar thermal loads and vehicle energy consumption. Also, they recommended that glazing combined with other settings, such as AC in recirculation and fresh air input, enhanced energy, time, and cooling loads [31]. Moreover, ref. [30] designed a data-driven decision model with the Cubic SVM to identify the thermal environment levels and match satisfactory pre-conditioning solutions. At the same time, CEI was developed to evaluate the passengers’ satisfaction for multiple objectives. To enhance thermal comfort and energy management in vehicles. Additionally, to achieve better strategies for managing vehicle indoor climate through multiple satisfaction objectives. The findings reinforce that solar thermal loads and PVCs thermal insulation are critical to sustaining high in-cabin temperatures.
Since transportation energy use in developing countries (including developing tropics) has been on the rise [169], it is important to reduce and optimize energy use via reduced energy intensity and energy-efficient vehicle designs. Air conditioning accounts for a significant share of vehicle energy consumption besides mobility. Therefore, ensuring optimal ventilation settings in PVCs should optimize energy use without compromising in-vehicle IEQ. It is recommended that the tropics be given more attention to IEQ and energy implications owing to the tropical climate peculiarities of elevated temperatures and humidity, further exacerbated by climate change and global warming.
4.2. RQ3: The IEQ Gaps and Challenges in Tropical PVCs
The gaps found are categorized as study, regulatory, and infrastructural; there is a notable geographical imbalance, with most studies focused on tropical Asia. This leaves other tropical regions, particularly SSA and Latin America, underrepresented in research on IEQ in transport vehicles. This lack of regional diversity in studies suggests that tropical regions outside Asia face unique challenges that are not well-documented. Additionally, the existing research is often limited to certain vehicle types, primarily buses, with fewer studies addressing other common modes of transport, such as cars, motorcycles, and trains. Given the diversity of transport used in tropical regions, including motorcycles and small cars, it is essential to broaden the scope of studies to include all types of vehicles. Moreover, while many studies have focused on IAQ and TC, other important IEQ parameters, like acoustic and visual comfort, have received little attention, indicating a gap in the holistic assessment of IEQ in tropical transport vehicles. Furthermore, despite the growing relevance to transport MEs, emerging pollutants such as VOCs, ultrafine particles, and indoor allergens have been under-explored.
Other infrastructural peculiarities and challenges relating to tropics identified in the SLR studies include but are not limited to the following:
- ▪
- Elevated risk of ambient pollution reported in several exposure studies in traffic and hotspot areas, which enhance increased in-vehicle pollutant infiltration; a study explored correlation factors between in-car PM2.5 levels, ambient pollution, fuel price, socioeconomic status, and associated health risks in 10 cities. It was determined that both hotspot and free-flow zones contributed to high commuter exposure to PM2.5, with notable implications for health burdens and mortality rates in cities [42]. Six high-activity zones were surveyed and compared to cross-city routes, showing that AC mode lowered in-cabin pollutants except for CO, with ambient PM conditions from zones and construction activities impacting PM levels [85].
- ▪
- Vehicle type and mix (most still use fossil fuels and gas) enhance vehicular emissions and in-cabin risk due to self-pollution. A comparative study of personal PM2.5 exposures in two cities showed that newer vehicles with better ventilation technologies had lower PM levels [79]. A comparative survey of in-cabin BC levels in diesel- vs. biodiesel-fueled buses suggested that biodiesel, coupled with after-treatments and route changes, could reduce emissions risk. Street geometry and ambient BC ingress were also significant factors [84].
- ▪
- Road infrastructure, trip routes, and traffic management. A study quantified personal PM exposure in PVCs across 10 cities, finding higher exposure doses in less affluent cities and identifying key factors impacting PM levels. The findings are relevant to developing tropical cities characterized by socioeconomic discrepancies and inadequate transport infrastructures [42]. Furthermore, according to statistical findings by [93], wind significantly affects PM exposures, with variability across two-day periods and within modes. Brake systems, tire composition, ventilation systems, and tunnel depth were factors in metros, while wind speed and seasonality also impacted PM and CO levels. Though CO exposure in Hong Kong’s public transport was lower than in other cities, tunnel routes negatively affected in-cabin pollutant levels [81]. Traffic volume and routes also influenced in-cabin CO levels. The study identified traffic, self-pollution, number of stops, route, and speed as main drivers of in-cabin pollutants. Despite lower median BC levels, active modes resulted in higher exposure doses due to increased inhalation rates. The evaluation of in-vehicle CO levels highlighted severe health risks and the need for preventive measures during idling and traffic [77]. Travel mode, traffic load, and street configuration were found to affect dose and exposure in various mobility modes, with higher inhalation rates posing risks to pedestrians [78].
- ▪
- Inadequate amount or distribution of mass transit vehicles coupled with trip scheduling and inherent managerial issues enhancing overcrowding of tropic PVCs, as in trains, public buses and BRTs corroborate the need to improve mass transit vehicles for availability and ensure scheduling strategies to mitigate overcrowding tendencies. There is need to re-distribute vehicle categories towards the appropriate use concerning first and last mile deployment strategies, which can enhance sustainability, optimize energy intensity including ambient pollution risks besides other socio/economic and stakeholder benefits.
- ▪
- Inadequate ventilation systems and settings (including dependence solely on natural ventilation allowing unrestricted ingress of existential ambient pollution, inadequate HVAC systems in many public transport vehicles particularly in developing tropics) R Surveys conducted during hot-humid summers highlighted that travel mode, time of day, and background pollutant levels affected pollutant exposure variability. AC use was found to filter PM but not gaseous pollutants, emphasizing the need for fresh air dilution to reduce in-cabin levels [83]. A comparative study of personal PM2.5 exposures in two cities showed that newer vehicles with better ventilation technologies had lower PM levels [79].
On the regulatory side, there is a significant gap in developing and enforcing IEQ standards for tropical transport vehicles. The absence of local or national IEQ regulations for PVCs has been remarked on in several tropical studies [170]. Although a few studies have evaluated other IEQ standards and national standards [91]. The IEQ standards referenced by the studies reviewed include R. Most studies have used the WHO, ASHRAE, and ISO standards. Considering the peculiarity of the tropics and that 150 countries in the world are classified as tropical [171] there are comparative IEQ and regulatory gaps in the tropics. While many developed regions have established regulations to ensure acceptable IAQ, thermal comfort, and noise levels in cars, such standards are lacking or poorly enforced in tropical countries. This absence of regulations contributes to inadequate IEQ conditions in vehicles, leading to health risks for commuters. Additionally, even where regulations exist, their enforcement is often weak due to limited governmental resources, lack of technical expertise, and insufficient public awareness about the importance of IEQ in transport environments.
It is important to note that there are peculiarities in PVCs that impact the assurance of adequate IEQ, especially in comparison to building indoor spaces. Studies have reported the inhomogeneity of vehicle MEs [4]. This poses dynamic designating IEQ measures for IAQ (Ventilation parameters including air change, flow, and distribution) and comfort parameters. Typically, the metrics for evaluating some IEQ components (e.g., Thermal comfort, lighting, and ventilation rates) do not work in vehicles due to unsteady and non-homogeneous microclimatic conditions [172]. Moreover, IEQ studies have addressed the built environment, but no clear standardization framework is devoted to design criteria and evaluation methods for vehicles and other transport MEs. Notably, a study categorized IEQ standards according to their scope, noting that ISO 7730, ASHRAE 55, GB/T 50785, and SS 553 address thermal environment while ASHRAE 62.1, ASHRAE 62.2, AS 1668-2, SS 554, addressed IAQ requirements [173,174]. Most standards are more relevant in steady state and homogenous indoor environments, limiting their relevance to vehicle Mes. The ventilation rate ASHRAE 62.2 recommends is about 7.5 L/s/person (15 cfm/person) in buildings for sedentary occupants [174]. However, considering the high occupancy tendency in vehicle MEs, though also sedentary, as in residential buildings, achieving adequate IAQ will imply higher ventilation rates [1,175]. This suggests there is a need for well-defined criteria concerning vehicle MEs. Additionally, many studies have not distinguished the requirements for drivers and passengers in vehicles, though studies have shown that ventilation parameters may differ in passenger compartments from drivers’ cabins. A review reports that taxi and cab drivers are prone to higher IEQ and occupational exposure to health and comfort risk effects [176]. Studies are needed to consider these peculiarities, considering that drivers are prone to longer exposure time in cabins.
IEQ Gaps and the Peculiarities of Developing Tropics and SSA Countries
The IEQ gaps in PVCs reported require more critical attention in developing tropics and SSA countries for reasons related to some factors now discussed below.
Large and increasing population: IEQ in vehicles MEs remain unstudied in developing tropics and SSA countries if comparatively reviewed by the population index. The huge population index suggests higher commuter traffic within territories and outside territories. Limited mobility options and insufficient public mass transit vehicles are predisposing factors contributing to gaps in IAQ and thermal comfort, including noise. Deficits in transport systems mark many developing tropics. In some SSA countries, the train systems are broken, hence overdependence on buses or other non-sustainable means. This implies that more people are potentially at risk of poor IEQ in PVCs, including the associated health and comfort burdens. The low ratio of IEQ studies and regulatory measures to the high commuter traffic in these regions suggests a gap in IEQ since many are hosts to megacities and continue to experience huge population growth. Mobility needs are not only national but also concerned with migration and transport of goods and services, amongst other socioeconomic concerns.
Growing Urbanization: Several reports have highlighted the fast pace of urbanization, marked by an increase in motorized transport, industries, and commercial activities. Infrastructural and regulatory gaps persist in these developing tropics as the mobility and use of motorized transport increase. Vehicular emissions, increase in the use of private vehicles [5], and dependence on aged or used vehicles [23] from developed countries impacts ambient pollution parameters. The development of industry, real estate, and increased socioeconomics also imply an associated risk of environmental pollution. Since indoor is an extension of outdoor conditions, there remains a huge risk to in-vehicle commuter exposure, including other transport MEs.
Technology mix and dependence on fossil fuels and prevailing energy mix: Although several initiatives towards a more sustainable environment have begun and continue, the prevalent dependence on fossils both in vehicles and industries remains a huge factor that negatively impacts IEQ associated with vehicular and industrial emissions, poor ambient pollution in urban centers and traffic hot spots including in-vehicle exposure risk due to self-polluting vehicles and ambient emissions linked to DFBs, GFBs, and CNG- powered vehicles [18,42,43,81,116,123,147]. Notably, a study in Brazil suggested that bio-diesel buses coupled with other after-treatments will reduce emissions risk, including travel route changes [84]. Regarding noise, EVs have lower noise tendencies, which implies the inherent advantage of less ambient noise and in-vehicle noise in contrast to conventional fuel vehicles. Therefore, there is a need to reduce the prevailing dependence on fossils and non-green technologies in developing tropics to limit the associated risks of poor IEQ in vehicles and buildings.
Poor stakeholder awareness, policy, and regulatory deficits: As highlighted in the current SLR, the absence of local standards and inadequate environmental regulations coupled with negligent political systems towards relevant IEQ development and/or implementation are enabling factors of the associated risk of poor IEQ in PVCs in many developing tropics. However, more attention has been given to outdoor regulations than indoors. Also, there may be a general lack of adequate awareness by communities and policymakers of the socioeconomic and health burdens impacted by exposure to poor IEQ. The absence of national regulations for IEQ parameters poses a risk to design and maintenance compliances in PTVs and related infrastructures. The absence of policy or inadequate enforced regulations poses a systemic risk to achieving adequate IEQ in the indoor environments of these regions. The inadequate public awareness of IEQ and the associated risks for drivers and passengers play a direct and indirect role in the exposure risk to IEQ gaps. Several studies have discussed occupant behavior and IEQ in the context of buildings indoors, including a Ghanaian study that highlighted that behavioral changes could help prevent indoor air-related illnesses [177], but there are also reports of relevant psychological and sociological factors that affect IEQ outcomes in transport MEs [176]. In many SSA countries, commuters are not prohibited from certain activities such as eating, loud talking (religious and commercial publicity), or noise due to electronic gadgets, which are a few commuter dispositions that contribute to in-vehicle discomfort parameters, especially in public transport [178]. Simple actions by passengers or drivers, like opening/closing windows and changing AC settings, can reduce in-cabin thermal heat loads or poor IAQ, mitigate influenza risk, and enhance energy efficiency, besides other IEQ benefits. However, there is a need for more studies to explore commuter behavioral effects on IEQ in the transport settings of developing tropics and SSA countries, given the range of cultural peculiarities of people in these regions. These studies can enhance the pursuit of holistic approaches, including technological and regulatory reforms, plus improved stakeholder awareness of IEQ exposure risks.
Occupational exposure regulations: Although this challenge is policy-related, there is a need to emphasize that regulatory gaps and poor policy implementation enhance the risk of occupational exposure in many developing tropics. Drivers and transport workers are already prone to significant occupational health risks, hence the necessity for adequate regulatory interventions and management strategies to limit these risks. These driver occupational risks are crucial factors in developing tropics since several policy implementation gaps continue to prevail in transport work settings. Drivers’ health risks can result in critical safety factors that extend beyond vehicles indoors, such as road traffic accidents and mortality. Reports have indicated the high death tolls associated with RTA in middle-income countries, whereas most are developing tropics and SSA; for instance, in Nigeria, road traffic accidents (RTA) have been reported as the 3rd highest factor for fatality [179]. There is a dire need to ensure safer cabins for drivers in these regions. This underscores the importance of having more exploratory studies to evaluate the role of IEQ and driver occupation exposure, which can affect driving errors amongst other co-acting parameters and enhance the occurrence of RTAs in developing tropics. Moreover, implementing relevant occupational exposure and management strategies, particularly for truck and public bus drivers in developing tropics, is necessary.
4.3. RQ4: Mitigation Strategies to Combat IEQ Gaps of Tropical/Subtropical PVCs
Mitigation strategies from a combination of regulatory, infrastructural, technological, and socioeconomic strategy are necessary. Developing robust IEQ standards for passenger transport vehicles is critical from a regulatory perspective. Governments in tropical regions should create guidelines that address IAQ, TC, AC and VC, considering the unique challenges of tropical climates, such as elevated temperatures and humidity. These standards should be enforced through regular inspections and penalties for non-compliance. Additionally, regulatory frameworks should mandate regular vehicle maintenance and retrofitting, particularly for older vehicles, ensuring that air filtration systems, HVAC units, and ventilation systems meet established standards. Public awareness campaigns are also essential to educate commuters and transport operators about the importance of IEQ and the risks associated with poor indoor environments, encouraging better practices and public support for policy changes.
In terms of infrastructure, significant investments are needed to modernize public transport systems. This includes upgrading fleets to newer vehicles designed for tropical climates with more efficient HVAC systems, better air filtration, and improved thermal insulation. Findings from various studies reviewed affirmed the importance of adequate ventilation strategies in public mass transit to reduce microbial counts and improve IAQ, especially in overcrowded tropical cities [74]. Lastly, research highlighted the need for improved policy design and commuter awareness of PM risks, stressing the use of AC in recirculation mode to limit PM penetration and the exploration of PM1 levels in future studies [18].
Expanding mass transit systems like metro lines and tram networks would reduce overcrowding and lower vehicle pollution levels. Additionally, improving the surrounding infrastructure, such as roads, bus stations, and terminals, will reduce the ingress of external pollutants into vehicles and improve the overall environment for commuters. Urban planning incorporating green infrastructure, such as trees and corridors, can help mitigate urban heat island effects and improve the overall environmental conditions around transport systems. From a technological standpoint, innovations in HVAC systems can play a critical role in improving IEQ. The study suggested the use of Smart Control Logic for HVAC to enhance IAQ parameters, with future work potentially incorporating machine learning algorithms for better SCL for HVAC controls [48,59]. Installing advanced HVAC units that are optimized for tropical climates can help address both thermal discomfort and IAQ issues by providing better ventilation, reducing indoor pollutants, risk of allergenic sensitization [55], minimize influenza spread and public health crises [25] and maintaining comfortable temperatures [62] Innovative designs integrated into tropical PVCs, such as novel thinner ceiling circulator [63] and solar control glazing [31], data-driven decision model with Cubic SVM [30], Electrochromic and radiative cooling smart windows [66], blankets for dashboards and rear decks, and radiation-proof windscreens [71] including adequate redesign of AC systems and thermal insulation measures can enhance thermal comfort and energy efficiency in PVCs occupants in tropical climates. Using electric and hybrid vehicles can also help reduce pollution levels, as they emit fewer pollutants than traditional gasoline or diesel-powered vehicles. In addition, smart ventilation systems that adapt to real-time conditions, such as the number of passengers, indoor temperatures, and ambient air quality, can further enhance IAQ and thermal comfort. Incorporating noise control technologies and improving vehicle insulation can reduce in-cabin noise, another important aspect of IEQ.
Finally, socioeconomic strategies should be implemented to target high-risk areas in densely populated tropical megacities. These areas often face severe IEQ challenges due to overcrowded public transport systems and elevated ambient pollution levels. Interventions in these areas could include creating exclusive lanes for public transport, enhancing vehicle and route optimization, and implementing occupancy density controls. A study recommended using face covers, masks, AC and closed cabins to lower PM exposure, particularly for women and young children, to minimize commuting via minibuses and motorcycles. It stressed the need for policies addressing PM-associated risks and mitigation [51]. Providing safer, cleaner transport options for vulnerable groups, such as women, children, the elderly, and people with respiratory conditions, should also receive special attention.
Common conclusions drawn include the necessity for local IEQ standards like deductions by [6], the importance of reducing thermal loads, improving IAQ through effective ventilation strategies, and using advanced technologies like IoT and AI for enhanced indoor comfort and safety. The study also highlights the need for regulatory measures to mitigate health risks associated with poor IAQ and extreme thermal conditions.
5. Conclusions
The current study systematically reviewed 113 relevant studies focusing on the IEQ of PVCs in tropical and subtropical climate regions. The studies considered were accessible English publications, including scientific articles, technical papers, book chapters, and peer-reviewed conference papers published between 2000 and 2024. The review of the existing literature indicates that more attention has been given to outdoor environments in tropical regions than indoor environmental quality. Specifically, 78.2% of the studies were focused on tropical Asia, 12% on South America, 8.2% on tropical Africa, and approximately 1.8% on Oceania. However, regarding population indices, tropical Africa has been the least studied compared to both South America and Oceania.
RQ1. Notably, there has been more focus on IEQ in buildings across various climate contexts than on transport microenvironments. Furthermore, IEQ studies and interventions have primarily been reported in developed countries, particularly in non-tropical regions, with significantly less attention given to the tropics and even fewer studies conducted in developing tropical countries. The lack of accessible scientific research on IEQ in the SSA context indicates a pressing need for more IEQ interventions in tropical Africa. This underscores the importance of assessing IEQ in this region. Additionally, most existing studies have concentrated on IEQ parameters related to IAQ and personal exposure assessments across different transport modes. In contrast, other relevant parameters, such as noise and lighting, have received less investigation in tropical PVCs. In terms of methodology, most studies have experimentally assessed IEQ parameters, while only a few have utilized mixed methods that combine subjective and numerical approaches. Moreover, the IEQ standards and regulations currently in use largely apply to non-tropical climates, with minimal focus on tropical and subtropical areas. Many developing tropical regions lack adequate local IEQ regulatory standards. A review of the existing literature on IEQ reveals that only a handful of studies have examined IEQ in a tropical context, and none have solely focused on IEQ in passenger transport within the tropics.
RQ1 and RQ2. This SLR has identified several prevalent issues related to IEQ in tropical PVCs. These issues are primarily infrastructural and regulatory and can be addressed through several strategic categories. Infrastructural problems include reliance on fossil fuel and gas-powered vehicles, the age of vehicles often resulting from the significant import and use of second-hand vehicles in many developing tropical regions—and inadequate vehicle maintenance. Additional concerns encompass poor road infrastructure, insufficient traffic management, increased pollution from motorized transport, and subpar ventilation technology. This includes inadequate filtering systems, poorly maintained HVAC systems, and public transport design concerning vehicle capacity and occupancy density. Furthermore, transport and urban planning must be improved to minimize areas with high traffic and pollution levels. Future studies should investigate resilient tropical and indigenous materials in light of global warming and the associated risks of increased thermal loads indoors. This research should focus on enhancing insulation and managing thermal loads in vehicle interiors to better handle the challenges of high ambient heat, radiation, emissions, and other inorganic pollutants common in tropical environments. Passengers in transport cabins also face discomfort and health risks from noise, vibration, and harshness (NVH). Given that developing tropical regions often struggle with poor road infrastructure, outdated vehicle types, and inadequate maintenance, IEQ studies should include parameters beyond indoor climate (like IAQ and TC). It is crucial to consider the effects of NVH, as well as visual comfort, especially in trains where commuters often endure long-distance travel.
RQ2 and RQ3. Africa accounts for one-eighth of the world’s population, with large tropical regions experiencing rapid population growth, increased commuter traffic, and fast urbanization. These factors are significantly impacting health and socioeconomic conditions and contributing to climate change, energy consumption, and environmental pollution. Therefore, it is recommended that studies and interventions related to IEQ be increased in densely populated SSA countries, including Nigeria, the DRC, Ethiopia, Angola, Kenya, and Tanzania. Additionally, while examining different vehicle categories, only one study surveyed IEQ in trains within developing tropical regions of SSA. This indicates a need for future research to focus on trains, especially considering the potential risks associated with high commuter traffic if this mode of transportation expands. Furthermore, there have been no studies on truck cabins aside from those in India and Malaysia. Therefore, future studies should investigate the IEQ in truck cabins to address discomfort and health issues faced by truck drivers, as poorly maintained IAQ can lead to significant risks, including road traffic accidents linked to driver performance and occupational health problems. In tropical Asia, existing IEQ studies in transportation-related vehicles primarily focus on exposure and IAQ; however, there remains a gap in comprehensive IEQ studies, particularly concerning noise and visual comfort parameters. These aspects also affect the health and comfort of commuters. Moreover, interdisciplinary research is urgently needed that encompasses IEQ, exposure science, HVAC technology, socioeconomics, and policy. Such research could foster the development of relevant and comprehensive regulatory frameworks and institutions to implement effective interventions for safer indoor and outdoor environments in transportation modes, including subways, stations, bus stops, and passenger waiting areas while promoting sustainability and energy efficiency.
RQ4. The issues of IEQ in tropical regions extend beyond just the infrastructure and technology associated with IEQ. Therefore, raising awareness among the commuting public about IEQ concerns is essential to promote more mindful behaviors related to transport modes. Commuters should be encouraged to wear protective masks to reduce the risk of spreading infectious diseases, limit overcrowding in public transport vehicles, and minimize noise and other socioeconomic activities that contribute to ambient pollution within transportation environments. Additionally, there is a need for transport stakeholders, as well as public and research institutions in developing tropical regions, to collaborate on effective solutions to address IEQ gaps.
Recommendations
The current systematic literature review (SLR) findings support the recommendation to increase the number of indoor environmental quality (IEQ) studies in sub-Saharan Africa, South America, and tropical Oceania. Furthermore, it is recommended that more IEQ regulations and adapted standards be developed and implemented, considering the climatic, cultural, socioeconomic, and infrastructural peculiarities of tropical and subtropical regions. Recommendations include enhancing HVAC systems and ventilation strategies, as well as leveraging new vehicle technologies combined with AI and IoT solutions to improve IEQ and energy efficiency Notably, only one study in tropical Africa reported IEQ assessment of train cabins [1], with most studies focusing on buses and cars. Considering the shift towards more sustainable mass transit, increasing population, and rising commuter traffic in the tropics, more attention should be given to trains and metro systems in tropical Africa.
There are emerging gaps in existing research, including insufficient studies on new pollutants, a lack of effective regulatory frameworks, and limited attention to region-specific conditions. Also, very few studies assessed the IEQ of truck cabins and drivers (prone to exposure hours of poor IEQ and severe health and poor performance which can increase risk of RTAs), suggests need for more IEQ studies on trucks and drivers. Moreover, only a few studies have jointly assessed all IEQ parameters (indoor air quality, thermal comfort, acoustic comfort, and visual comfort) in tropical passenger vehicle cabins (PVCs). Most studies have assessed indoor climate (IAQ and TC) or individual parameters. It is recommended to conduct more holistic IEQ studies, as these four parameters will provide a better understanding of IEQ in PVCs.
Supplementary Materials
The following supporting information can be downloaded at: https://www.mdpi.com/article/10.3390/atmos16020140/s1, File S1: WOS and SD search string; Figure S1: VOSviewer screenshot.
Author Contributions
Conceptualization, J.O.O.; methodology, J.O.O., A.S.N.R. and M.G.d.S.; validation, J.O.O., J.O., J.-P.K.B.N. and M.G.d.S.; formal analysis, J.O.O., J.O., J.-P.K.B.N., A.S.N.R. and M.G.d.S.; investigation, J.O.O.; resources, J.O.O. and M.G.d.S.; data curation, J.O.O.; writing—original draft preparation, J.O.O.; writing—review and editing, J.O.O., J.-P.K.B.N., J.O., A.S.N.R. and M.G.d.S.; visualization, J.O.O., J.-P.K.B.N. and J.O.; supervision, A.S.N.R. and M.G.d.S.; project administration, A.S.N.R. and M.G.d.S.; funding acquisition, A.S.N.R. and M.G.d.S. All authors have read and agreed to the published version of the manuscript.
Funding
J.O.O has a grant Ref: UI/BD/152067/2021, sponsored by the Fundação para a Ciência e a Tecnologia (FCT)—IUDB/50022/2020 and IUDP/50022/2020 within the Associate Laboratory of Energy, Transports and Aerospace (LAETA) project; LA/P/0079/2020, DOI: 10.54499/LA/P/0079/2020.
Institutional Review Board Statement
Not applicable.
Informed Consent Statement
Not applicable.
Acknowledgments
The present work was developed in the framework of the Energy for Sustainability Initiative of the University of Coimbra and was supported by LAETA.
Conflicts of Interest
The authors declared no conflicts of interest.
Nomenclature
| AC | Air Conditioned |
| AC + FA | Air conditioning plus fresh air |
| AC + EC | Air conditioning with external circulation |
| AC + IC | Air conditioning with internal circulation |
| AC + REC | Air conditioning plus recirculation |
| AC | Acoustic comfort |
| ACH | Air Changes per Hour |
| AER | Air exchange rate |
| AI | Artificial Intelligence |
| AR | Auto rickshaw |
| ASHRAE | American Society of Heating, Refrigerating and Air-Conditioning Engineers |
| BC | Black Carbon |
| BLDC | Brushless Direct Current |
| BRT | Bus Rapid Transit |
| BVFA | Bacteria, Viruses, Fungi, and Allergens |
| CEI | Comprehensive Evaluation Index |
| CFD | Computational Fluid Dynamics |
| CNG | Compressed Natural Gas |
| CO | Carbon Monoxide |
| DI | Discomfort Index |
| DOE | Design of Experiments |
| eBC | Equivalent Black carbon |
| EC | External Circulation |
| EM | Experimental methods |
| EV | Electric Vehicle |
| FA | Fresh air |
| HI | Heat Index |
| HVAC | Heating, Ventilation, and Air Conditioning |
| IAQ | Indoor Air Quality |
| IC | Internal Circulation |
| IEQ | Indoor Environmental Quality |
| IoT | Internet of Things |
| IR | Infrared |
| ISO | International Organization for Standardization |
| MEs | Micro-environments |
| MLA | Machine learning algorithm |
| MM | Mathematical models |
| MRT | Mean Radiant Temperature |
| NAC | Non-Air conditioned |
| NV | Naturally Ventilated |
| NVH | Noise vibration and Harshness |
| NAAQS | National Ambient Air Quality Standards |
| OEVF | Opened Exhaust Ventilation Fans |
| OSHA | Occupational Safety and Health Administration |
| PCM | Phase Change Material |
| PAC | Portable air cleaner |
| PE | Personal Exposure |
| PM1 | Particulate Matter (1 μm) |
| PM10 | Particulate Matter (10 μm) |
| PM2.5 | Particulate Matter (2.5 μm) |
| PMV | Predicted Mean Vote |
| PN | Particle number |
| PPD | Predicted Percentage Dissatisfied |
| PRISMA | Preferred Reporting Items for Systematic Reviews and Meta-Analyses |
| PVCs | Passenger Vehicle Cabins |
| PVs | Passenger vehicles |
| PWS | Partial Window Settings |
| REC | Recirculation Mode |
| RH | Relative Humidity |
| RPC | Railway pantry car |
| SET | Standard Effective Temperature |
| SLR | Systematic Literature Review |
| SSA | Sub-Saharan Africa |
| Ta | Air Temperature |
| Tcabin | Cabin Temperature |
| Teq | Equivalent Temperature |
| Tg | Globe Temperature |
| Tr | Mean radiant temperature |
| TRAP | Traffic-Related Air Pollution |
| Ts | Surface Temperature |
| TSI | Thermal Sensation Index |
| TWS | Thermal Window Systems |
| UFP | Ultrafine Particles |
| UV | Ultraviolet |
| Va | Air velocity |
| VC | Visual Comfort |
| VOCs | Volatile Organic Compounds |
| WBGT | Wet-Bulb Globe Temperature |
| WC | Windows Closed |
| WHO | World Health Organization |
| WO | Windows Open |
References
- Ogundiran, J.O.; Nyembwe, J.P.K.B.; Ribeiro, A.S.N.; Gameiro da Silva, M. Indoor Environmental Quality Assessment of Train Cabins and Passenger Waiting Areas: A Case Study of Nigeria. Sustainability 2023, 15, 16533. [Google Scholar] [CrossRef]
- Bandi, P.; Manelil, N.P.; Maiya, M.P.; Tiwari, S.; Thangamani, A.; Tamalapakula, J.L. Influence of flow and thermal characteristics on thermal comfort inside an automobile cabin under the effect of solar radiation. Appl. Therm. Eng. 2022, 203, 117946. [Google Scholar] [CrossRef]
- Lin, N.; Du, W.; Wang, J.; Yun, X.; Chen, L. The effect of COVID-19 restrictions on particulate matter on different modes of transport in China. Environ. Res. 2022, 207, 112205. [Google Scholar] [CrossRef]
- Chen, B.; Lian, Y.; Xu, L.; Deng, Z.; Zhao, F.; Zhang, H.; Liu, S. State-of-the-art thermal comfort models for car cabin Environment. Build. Environ. 2024, 262, 111825. [Google Scholar] [CrossRef]
- Trouve, M.; Lesteven, G.; Leurent, F. Private Motorization in Worldwide Developing Countries Metropolitan Areas: Patterns in the Early 21th Century; HAL Open Science: Arusha, France, 2018. [Google Scholar]
- Nyembwe, J.-P.K.B.; Ogundiran, J.O.; Chenari, B.; Simões, N.A.V.; Gameiro da Silva, M. The Indoor Climate of Hospitals in Tropical Countries: A Systematic Review. Energies 2023, 16, 3513. [Google Scholar] [CrossRef]
- Moher, D.; Liberati, A.; Tetzlaff, J.; Altman, D.G. Guidelines and Guidance Preferred Reporting Items for Systematic Reviews and Meta-Analyses: The PRISMA Statement. PLoS Med. 2009, 6, e1000097. [Google Scholar] [CrossRef]
- Callander, E.J.; Topp, S.M. Health inequality in the tropics and its costs: A Sustainable Development Goals alert. Int. Health 2020, 12, 395–410. [Google Scholar] [CrossRef]
- Rodriguez, C.M.; D’Alessandro, M. Indoor thermal comfort review: The tropics as the next frontier. Urban Clim. 2019, 29, 100488. [Google Scholar] [CrossRef]
- Marcotullio, P.J.; Keßler, C.; Quintero Gonzalez, R.; Schmeltz, M. Urban Growth and Heat in Tropical Climates. Front. Ecol. Evol. 2021, 9, 616626. [Google Scholar] [CrossRef]
- Davey, T.H. Population Growth in The Tropics. Health Educ. J. 1948, 6, 150–154. [Google Scholar] [CrossRef]
- State of the Tropics Leadership Group. Sustainable Infrastructure in the Tropics; James Cook University: Townsville City, Australia, 2017; Available online: https://www.jcu.edu.au/__data/assets/pdf_file/0004/473503/SOTT-2017-Infrastructure-Report_V02.pdf (accessed on 4 December 2024).
- State of the Tropics Leadership Group. Health in The Tropics; James Cook University: Townsville City, Australia, 2019; Available online: https://www.jcu.edu.au/__data/assets/pdf_file/0012/864993/SOTT-Health-Report-2019-Webv02.pdf (accessed on 3 December 2024).
- Asia, Africa. Trends and Patterns of Urbanisation in The Urban Century. n.d.
- Gu, D.; Andreev, K.E.; Dupre, M. Major Trends in Population Growth Around the World. China CDC Wkly. 2021, 3, 604–613. [Google Scholar] [CrossRef] [PubMed]
- Khreis, H.; Warsow, K.M.; Verlinghieri, E.; Guzman, A.; Pellecuer, L.; Ferreira, A.; Jones, I.; Heinen, E.; Rojas-Rueda, D.; Mueller, N.; et al. The health impacts of traffic-related exposures in urban areas: Understanding real effects, underlying driving forces and co-producing future directions. J. Transp. Health 2016, 3, 249–267. [Google Scholar] [CrossRef]
- Ekpenyong, C.E.; Ettebong, E.O.; Akpan, E.E.; Samson, T.K.; Daniel, N.E. Urban city transportation mode and respiratory health effect of air pollution: A cross-sectional study among transit and non-transit workers in Nigeria. JBM Open 2012, 2, e001253. [Google Scholar] [CrossRef]
- Singh, V.; Agarwal, A. Variation of PM2.5 and inhalation dose across transport microenvironments in Delhi. Transp. Res. D Transp. Environ. 2024, 127, 104061. [Google Scholar] [CrossRef]
- Ravindra, K.; Agarwal, N.; Mor, S. Assessment of thermal comfort parameters in various car models and mitigation strategies for extreme heat-health risks in the tropical climate. J Environ. Manag. 2020, 267, 110655. [Google Scholar] [CrossRef] [PubMed]
- Rolle, A.; Schmandt, B.; Guinet, C.; Bengler, K. Assessment of Thermal Comfort in Different Vehicle Classes—The Suitability of ISO 14505-2:2006-12. In Proceedings of the 21st Congress of the International Ergonomics Association (IEA 2021), Online, 13–18 June 2021; Springer: Berlin/Heidelberg, Germany, 2021; pp. 806–813. [Google Scholar] [CrossRef]
- Okokon, E.O.; Taimisto, P.; Turunen, A.W.; Amoda, O.A.; Fasasi, A.E.; Adeyemi, L.G.; Juutilainen, J.; Lanki, T. Particulate air pollution and noise: Assessing commuter exposure in Africa’s most populous city. J. Transp. Health 2018, 9, 150–160. [Google Scholar] [CrossRef]
- Adon, M.; Yoboué, V.; Galy-Lacaux, C.; Liousse, C.; Diop, B.; Doumbia, E.H.T.; Gardrat, E.; Ndiaye, S.A.; Jarnot, C. Measurements of NO2, SO2, NH3, HNO3 and O3 in West African urban environments. Atmos. Environ. 2016, 135, 31–40. [Google Scholar] [CrossRef]
- Agbo, K.E.; Walgraeve, C.; Eze, J.I.; Ugwoke, P.E.; Ukoha, P.O.; Van Langenhove, H. A review on ambient and indoor air pollution status in Africa. Atmos. Pollut. Res. 2021, 12, 243–260. [Google Scholar] [CrossRef]
- Yin, X.; Thai, B.N.; Tan, Y.Q.; Salinas, S.V.; Yu, L.E.; Seow, W.J. When and where to exercise: An assessment of personal exposure to urban tropical ambient airborne pollutants in Singapore. Sci. Total Environ. 2024, 906, 167086. [Google Scholar] [CrossRef]
- Hanley, B.P.; Borup, B. Aerosol influenza transmission risk contours: A study of humid tropics versus winter temperate zone. Virol. J. 2010, 7, 98. [Google Scholar] [CrossRef] [PubMed]
- Knibbs, L.D.; Morawska, L.; Bell, S.C. The risk of airborne influenza transmission in passenger cars. Epidemiol. Infect. 2012, 140, 47420138. [Google Scholar] [CrossRef]
- Leitmeyer, K.; Adlhoch, C. Review Article. Epidemiology 2016, 27, 743–751. [Google Scholar] [CrossRef]
- Bertone, M.; Mikszewski, A.; Stabile, L.; Riccio, G.; Cortellessa, G.; D’Ambrosio, F.; Papa, V.; Morawska, L.; Buonanno, G. Assessment of SARS-CoV-2 airborne infection transmission risk in public buses. Geosci. Front. 2022, 13, 101398. [Google Scholar] [CrossRef]
- Mahmud, H.; Islam, M.; Khan, M.E.J.; Ahmed, D.H. Indoor thermal management of a public transport with phase change material (PCM). Energy Ecol. Environ. 2023, 8, 241–261. [Google Scholar] [CrossRef]
- Li, W.; Chen, J.; Lan, F. Environmental conditions driven method for automobile cabin pre-conditioning with multi-satisfaction objectives. PLoS ONE 2022, 17, e0266672. [Google Scholar] [CrossRef]
- Tamalapakula, J.L. In-Situ Studies on the Effect of Solar Control Glazings on In-Cabin Thermal Environment in Hot and Humid Climatic Zones; SAE Technical Paper; SAE International: Warrendale, PA, USA, 2020; Volume 2020. [Google Scholar] [CrossRef]
- Dodwad, A.; Nagarhalli, P.V.; Fartade, S.; Ahire, U.N. Improvement of AC System for Bus with Tropical/Hot Ambient Application; SAE Technical Paper; SAE International: Warrendale, PA, USA, 2023. [Google Scholar] [CrossRef]
- Kim, E.-B.; Park, J.-K.; Jung, W.-S. Estimation of Expected Temperature Using Heat Balance Model and Observation Data. Asian J. Atmos. Environ. 2015, 9, 214–221. [Google Scholar] [CrossRef]
- Orzechowski, T.; Skrobacki, Z. Evaluation of thermal conditions inside a vehicle cabin. EPJ Web Conf. 2016, 114, 02085. [Google Scholar] [CrossRef]
- Otuyo, M.K.; Nadzir, M.S.M.; Latif, M.T.; Din, S.A.M. A Review of Personal Exposure Studies in Asian Public Transport Microenvironments: Lessons Learned and Future Directions. Environ. Sci. Polut. Res. 2023. preprint. [Google Scholar] [CrossRef] [PubMed]
- Feng, C.; Ma, F.; Wang, R.; Li, W.; Gao, J. A thermal comfort evaluation on vehicular environments based on local human body thermal sensations. Res. Eng. 2023, 17, 100907. [Google Scholar] [CrossRef]
- Faber, J.; Brodzik, K. Air quality inside passenger cars. AIMS Environ. Sci. 2017, 4, 112–133. [Google Scholar] [CrossRef]
- Xu, B.; Chen, X.; Xiong, J. Air quality inside motor vehicles’ cabins: A review. Indoor Built Environ. 2018, 27, 452–465. [Google Scholar] [CrossRef]
- Zulauf, N.; Dröge, J.; Klingelhöfer, D.; Braun, M.; Oremek, G.M.; Groneberg, D.A. Indoor Air Pollution in Cars: An Update on Novel Insights. Int. J. Env. Res. Public Health 2019, 16, 2441. [Google Scholar] [CrossRef]
- ANSI/ASHRAE Standard 55-2020; Thermal Environmental Conditions for Human Occupancy. ASHRAE: Peachtree Corners, GA, USA, 2020.
- Manu, S.; Burgholz, T.M.; Nabilou, F.; Rewitz, K.; El-Mokadem, M.; Yadav, M.; Chinazzo, G.; Rupp, R.F.; Azar, E.; Syndicus, M.; et al. A state-of-the-art, systematic review of indoor environmental quality studies in work-from-home settings. Build. Environ. 2024, 259, 111652. [Google Scholar] [CrossRef]
- Kumar, P.; Hama, S.; Abbass, R.A.; Nogueira, T.; Brand, V.S.; Abhijith, K.V.; Andrade, M.d.F.; Asfaw, A.; Aziz, K.H.; Cao, S.-J.; et al. Potential health risks due to in-car aerosol exposure across ten global cities. Environ. Int. 2021, 155, 106688. [Google Scholar] [CrossRef] [PubMed]
- Kumar, P.; Hama, S.; Nogueira, T.; Abbass, R.A.; Brand, V.S.; de Fatima Andrade, M.; Asfaw, A.; Aziz, K.H.; Cao, S.J.; El-Gendy, A.; et al. In-car particulate matter exposure across ten global cities. Sci. Total Environ. 2021, 750, 141395. [Google Scholar] [CrossRef]
- Pradhan, D.S.; Patra, A.K.; Santra, S.; Penchala, A.; Sahu, S.P.; Nazneen. In-cabin Particulate Matter Exposure of Heavy Earth Moving Machinery Operators in Indian Opencast Coal Mine. Aeroso. Sci. Eng. 2024, 1–18. [Google Scholar] [CrossRef]
- Tran, P.T.M.; Kalairasan, M.; Beshay, P.F.R.; Balasubramanian, R. In-car occupants’ exposure to airborne fine particles under different ventilation settings: Practical implications. Atmos. Environ. 2024, 318, 120271. [Google Scholar] [CrossRef]
- Charoenca, N.; Hamann, S.L.; Kungskulniti, N.; Sangchai, N.; Osot, R.; Kasemsup, V.; Ruangkanchanasetr, S.; Jongkhajornpong, P. Air Pollution inside Vehicles: Making a Bad Situation Worse. Int. J. Environ. Res. Public Health 2023, 20, 6970. [Google Scholar] [CrossRef]
- Odekanle, E.L.; Fakinle, B.S.; Jimoda, L.A.; Okedere, O.B.; Akeredolu, F.A.; Sonibare, J.A. In-vehicle and pedestrian exposure to carbon monoxide and volatile organic compounds in a mega city. Urban Clim. 2017, 21, 173–182. [Google Scholar] [CrossRef]
- Thanikachalam, G.; Selvam, D.K.; Raut, N.; Lakshmanan, R.; Reddy, R. Improving Cabin Comfort With Smart Auto-Flap HVAC Control. In Proceedings of the ITEC-India 2023—5th International Transportation Electrification Conference: eAMRIT—Accelerating e-Mobility Revolution for India’s Transportation, Chennai, India, 12–15 December 2023. [Google Scholar] [CrossRef]
- Aziz, S.A.A.; Gani, A.; Suhaimi, A.F.; Kalil, S.; Md Yusuf, A.Y.; Nuawi, M.Z. Noise exposure inside a passenger car cabin in tropical environmental condition. Def. ST Tech. Bull. 2017, 10, 290–296. [Google Scholar]
- ISO 5128:2023; Acoustics—Measurement of Interior Vehicle Noise. ISO: Geneva, Switzerland, 2023.
- Patel, D.; Shibata, T.; Wilson, J.; Maidin, A. Challenges in evaluating PM concentration levels, commuting exposure, and mask efficacy in reducing PM exposure in growing, urban communities in a developing country. Sci. Total Environ. 2016, 543, 416–424. [Google Scholar] [CrossRef] [PubMed]
- EN 16798-1:2019; Energy Performance of Buildings—Part 1: Indoor Environmental Input Parameters for Design and Assessment of Energy Performance of Buildings Addressing Indoor Air Quality, Thermal Environment, Lighting, and Acoustics—Module M1-6. European Committee for Standardization: Brussels, Belgium, 2019.
- EN 13272-1:2019; Railway Applications—Electrical Lighting for Rolling Stock in Public Transport Systems. European Committee for Standardization: Brussels, Belgium, 2019.
- Othoman, M.A.; Fouzi, M.S.M.; Nordin, A. Assessment of thermal comfort in a car cabin under sun radiation exposure. In Engineering Applications for New Materials and Technologies; Advanced Structured Materials; Springer: Cham, Switzerland, 2018; Volume 85, pp. 469–479. [Google Scholar] [CrossRef]
- Pereira, F.L.; Silva, D.A.O.; Sopelete, M.C.; Sung, S.S.J.; Taketomi, E.A. Mite and cat allergen exposure in Brazilian public transport vehicles. Ann. Allergy Asthma Immunol. 2004, 93, 179–184. [Google Scholar] [CrossRef] [PubMed]
- Eldegwy, A.; Khalil, E.E. Passengers’ thermal comfort in private car cabin in hot climate. In Proceedings of the 2018 Joint Propulsion Conference, Cincinnati, OH, USA, 9–11 July 2018. [Google Scholar] [CrossRef]
- ANSI/ASHRAE Standard 55-2020; Thermal Environmental Conditions for Human Occupancy. ASHRAE: Peachtree Corners, GA, USA, 2021.
- ISO 7730:2005; Ergonomics of the Thermal Environment. ISO: Geneva, Switzerland, 2005.
- Khamis Mansour, M.; Musa, M.N.; Wan Hassan, M.N.; Saqr, K.M. Development of novel control strategy for multiple circuit, roof top bus air conditioning system in hot humid countries. Energy Convers. Manag. 2008, 49, 1455–1468. [Google Scholar] [CrossRef]
- EN 15251:2007; Indoor Environmental Input Parameters for Design and Assessment of Energy Performance of Buildings Addressing Indoor Air Quality, Thermal Environment, Lighting and Acoustics. European Committee for Standardization: Brussels, Belgium, 2007.
- ISHRAE (Indian Society of Heating R and ACE). ISHRAE HVAC Handbook. Part 1—Air Conditioning; ISHRAE: Delhi, India, 2007. [Google Scholar]
- Alam, M.S.; Salve, U.R. Enhancement of thermal comfort inside the kitchen of non-airconditioned railway pantry car. Int. J. Heat Technol. 2021, 39, 275–291. [Google Scholar] [CrossRef]
- Ochiai, T.; Oda, S.; Sakai, M.; Ishiguro, S. Thin Ceiling Circulator to Enhance Thermal Comfort and Cabin Space; SAE Technical Papers; SAE International: Warrendale, PA, USA, 2019; Volume 2019. [Google Scholar] [CrossRef]
- ISO 7726:1998; Ergonomics of the Thermal Environment—Instruments for Measuring Physical Quantities. ISO: Geneva, Switzerland, 1998.
- ISO 14505:2006; Ergonomics of the Thermal Environment—Evaluation of Thermal Environments in Vehicles. ISO: Geneva, Switzerland, 2006.
- Duan, Z.; Wu, S.; Sun, H.; Lin, B.; Ding, P.; Cui, T.; To, J.; Zhang, X. Improvements in energy saving and thermal comfort for electric vehicles in summer through coupled electrochromic and radiative cooling smart windows. Build. Simul. 2024, 17, 1231–1251. [Google Scholar] [CrossRef]
- GB 7258-2017; Technical Specifications for Safety of Power-driven Vehicles Operating on Roads. Standards Press of China: Beijing, China, 2017.
- Bhateja, A. Impact of Different Types of Glazing on Thermal Comfort of Vehicle Occupants; SAE Technical Papers; SAE International: Warrendale, PA, USA, 2020; Volume 2020. [Google Scholar] [CrossRef]
- IS 2553-1 (1990); Safety Glass, Part 1: General Purpose. Bureau of Indian Standards (BIS): New Delhi, India, 1990.
- Kandasamy, N.; Kota, K.N.; Joshi, P. Numerical Evaluation of Vehicle Orientation and Glazing Material Impact on Cabin Climate and Occupant Thermal Comfort; SAE Technical Papers; SAE International: Warrendale, PA, USA, 2017; Volume 2017. [Google Scholar] [CrossRef]
- Hamid, M.K.A.; Singh, R.; Zain, M.Z.M.; Daud, Z.H.C.; Mazali, I.I.; Bakar, A.R.A. Experimental study on the improvement of thermal comfort inside a car cabin. In AIP Conference Proceedings; American Institute of Physics Inc.: College Park, MD, USA, 2023; Volume 2749. [Google Scholar] [CrossRef]
- Alam, M.S.; Arunachalam, M.; Salve, U.R. A pilot study on thermal comfort in Indian Railway pantry car chefs. J. Phys. Conf. Ser. 2019, 1240, 012033. [Google Scholar] [CrossRef]
- Ibrahim, F.; Ab Aziz, S.A. Study On Human Comfort of Military Vehicles in Malaysian Tropical Environment. Def. ST Tech. Bull. 2023, 16, 57–63. [Google Scholar]
- Luksamijarulkul, P.; Arunchai, N.; Luksamijarulkul, S.; Kaewboonchoo, O. Improving microbial air quality in air-conditioned mass transport buses by opening the bus exhaust ventilation fans. Southeast Asian J. Trop. Med. Public Health 2005, 36, 1032–1038. [Google Scholar] [PubMed]
- Kamiyo, O. Improving Thermal Comfort and Ventilation in Commercial Buses in Nigeria in Covid-19 Era. ABUAD J. Eng. Res. Dev. 2022, 5, 41–50. [Google Scholar]
- Alam, M.S.; Sharma, M.; Jadhav, G. Evaluating the influence of ambient conditions in the cooking space of railway pantry car using selected thermal indices and physiological parameter. Work 2024, 1–10, preprint. [Google Scholar] [CrossRef] [PubMed]
- Aswin Giri, J.; Karthikeyan, S.; Gokul Raj, M. Effect of ambient concentration of carbon monoxide (Co) on the in-vehicle concentration of carbon monoxide in chennai, india. Environ. Eng. Res. 2021, 26, 200165. [Google Scholar] [CrossRef]
- Betancourt, R.M.; Galvis, B.; Balachandran, S.; Ramos-Bonilla, J.P.; Sarmiento, O.L.; Gallo-Murcia, S.M.; Contreras, Y. Exposure to fine particulate, black carbon, and particle number concentration in transportation microenvironments. Atmos. Environ. 2017, 157, 135–145. [Google Scholar] [CrossRef]
- Castillo-Camacho, M.P.; Tunarrosa-Grisales, I.C.; Chacón-Rivera, L.M.; Guevara-Luna, M.A.; Belalcázar-Cerón, L.C. Personal Exposure to PM2.5 in the Massive Transport System of Bogota and Medellin, Colombia. Asian J. Atmos. Environ. 2020, 14, 210–224. [Google Scholar] [CrossRef]
- Carvalho, A.M.; Krecl, P.; Targino, A.C. Variations in individuals’ exposure to black carbon particles during their daily activities: A screening study in Brazil. Environ. Sci. Pollut. Res. 2018, 25, 18412–18423. [Google Scholar] [CrossRef]
- Targino, A.C.; Rodrigues, M.V.C.; Krecl, P.; Cipoli, Y.A.; Ribeiro, J.P.M. Commuter exposure to black carbon particles on diesel buses, on bicycles and on foot: A case study in a Brazilian city. Environ. Sci. Pollut. Res. 2018, 25, 1132–1146. [Google Scholar] [CrossRef] [PubMed]
- Shen, J.; Gao, Z. Commuter exposure to particulate matters in four common transportation modes in Nanjing. Build. Environ. 2019, 156, 156–170. [Google Scholar] [CrossRef]
- deSouza, P.; Lu, R.; Kinney, P.; Zheng, S. Exposures to multiple air pollutants while commuting: Evidence from Zhengzhou, China. Atmos. Environ. 2021, 247, 118168. [Google Scholar] [CrossRef]
- Targino, A.C.; Krecl, P.; Cipoli, Y.A.; Oukawa, G.Y.; Monroy, D.A. Bus commuter exposure and the impact of switching from diesel to biodiesel for routes of complex urban geometry. Environ. Pollut. 2020, 263, 114601. [Google Scholar] [CrossRef]
- Abbass, R.A.; Kumar, P.; El-Gendy, A. Car users exposure to particulate matter and gaseous air pollutants in megacity Cairo. Sustain. Cities Soc. 2020, 56, 102090. [Google Scholar] [CrossRef]
- Manojkumar, N.; Monishraj, M.; Srimuruganandam, B. Commuter exposure concentrations and inhalation doses in traffic and residential routes of Vellore city, India. Atmos. Pollut. Res. 2021, 12, 219–230. [Google Scholar] [CrossRef]
- Pant, P.; Habib, G.; Marshall, J.D.; Peltier, R.E. PM2.5 exposure in highly polluted cities: A case study from New Delhi, India. Environ. Res. 2017, 156, 167–174. [Google Scholar] [CrossRef] [PubMed]
- Sabapathy, A.; Saksena, S.; Flachsbart, P. Environmental justice in the context of commuters’ exposure to CO and PM10 in Bangalore, India. J. Expo. Sci. Environ. Epidemiol. 2015, 25, 200–207. [Google Scholar] [CrossRef]
- Tong, R.; Zhang, L.; Yang, X.; Zhou, P.; Xu, S. Probabilistic health risk of volatile organic compounds (VOCs): Comparison among different commuting modes in Guangzhou, China. Hum. Ecol. Risk Assess. 2019, 25, 637–658. [Google Scholar] [CrossRef]
- Gong, Y.; Wei, Y.; Cheng, J.; Jiang, T.; Chen, L.; Xu, B. Health risk assessment and personal exposure to Volatile Organic Compounds (VOCs) in metro carriages—A case study in Shanghai, China. Sci. Total Environ. 2017, 574, 1432–1438. [Google Scholar] [CrossRef] [PubMed]
- Xu, B.; Wu, Y.; Gong, Y.; Wu, S.; Wu, X.; Zhu, S.; Liu, T. Investigation of volatile organic compounds exposure inside vehicle cabins in China. Atmos. Pollut. Res. 2016, 7, 215–220. [Google Scholar] [CrossRef]
- Shiohara, N.; Fernández-Bremauntz, A.A.; Jiménez, S.B.; Yanagisawa, Y. The commuters’ exposure to volatile chemicals and carcinogenic risk in Mexico City. Atmos. Environ. 2005, 39, 3481–3489. [Google Scholar] [CrossRef]
- Gómez-Perales, J.E.; Colvile, R.N.; Nieuwenhuijsen, M.J.; Fernández-Bremauntz, A.; Gutiérrez-Avedoy, V.J.; Páramo-Figueroa, V.H.; Blanco-Jiménez, S.; Bueno-López, E.; Mandujano, F.; Bernabé-Cabanillas, R.; et al. Commuters’ exposure to PM2.5, CO, and benzene in public transport in the metropolitan area of Mexico City. Atmos Env. 2004, 38, 1219–1229. [Google Scholar] [CrossRef]
- Chan, L.Y.; Liu, Y.M. Carbon monoxide levels in popular passenger commuting modes traversing major commuting routes in Hong Kong. Atmos. Environ. 2001, 35, 2637–2646. [Google Scholar] [CrossRef]
- Maji, K.J.; Namdeo, A.; Hoban, D.; Bell, M.; Goodman, P.; Nagendra, S.S.; Barnes, J.; De Vito, L.; Hayes, E.; Longhurst, J.; et al. Analysis of various transport modes to evaluate personal exposure to PM2.5 pollution in Delhi. Atmos. Pollut. Res. 2021, 12, 417–431. [Google Scholar] [CrossRef]
- Gupta, S.K.; Elumalai, S.P. Exposure to traffic-related particulate matter and deposition dose to auto rickshaw driver in Dhanbad, India. Atmos. Pollut. Res. 2019, 10, 1128–1139. [Google Scholar] [CrossRef]
- Goel, R.; Gani, S.; Guttikunda, S.K.; Wilson, D.; Tiwari, G. On-road PM2.5 pollution exposure in multiple transport microenvironments in Delhi. Atmos. Environ. 2015, 123, 129–138. [Google Scholar] [CrossRef]
- Kolluru, S.S.R.; Patra, A.K.; Sahu, S.P. A comparison of personal exposure to air pollutants in different travel modes on national highways in India. Sci. Total Environ. 2018, 619–620, 155–164. [Google Scholar] [CrossRef]
- Gokul Raj, M.; Karthikeyan, S. Effect of modes of transportation on commuters’ exposure to fine particulate matter (PM2.5) and nitrogen dioxide (NO2) in Chennai, India. Environ. Eng. Res. 2020, 25, 898–907. [Google Scholar] [CrossRef]
- Namdeo, A.; Ballare, S.; Job, H.; Namdeo, D. Commuter Exposure to Air Pollution in Newcastle, UK, and Mumbai, India. J. Hazard Toxic Radioact. Waste 2016, 20, A4014004. [Google Scholar] [CrossRef]
- Han, X.; Aguilar-Villalobos, M.; Allen, J.; Carlton, C.S.; Bayer, C.; Naeher, L.P. Traffic-related Occupational Exposures to PM2.5, CO, and VOCs in Trujillo, Peru. Int. J. Occup. Environ. Health 2005, 11, 276–288. [Google Scholar] [CrossRef] [PubMed]
- Saleel, C.A.; Mujeebu, M.A.; Algarni, S. Coconut oil as phase change material to maintain thermal comfort in passenger vehicles: An experimental analysis. J. Therm. Anal. Calorim. 2019, 136, 629–636. [Google Scholar] [CrossRef]
- Ohanuna, C.; Aigbe, D. Human Health Implications of Vehicular Indoor Air Pollution for Commuters in Selected Road Routes in Port Harcourt Metropolis. IIARD Int. J. Geogr. Environ. Manag. 2014, 10, 31–41. [Google Scholar] [CrossRef]
- Peiter, F.S.; Júnior, W.D.M. Indoor Environmental Quality: Sampling in One of the Sao Carlos’ Public Buses. OALibJ 2016, 3, 69120. [Google Scholar] [CrossRef][Green Version]
- Regulatory Standard No. 15 (NR-15) 2017; Unhealthy Activities and Operations. Brazilian National Standards Organization: Rio de Janeiro, Brazil, 2017.
- Odekanle, E.L.; Fakinle, B.S.; Akeredolu, F.A.; Sonibare, J.A.; Adesanmi, A.J. Personal exposures to particulate matter in various modes of transport in Lagos city, Nigeria. Cogent. Environ. Sci. 2016, 2, 1260857. [Google Scholar] [CrossRef]
- Eghomwanre, A.F.; Tijani, A.Y.; Oguntoke, O. Air pollutant concentrations and comfort index in commercial buses within Abeokuta Metropolis, South-Western Nigeria. EQA Int. J. Environ. Qual. 2024, 64, 1–10. [Google Scholar] [CrossRef]
- Aziz, S.A.A.; Nuawi, M.Z.; Mohd Nor, M.J.; Daruis, D.D.I. Study of noise, vibration and harshness (NVH) for malaysian army (MA) 3-tonne trucks. Appl. Mech. Mater. 2014, 471, 74–80. [Google Scholar] [CrossRef]
- Ab Aziz, S.A.; Sohaimi, R.M.; Pu’ad, M.H.; Mohd Yaman, M.A. Noise, Vibration and Harshness (NVH) study on Malaysian Armed Forces (MAF) tactical vehicle. Appl. Mech. Mater. 2012, 165, 165–169. [Google Scholar] [CrossRef]
- Knibbs, L.D.; de Dear, R.J. Exposure to ultrafine particles and PM2.5 in four Sydney transport modes. Atmos. Environ. 2010, 44, 3224–3227. [Google Scholar] [CrossRef]
- Qiu, Z.; Song, J.; Xu, X.; Luo, Y.; Zhao, R.; Zhou, W.; Xiang, B.; Hao, Y. Commuter exposure to particulate matter for different transportation modes in Xi’an, China. Atmos. Pollut. Res. 2017, 8, 940–948. [Google Scholar] [CrossRef]
- Tan, S.H.; Roth, M.; Velasco, E. Particle exposure and inhaled dose during commuting in Singapore. Atmos. Environ. 2017, 170, 245–258. [Google Scholar] [CrossRef]
- Williams, R.D.; Knibbs, L.D. Daily personal exposure to black carbon: A pilot study. Atmos. Environ. 2016, 132, 296–299. [Google Scholar] [CrossRef]
- Javed, J.; Zahir, E.; Khwaja, H.A.; Khan, M.K.; Masood, S.S. Black Carbon Personal Exposure during Commuting in the Metropolis of Karachi. Atmosphere 2022, 13, 1930. [Google Scholar] [CrossRef]
- Li, B.; Lei, X.N.; Xiu, G.L.; Gao, C.Y.; Gao, S.; Qian, N.S. Personal exposure to black carbon during commuting in peak and off-peak hours in Shanghai. Sci. Total Environ. 2015, 524–525, 237–245. [Google Scholar] [CrossRef]
- Yang, F.; Kaul, D.; Wong, K.C.; Westerdahl, D.; Sun, L.; Ho, K.F.; Tian, L.; Brimblecombe, P.; Ning, Z. Heterogeneity of passenger exposure to air pollutants in public transport microenvironments. Atmos. Environ. 2015, 109, 42–51. [Google Scholar] [CrossRef]
- Chan, L.Y.; Lau, W.L.; Zou, S.C.; Cao, Z.X.; Lai, S.C. Exposure level of carbon monoxide and respirable suspended particulate in public transportation modes while commuting in urban area of Guangzhou, China. Atmos. Environ. 2002, 36, 5831–5840. [Google Scholar] [CrossRef]
- Wu, D.-L.; Lin, M.; Chan, C.-Y.; Li, W.-Z.; Tao, J.; Li, Y.-P.; Sang, X.-F.; Bu, C.-W. Influences of commuting mode, air conditioning mode and meteorological parameters on fine particle (PM2.5) exposure levels in traffic microenvironments. Aerosol. Air Qual. Res. 2013, 13, 709–720. [Google Scholar] [CrossRef]
- Tsai, D.H.; Wu, Y.H.; Chan, C.C. Comparisons of commuter’s exposure to particulate matters while using different transportation modes. Sci. Total Environ. 2008, 405, 71–77. [Google Scholar] [CrossRef]
- Chan, L.Y.; Lau, W.L.; Lee, S.C.; Chan, C.Y. Commuter exposure to particulate matter in public transportation modes in Hong Kong. Atmos. Environ. 2002, 36, 3363–3373. [Google Scholar] [CrossRef]
- Chan, L.Y.; Liu, Y.M.; Lee, S.C.; Chan, C.Y. Carbon monoxide levels measured in major commuting corridors covering different landuse and roadway microenvironments in Hong Kong. Atmos. Environ. 2002, 36, 255–264. [Google Scholar] [CrossRef]
- Anuar, M.H.K.; Jalaludin, J.; Suhaimi, N.F. Relationship Between Indoor Air Pollutants Exposure and Respiratory Symptoms Among Bus Drivers in a Malaysian Public University. Malays. J. Public Health Med. 2023, 23, 17–23. [Google Scholar] [CrossRef]
- Galvis, B. Nanoparticles on electric, gas, and diesel buses in mass transit buses of Bogotá Colombia. TeMA J. Land Use Mobil. Environ. 2023, 16, 367–381. [Google Scholar] [CrossRef]
- Kongtip, P.; Anthayanon, T.; Yoosook, W.; Onchoi, C. Exposure to particulate matter, CO2, CO, VOCs among bus drivers in Bangkok. J. Med. Assoc. Thai. 2012, 95 (Suppl. S6), S169–S178. [Google Scholar] [PubMed]
- Tong, Z.; Li, Y.; Westerdahl, D.; Adamkiewicz, G.; Spengler, J.D. Exploring the effects of ventilation practices in mitigating in-vehicle exposure to traffic-related air pollutants in China. Environ. Int. 2019, 127, 773–784. [Google Scholar] [CrossRef]
- Zhang, L.; Zhou, S.; Kwan, M.P.; Chen, F.; Dai, Y. The threshold effects of bus micro-environmental exposures on passengers’ momentary mood. Transp. Res. D Transp. Environ. 2020, 84, 102379. [Google Scholar] [CrossRef]
- GB/T 18883-2022; Standards for Indoor Air Quality. Standards Press of China: Beijing, China, 2022.
- Heberle, S.M.; Lorini, C.; Rosa, M.S.G.; Barros, N. Evaluation of bus driver exposure to nitrogen dioxide levels during working hours. Atmos. Environ. 2019, 216, 116906. [Google Scholar] [CrossRef]
- ISO/IEC 17025; Testing and Calibration Laboratories. ISO: Geneva, Switzerland, 2005.
- Mishra, S.S.; Gaba, V.K.; Netam, N. Effect of air velocity and relative humidity on passengers’ thermal comfort in naturally ventilated railway coach in hot-dry indian climate. Build. Environ. 2024, 254, 111421. [Google Scholar] [CrossRef]
- Lin, T.P.; Hwang, R.L.; Huang, K.T.; Sun, C.Y.; Huang, Y.C. Passenger thermal perceptions, thermal comfort requirements, and adaptations in short- and long-haul vehicles. Int. J. Biometeorol. 2010, 54, 221–230. [Google Scholar] [CrossRef] [PubMed]
- Zhou, X.; Liu, Y.; Luo, M.; Zheng, S.; Yang, R.; Zhang, X. Overall and thermal comfort under different temperature, noise, and vibration exposures. Indoor Air 2022, 32, e12915. [Google Scholar] [CrossRef] [PubMed]
- ISO 9886:2004; Ergonomics—Evaluation of Thermal Strain by Physiological Measurements. ISO: Geneva, Switzerland, 2004.
- Sarfaraz Alam, M.; Muthiah, A.; Salve, U. A Comparative Analysis Between Indoor and Outdoor Thermal Comfort Parameters of Railway Pantry Car. In Proceedings of International Conference on Thermofluids; Springer: Singapore, 2021; pp. 411–416. [Google Scholar] [CrossRef]
- Alam, M.S.; Muthiah, A.; Salve, U. A Field Investigation of the Average Indoor Thermal Comfort Parameters on the Railway Pantry Car Kitchen at the Different Cooking Period. In Design for Tomorrow—Volume 1; Smart Innovation, Systems and Technologies; Springer Science and Business Media: Singapore, 2021; Volume 221, pp. 203–212. [Google Scholar] [CrossRef]
- Alam, S.; Muthiah, A.; Salve, U.R. Appraisal of Thermal Comfort in Non-Air-conditioned and Air-conditioned Railway Pantry Car Kitchens. Int. J. Integr. Eng. 2020, 12, 318–327. [Google Scholar] [CrossRef]
- Shekhar Mishra, S.; Kumar Gaba, V.; Netam, N. Thermal comfort assessment of non air-conditioned railway coach in Central India during extreme summer. Therm. Sci. Eng. Prog. 2023, 46, 102206. [Google Scholar] [CrossRef]
- Alam, M.S.; Muthiah, A.; Salve, U.R. Thermal comfort of the kitchen in pantry cars on Indian railways. Instrum. Mes. Metrol. 2019, 18, 465–477. [Google Scholar] [CrossRef]
- Gong, Y.; Zhou, T.; Zhao, Y.; Xu, B. Characterization and risk assessment of particulate matter and volatile organic compounds in metro carriage in Shanghai, China. Atmosphere 2019, 10, 302. [Google Scholar] [CrossRef]
- GB 3095-2012; Ambient Air Quality Standards. Standards Press of China: Beijing, China, 2012.
- Both, A.F.; Westerdahl, D.; Fruin, S.; Haryanto, B.; Marshall, J.D. Exposure to carbon monoxide, fine particle mass, and ultrafine particle number in Jakarta, Indonesia: Effect of commute mode. Sci. Total Environ. 2013, 443, 965–972. [Google Scholar] [CrossRef]
- Tran, P.T.M.; Adam, M.G.; Tham, K.W.; Schiavon, S.; Pantelic, J.; Linden, P.F.; Sofianopoulou, E.; Sekhar, S.C.; Cheong, D.K.W.; Balasubramanian, R. Assessment and mitigation of personal exposure to particulate air pollution in cities: An exploratory study. Sustain. Cities Soc. 2021, 72, 103052. [Google Scholar] [CrossRef]
- Li, Z.; Che, W.; Frey, H.C.; Lau, A.K.H.; Lin, C. Characterization of PM2.5 exposure concentration in transport microenvironments using portable monitors. Environ. Pollut. 2017, 228, 433–442. [Google Scholar] [CrossRef]
- Kumar, P.; Gupta, N.C. Commuter exposure to inhalable, thoracic and alveolic particles in various transportation modes in Delhi. Sci. Total Environ. 2016, 541, 535–541. [Google Scholar] [CrossRef] [PubMed]
- Qiu, Z.; Cao, H. Commuter exposure to particulate matter in urban public transportation of Xi’an, China. J. Environ. Health Sci. Eng. 2020, 18, 451–462. [Google Scholar] [CrossRef]
- Saksena, S.; Quang, T.N.; Nguyen, T.; Dang, P.N.; Flachsbart, P. Commuters’ exposure to particulate matter and carbon monoxide in Hanoi, Vietnam. Transp. Res. D Transp. Env. 2008, 13, 206–211. [Google Scholar] [CrossRef]
- Yu, Q.; Lu, Y.; Xiao, S.; Shen, J.; Li, X.; Ma, W.; Chen, L. Commuters’ exposure to PM 1 by common travel modes in Shanghai. Atmos. Environ. 2012, 59, 39–46. [Google Scholar] [CrossRef]
- Liu, W.T.; Ma, C.M.; Liu, I.J.; Han, B.C.; Chuang, H.C.; Chuang, K.J. Effects of commuting mode on air pollution exposure and cardiovascular health among young adults in Taipei, Taiwan. Int. J. Hyg. Env. Health 2015, 218, 319–323. [Google Scholar] [CrossRef]
- Chau, C.K.; Tu, E.Y.; Chan, D.W.T.; Burnett, J. Estimating the total exposure to air pollutants for different population age groups in Hong Kong. Environ. Int. 2002, 27, 617–630. [Google Scholar] [CrossRef]
- Wong, L.T.; Mui, K.W.; Cheung, C.T.; Chan, W.Y.; Lee, Y.H.; Cheung, C.L. In-cabin exposure levels of carbon monoxide, carbon dioxide and airborne particulate matter in air-conditioned buses of Hong Kong. Indoor Built Environ. 2011, 20, 464–470. [Google Scholar] [CrossRef]
- Zhang, Y.; Yu, N.; Zhang, M.; Ye, Q. Particulate matter exposures under five different transportation modes during spring festival travel rush in China. Processes 2021, 9, 1133. [Google Scholar] [CrossRef]
- Kolluru, S.S.R.; Patra, A.K. Personal exposures to PM during short distance highway travel in India. Transp. Res. D Transp. Environ. 2020, 81, 102315. [Google Scholar] [CrossRef]
- EN 12341:2003; Ambient Air—Standard Gravimetric Measurement Method for the Determination of the PM10 or PM2.5 Mass Concentration of Suspended Particulate Matter. European Committee for Standardization: Brussels, Belgium, 2023.
- Che, W.W.; Frey, H.C.; Lau, A.K.H. Sequential Measurement of Intermodal Variability in Public Transportation PM2.5 and CO Exposure Concentrations. Environ. Sci. Technol. 2016, 50, 8760–8769. [Google Scholar] [CrossRef] [PubMed]
- Apte, J.S.; Kirchstetter, T.W.; Reich, A.H.; Deshpande, S.J.; Kaushik, G.; Chel, A.; Marshall, J.D.; Nazaroff, W.W. Concentrations of fine, ultrafine, and black carbon particles in auto-rickshaws in New Delhi, India. Atmos. Environ. 2011, 45, 4470–4480. [Google Scholar] [CrossRef]
- Luangprasert, M.; Vasithamrong, C.; Pongratananukul, S.; Chantranuwathana, S.; Pumrin, S.; De Silva, I.P.D. In-vehicle carbon dioxide concentration in commuting cars in Bangkok, Thailand. J. Air Waste Manag. Assoc. 2017, 67, 623–633. [Google Scholar] [CrossRef] [PubMed]
- Huang, H.L.; Hsu, D.J. Exposure levels of particulate matter in long-distance buses in Taiwan. Indoor Air 2009, 19, 234–242. [Google Scholar] [CrossRef] [PubMed]
- Guzman, L.A.; Beltran, C.; Morales, R.; Sarmiento, O.L. Inequality in personal exposure to air pollution in transport microenvironments for commuters in Bogotá. Case Stud. Transp. Policy 2023, 11, 100963. [Google Scholar] [CrossRef]
- Zahaba, M.; Kamaruddin, A.; Ariffin, A.; Tamsi, N.S.F.; Hassan, N. Indoor Air Quality (IAQ) Onboard a Naval Ship: A Comparative Study Between Compartments. Def. ST Tech. Bull. 2023, 16, 64–72. [Google Scholar]
- Anthayanon, T.; Kongtip, P.; Yoosook, W.; Sujirarat, D. Exposure to Fine Particles Among Bangkok Mass Transit Authority Bus Drivers. J. Health Res. 2011, 25, 5–10. [Google Scholar]
- Omagamre, E.W.; Ukpebor, J.E.; Ukpebor, E.E.; Okungbowa, G.E.; Odionye, E.H. Evaluation of In-Cabin Levels of Fine Particulates and Carbon Monoxide in Shuttle Buses Along a Major Intra-City Route in Benin City, Nigeria. Int. J. Renew. Energ. Environ. 2016, 2, 166–178. [Google Scholar]
- Shrestha, A.; Dhital, N.B. In-vehicle air quality in public buses during real-world trips in Kathmandu Valley, Nepal. Environ. Chall. 2024, 17, 101054. [Google Scholar] [CrossRef]
- Bryan, M.E.; Tempest, W.; Williams, D. Vehicle noise and the passenger. Appl. Ergon. 1978, 9, 151–154. [Google Scholar] [CrossRef]
- Edwards, N.J.; Widrick, R.; Wilmes, J.; Breisch, B.; Gerschefske, M.; Sullivan, J.; Potember, R.; Espinoza-Calvio, A. Reducing COVID-19 airborne transmission risks on public transportation buses: An empirical study on aerosol dispersion and control. Aerosol. Sci. Technol. 2021, 55, 1378–1397. [Google Scholar] [CrossRef]
- Wang, Q.; Gu, J.; An, T. The emission and dynamics of droplets from human expiratory activities and COVID-19 transmission in public transport system: A review. Build. Environ. 2022, 219, 109224. [Google Scholar] [CrossRef] [PubMed]
- Handayani, K.N.; Murtyas, S.; Wijayanta, A.T.; Hagishima, A. Thermal Comfort Challenges in Home-Based Enterprises: A Field Study from Surakarta’s Urban Low-Cost Housing in a Tropical Climate. Sustainability 2024, 16, 6838. [Google Scholar] [CrossRef]
- Shupler, M.; Tawiah, T.; Nix, E.; Baame, M.; Lorenzetti, F.; Betang, E.; Chartier, R.; Mangeni, J.; Upadhya, A.; de Cuevas, R.A.; et al. Household concentrations and female and child exposures to air pollution in peri-urban sub-Saharan Africa: Measurements from the CLEAN-Air(Africa) study. Lancet Planet Health 2024, 8, e95–e107. [Google Scholar] [CrossRef]
- Xu, J.; Xiang, Z.; Zhi, J.; Xu, X.; He, S.; Wang, J.; Du, Y.; Xu, G. Research on Virtual Simulation Evaluation System for Passenger Compartments Lighting of Subway Trains in China. In Advances in Human Factors in Wearable Technologies and Game Design; Ahram, T., Ed.; Springer: Cham, Switzerland, 2020; pp. 343–353. [Google Scholar]
- Albatayneh, A.M.; Assaf, M.N.; Albatayneh, A.; Assaf, M.N.; Alterman, D.; Jaradat, M. Comparison of the Overall Energy Efficiency for Internal Combustion Engine Vehicles and Electric Vehicles. Rigas Tehniskas Universitates Zinatniskie Raksti 2020, 24, 669–680. [Google Scholar] [CrossRef]
- Nyembwe, J.P.K.B.; Ogundiran, J.O.; Gameiro da Silva, M.; Albino Vieira Simões, N. Evaluation of Noise Level in Intensive Care Units of Hospitals and Noise Mitigation Strategies, Case Study: Democratic Republic of Congo. Buildings 2023, 13, 278. [Google Scholar] [CrossRef]
- Costa, M.F.; Landing, W.M.; Kehrig, H.A.; Barletta, M.; Holmes, C.D.; Barrocas, P.R.; Evers, D.C.; Buck, D.G.; Vasconcellos, A.C.; Hacon, S.S.; et al. Mercury in tropical and subtropical coastal environments. Environ. Res. 2012, 119, 88–100. [Google Scholar] [CrossRef] [PubMed]
- Croitoru, C.; Nastase, I.; Bode, F.; Meslem, A.; Dogeanu, A. Thermal comfort models for indoor spaces and vehicles—Current capabilities and future perspectives. Renew. Sustain. Energy Rev. 2015, 44, 304–318. [Google Scholar] [CrossRef]
- Khovalyg, D.; Kazanci, O.B.; Halvorsen, H.; Gundlach, I.; Bahnfleth, W.P.; Toftum, J.; Olesen, B.W. Critical review of standards for indoor thermal environment and air quality. Energy Build. 2020, 213, 109819. [Google Scholar] [CrossRef]
- ANSI/ASHRAE Standard 62.2-2016; Ventilation and Acceptable Indoor Air Quality in Residential Buildings. ASHRAE: Peachtree Corners, GA, USA, 2016.
- Ogundiran, J.; Nyembwe, J.-P.; Ribeiro, A.; da Silva, M. A Field Survey on Indoor Climate in Land Transport Cabins of Buses and Trains. Atmosphere 2024, 15, 589. [Google Scholar] [CrossRef]
- Hachem, M.; Saleh, N.; Paunescu, A.-C.; Momas, I.; Bensefa-Colas, L. Exposure to traffic air pollutants in taxicabs and acute adverse respiratory effects: A systematic review. Sci. Total Environ. 2019, 693, 133439. [Google Scholar] [CrossRef] [PubMed]
- Quagraine, V.; Boschi, N. Behavioral changes can help prevent indoor air-related illnesses in Ghana. Build. Environ. 2008, 43, 355–361. [Google Scholar] [CrossRef]
- Wang, B.; Zacharias, J. Noise, odor and passenger density in perceived crowding in public transport. Transp. Res. Part A Policy Pr. 2020, 135, 215–223. [Google Scholar] [CrossRef]
- Onyemaechi, N.; Ofoma, U. The public health threat of road traffic accidents in Nigeria: A call to action. Ann. Med. Health Sci. Res. 2016, 6, 199. [Google Scholar] [CrossRef] [PubMed]
Disclaimer/Publisher’s Note: The statements, opinions and data contained in all publications are solely those of the individual author(s) and contributor(s) and not of MDPI and/or the editor(s). MDPI and/or the editor(s) disclaim responsibility for any injury to people or property resulting from any ideas, methods, instructions or products referred to in the content. |
© 2025 by the authors. Licensee MDPI, Basel, Switzerland. This article is an open access article distributed under the terms and conditions of the Creative Commons Attribution (CC BY) license (https://creativecommons.org/licenses/by/4.0/).