Abstract
Ensuring food security in Pakistan, particularly for rice production, is a critical challenge due to increasing population demands and the growing impact of climate change variability. Accurate estimation of rice crop yields is essential for optimizing resource allocation, managing supply chains, and forecasting economic growth while minimizing agricultural losses. This study utilizes a Deep Neural Network (DNN) to predict rice yields in Pakistan by analyzing the effects of maximum temperature and precipitation trends under high-emission scenarios (SSP5-8.5) derived from CMIP6 climate models. Historical (1980–2014) and future (2015–2100) climate projections were evaluated using key variables, including precipitation, meteorological conditions, cultivated area, and crop yields. Results from CMIP6 SSP5-8.5 indicate a significant rise in maximum temperatures and increased precipitation variability, exacerbating risks to rice crop yields. DNN demonstrated superior accuracy in forecasting these trends, achieving high R-squared values and low error metrics, including Mean Absolute Error (MAE) and Root Mean Squared Error (RMSE). The findings reveal that Pakistan, particularly Eastern South Asia, is highly vulnerable to climate extremes, with severe implications for rice production and agricultural sustainability. These results highlight the urgent need for policymakers to adopt climate adaptation strategies, including advanced predictive modeling and resilient agricultural practices, to safeguard rice production and ensure long-term food security in Pakistan’s monsoon-dependent regions. This study aligns with Sustainable Development Goal 2 (Zero Hunger) by contributing to food security and sustainable agricultural development, and with Sustainable Development Goal 13 (Climate Action) by addressing climate change impacts on agriculture and promoting resilience in rice production systems.
1. Introduction
The influence of global climate change on agricultural output in the 21st Century has been substantial []; numerous countries and regions worldwide have reported reduced yields of crops, including wheat, maize, rice, and oilseed rape [,,]. Temperatures are expected to rise, leading to more extreme weather events []. This trend contributes to uncertainty in agricultural production, especially for key crops such as maize, rice, and soybeans []. In the absence of adaptation measures, worldwide yields of major food crops may decrease by 12–20% by the end of the Century []. Various methodologies are employed to investigate the impact of climate change on agriculture, including modified experiments, process-based crop models, and empirical statistical models [,]. Field experiments were the initial method used to subject crops to various climatic conditions, through natural fluctuations or controlled climate factors, to examine their effects on crop development and production []. Technological improvements have led to the increased prominence of process-based crop models and empirical statistical models []. Process-based crop models employ computational methods to construct mathematical correlations between climate change and agricultural yield []. Over time, significant progress has been made in developing tools and simulations to objectively examine the physiological mechanisms and dynamic processes underlying crop growth and production [,]. Assessed existing process-based crop models, evaluating their simulation outcomes and research criteria while identifying sources of error and limits.
Nevertheless, many contemporary studies predominantly focus on specific methodologies, introducing biases and uncertainties into climate change impact assessments [,]. This constraint needs to improve the thoroughness and dependability of singular methods. Given limited historical data, empirical statistical models need help in precisely forecasting future yield-climate correlations [,]. The continual development of new rice varieties characterized by high yield, robust stress resistance, and elevated nutrient-use efficiency, alongside the enhancement of yield per unit area and the maximization of genetic yield potential, has emerged as a paramount objective in contemporary rice breeding and cultivation [,]. Examining the attributes of rice output is crucial for enhancing land management practices, safeguarding national food security, and augmenting farmers’ incomes, which are necessary to address food scarcity effectively []. The conventional approach to assessing rice yield in the field is destructive. It involves selecting small plots using equal-area or average sampling, followed by threshing, drying, cleaning, and weighing the harvested rice. Subsequently, the moisture content is measured using a moisture meter, and the final rice yield is calculated based on the proportions of indica rice at 13.5% and japonica rice at 14.5% [,].
Machine learning methodologies, including multivariate regression, decision trees, association rule mining, and artificial neural networks, have recently been employed for crop yield forecasting [,]. A prominent characteristic of machine learning models is their treatment of the output (crop yield) as an implicit function of the input variables (genes and environmental factors), which may represent a highly nonlinear and intricate relationship []. Applied a neural network using a single hidden layer to forecast corn production based on input data concerning soil, weather, and management practices. Utilized stepwise multiple linear regression, projection pursuit regression, and neural networks to forecast crop yield, discovering that the neural network model surpassed the other two methodologies []. Proposed weighted histogram regression to predict the yield of various soybean varieties, which showed enhanced performance compared to traditional regression techniques.
This paper uses deep neural networks to forecast, assess, and analyze yield differences among corn hybrids based on genotype and environmental data []. Deep neural networks are representation-learning models that can discover data’s intrinsic representations without manually constructing features. Deep neural networks consist of several stacked nonlinear layers that convert raw input data into increasingly abstract representations at each layer. Consequently, as the network deepens, it extracts increasingly complex information, thereby enhancing the accuracy of the results []. Under appropriate conditions, deep neural networks serve as universal approximators, capable of approximating nearly any function; however, identifying the optimal parameters can be somewhat arduous []. In contrast to the neural network models described in the literature, which typically use shallow architectures with a single hidden layer, deep neural networks with numerous hidden layers offer greater capacity to capture the intrinsic nonlinear relationship between input and response variables []. Recent applications of deep learning models have employed convolutional neural networks and recurrent neural networks to forecast soybean production in the United States, utilizing a series of remotely sensed photos captured before harvest [,]. Their model outperformed conventional remote-sensing approaches by 15% in Mean Absolute Percentage Error (MAPE).
The objective of this research is to develop a robust, accurate predictive model for rice yield estimation by leveraging advanced deep learning algorithms, particularly Deep Neural Networks (DNNs). Using CMIP6 SSP5-8.5 maximum emissions pathway model data on precipitation and maximum temperature, we aim to assess the impacts of climate variability on rice crop yields in Pakistan. By incorporating key climate parameters and employing a novel optimization function (IOF), this study seeks to reduce training and testing losses while mitigating overfitting. The results demonstrate that our proposed DNN-based model outperforms traditional methods and state-of-the-art machine learning models, providing a more reliable forecast of rice yields. This study highlights the importance of integrating climate data with advanced machine learning to inform agricultural policy, optimise resource allocation, and enhance food security amid climate change. This study aligns with Sustainable Development Goal 13 (Climate Action) by addressing climate change impacts on agricultural systems and promoting resilience in rice production systems, and with Sustainable Development Goal 2 (Zero Hunger) by contributing to food security and sustainable Agriculture.
2. Materials and Methods
2.1. Study Area
Pakistan is located between approximately 23.63° N and 37.18° N latitude and 60.87° E and 77.65° E longitude []. The Coupled Model Intercomparison Project Phase 6 (CMIP6) provides critical climate projections that pose significant risks to the country’s agricultural sector [,]. Rising temperatures are expected to increase heat stress on crops, while changes in precipitation patterns may disrupt irrigation water availability, potentially leading to lower agricultural yields. Furthermore, heavier rainfall could lead to soil erosion and land degradation, while warmer temperatures could increase the spread of pests and diseases []. To mitigate these impacts, policymakers must integrate CMIP6 projections into agricultural planning, focusing on strategies that strengthen resilience [,]. This includes improving irrigation systems, promoting crop diversification, and adopting climate-smart farming practices. The map of the study area is shown in Figure 1.
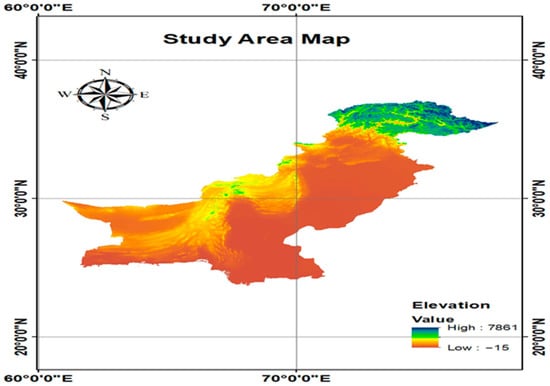
Figure 1.
The study area map shows Pakistan’s elevation.
2.2. Observed and CMIP6 Dataset Overview
This study utilizes high-resolution climate data from the Coupled Model Intercomparison Project Phase 6 (CMIP6) to evaluate changes in temperature and precipitation extremes attributed to climate change []. The CMIP6 datasets provide daily simulated climate data from 23 Global Climate Models (GCMs) covering historical (1980–2014) and future (2015–2044, 2045–2072, 2073–2100) periods []. These projections are based on one Shared Socioeconomic Pathway (SSPs): SSP5-8.5 (a high-emissions scenario), which reflects a business-as-usual pathway.
The CMIP6 data integrates natural and anthropogenic forcing factors, including greenhouse gases, aerosols, ozone levels, land-use changes, and volcanic and solar impacts. Historical simulations (including all forcing factors) capture observed climate dynamics and serve as a reference for evaluating model performance []. Future projections combine the RCPs (Representative Concentration Pathways) with SSPs, allowing an in-depth understanding of climate trajectories under different emission scenarios [,]. For example, the high-emission SSP5-8.5 scenario is consistent with RCP8.5, which assumes continued high fossil-fuel consumption, while SSP2-4.5 represents a less sustainable pathway with moderate emissions [].
These high-resolution CMIP6 datasets are crucial for studying local climate extremes such as droughts and heatwaves, particularly in regions like Pakistan []. Analyzing maximum temperatures and precipitation in Pakistan provides valuable insights into climate variability and its potential impact on agricultural systems, particularly wheat production []. The dataset is instrumental for understanding long-term climate change processes and for analyzing past trends alongside future projections under different emissions scenarios. Moreover, the CMIP6 simulations have been rigorously validated against observational data, which enhances confidence in their ability to predict regional and global climate impacts. These datasets are essential for studying the spatiotemporal variability of climate extremes, helping to inform adaptation strategies to improve agricultural resilience to climate-induced stress.
The study also incorporates wheat yield and production data from the Pakistan Bureau of Statistics, covering the period from 1990 to 2022. This dataset provides a comprehensive historical record for analyzing agricultural trends, crop yield variability, and key influencing factors. It serves as a foundation for developing effective agricultural planning strategies, forecasting yields, and formulating policies that promote sustainable food production. For further details, the official website of the Pakistan Bureau of Statistics can be accessed [Pakistan Bureau of Statistics] (http://www.pbs.gov.pk, accessed on 20 March 2024).
2.3. Deep Neural Network
2.3.1. Deep Neural Network Theory
Deep Neural Networks (DNNs) are a class of machine learning models that consist of multiple layers of neurons []. These networks are inspired by the structure and functioning of the human brain and can model complex, nonlinear relationships within data. The mathematical foundation of a DNN is built on matrix operations, activation functions, and optimization techniques that minimize a loss function.
Neural Network Architecture
A DNN consists of three main types of layers:
- Input Layer: Receives the raw input data.
- Hidden Layers: Intermediate layers that transform the input data into abstract representations.
- Output Layer: Produces the final prediction or classification.
Each layer contains neurons, which are connected to neurons in the previous and subsequent layers. Each connection between neurons has an associated weight, which is adjusted during training.
Mathematical Representation
Let be the input vector with dimensions, where . The input is passed through a series of layers.
- For a given layer let represent the weight matrix, and the bias vector of that layer.
- The output of each layer is computed by applying a linear transformation followed by an activation function:
is the output of the previous layer (for the input layer,
- is the linear combination of the inputs and weights.
- is the output of the activation function f(⋅) applied to .
The activation function f(⋅) introduces nonlinearity into the network. Common choices for activation functions include the following:
- ReLU (Rectified Linear Unit): .
- Sigmoid: .
- Tanh: .
For the final output layer, the choice of activation function depends on following the task:
- SoftMax is used for multi-class classification: , where C is the number of classes and is the logit (raw output) for class .
Training Deep Neural Networks
The goal of training a DNN is to find the optimal set of weights that minimizes the difference between the predicted and actual target outputs. This is typically achieved using gradient-based optimization methods.
- Forward Propagation: Input data is passed through the network, layer by layer, to compute the output:
- Loss Function: The discrepancy between the predicted output y and the actual target y is quantified using a loss function. Common loss functions include the following:
- ○
- Mean Squared Error (MSE) for regression tasks:
- ○
- Cross-Entropy Loss for classification tasks:
Backpropagation
The core of training a DNN is Backpropagation, where the gradients of the loss function with respect to each weight are computed and used to update the weights. Using the chain rule, the gradient of the loss with respect to the weights in each layer is computed as:
This process is repeated backwards through each layer, updating the weights via an optimization method like Stochastic Gradient Descent (SGD):
where η is the learning rate, controlling the size of each weight update.
2.4. R-Squared (R2)
R-squared (R2), also known as the coefficient of determination, is a key statistical measure that assesses the goodness-of-fit of a regression model. It indicates the proportion of the variance in the dependent variable that the independent variables in the model can explain []. The R2 value ranges from 0 to 1, where 1 indicates that the model accounts for all the variance in the observed data, and 0 suggests that it explains none.
Mathematically, R2 is expressed as:
In machine learning and predictive analytics, R2 is a helpful metric for assessing how well a model predicts outcomes. A high R2 indicates that the model explains a significant portion of the variability in the target variable, suggesting a good fit. On the other hand, a low R2 suggests the model may not adequately capture the underlying data patterns and could benefit from further refinement, such as adding features or adjusting its structure.
2.5. Mean Absolute Error (MAE)
Mean Absolute Error (MAE) is a widely used metric in regression analysis that quantifies the average magnitude of errors across a set of predictions, regardless of whether the errors are positive or negative [,]. MAE is calculated by averaging the absolute differences between the predicted
where is the number of observations, represents the actual values, and represents the predicted values.
MAE is appreciated for its simplicity and clarity, as it directly measures the average magnitude of prediction errors. Unlike metrics such as Mean Squared Error (MSE), which penalize larger errors more heavily, MAE treats all deviations equally, making it less sensitive to outliers. This characteristic makes it particularly useful when both overestimations and underestimations are similarly significant.
In applications such as climate modelling, crop yield forecasting, or financial prediction, MAE offers a practical way to gauge overall prediction error without being overly influenced by extreme values. Thus, it provides an intuitive sense of how much the model’s predictions deviate from actual outcomes on average.
3. Results
Figure 2 shows trends in rice yield across Pakistan’s provinces (Punjab, Sindh, KPK, and Baluchistan) from 1990 to 2022, highlighting regional disparities and overall national trends. Sindh consistently yields the highest, peaking around 3500 kg/ha in recent years, while Punjab shows steady growth from 1267 kg/ha in 1990 to over 2200 kg/ha in 2022. KPK maintains the lowest yield, remaining under 2500 kg/ha throughout the period, and Baluchistan demonstrates moderate productivity but with significant variability, including a sharp decline in 2010 due to likely climatic disruptions. The national average mirrors trends in Punjab and Sindh, reflecting steady improvement over time but also a notable dip in 2010, indicating the impact of the extreme weather events. This analysis underscores the varying agricultural performance across regions and highlights the vulnerability of rice yield to climatic fluctuations.
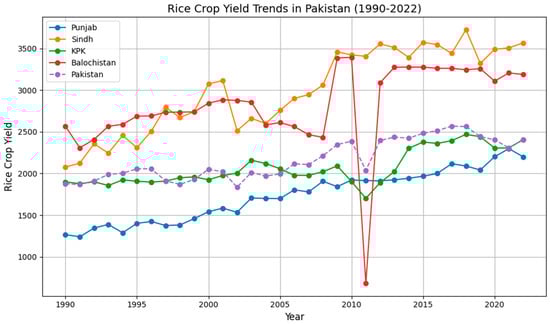
Figure 2.
Rice crop yield trends in Pakistan (1990–2022) province-wise.
3.1. Historical Maximum Temperature
The spatio-temporal distribution of maximum temperatures in Pakistan during the historical period (1990–2020) shows a significant latitudinal and topographical gradient. Climatic areas with maximum temperatures above 30 °C are centred in southern Pakistan, predominantly in the south and in Sindh and Baluchistan, particularly in dry climates near 24° N to 27° N. These regions experience extreme solar irradiation and low vegetation cover.
On the other hand, the northern part of Pakistan, including the hilly regions of Khyber Pakhtunkhwa and Gilgit-Baltistan, experiences much cooler maximum temperatures at about 35° N latitude, about 0 °C and −12 °C, adding that this was due to the cooler temperatures at higher altitudes and the presence of the Himalayan and Karakoram Mountain ranges. The central regions, which include Punjab and parts of northern Sindh, exhibit maximum temperatures ranging from moderate (6 °C to 18 °C), serving as a transitional zone where diverse climatic conditions converge due to their proximity to hot southern zones and their remarkable northern elevations. These spatial patterns in temperature directly affect agriculture, as southern sites may be more prone to heat stress that hinders crops such as wheat and rice. At the same time, those in the north will likely have to adapt to shorter growing seasons, as shown in Figure 3.
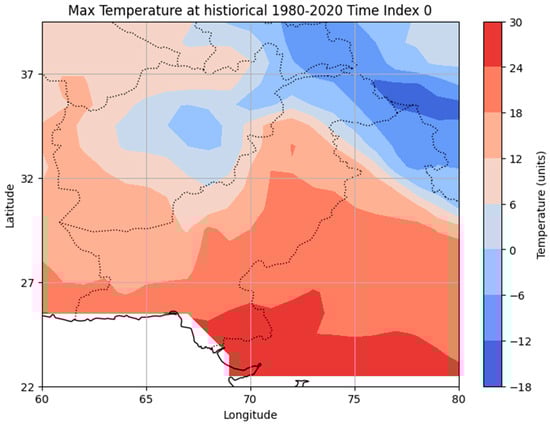
Figure 3.
Historical maximum temperature from 1980 to 2020.
3.2. Future Maximum Temperature
Projected distributions of the maximum temperature across Pakistan for the SSP585 scenario are showcased in Figure 4, with the corresponding temporal and spatial shifts indicated in Figure 4a 2044, Figure 4b 2072, and Figure 4c 2100. Charts show an ever-increasing trend in maximum temperatures throughout all regions of the country during the period studied, and the most noticeable warming is in southern and central Pakistan.
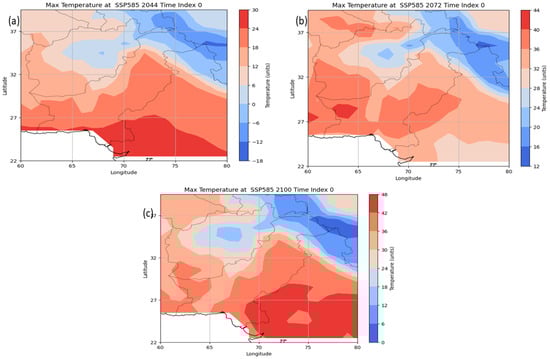
Figure 4.
Future maximum temperature for the three periods of (a) 2015–2044, (b) 2045–2072, and (c) 2073–2100.
By 2044 (Figure 4a), southern divisions, including Sindh and the southern part of Baluchistan, will have significantly higher maximum temperatures exceeding 30 °C, with localized areas reaching 36 °C. Central divisions covering Punjab and the northern regions of Sindh will experience moderate warming ranging from 24 °C to 40 °C. In contrast, northern areas, including Gilgit-Baltistan and parts of Khyber Pakhtunkhwa, will remain relatively cooler, ranging from 12 °C to 18 °C. In 2072 (Figure 4b), the warming trend becomes more pronounced, with southern regions registering daytime temperatures surpassing 36 °C and isolated hotspots reaching 44 °C; central regions remain consistently above 35 °C, while the northern areas show a notable increase of 6–12 °C with maximum daytime temperatures of 18–24 °C. The warming peaks in 2100 under the SSP585 scenario, shown in Figure 4c. Maximum temperatures in the southern and central regions exceed 42 °C in many areas and 45 °C in hotspots; meanwhile, the northern regions see significant warming, with maximum temperatures reaching 35 °C in some areas. This dramatic global temperature rise underscores the serious consequences of persistently high greenhouse gas emissions in high-emission scenarios.
Such projections highlight the urgent need for climate adaptation strategies in Pakistan. Rising maximum temperatures can intensify heat stress in southern and central agricultural areas, posing a threat to staple crops, especially wheat and rice. In far northern regions, warming might increase the growing season but might also threaten water supplies through increased glacier melting.
3.3. Historical Precipitation
Figure 5 shows the spatial distribution of precipitation over Pakistan for the historical period (1990–2020). The northwestern regions of the country, mainly parts of Khyber Pakhtunkhwa and northern Pakistan, around latitude 32° N to 37° N, receive the most average heavy rainfall, above 1.2. In these regions, orographic uplift from the high mountains of the Himalayas and Hindu Kush ranges promotes precipitation from monsoon and westerly weather systems.
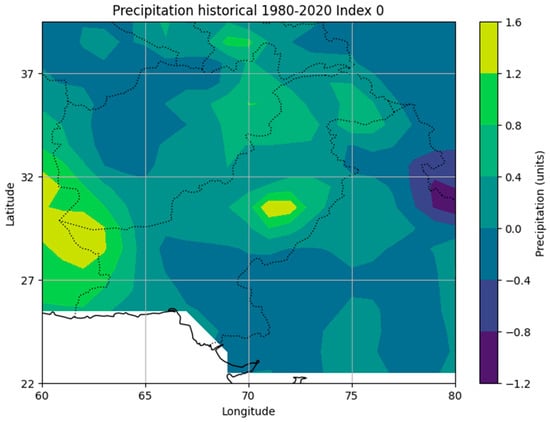
Figure 5.
Historical precipitation from 1980 to 2020 across Pakistan.
Central areas (the Punjab part of eastern Baluchistan) received moderate rains, recording 0.4 to 0.8 units. These regions receive monsoonal and convective rainfall, which is crucial for agriculture and water resources. Sindh and southern Baluchistan receive the lowest precipitation, often below the 0-unit line, suggesting arid and semi-arid landscapes. The Fields receive little rainfall and have high evaporation rates, making them prone to water stress and drought. All of these trends observed in the historical period indicate the coexisting climatic challenges across different regions of Pakistan. Surprisingly, the northern region receives substantial rainfall but is vulnerable to flooding from severe monsoon events. By contrast, southern arid regions suffer the double whammy of water stress and extreme heat, underscoring the need for region-specific strategies to manage water resources and adapt to climate change.
3.4. Future Precipitation
Projected precipitation patterns over Pakistan under the SSP585 Scenario for 2044 (Figure 6a), 2072 (Figure 6b), and 2100 (Figure 6c), shown in Figure 6, highlight significant spatial and temporal variability. The analysis also highlights changes in precipitation driven by climate change and related atmospheric dynamics at the regional scale. The large-scale average in 2044 (Figure 6a) shows moderate precipitation levels in the northern regions—namely KPK and GB—with localised areas reaching 3.6 units. Precipitation was comparatively lower in central regions, including Punjab, at 0–1.2 units, while southern areas, including Sindh and Baluchistan, showed negative (below-average) precipitation anomalies.
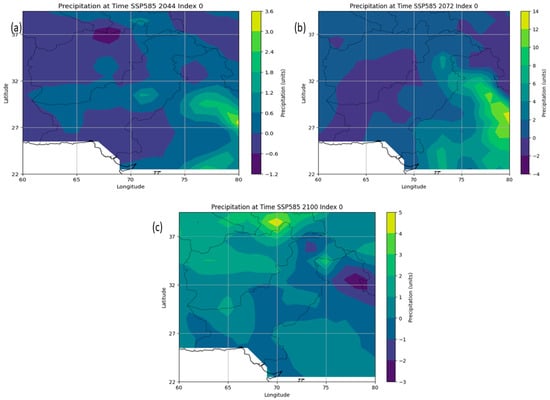
Figure 6.
Future maximum temperature for the periods of (a) 2015–2044, (b) 2045–2072, and (c) 2073–2100 across the Pakistan region.
Precipitation intensity increased across most northern land areas in 2072 (Figure 6b), with maximum values exceeding 10 mm in some regions. In contrast, the central and southern sectors, such as Sindh and parts of the south Punjab, still face declining rainfall, with anomalies plunging below—2 units in several places. This pattern suggests precipitation is shifting northward, which could worsen arid conditions in Pakistan’s southern reaches. In 2100 (Figure 6c), the precipitation anomalies across the northern regions are fixed, oscillating within the 3–5 unit range. Despite 2072, elevated precipitation values are seen over Punjab and other central areas, with minor upsurges of up to 2 units. Negative precipitation anomalies prevail in the country’s southern half, particularly in the south and Sindh, Baluchistan, and the arid trend continues. The results reveal a potential divergence in precipitation distribution in Pakistan under the SSP585 scenario. The effects on Nepal’s different regions could not be more precise. Increased precipitation in the northern areas may lead to better water storage and resources, but also to a higher risk of flooding. By contrast, the southern and central regions are experiencing a decline in precipitation, worsening water scarcity and posing significant challenges for agriculture and water resource management. These spatial trends highlight the importance of adaptive strategies that can account for regional precipitation dynamics in projections under a changing climate.
The heatmap shows the correlation between the following features: year, rice crop yield, height, tasmax (maximum temperature), and pr (precipitation). The correlation coefficients, which range from −1 to 1, show the strength and direction of the relationships between each pair of variables. Notably, rice crop yield has a moderate positive correlation with year (0.38), suggesting that rice yield has been increasing over time. However, there is a negative correlation between rice crop yield and precipitation (−0.38), indicating that higher precipitation may reduce yields, possibly due to issues such as flooding or excessive moisture. Additionally, height is positively correlated with tasmax (0.25), meaning that higher temperatures are slightly linked with greater plant height. On the other hand, height shows a slight negative correlation with pr (−0.19), suggesting that greater precipitation may slightly reduce plant height. Finally, the correlation between tasmax and pr is weak (−0.02), showing little to no relationship between temperature and precipitation. Overall, the heatmap provides valuable insights into how climate factors interact with agricultural productivity, particularly how temperature and rainfall can impact rice crop yield and plant growth, as shown in Figure 7.
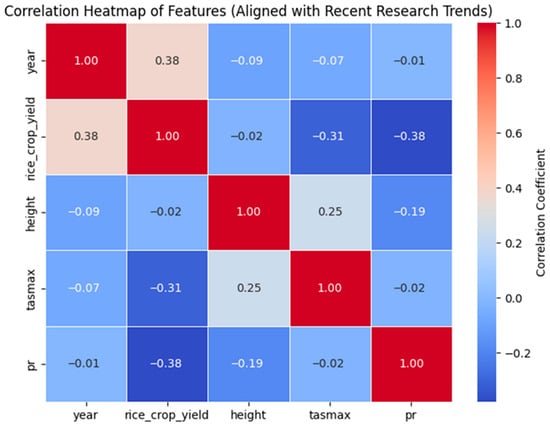
Figure 7.
Correlation heatmap of the features.
3.5. Maximum Temperature and Precipitation Affect the Crop Yield Using a Deep Learning Model
The performance of the deep neural network model in predicting rice crop yield is illustrated in the scatter plot in Figure 8, which compares predicted and actual values. The following Table 1 metrics demonstrate the effectiveness of the model:
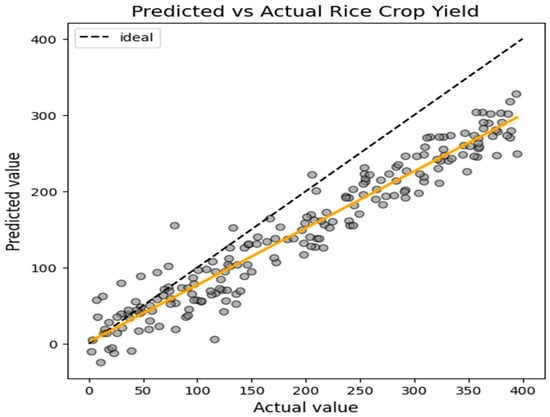
Figure 8.
Predicted vs. actual rice crop yield model performance using a deep neural network.

Table 1.
Deep neural network model performance.
R-squared (R2): The model achieved an R2 of 0.89, indicating that the input features can explain 89% of the variance in crop yield. The high R2 values reflect the model’s strong ability to capture the relationship between the predictors and the target variable. Mean Absolute Error: The MAE of 70.33 demonstrates that, on average, the model prediction deviates from the actual values by 70.33 units of the rice crop yield. This reflects a relatively low error in practical terms. Root Mean Squared Error (RMSE): The RMSE of 82.95 further confirms the model accuracy, as it penalizes larger deviations more than the MAE. The small RMSE suggests consistent performance across the dataset. The scatter plot shows a strong alignment between the predicted and actual values, with the regression line closely matching the ideal perfect-fit line. This alignment supports the quantitative metrics that validate the model’s reliability in predicting rice crop yields.
3.6. Model Performance
The deep neural network model demonstrated strong performance in predicting rice crop yield. The training and validation loss curves over 100 epochs show that the model effectively minimized both losses, achieving low mean squared error (MSE) and converging. Additionally, the Mean Absolute Error (MAE) of 70.33 and the Root Mean Squared Error (RMSE) of 82.95 reflect the model’s accuracy and robustness, with low deviation from actual values. These metrics collectively highlight the model’s reliability in accurately predicting rice crop yield, offering valuable insights for agricultural planning and resource management.
Figure 9 illustrates the training and validation Mean Absolute Error (MAE) of the deep neural network model over the 100 epochs. The steady decline in both training and validation MAE demonstrates effective learning, with the validation curve closely following the training curve, indicating minimal overfitting and strong generalization. The MAE approaches zero as the model converges, showcasing its robust ability to minimize prediction errors. This consistent performance across epochs highlights the model’s reliability in capturing complex patterns within the dataset for accurate predictions.
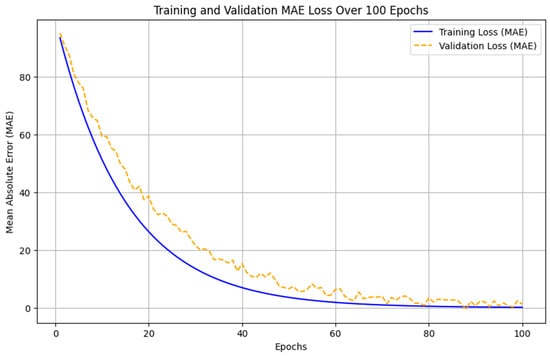
Figure 9.
Training and validation MAE loss over epochs.
3.7. Impact of Water Resources on Rice Production: An Agro-Meteorological Perspective
To better understand the impact of climate change on rice production, it is essential to consider the correlation between water resources and rice crops throughout their different growth stages (phenological phases). Rice requires specific amounts of water during each phase, including germination, vegetative growth, flowering, and grain filling. Analysing water availability across these phases can help explain how water deficits, especially during critical growth periods, may negatively affect rice yields. For example, in years with insufficient rainfall or water supply, rice production may be significantly reduced, especially during the flowering and grain-filling stages. This agro-meteorological approach can provide deeper insights into the role of water scarcity in influencing rice crop performance under changing climate conditions.
4. Discussion
This study presents an enhanced deep neural network model for predicting crop yield, focusing on the effects of climatic variables in Pakistan. This research examines the influence of maximum temperature and precipitation on rice crop yield, using historical climatic data and future projections from the CMIP6 dataset [,]. The model leverages key features derived from monsoon precipitation and temperature patterns, which are critical to rice crop productivity in the region [,]. By incorporating an advanced optimization algorithm, this framework aims to improve the accuracy of yield predictions while highlighting the potential effects of climate change on agricultural outcomes in Pakistan [,]. Previous studies have demonstrated the significant role of climatic variables, particularly precipitation and maximum temperature [], in determining crop yield, underscoring the importance of integrating these parameters into prediction models.
Several studies employed both CNNs and RNNs to predict agricultural yield while accounting for climate []. This was accomplished by integrating the Gaussian process component into CNNs and LSTMs, together with the Caffeine-based deep learning regression model, to predict agricultural yield at the national level [,]. Alternative data-centric deep learning modelling strategies, such as deploying CNNs on RGB data, can effectively predict agricultural productivity. Implemented a basic LSTM model to forecast tomato crop yield and Ficus Benjamin stem growth by taking into account environmental data. CNN and RNN models predict crop yield at the national level using geographical features and phenological variables. The novel method that combines LSTM with IOF optimization has exhibited markedly improved performance compared to other current optimizers. For instance, the authors of.
To further enhance the proposed model and identify an essential avenue for future research, expand the training dataset not only by increasing its size but also by incorporating a broader range of crop types []. This approach will allow the model to provide more accurate forecasts across different growing seasons and regions. By diversifying the dataset, the model’s ability to generalize and make reliable predictions for a broader range of crops and environmental conditions will be significantly improved []. Numerous studies have indicated that increased temperatures influence crop emergence []. Late-planted crops exhibited fewer tillers attributable to elevated temperatures during the tillering growth stage [,]. Furthermore, it shortened the grain-filling period during the reproductive phase, resulting in lower enzyme activity and crop yield [,,].
The study’s findings lay a robust foundation for practical applications in the agricultural sector, particularly for addressing the challenges posed by climate variability. By leveraging a deep neural network, this research highlights the significant influence of CMIP6-projected maximum temperatures and precipitation on crop yields [], providing valuable insights for policymakers, agronomists, and farmers [,]. Furthermore, integrating advanced prediction models with climate data can drive more efficient resource utilization, enhance crop planning strategies and improve agricultural profitability []. By bridging critical knowledge gaps and utilizing data-driven methodologies, this study has the potential to foster resilience in agriculture, enabling stakeholders to adapt to future climatic uncertainties and secure sustainable food production systems. Additionally, we aim to explore the application of fuzzy-based deep learning techniques to crop yield prediction, which could enhance the model’s flexibility and performance in varying agricultural contexts
5. Conclusions
Pakistan’s agriculture faces significant challenges posed by climate change, including increased drought and heat stress, and increased flood risks, particularly under the SSP2-4.5 and SSP5-8.5 pathways. Regions such as Sindh and Baluchistan, already vulnerable to drought and flood-prone areas in northern Pakistan, are experiencing declines in crop yields of essential crops like rice and wheat. Addressing these challenges is critical to ensuring food security for the growing population and improving agricultural sustainability. This study underscores the importance of adaptation strategies, such as cultivating drought-tolerant crops, implementing advanced irrigation systems, improving flood management, and adopting region-specific farming practices. Furthermore, integrating advanced technologies, such as deep neural networks, offers transformative potential to improve crop yield predictions by analyzing factors such as maximum temperature and precipitation’s effects on crop yield. The model has demonstrated high reliability and precision in reducing agricultural losses and improving decision-making.
The research findings highlight the urgency of innovative climate forecasting and resilient framing practices to counter the impacts of climate variability. Leveraging advanced predictive models and region-specific strategies can significantly advance sustainable agriculture, ensuring long-term food production amid unprecedented climate challenges. These insights provide a pathway for policymakers, researchers, and farmers to adopt proactive measures for Pakistan’s agricultural future. By focusing on sustainable practices and climate-resilient strategies, this study aligns with Sustainable Development Goal 2 (Zero Hunger), aiming to improve food security and agricultural productivity, and Sustainable Development Goal 13 (Climate Action), addressing the need for climate adaptation to safeguard agriculture in the context of climate change.
Author Contributions
Conceptualization, W.S. and M.H.S.; Methodology and Software, W.S.; Validation, I.U., M.H.S. and W.S.; Formal Analysis, I.U. and W.S.; Investigation, I.U.; Resources, I.U.; Data Curation, W.S. and S.S.; Writing—Original Draft Preparation, W.S.; Writing—Review and Editing, I.U., Y.W. (Yaoyao Wang) and S.S.; Visualization, I.U.; Supervision, I.U.; Project Administration, S.S., Y.W. (Yuanyuan Wang) and I.U.; Funding Acquisition, I.U. All authors have read and agreed to the published version of the manuscript.
Funding
This research was funded by National Natural Science Foundation of China for International Scientists under Grant No. 42350410438.
Institutional Review Board Statement
Not applicable.
Informed Consent Statement
Not applicable.
Data Availability Statement
All the data are available in the public domain at the links provided in the text.
Conflicts of Interest
The authors declare no conflicts of interest.
References
- Shahzaman, M.; Zhu, W.; Ullah, I.; Mustafa, F.; Bilal, M.; Ishfaq, S.; Nisar, S.; Arshad, M.; Iqbal, R.; Aslam, R.W. Comparison of Multi-Year Reanalysis, Models, and Satellite Remote Sensing Products for Agricultural Drought Monitoring over South Asian Countries. Remote Sens. 2021, 13, 3294. [Google Scholar] [CrossRef]
- Shahzaman, M.; Zhu, W.; Bilal, M.; Habtemicheal, B.; Mustafa, F.; Arshad, M.; Ullah, I.; Ishfaq, S.; Iqbal, R. Remote Sensing Indices for Spatial Monitoring of Agricultural Drought in South Asian Countries. Remote Sens. 2021, 13, 2059. [Google Scholar] [CrossRef]
- Ullah, R.; Khan, J.; Ullah, I.; Khan, F.; Lee, Y. Investigating Drought and Flood Evolution Based on Remote Sensing Data Products over the Punjab Region in Pakistan. Remote Sens. 2023, 15, 1680. [Google Scholar] [CrossRef]
- Khan, I.; Lei, H.; Khan, A.; Muhammad, I.; Javeed, T.; Khan, A.; Huo, X. Yield Gap Analysis of Major Food Crops in Pakistan: Prospects for Food Security. Environ. Sci. Pollut. Res. 2021, 28, 7994–8011. [Google Scholar] [CrossRef] [PubMed]
- Iyakaremye, V.; Zeng, G.; Ullah, I.; Gahigi, A.; Mumo, R.; Ayugi, B. Recent Observed Changes in Extreme High-Temperature Events and Associated Meteorological Conditions over Africa. Int. J. Climatol. 2022, 42, 4522–4537. [Google Scholar] [CrossRef]
- Ullah, R.; Khan, J.; Ullah, I.; Khan, F.; Lee, Y. Assessing Impacts of Flood and Drought over the Punjab Region of Pakistan Using Multi-Satellite Data Products. Remote Sens. 2023, 15, 1484. [Google Scholar] [CrossRef]
- Riaz, R.; Jie, Z.; Ullah, I.; Akinsanola, A.A.; Syed, S.; Geremew, C.T.; Ullah, K.; Qasim, M. Seasonal Contrast in Dryland Vegetation Response to Meteorological Drought across South Asia. Environ. Res. Lett. 2025, 20, 084065. [Google Scholar] [CrossRef]
- Shah, W.; Chen, J.; Ullah, I.; Shah, A.A.; Alotaibi, B.A.; Syed, S.; Shah, M.H. Examining the Impacts of Recent Water Availability on the Future Food Security Risks in Pakistan Using Machine Learning Approaches. Water 2024, 17, 55. [Google Scholar] [CrossRef]
- Dahal, P.; Shrestha, N.S.; Shrestha, M.L.; Krakauer, N.Y.; Panthi, J.; Pradhanang, S.M.; Jha, A.; Lakhankar, T. Drought Risk Assessment in Central Nepal: Temporal and Spatial Analysis. Nat. Hazards 2016, 80, 1913–1932. [Google Scholar] [CrossRef]
- Shah, W.; Chen, J.; Ullah, I.; Shah, M.H.; Ullah, I. Application of RNN-LSTM in Predicting Drought Patterns in Pakistan: A Pathway to Sustainable Water Resource Management. Water 2024, 16, 1492. [Google Scholar] [CrossRef]
- Ullah, I.; Ma, X.; Yin, J.; Saleem, F.; Syed, S.; Omer, A.; Habtemicheal, B.A.; Liu, M.; Arshad, M. Observed Changes in Seasonal Drought Characteristics and Their Possible Potential Drivers over Pakistan. Int. J. Climatol. 2022, 42, 1576–1596. [Google Scholar] [CrossRef]
- Coffel, E.D.; Horton, R.M.; de Sherbinin, A. Temperature and Humidity Based Projections of a Rapid Rise in Global Heat Stress Exposure during the 21st Century. Environ. Res. Lett. 2018, 13, 014001. [Google Scholar] [CrossRef]
- Ullah, I.; Ma, X.; Yin, J.; Omer, A.; Habtemicheal, B.A.; Saleem, F.; Iyakaremye, V.; Syed, S.; Arshad, M.; Liu, M. Spatiotemporal Characteristics of Meteorological Drought Variability and Trends (1981–2020) over South Asia and the Associated Large-Scale Circulation Patterns. Clim. Dyn. 2023, 60, 2261–2284. [Google Scholar] [CrossRef]
- Uwimbabazi, J.; Jing, Y.; Iyakaremye, V.; Ullah, I.; Ayugi, B. Observed Changes in Meteorological Drought Events during 1981–2020 over Rwanda, East Africa. Sustainability 2022, 14, 1519. [Google Scholar] [CrossRef]
- Iyakaremye, V.; Zeng, G.; Yang, X.; Zhang, G.; Ullah, I.; Gahigi, A.; Vuguziga, F.; Asfaw, T.G.; Ayugi, B. Increased High-Temperature Extremes and Associated Population Exposure in Africa by the Mid-21st Century. Sci. Total Environ. 2021, 790, 148162. [Google Scholar] [CrossRef]
- Sein, Z.M.M.; Ullah, I.; Syed, S.; Zhi, X.; Azam, K.; Rasool, G. Interannual Variability of Air Temperature over Myanmar: The Influence of Enso and Iod. Climate 2021, 9, 1–19. [Google Scholar] [CrossRef]
- Ullah, I.; Zeng, X.M.; Mukherjee, S.; Aadhar, S.; Mishra, A.K.; Syed, S.; Ayugi, B.O.; Iyakaremye, V.; Lv, H. Future Amplification of Multivariate Risk of Compound Drought and Heatwave Events on South Asian Population. Earth’s Future 2023, 11, e2023EF003688. [Google Scholar] [CrossRef]
- Imran, M.; Hou, J.; Wang, T.; Zhou, Q.; Li, D.; Khan, M.H.; Ullah, I.; Noor, R.S.; Umair, M.; Hussain, S. Flood Characteristics and Risk Analysis in Small Watersheds on the Loess Plateau under Extreme Heavy Rainfall. Nat. Hazards 2024, 121, 6857–6878. [Google Scholar] [CrossRef]
- Liu, M.; Ma, X.; Yin, Y.; Zhang, Z.; Yin, J.; Ullah, I.; Arshad, M. Non-stationary Frequency Analysis of Extreme Streamflow Disturbance in a Typical Ecological Function Reserve of China under a Changing Climate. Ecohydrology 2021, 23, e2323. [Google Scholar] [CrossRef]
- Sajjad, M.M.; Wang, J.; Abbas, H.; Ullah, I.; Khan, R.; Ali, F. Impact of Climate and Land-Use Change on Groundwater Resources, Study of Faisalabad District, Pakistan. Atmosphere 2022, 13, 1097. [Google Scholar] [CrossRef]
- Ullah, I.; Zeng, X.; Hina, S.; Syed, S.; Ma, X.; Iyakaremye, V.; Yin, J.; Singh, V.P. Recent and Projected Changes in Water Scarcity and Unprecedented Drought Events over Southern Pakistan. Front. Earth Sci. 2023, 11, 1113554. [Google Scholar] [CrossRef]
- Ullah, I.; Zeng, X.; Syed, S.; Ma, X.; Xing, Y.; Singh, V.P. How Significant Is Projected Drought Risk in Pakistan Under a Warmer Climate? Earth Syst. Environ. 2025, 1–20. [Google Scholar] [CrossRef]
- Ahmed Nomman, M.; Schmitz, M. Economic Assessment of the Impact of Climate Change on the Agriculture of Pakistan. Bus. Econ. Horizons 2011, 4, 1–12. [Google Scholar] [CrossRef]
- Zhong, R.; Chen, X.; Lai, C.; Wang, Z.; Lian, Y.; Yu, H.; Wu, X. Drought Monitoring Utility of Satellite-Based Precipitation Products across Mainland China. J. Hydrol. 2019, 568, 343–359. [Google Scholar] [CrossRef]
- Prodhan, F.A.; Zhang, J.; Bai, Y.; Pangali Sharma, T.P.; Koju, U.A. Monitoring of Drought Condition and Risk in Bangladesh Combined Data from Satellite and Ground Meteorological Observations. IEEE Access 2020, 8, 93264–93282. [Google Scholar] [CrossRef]
- Xing, Y.; Shao, D.; Liang, Q.; Chen, H.; Ma, X.; Ullah, I. Investigation of the Drainage Loss Effects with a Street View Based Drainage Calculation Method in Hydrodynamic Modelling of Pluvial Floods in Urbanized Area. J. Hydrol. 2022, 605, 127365. [Google Scholar] [CrossRef]
- KING, R.D.; FENG, C.; SUTHERLAND, A. STATLOG: COMPARISON OF CLASSIFICATION ALGORITHMS ON LARGE REAL-WORLD PROBLEMS. Appl. Artif. Intell. 1995, 9, 289–333. [Google Scholar] [CrossRef]
- Ayugi, B.O.; Ullah, I.; Chung, E. Observed Flash Drought to Persist in Future over Southern Africa. Sci. Total Environ. 2024, 951, 175744. [Google Scholar] [CrossRef] [PubMed]
- Sein, Z.M.M.; Ullah, I.; Iyakaremye, V.; Azam, K.; Ma, X.; Syed, S.; Zhi, X. Observed Spatiotemporal Changes in Air Temperature, Dew Point Temperature and Relative Humidity over Myanmar during 2001–2019. Meteorol. Atmos. Phys. 2022, 134, 7. [Google Scholar] [CrossRef]
- Arshad, M.; Ma, X.; Yin, J.; Ullah, W.; Liu, M.; Ullah, I. Performance Evaluation of ERA-5, JRA-55, MERRA-2, and CFS-2 Reanalysis Datasets, over Diverse Climate Regions of Pakistan. Weather Clim. Extrem. 2021, 33, 100373. [Google Scholar] [CrossRef]
- Eman, K.; Chung, E.; Ayugi, B.O.; Ullah, I. Unravelling Teleconnection-Driven Shifts in Precipitation Extremes Over Pakistan Through HighResMIP-CMIP6 Simulations. Int. J. Climatol. 2025, 45, e8916. [Google Scholar] [CrossRef]
- Ullah, I.; Ma, X.; Yin, J.; Asfaw, T.G.; Azam, K.; Syed, S.; Liu, M.; Arshad, M.; Shahzaman, M. Evaluating the Meteorological Drought Characteristics over Pakistan Using in Situ Observations and Reanalysis Products. Int. J. Climatol. 2021, 41, 4437–4459. [Google Scholar] [CrossRef]
- Arshad, M.; Ma, X.; Yin, J.; Ullah, W.; Ali, G.; Ullah, S.; Liu, M.; Shahzaman, M.; Ullah, I. Evaluation of GPM-IMERG and TRMM-3B42 Precipitation Products over Pakistan. Atmos. Res. 2021, 249, 105341. [Google Scholar] [CrossRef]
- Saleem, F.; Zhang, W.; Hina, S.; Zeng, X.; Ullah, I.; Bibi, T.; Nnamdi, D.V. Population Exposure Changes to Mean and Extreme Climate Events Over Pakistan and Associated Mechanisms. GeoHealth 2023, 7, e2023GH000887. [Google Scholar] [CrossRef] [PubMed]
- Hina, S.; Saleem, F.; Arshad, A.; Hina, A.; Ullah, I. Droughts over Pakistan: Possible Cycles, Precursors and Associated Mechanisms. Geomatics, Nat. Hazards Risk 2021, 12, 1638–1668. [Google Scholar] [CrossRef]
- O’Neill, B.C.; Tebaldi, C.; Van Vuuren, D.P.; Eyring, V.; Friedlingstein, P.; Hurtt, G.; Knutti, R.; Kriegler, E.; Lamarque, J.F.; Lowe, J.; et al. The Scenario Model Intercomparison Project (ScenarioMIP) for CMIP6. Geosci. Model Dev. 2016, 9, 3461–3482. [Google Scholar] [CrossRef]
- Smirnov, O.; Zhang, M.; Xiao, T.; Orbell, J.; Lobben, A.; Gordon, J. The Relative Importance of Climate Change and Population Growth for Exposure to Future Extreme Droughts. Clim. Change 2016, 138, 41–53. [Google Scholar] [CrossRef]
- Ullah, I.; Saleem, F.; Iyakaremye, V.; Yin, J.; Ma, X.; Syed, S.; Hina, S.; Asfaw, T.G.; Omer, A. Projected Changes in Socioeconomic Exposure to Heatwaves in South Asia Under Changing Climate. Earth’s Future 2022, 10, e2021EF002240. [Google Scholar] [CrossRef]
- Lu, K.; Arshad, M.; Ma, X.; Ullah, I.; Wang, J.; Shao, W. Evaluating Observed and Future Spatiotemporal Changes in Precipitation and Temperature across China Based on CMIP6-GCMs. Int. J. Climatol. 2022, 42, 7703–7729. [Google Scholar] [CrossRef]
- Ullah, I.; Ma, X.; Asfaw, T.G.; Yin, J.; Iyakaremye, V.; Saleem, F.; Xing, Y.; Azam, K.; Syed, S. Projected Changes in Increased Drought Risks Over South Asia Under a Warmer Climate. Earth’s Future 2022, 10, e2022EF002830. [Google Scholar] [CrossRef]
- Hina, S.; Saleem, F.; Hina, A.; Ullah, I.; Bibi, T.; Mahmood, T. Exploring Trends and Variability of Climate Change Indices in the Agro-ecological Zones of Pakistan and Their Driving Mechanisms. Int. J. Climatol. 2024, 44, 3589–3612. [Google Scholar] [CrossRef]
- Patil, K.R.; Doi, T.; Behera, S.K. Predicting Extreme Floods and Droughts in East Africa Using a Deep Learning Approach. npj Clim. Atmos. Sci. 2023, 6, 108. [Google Scholar] [CrossRef]
- Ullah, I.; Zeng, X.-M.; Syed, S.; Wu, J.; Yang, X.; Syed, S.; Wang, N.; Li, Y. A Multivariate Framework for Assessing Propagation Thresholds from Meteorological to Hydrological Drought across Indus River Basins-South Asia. Stoch. Environ. Res. Risk Assess. 2025, 39, 5415–5433. [Google Scholar] [CrossRef]
- Wang, B.-Z.Z.; Liu, S.-J.J.; Zeng, X.-M.M.; Lu, B.; Zhang, Z.-X.X.; Zhu, J.; Ullah, I. A Study of Precipitation Forecasting for the Pre-Summer Rainy Season in South China Based on a Backpropagation Neural Network. Water 2024, 16, 1423. [Google Scholar] [CrossRef]
- Wu, J.; Yao, H.; Chen, X.; Chen, X. Dynamics of Dissolved Organic Carbon during Drought and Flood Events: A Phase-by-Stages Perspective. Sci. Total Environ. 2023, 871, 162158. [Google Scholar] [CrossRef] [PubMed]
- Ullah, I.; Mukherjee, S.; Syed, S.; Mishra, A.K.; Ayugi, B.O.; Aadhar, S. Anthropogenic and Atmospheric Variability Intensifies Flash Drought Episodes in South Asia. Commun. Earth Environ. 2024, 5, 267. [Google Scholar] [CrossRef]
- Shao, S.; Zeng, X.-M.; Wang, N.; Ullah, I.; Lv, H. Attribution of Moisture Sources for Summer Precipitation in the Upstream Catchment of the Three Gorges Dam. J. Hydrometeorol. 2024, 25, 353–369. [Google Scholar] [CrossRef]
- Sein, Z.M.M.; Zhi, X.; Ullah, I.; Azam, K.; Ngoma, H.; Saleem, F.; Xing, Y.; Iyakaremye, V.; Syed, S.; Hina, S.; et al. Recent Variability of Sub-seasonal Monsoon Precipitation and Its Potential Drivers in Myanmar Using In-situ Observation during 1981–2020. Int. J. Climatol. 2022, 42, 3341–3359. [Google Scholar] [CrossRef]
- Zou, R.; Wang, X.; Yin, Y.; Ma, X.; Yang, X.; Huang, P.; Ullah, I. Comparing Spatio-Temporal Propagation Patterns of Hydrological and Meteorological Droughts: Insights from SWAT Modelling in the Poyang Lake Basin. CATENA 2024, 243, 108183. [Google Scholar] [CrossRef]
- Masood, A.; Zhu, F.R.; Sa’adi, Z.; Mamun Hridoy, M.A.A.; Ullah, I. Study of Meteorological Parameters and Classification of Aerosols Using Remote Sensing over LHAASO. Theor. Appl. Climatol. 2025, 156, 375. [Google Scholar] [CrossRef]
- Ullah, I.; Ma, X.; Ren, G.; Yin, J.; Iyakaremye, V.; Syed, S.; Lu, K.; Xing, Y.; Singh, V.P. Recent Changes in Drought Events over South Asia and Their Possible Linkages with Climatic and Dynamic Factors. Remote Sens. 2022, 14, 3219. [Google Scholar] [CrossRef]
- Yang, X.; Shen, C.; Ullah, I.; Curio, J.; Chen, D. Evaluating Heat Stress and Occupational Risks in the Southern Himalayas under Current and Future Climates. npj Clim. Atmos. Sci. 2024, 7, 211. [Google Scholar] [CrossRef]
- Xing, Y.; Shao, D.; Lin, Q.; Ullah, I.; Wang, J.; Wang, Y. Towards More Efficient Urban Flood Assessment: Issue of Spatial Resolution in Urban Flood Hydrodynamic Modeling from Flood Exposure Perspective. Water Resour. Manag. 2025, 39, 6683–6700. [Google Scholar] [CrossRef]
- Zou, R.; Yin, Y.; Wang, X.; Zhang, Z.; Ma, X.; Liu, M.; Ullah, I. Characteristics and Propagation of Meteorological and Hydrological Droughts in Eastern Gansu, a Typical Semi-arid Region, China. Int. J. Climatol. 2023, 43, 5327–5347. [Google Scholar] [CrossRef]
- Gu, L.; Zeng, X.; Li, C.; Wang, N.; Shao, S.; Ullah, I. A Numerical Simulation of a Fog Event in the Sichuan Basin, China: The Sensitivity to Terrain Elevations. Atmosphere 2024, 15, 1546. [Google Scholar] [CrossRef]
- Farooq, U.; Taha Bakheit Taha, A.; Tian, F.; Yuan, X.; Ajmal, M.; Ullah, I.; Ahmad, M. Flood Modelling and Risk Analysis of Cinan Feizuo Flood Protection Area, Huaihe River Basin. Atmosphere 2023, 14, 678. [Google Scholar] [CrossRef]
- Alsafadi, K.; Sun, J.; Ullah, I.; Srivastava, A.K.; Ewert, F.; Larbi, B.R.; Bi, S.; Yang, S.; Wang, F.; Cao, W. Urbanization’s Dual Role in the Exacerbation and Mitigation of Drought Dynamics in China. npj Urban Sustain. 2025, 5, 79. [Google Scholar] [CrossRef]
- Zhang, J.; Syed, S.; Wu, Y.; Liu, J. Warming Asian Drylands Inducing the Delayed Retreat of East Asian Summer Monsoon and Intensifying Autumn Precipitation in Northern China. J. Geophys. Res. Atmos. 2024, 129, e2024JD041811. [Google Scholar] [CrossRef]
- Nie, M.; Zeng, X.; Huang, S.; Wang, N.; Ullah, I.; Fang, W.; Bai, G.; Zhang, Z.; Zhu, J. Strong Spatial Propagation Strength of Meteorological Droughts Exhibits in the Humid—Arid Transition Regions of Mainland China. Geophys. Res. Lett. 2025, 52, e2025GL115891. [Google Scholar] [CrossRef]
- Sein, Z.M.M.; Ullah, I.; Saleem, F.; Zhi, X.; Syed, S.; Azam, K. Interdecadal Variability in Myanmar Rainfall in the Monsoon Season (May–October) Using Eigen Methods. Water 2021, 13, 729. [Google Scholar] [CrossRef]
- Xing, Y.; Liang, Q.; Shao, D.; Ullah, I. Effects of Urban Topographical Features on Drainage Efficiency for Pluvial Flash Flood Occurrence. Nat. Hazards 2025, 121, 14513–14529. [Google Scholar] [CrossRef]
- Geremew, T.; Ullah, I.; Akinsanola, A.A.; Muleta, D. Unravelling Southern Ocean Sea Surface Temperatures Impacts on Long Rainfall Variability in East Africa. Atmos. Res. 2026, 327, 108406. [Google Scholar] [CrossRef]
- Tebaldi, C.; Wehner, M.F. Benefits of Mitigation for Future Heat Extremes under RCP4.5 Compared to RCP8.5. Clim. Change 2018, 146, 349–361. [Google Scholar] [CrossRef]
- Edokossi, K.; Jin, S.; Mazhar, U.; Molina, I.; Calabia, A.; Ullah, I. Monitoring the Drought in Southern Africa from Space-Borne GNSS-R and SMAP Data. Nat. Hazards 2024, 120, 7947–7967. [Google Scholar] [CrossRef]
- Zeng, X.; Nie, M.; Wang, N.; Ullah, I.; Bai, G. Attributing Spatiotemporal Evolution and Driving Factors of Meteorological Drought across Yangtze River Basin, China. Atmos. Res. 2025, 323, 108155. [Google Scholar] [CrossRef]
- Zeng, X.-M.; Li, C.; Wang, N.; Ullah, I. Impacts of Land–Atmosphere Interactions on Boundary Layer Variables: A Classification Perspective from Modeling Approaches. Atmosphere 2024, 15, 650. [Google Scholar] [CrossRef]
Disclaimer/Publisher’s Note: The statements, opinions and data contained in all publications are solely those of the individual author(s) and contributor(s) and not of MDPI and/or the editor(s). MDPI and/or the editor(s) disclaim responsibility for any injury to people or property resulting from any ideas, methods, instructions or products referred to in the content. |
© 2025 by the authors. Licensee MDPI, Basel, Switzerland. This article is an open access article distributed under the terms and conditions of the Creative Commons Attribution (CC BY) license (https://creativecommons.org/licenses/by/4.0/).