Article

Estimation of Global Solar Radiation in Unmonitored Areas of Brazil Using ERA5 Reanalysis and Artificial Neural Networks

by
Eduardo Morgan Uliana
1,*,
Juliana de Abreu Araujo
2,
Márcio Roggia Zanuzo
1,
Alvaro Henrique Guedes Araujo
1,
Marionei Fomaca de Sousa Junior
2,
Uilson Ricardo Venâncio Aires
2 and
Herval Alves Ramos Filho
1
1
Instituto de Ciências Agrárias e Ambientais, Federal University of Mato Grosso, Sinop 78550-728, Brazil
2
Department of Agricultural and Biological Engineering, Mississippi State University, Starkville, MS 39762, USA
*
Author to whom correspondence should be addressed.
Atmosphere 2025, 16(11), 1306; https://doi.org/10.3390/atmos16111306
Submission received: 14 October 2025 / Revised: 5 November 2025 / Accepted: 7 November 2025 / Published: 19 November 2025
(This article belongs to the Section Atmospheric Techniques, Instruments, and Modeling)

Abstract

Estimating global radiation (GR) is crucial for assessing solar energy potential, understanding surface energy balance, and forecasting agricultural production. However, several regions require additional monitoring and sparse sensor networks. The ERA5-ECMWF reanalysis is a viable alternative for estimating meteorological elements in unmonitored areas. This study aimed to train an artificial neural network (ANN) model to estimate GR based on ERA5 data and map its distribution in the study area. We utilized GR data from 32 automatic weather stations of the Brazilian National Institute of Meteorology in Mato Grosso, Brazil, for model training. The model input consisted of ERA5 air temperature, precipitation data, and top-of-atmosphere solar radiation (R0) calculated from the latitude and day of the year. The calibrated model demonstrated high accuracy, with Nash–Sutcliffe and Kling–Gupta efficiency indices exceeding 0.99. This enabled the generation of historical time series and maps of GR spatial distribution in the study area. The results demonstrate that—as input for the ANN—ERA5 data enables precise and accurate estimation of GR distribution, even in locations without meteorological stations.

1. Introduction

Understanding global radiation (GR) is crucial for agricultural planning, hydrological, and engineering activities. This understanding enables the assessment of the solar energy generation potential in photovoltaic cells, analysis of the surface energy balance, and crop yield estimation, providing crucial information for strategic planning [1,2]. Solar energy presents a promising renewable alternative for achieving Sustainable Development Goal 7—“affordable and clean energy,” defined by the United Nations—by 2030. However, it is an intermittent source that requires detailed knowledge of solar irradiance behavior, both for investment and energy generation planning [3,4,5].
According to Sawadogo et al. [6] and Paletta et al. [7], the most accurate method for obtaining GR is punctual measurements using pyranometers at meteorological stations. In developing countries, the density and spatial distribution of this equipment still need to be improved, mainly because of a lack of investment in installing and maintaining new equipment. In Brazil, regions with the lowest density of meteorological stations, and consequently scarce solar radiation measurements, primarily include areas in the central-west and northern regions, encompassing the Amazon rainforest, Brazilian savannas, and Pantanal wetlands. Given this scenario, developing methodologies that allow the estimation of GR in locations lacking measurements is crucial, along with assessing its spatial and temporal distribution. This information is fundamental for evaluating solar energy generation potential, particularly in areas within the Amazon biome where isolated communities lack access to the conventional power grid.
GR can be estimated using physical, empirical, or hybrid models [7]. Among these, machine learning and deep learning models have gained prominence, as they have empirical equations that utilize readily determinable meteorological elements, such as air temperature. Madhiarasan et al. [4] presented a study that utilized an artificial neural network (ANN) model with a recursive radial basis function to predict GR. They concluded that the proposed model offers excellent predictions for GR, providing stability and reliability in the context of solar energy. Azizi et al. [8] employed machine learning models to predict GR and air temperature over the next decade. They concluded that among the evaluated models, the convolutional neural network (CNN) achieved the best performance using temperature, surface pressure, and relative humidity as input data. Shao et al. [9] also verified its effectiveness in predicting the GR; however, they utilized orbital remote sensing and reanalysis data for the modeling.
Following this line of research, Nielsen et al. [10] developed IrradianceNet, a system based on artificial neural networks that forecasts surface solar irradiance over Europe with a 4-h horizon. The authors integrated satellite data, topographical information, and calendar features into the model, allowing it to model the impact of clouds on GR estimation. Authors such as Aljanad et al. [11], Babar et al. [12], Chen et al. [13], Pereira et al. [2], and Sharma and Kakkar [14], among others, successfully used ANNs and other machine learning models to predict GR. Input data varied between studies but relied mainly on reanalysis data, satellite data, or readily measured surface meteorological elements. Among the reanalysis datasets, the European Center for Medium-Range Weather Forecasts (ECMWF) ERA5 is a viable option for analyzing the spatial and temporal distribution of GR and its estimation in locations lacking meteorological monitoring. Jiang et al. [5] used ERA5 hourly radiation data to investigate solar energy stability. Fang et al. [15] assessed the potential of wind and solar energy in northwestern Chinese provinces using ERA5 reanalysis data to determine the spatial and temporal distribution and complementarity of these renewable energy sources.
According to Babar et al. [12], meteorological reanalysis and satellite-based solar irradiance estimates tend to exhibit biases, particularly in high-altitude areas. Therefore, the authors utilized a Random Forest (RF) machine-learning model to combine ERA5 reanalysis data with Cloud, Albedo, and Radiation datasets from CLARA-A2 to estimate solar irradiance. The evaluation of the proposed model at five Swedish locations demonstrated improvements in solar radiation estimation. The data also highlights the crucial role of machine-learning algorithms in obtaining more sophisticated radiation databases for high-latitude regions, which can be utilized for planning and operating solar power plants.
In this context, it is evident that the ERA5 meteorological reanalysis grid can serve as a viable alternative for estimating meteorological elements in locations lacking observational data, while ANNs demonstrate a high capacity for correlating these data with surface-measured radiation. Therefore, this study aimed to train an ANN model to estimate GR using ERA5 data and generate detailed maps representing its spatial distribution across the study area.

2. Materials and Methods

2.1. Study Area

The study area encompasses the state of Mato Grosso, Brazil, which is nationally renowned for its agricultural production of grains and fibers (Figure 1). The selection of Mato Grosso as the study area was driven by its considerable agricultural importance, necessitating accurate information on GR for analyzing crop development and estimating yields. Furthermore, Mato Grosso encompasses diverse biomes, each characterized by unique environmental attributes, making it an ideal location for assessing the efficacy of GR estimation models across various contexts. Owing to seasonal variations and distinct energy demands, the region poses a notable challenge in managing renewable resources and seeking sustainable solutions, justifying an in-depth investigation within this context.

2.2. Meteorological Data

This study used the GR data collected from 32 automatic weather stations (Figure 1) belonging to the Brazilian National Institute of Meteorology (INMET). The historical data series covered the period from 2003 to 2020. Each station is equipped with a pyranometer to measure solar irradiance by measuring the radiant energy absorbed by a black-and-white-painted disk housed within protective glass domes. The detection surface is on the top of a thermopile structure. Because the heat generated by the absorbed radiation flows through the thermopile, a voltage signal is generated across the pile. This voltage is directly proportional to the absorbed solar irradiance. The pyranometer samples the irradiance every 5 s and calculates a 1-min average from 12 samples. The instrument sums these minute averages at the end of each hour, providing the hourly GR in KJ m−2. Here, the hourly data were aggregated into daily totals and converted to MJ m−2 day−1. Subsequently, the monthly averages of the daily totals were calculated.

2.3. ERA5 Reanalysis Data

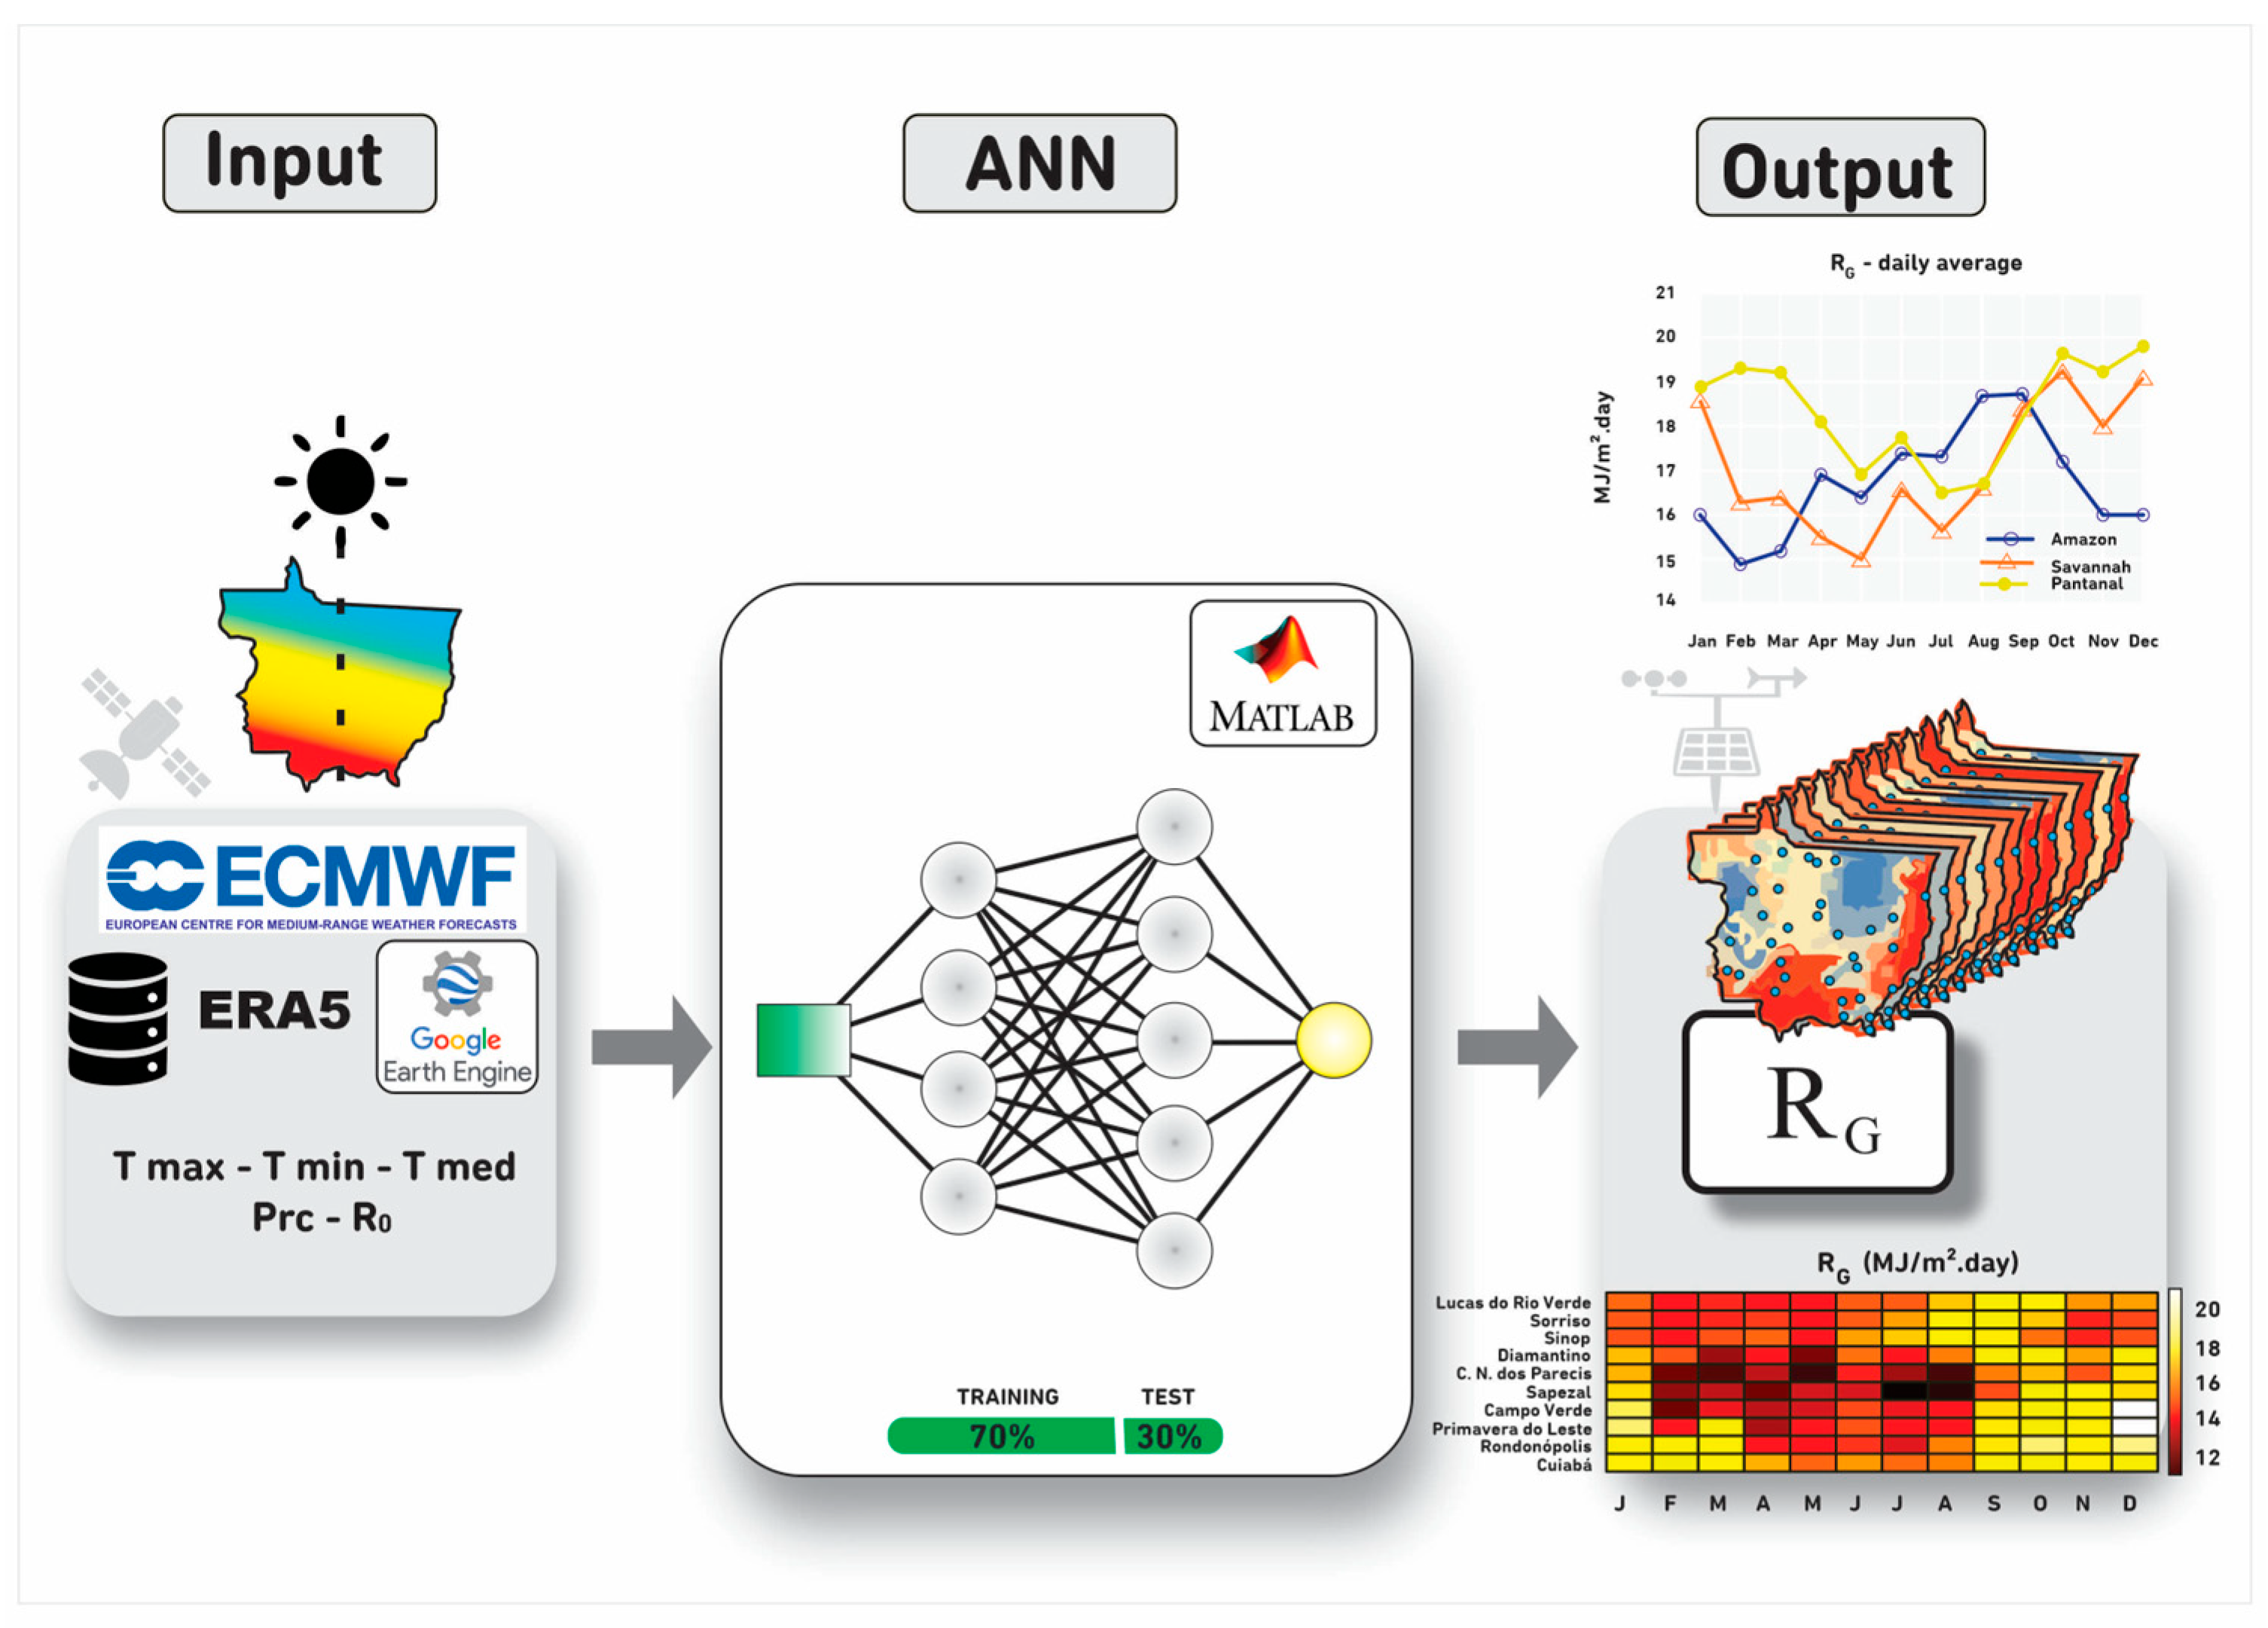
In this study, we used data from the ERA5 reanalysis grid [16], covering the period from January 1980 to December 2019. Georeferenced images were obtained through the geemap Python 3.11 package [17] and the Google Earth Engine platform [18], by selecting the dataset ‘ECMWF/ERA5/DAILY’, which consists of nine meteorological variables with a spatial resolution of approximately 28 km. Among the available variables, only the mean, maximum, and minimum air temperatures, and the total precipitation, were used to estimate global solar radiation. Preliminary experiments comparing models with additional ERA5 variables using the performance metrics described below indicated that the four retained predictors achieved the best overall performance, similar to that described by Uliana et al. [19].
Using the geemap package, daily images of the selected meteorological variables were obtained. Subsequently, a routine developed in MATLAB 2016 was used to extract pixel values and organize a georeferenced database, chronologically structured from 1980 to 2019. After the organization of the daily database, monthly totals of precipitation (mm) and monthly mean temperatures (°C) were calculated for the entire historical series.

2.4. ANN Architecture and Training

Artificial Neural Network (ANN) models were trained to establish a relationship between monthly ERA5 reanalysis data and GR values measured at meteorological stations. The procedures followed for developing the ANN were derived from the methodology described by Sousa Junior. et al. [20]. Before training, the dataset was normalized to ensure that all input variables had comparable scales and to facilitate faster and more stable learning. Each variable was scaled to the range of –1 to 1 according to Equation (1):
p n =   2 p p min p max   p min 1
where p n is the normalized variable, and p min and p max are the minimum and maximum values, respectively. This transformation helps the ANN handle inputs with different magnitudes and improves convergence during training.
The dataset was randomly divided into two subsets: 70% for training and 30% for testing. The ANN architecture employed was a multilayer perceptron (MLP), which consisted of an input layer, two hidden layers, and one output layer (Figure 2). The hidden layers are responsible for capturing nonlinear relationships between the ERA5 input variables and the measured GR, while the output layer generates the final GR estimate.
Two activation functions were evaluated for the hidden layers: log-sigmoid and hyperbolic tangent (tanh), both of which introduce nonlinearity into the model and allow it to learn complex relationships between inputs and outputs. The output layer used a linear activation function, appropriate for continuous target variables such as radiation values.
To determine the optimal number of neurons in each hidden layer, we applied the Shuffled Complex Evolution–University of Arizona (SCE-UA) optimization algorithm [21]. This global optimization technique iteratively adjusts the number of neurons and evaluates the model’s performance to minimize the prediction error. The Nash–Sutcliffe Efficiency (NSE) index served as the objective function, quantifying how well the ANN estimates matched the observed GR values. The optimization process stopped when no further improvement in NSE was observed, ensuring a balance between model accuracy and complexity.
Finally, the ANN weights were calibrated using the backpropagation algorithm combined with the Levenberg–Marquardt optimization method, as described by Uliana et al. [19]. This hybrid approach improves the convergence speed and prevents the model from getting stuck in local minima during training. A maximum epoch limit was defined as a stopping criterion to avoid overfitting and excessive computation time.

2.5. Model Performance Evaluation

The performance of the ANNs in estimating GR was evaluated using statistical metrics, including root mean square error (RMSE), relative RMSE (RRMSE), mean absolute error (MAE), bias, as well as the Kling–Gupta (Equation (2)) and Nash–Sutcliffe efficiency (Equation (3)) indices. For a more comprehensive understanding of these error metrics and their use in assessing model accuracy and precision, refer to the studies by Sousa Junior. et al. [20] and Rápalo et al. [22]. After evaluating these error metrics, the model was applied to estimate monthly solar radiation (MJ m−2 day−1) for all pixels in the reanalysis grid, covering the period from January 1980 to December 2019.
E kg   = 1     r     1 2 + σ e σ o     1 2 + bias     1 2  
E NS = 1     i = 1 n ( O i     P i ) 2 i = 1 n ( O i     O ) 2
where Pi is the estimated streamflow (m3 s−1), Oi is the observed streamflow (m3 s−1), O is the average of the observed streamflow (m3 s−1), n is the number of values in the sample, r is the correlation coefficient between the observed and estimated data, σe is the standard deviation of the data estimated by the model, and σo is the standard deviation of the observed data.

3. Results

Table 1 presents the architecture of the trained ANN and the error metrics obtained during the training and testing phases of the model. It is important to emphasize that testing data were not used during training, meaning that the model was presented with unseen data to assess its predictive capabilities. The results presented in Table 1 indicate that the model achieved excellent performance, with significantly low values of mean absolute error (MAE), root mean square error (RMSE), and relative RMSE (RRMSE). In addition, the bias remained close to zero, which is desirable. A positive value of this metric indicates the tendency of the model to underestimate the GR values slightly. Furthermore, the Nash–Sutcliffe and Kling–Gupta efficiency indices, both exceeding 0.99, indicated that the trained ANN model was “accurate and reliable” for estimating GR using ERA5 reanalysis data and R0 as inputs.
When comparing the error metrics in Table 1 for both the training and testing phases, it is evident that the fitted model did not experience performance degradation, eliminating the presence of overfitting and underfitting in the ANN. This demonstrates the ability of the model to generalize effectively. The excellent performance of the model during the training phase raised concerns about potential overfitting, a common occurrence during ANN training. Overfitting primarily results from an excessive number of training epochs, hidden layers, or artificial neurons within the layers. Overfitting during training is typically verified by an increase in the model error during the testing phase, usually performed with data not presented to the model during training. By comparing the error metrics across both phases here, it becomes clear that the possibility of this issue occurring was ruled out. Furthermore, utilizing the SCE-UA optimization algorithm to determine the optimal number of neurons, interactions, and epochs is crucial to minimizing the chances of overfitting. The optimization primarily focused on evaluating the objective function obtained during the testing phase of the model.
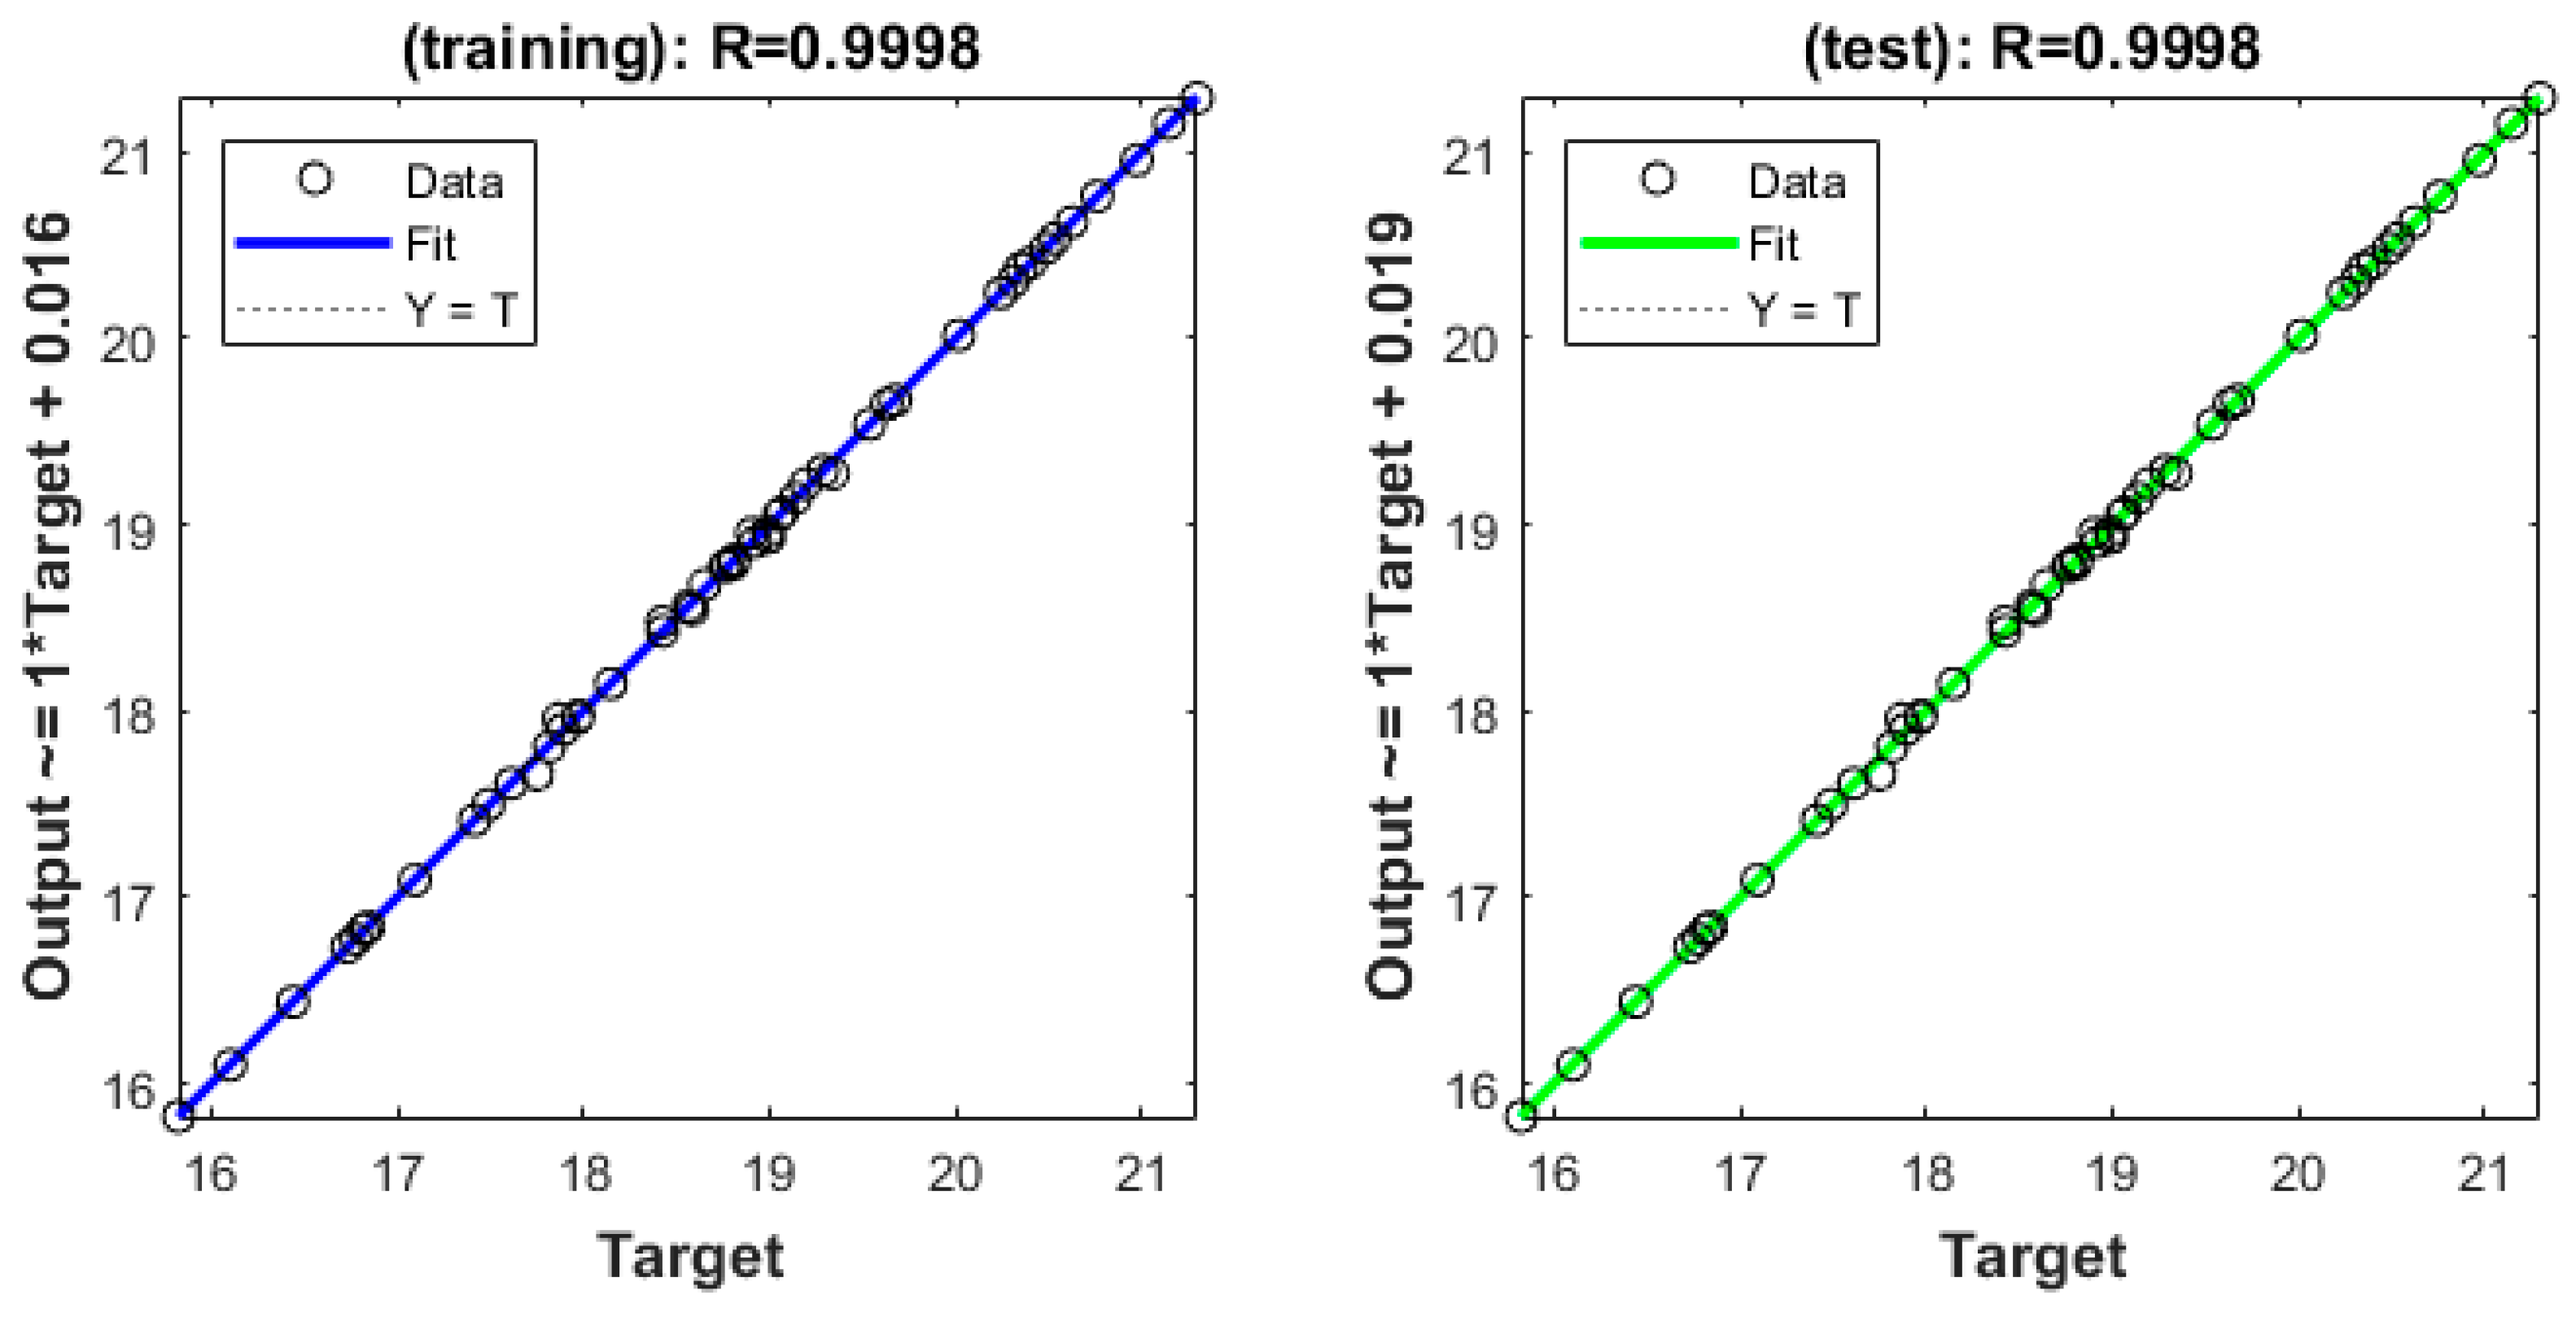
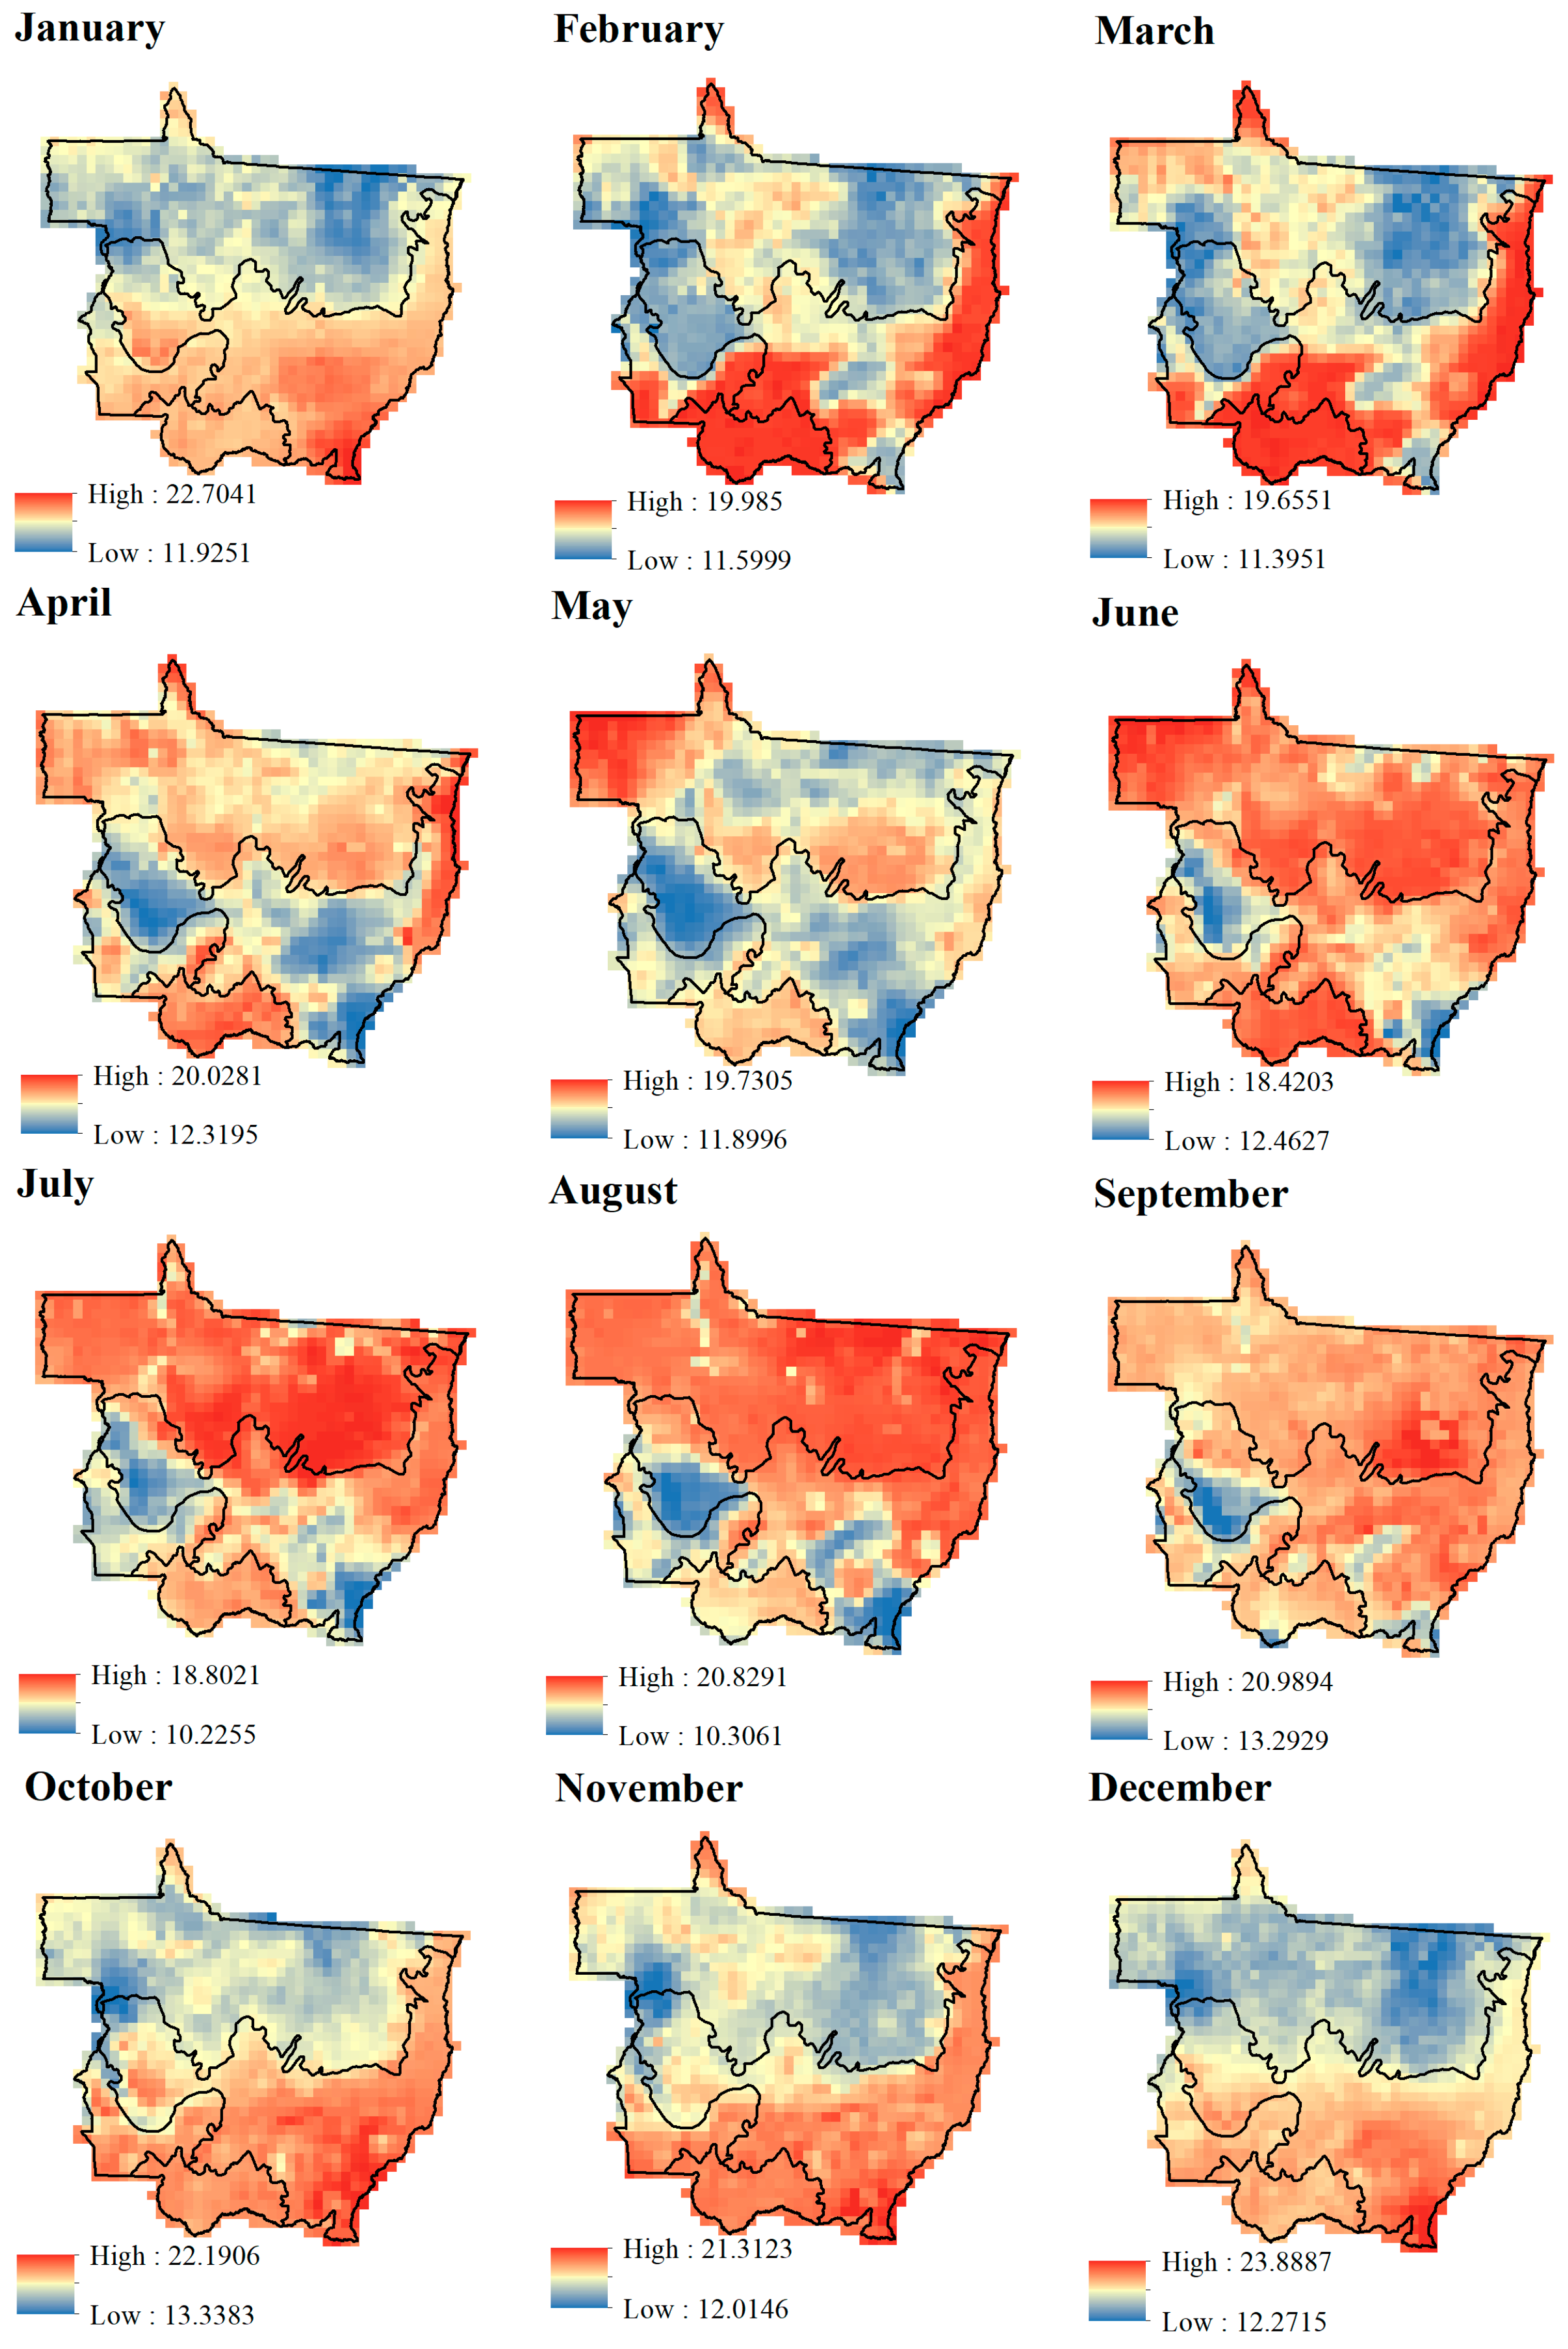
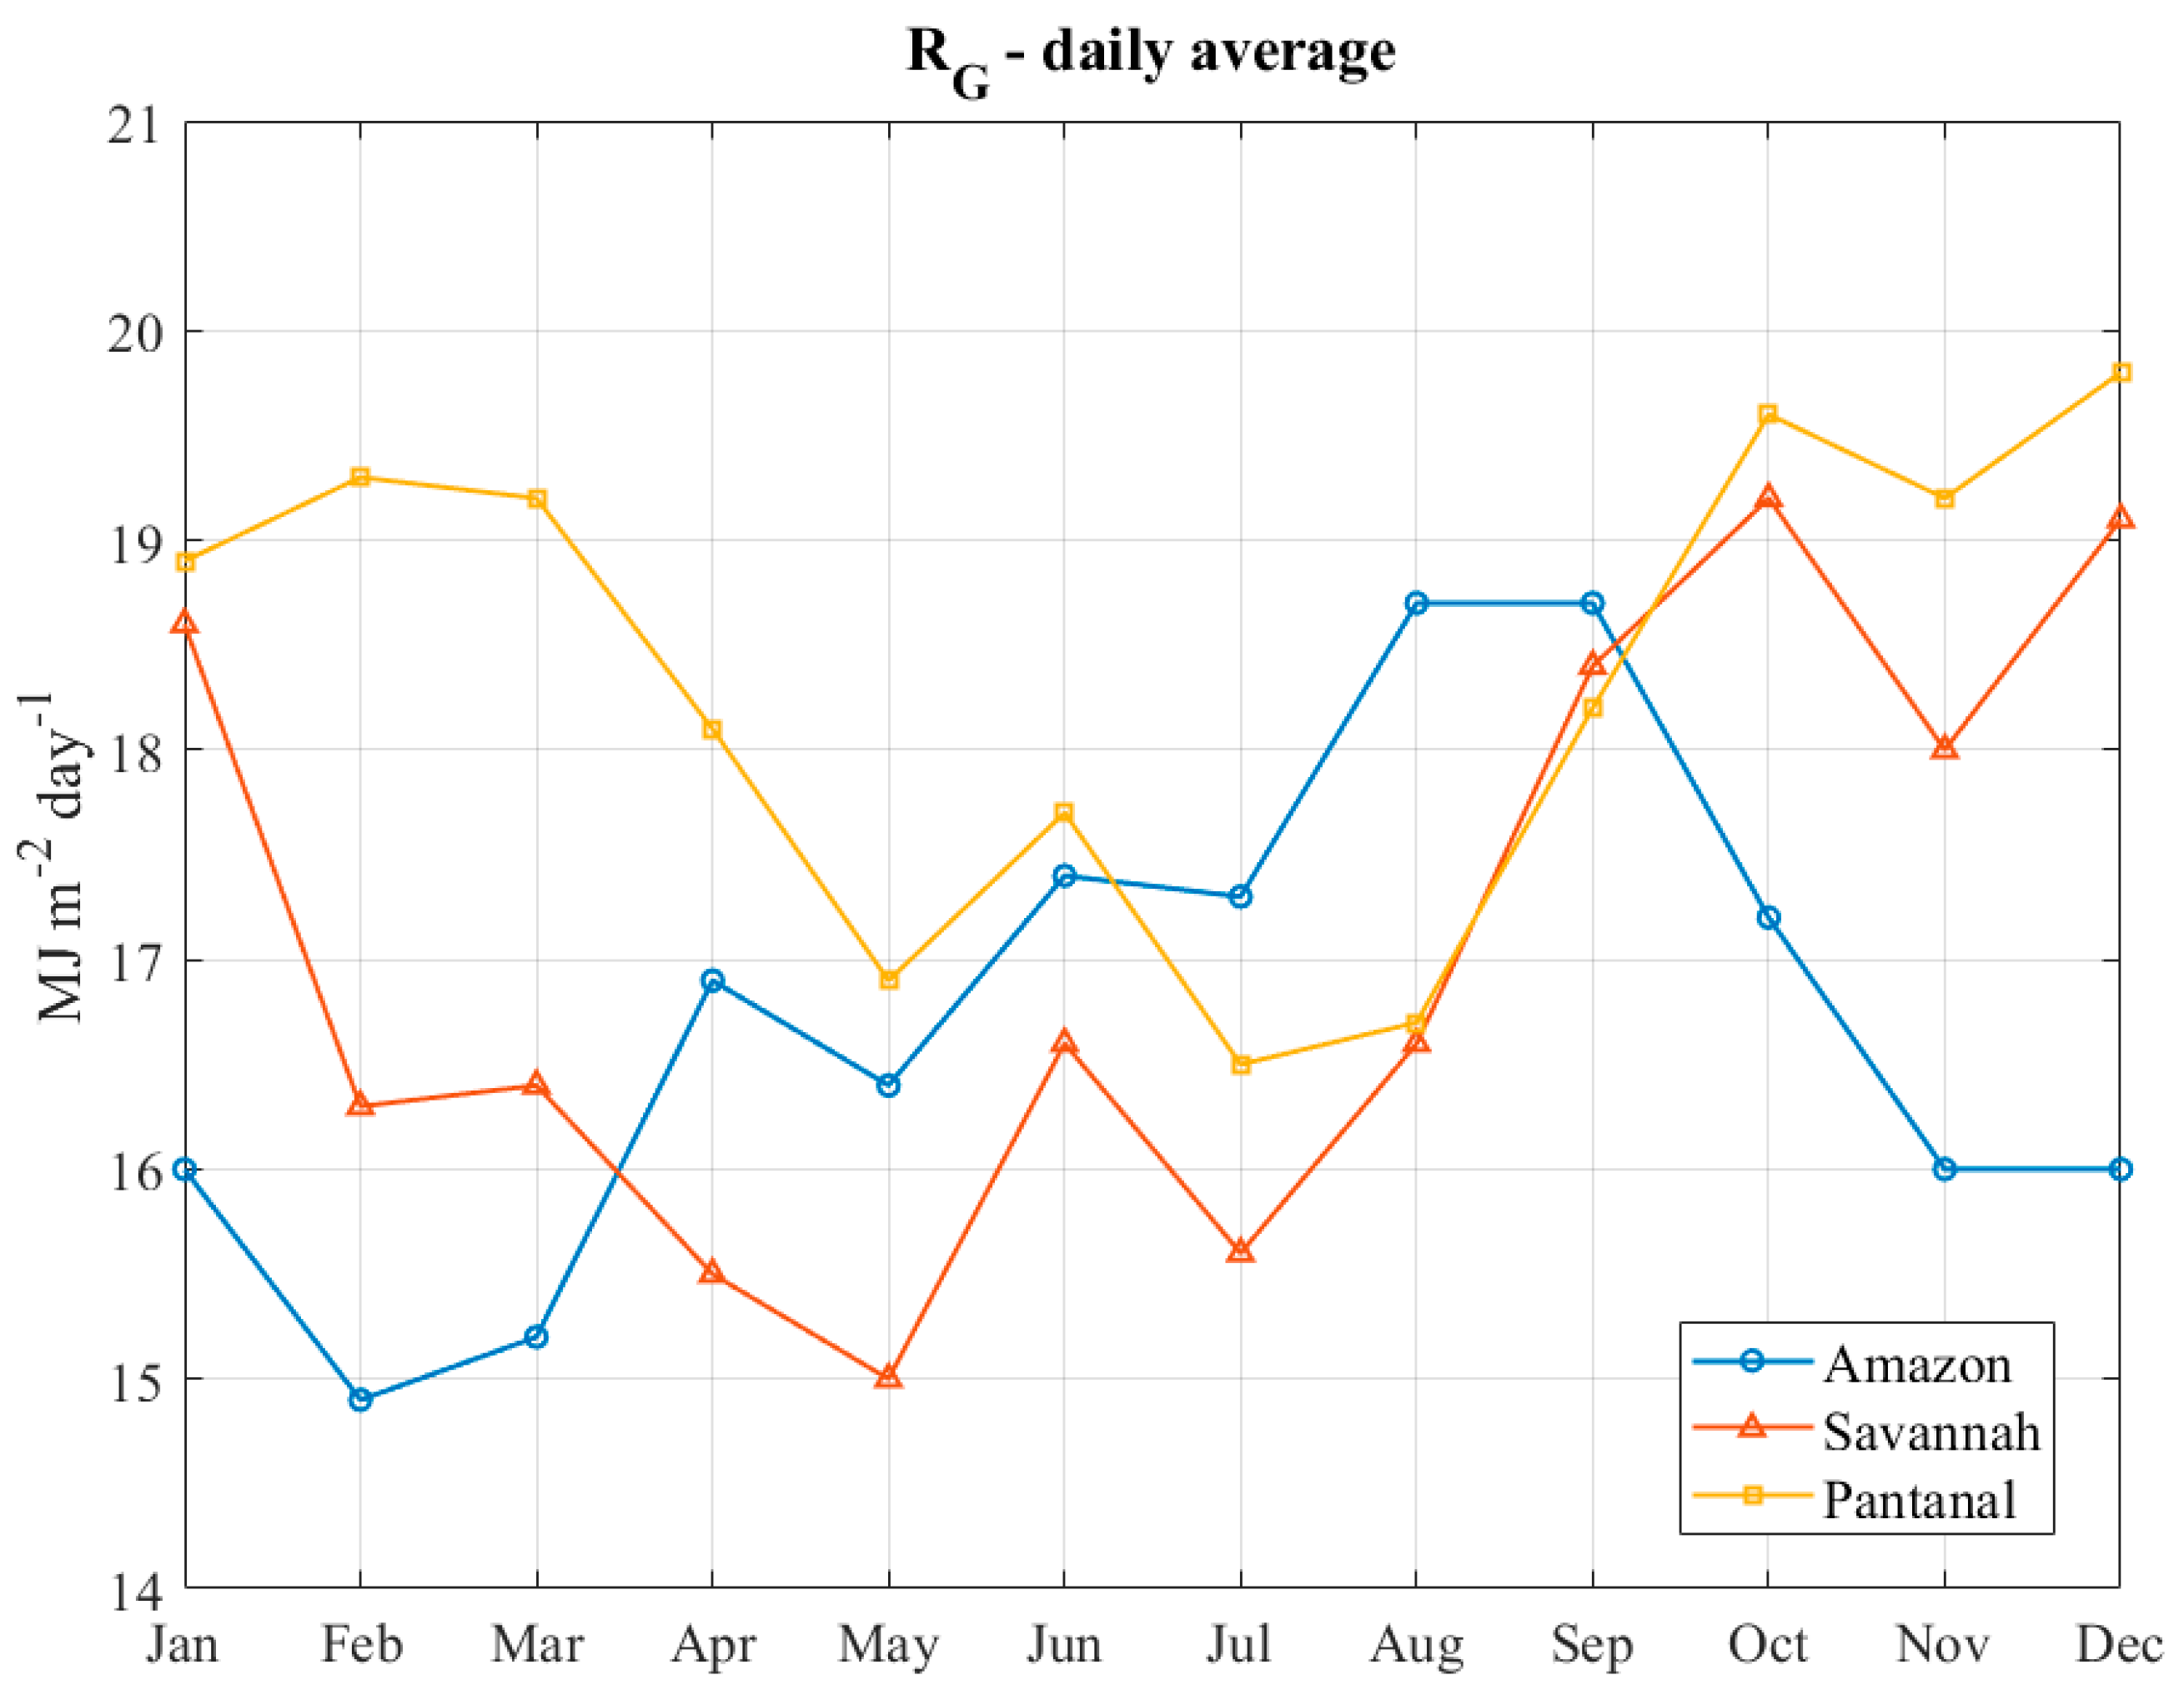
The data presented in Table 1 demonstrates the high performance of the ANN in estimating the daily average monthly GR for the state of Mato Grosso using ERA5 and R0 reanalysis data. The precision and accuracy of the adjusted model can also be qualitatively observed through a scatter plot of the observed and estimated GR values (Figure 3). The spatial and temporal distributions of GR in Mato Grosso from 1980 to 2019 were obtained using an adjusted model. The maps illustrating the historical average GR are shown in Figure 4. Analysis of the spatial distribution of GR from Figure 4, in conjunction with the biome averages presented in Figure 5, reveals that during spring and summer, from October to April, the highest GR in Mato Grosso occurred in the Pantanal biome, whereas the lowest was observed in the Amazon. During this period, the Brazilian savannah exhibited intermediate values between those of the two biomes. The average GR for the period from October to March ranged from 18.9 to 19.8, 16.3 to 19.2, and 14.9 to 17.2 MJ m−2 day−1 in the Pantanal, Brazilian savannah, and Amazon, respectively (Figure 4 and Figure 5).
GR remained highest in the Pantanal biome during autumn (April to June), with values ranging from 16.9 to 18.1 MJ m−2 day−1. However, the second highest values were recorded in the Amazon, ranging from 16.4 to 17.4 MJ m−2 day−1. During this period, the lowest values occurred in the Brazilian savannah areas, ranging from 15.0 to 16.6 MJ m−2 day−1 (Figure 5). In winter (July to September), the Amazon region of Mato Grosso exhibited the highest GR values, ranging from 17.3 to 18.7 MJ m−2 day−1. Notably, the values recorded during this period are the highest for the biome throughout the year, reaching a peak in August and September at 18.7 MJ m−2 day−1. In July, the second highest GR value occurred in the Pantanal at 16.5 MJ m−2 day−1, followed by the Brazilian savannah at 15.6 MJ m−2 day−1. In August and September, GR values in the Brazilian savannah and Pantanal were very similar, ranging from 16.6 to 18.4 MJ m−2 day−1 (Figure 5).
Analysis of Figure 5 reveals that in the Mato Grosso Amazon, the highest GR values occurred in August and September, whereas the lowest value was recorded in February. In the Brazilian savannah, the highest and lowest GR values were recorded in October and May, respectively. In the Pantanal, these periods corresponded to December and July. Figure 6 highlights the mean GR values estimated using the ANN model for the main agricultural production cities and the state capital, Cuiabá, as the region is characterized by notable grain production.

4. Discussion

Comparing the data from this study—obtained through ERA5 reanalysis and the ANN model—with the data presented in the Brazilian Solarimetric Atlas [23], general consistency was observed. However, the detailed spatialization achieved by the reanalysis grid was notably superior. Furthermore, this study considered a larger validation dataset derived from automatic weather stations. In addition to Tiba et al. [23], more recent studies have been conducted in the state of Mato Grosso, focusing on the measurement and estimation of GR. Souza et al. [24,25] and Zamadei et al. [26] are noteworthy among these studies. Both relied on point-based measurements without addressing the spatialization of GR for the study area, concentrating mainly on the Amazon region and the transition zone between the Brazilian savannah and the Amazon.
A general analysis comparing the results of this study with those presented by previous studies indicated that the ANN model estimates were consistent and did not notably differ. In this context, the spatialization results obtained through the ERA5 reanalysis grid proved to be a viable alternative for obtaining GR data at locations lacking monitoring stations, thus representing a novel approach for obtaining this meteorological element in the study area. Considering the challenges of meteorological monitoring in the study area, Souza et al. [25] evaluated the performance of simplified models for estimating GR in Mato Grosso. According to the authors, simplified versions of the models developed by Bristow and Campbell demonstrated superior statistical performance in estimating GR. The coefficient of determination (R2) values ranged from 0.60 to 0.75, indicating satisfactory results. The authors recommended using the Bristow and Campbell models for the Amazon and Brazilian savannah regions of Mato Grosso. In contrast, the model proposed by Goodin is specifically recommended for the Brazilian savannah.
The study mentioned above focused on using air temperature-based models to estimate GR, which requires the direct measurement of this meteorological element for specific estimations. Comparing the performance of the ANN obtained here (see Table 1) with the performance of the temperature-based equations analyzed by the authors, it was observed that the artificial intelligence model based on ERA5 data exhibited superior precision and accuracy. Additionally, this approach allows for the analysis of the spatial distribution of GR in the study area and its estimation at locations without meteorological monitoring stations. The data estimated here highlights the potential of GR on a horizontal surface in Mato Grosso, Brazil. This information can be used to plan photovoltaic plants, simulate crop growth, predict agricultural production, and improve understanding of the surface energy balance of different biomes in the state. Several studies show that climate change can alter GR and temperature and, consequently, agricultural and photovoltaic (PV) yields [27,28,29,30]. In China, Hua et al. [27] reported spatially heterogeneous responses under climate change scenarios, implying regional variability in PV production. In West Africa, Agbor et al. [28] reported small, seasonally dependent changes in global solar radiation and PV output under CMIP6 scenarios. This underscores the need for spatialized GR models, such as the one presented in this paper, that can resolve regional differences. As future work, GR should be evaluated under climate change scenarios to quantify potential shifts in the solar resource and associated uncertainties.

5. Conclusions

The results here demonstrate that utilizing ERA5 reanalysis data from the ECMWF as input for ANNs enables the successful retrieval of GR spatial and temporal distribution on a horizontal surface. This approach provides accurate and precise estimations of meteorological elements for locations that lack ground-based meteorological stations. However, further research should investigate the potential of other reanalysis products to estimate GR using data-driven models. Additionally, exploring the impact of climate change on this element is crucial. The findings of this study highlight the viability of reanalysis data for analyzing GR potential in applications such as photovoltaic power generation, surface radiation budget assessments, crop development simulations, and yield forecasting.

Author Contributions

Conceptualization, E.M.U. and M.R.Z.; methodology, E.M.U., J.d.A.A. and M.R.Z.; software, E.M.U. and M.F.d.S.J.; validation, M.R.Z., J.d.A.A. and U.R.V.A.; formal analysis, E.M.U.; investigation, E.M.U., M.F.d.S.J. and A.H.G.A.; resources, M.R.Z.; data curation, E.M.U. and J.d.A.A.; writing—original draft preparation, E.M.U. and J.d.A.A.; writing—review and editing, M.R.Z., H.A.R.F., U.R.V.A. and J.d.A.A.; visualization, E.M.U., H.A.R.F. and A.H.G.A.; supervision, M.R.Z.; project administration, M.R.Z.; funding acquisition, M.R.Z. All authors have read and agreed to the published version of the manuscript.

Funding

This research was supported by PROPESQ/UFMT Call n°. 03/2025 and by CAPES/UFMT, Grant n°. 88881.710476/2022-01.

Institutional Review Board Statement

Not applicable.

Informed Consent Statement

Not applicable.

Data Availability Statement

The datasets generated during and/or analyzed during the current study are available from the corresponding author on reasonable request.

Acknowledgments

The authors would like to thank the Institute of Agricultural and Environmental Sciences (ICAA) of the Federal University of Mato Grosso—Sinop Campus, for the institutional support and the infrastructure provided for the development of this work.

Conflicts of Interest

The authors declare no conflicts of interest. The funders had no role in the design of the study; in the collection, analyses, or interpretation of data; in the writing of the manuscript; or in the decision to publish the results.

Abbreviations

The following abbreviations are used in this manuscript:
AIArtificial Intelligence
ANNArtificial Neural Network
ERA5Fifth Generation ECMWF Reanalysis
GRGlobal Radiation

References

  1. Porfirio, A.C.; Ceballos, J.C.; Britto, J.M.; Costa, S.M. Evaluation of global solar irradiance estimates from GL1.2 satellite-based model over Brazil using an extended radiometric network. Remote Sens. 2020, 12, 1331. [Google Scholar] [CrossRef]
  2. Pereira, S.; Canhoto, P.; Salgado, R.; Costa, M.J. Development of an ANN based corrective algorithm of the operational ECMWF global horizontal irradiation forecasts. Sol. Energy 2019, 185, 387–405. [Google Scholar] [CrossRef]
  3. Neher, I.; Crewell, S.; Meilinger, S.; Pfeifroth, U.; Trentmann, J. Photovoltaic power potential in West Africa using long-term satellite data. Atmos. Chem. Phys. 2020, 20, 12871–12888. [Google Scholar] [CrossRef]
  4. Madhiarasan, M.; Louzazni, M.; Belmahdi, B. Statistical analysis of novel ensemble recursive radial basis function neural network performance on global solar irradiance forecasting. J. Electr. Comput. Eng. 2023, 2023, 2554355. [Google Scholar] [CrossRef]
  5. Jiang, H.; Lu, N.; Yao, L.; Qin, J.; Liu, T. Impact of climate changes on the stability of solar energy: Evidence from observations and reanalysis. Renew. Energy 2023, 208, 726–736. [Google Scholar] [CrossRef]
  6. Sawadogo, W.; Bliefernicht, J.; Fersch, B.; Salack, S.; Guug, S.; Diallo, B.; Ogunjobi, K.O.; Nakoulma, G.; Tanu, M.; Meilinger, S.; et al. Hourly global horizontal irradiance over West Africa: A case study of one-year satellite- and reanalysis-derived estimates vs. in situ measurements. Renew. Energy 2023, 216, 119066. [Google Scholar] [CrossRef]
  7. Paletta, Q.; Terrén-Serrano, G.; Nie, Y.; Li, B.; Bieker, J.; Zhang, W.; Dubus, L.; Dev, S.; Feng, C. Advances in solar forecasting: Computer vision with deep learning. Adv. Appl. Energy 2023, 11, 100150. [Google Scholar] [CrossRef]
  8. Azizi, N.; Yaghoubirad, M.; Farajollahi, M.; Ahmadi, A. Deep learning based long-term global solar irradiance and temperature forecasting using time series with multi-step multivariate output. Renew. Energy 2023, 206, 135–147. [Google Scholar] [CrossRef]
  9. Shao, C.; Yang, K.; Tang, W.; He, Y.; Jiang, Y.; Lu, H.; Fu, H.; Zheng, J. Convolutional neural network-based homogenization for constructing a long-term global surface solar radiation dataset. Renew. Sustain. Energy Rev. 2022, 169, 112952. [Google Scholar] [CrossRef]
  10. Nielsen, A.H.; Iosifidis, A.; Karstoft, H. IrradianceNet: Spatiotemporal deep learning model for satellite-derived solar irradiance short-term forecasting. Sol. Energy 2021, 228, 659–669. [Google Scholar] [CrossRef]
  11. Aljanad, A.; Tan, N.M.; Agelidis, V.G.; Shareef, H. Neural network approach for global solar irradiance prediction at extremely short-time-intervals using particle swarm optimization algorithm. Energies 2021, 14, 1213. [Google Scholar] [CrossRef]
  12. Babar, B.; Luppino, L.T.; Boström, T.; Anfinsen, S.N. Random forest regression for improved mapping of solar irradiance at high latitudes. Sol. Energy 2020, 198, 81–92. [Google Scholar] [CrossRef]
  13. Chen, W.; Li, D.H.; Li, S.; Lam, J.C. Estimating hourly global solar irradiance using artificial neural networks–A case study of Hong Kong. IOP Conf. Ser. Mater. Sci. Eng. 2019, 556, 012043. [Google Scholar] [CrossRef]
  14. Sharma, A.; Kakkar, A. Forecasting daily global solar irradiance generation using machine learning. Renew. Sustain. Energy Rev. 2018, 82, 2254–2269. [Google Scholar] [CrossRef]
  15. Fang, W.; Yang, C.; Liu, D.; Huang, Q.; Ming, B.; Cheng, L.; Wang, L.; Feng, G.; Shang, J. Assessment of wind and solar power potential and their temporal complementarity in China’s Northwestern Provinces: Insights from ERA5 Reanalysis. Energies 2023, 16, 7109. [Google Scholar] [CrossRef]
  16. Copernicus Climate Change Service. ERA5: Fifth Generation of ECMWF Atmospheric Reanalyses of the Global Climate. Copernicus Climate Data Store. 2017. Available online: https://cds.climate.copernicus.eu/datasets/reanalysis-era5-single-levels?tab=overview (accessed on 10 January 2023).
  17. Wu, Q. geemap: A Python package for interactive mapping with Google Earth Engine. J. Open Source Softw. 2020, 5, 2305. [Google Scholar] [CrossRef]
  18. Gorelick, N.; Hancher, M.; Dixon, M.; Ilyushchenko, S.; Thau, D.; Moore, R. Google Earth Engine: Planetary-scale geospatial analysis for everyone. Remote Sens. Environ. 2017, 202, 18–27. [Google Scholar] [CrossRef]
  19. Uliana, E.M.; Aires, U.R.V.; de Sousa Junior, M.F.; da Silva, D.D.; Moreira, M.C.; da Cruz, I.F.; Araujo, H.B. Estimated evaporation of lakes by climate reanalysis data and artificial neural networks. J. S. Am. Earth Sci. 2024, 136, 104811. [Google Scholar] [CrossRef]
  20. Sousa Junior, M.F.; Uliana, E.M.; Aires, U.R.V.; Rápalo, L.M.C.; da Silva, D.D.; Moreira, M.C.; da Silva Rondon, D. Streamflow prediction based on machine learning models and rainfall estimated by remote sensing in the Brazilian Savanna and Amazon biomes transition. Model. Earth Syst. Environ. 2024, 10, 1191–1202. [Google Scholar] [CrossRef]
  21. Duan, Q.; Sorooshian, S.; Gupta, V.K. Effective and efficient global optimization for conceptual rainfall-runoff models. Water Resour. Res. 1992, 28, 1015–1031. [Google Scholar] [CrossRef]
  22. Rápalo, L.M.C.; Uliana, E.M.; Moreira, M.C.; da Silva, D.D.; de Melo Ribeiro, C.B.; da Cruz, I.F.; dos Reis Pereira, D. Effects of land-use and -cover changes on streamflow regime in the Brazilian Savannah. J. Hydrol. Reg. Stud. 2021, 38, 100934. [Google Scholar] [CrossRef]
  23. Tiba, C.; Fraidenraich, N.; Lyra, F.J.M.; Nogueira, A.M.B. Atlas Solarimétrico do Brasil: Banco de Dados Terrestres; Editora Universitária da UFPE: Recife, Brazil, 2000; p. 32. [Google Scholar]
  24. Souza, A.P.; Zamadei, T.; Monteiro, E.B.; Casavecchia, B.H. Transmissividade atmosférica da radiação global na região amazônica de Mato Grosso. Rev. Bras. Meteorol. 2016, 31, 639–648. [Google Scholar] [CrossRef]
  25. Souza, A.P.; Silva, A.C.; Tanaka, A.A.; Uliana, E.M.; Almeida, F.T.; Klar, A.E.; Gomes, A.W.A. Global radiation by simplified models for the state of Mato Grosso, Brazil. Pesqui. Agropecu. Bras. 2017, 52, 215–227. [Google Scholar] [CrossRef]
  26. Zamadei, T.; Souza, A.P.; Almeida, F.T.; Escobedo, J.F. Daily global and diffuse radiation in the Brazilian Cerrado–Amazon transition region. Rev. Ciênc. Nat. 2021, 43, 39775. [Google Scholar] [CrossRef]
  27. Hua, Y.; Wei, M.; Yuan, J.; He, W.; Chen, L.; Gao, Y. The Impact of Climate Change on Solar Radiation and Photovoltaic Energy Yields in China. Atmosphere 2024, 15, 939. [Google Scholar] [CrossRef]
  28. Agbor, M.E.; Udo, S.O.; Ewona, I.O.; Nwokolo, S.C.; Ogbulezie, J.C.; Amadi, S.O. Potential impacts of climate change on global solar radiation and PV output using the CMIP6 model in West Africa. Clean. Eng. Technol. 2023, 13, 100630. [Google Scholar] [CrossRef]
  29. Jiang, R.; He, W.; He, L.; Yang, J.Y.; Qian, B.; Zhou, W.; He, P. Modelling adaptation strategies to reduce adverse impacts of climate change on maize cropping system in Northeast China. Sci. Rep. 2021, 11, 810. [Google Scholar] [CrossRef]
  30. Han, X.; Roy, A.; Moghaddasi, P.; Moftakhari, H.; Magliocca, N.; Mekonnen, M.; Moradkhani, H. Assessment of climate change impact on rainfed corn yield with adaptation measures in Deep South, US. Agric. Ecosyst. Environ. 2024, 376, 109230. [Google Scholar] [CrossRef]
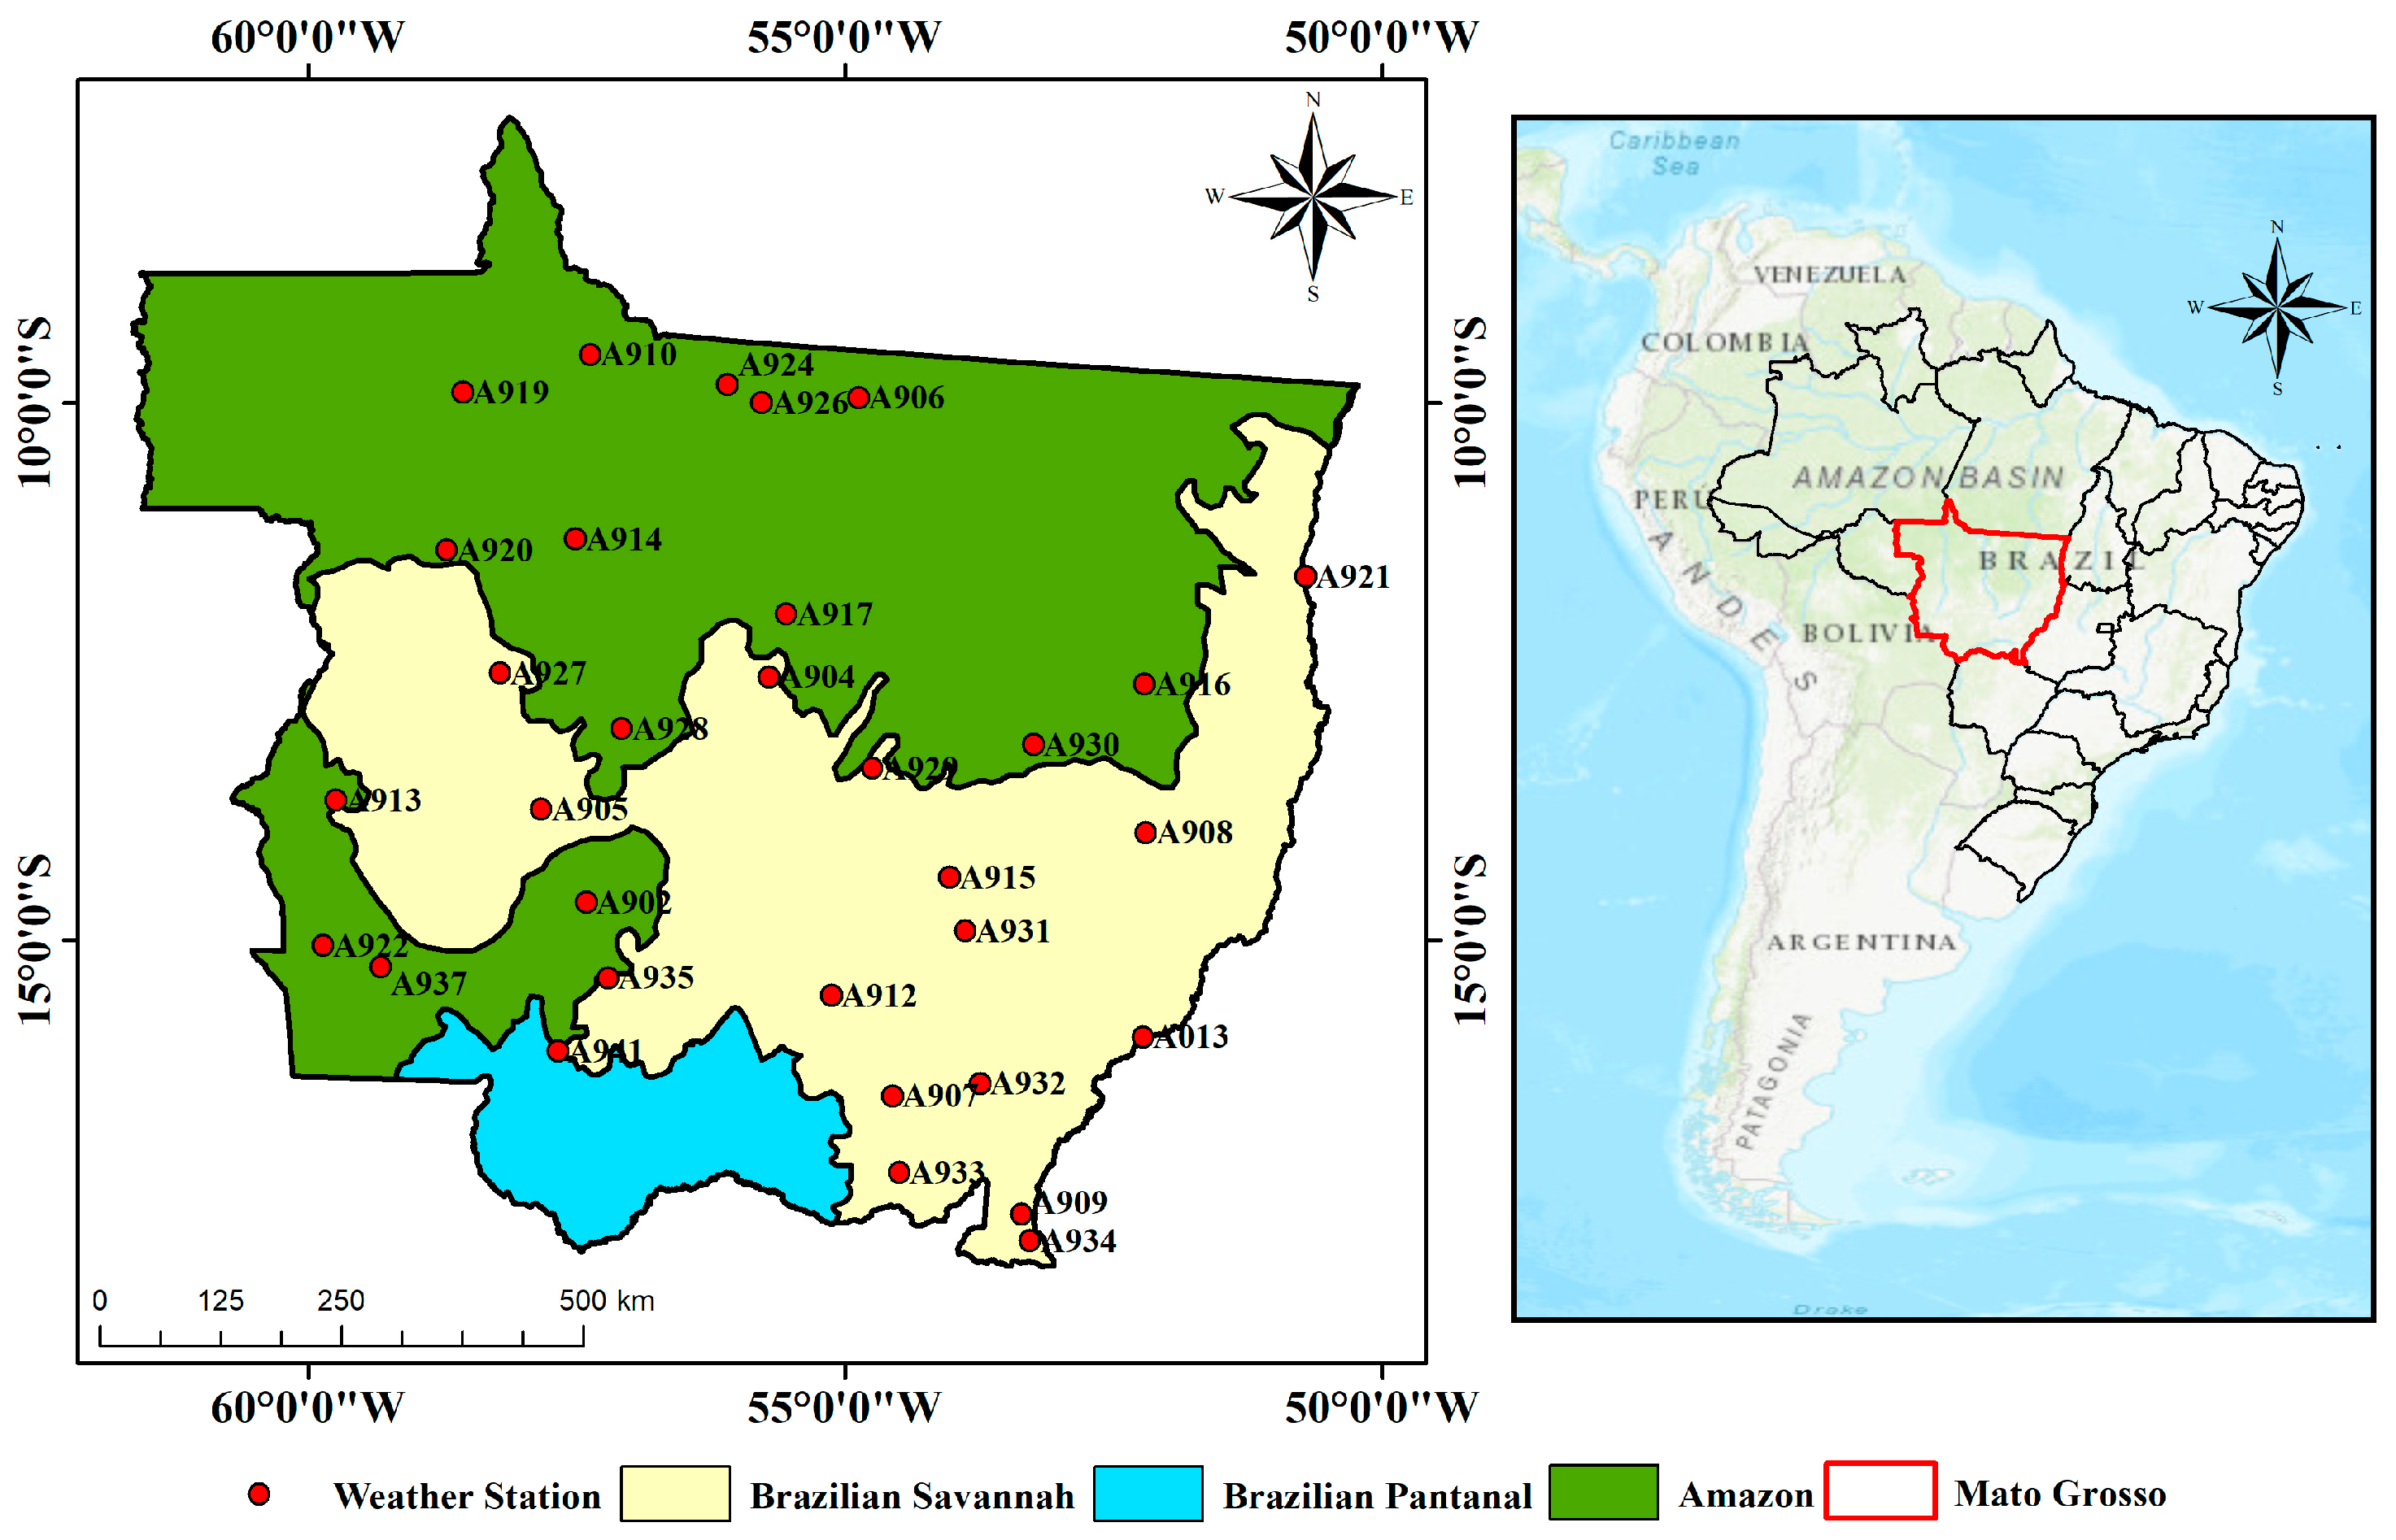
Figure 1. Location of automatic weather stations and biomes in Mato Grosso State.
Atmosphere 16 01306 g001
Figure 2. Architectural representation of the multilayer perceptron-type ANN employed.
Atmosphere 16 01306 g002
Figure 3. Scatter plot of daily average monthly GR (MJ m−2 day−1) observed at automatic weather stations in the State of Mato Grosso, Brazil, estimated using an artificial neural network model. This model used ERA5 reanalysis data of air temperature and precipitation, along with top-of-atmosphere solar radiation (R0), as input parameters.
Atmosphere 16 01306 g003
Figure 4. Spatial distribution of monthly average daily GR (MJ m−2 day−1) (1980–2019) on a horizontal surface at ground level in the state of Mato Grosso, estimated using the ANN model.
Atmosphere 16 01306 g004
Figure 5. Monthly average daily GR (1980–2019), estimated with the ANN model for the biomes of Mato Grosso State.
Atmosphere 16 01306 g005
Figure 6. Monthly average daily GR (1980–2019) for the capital and main grain-producing cities in Mato Grosso State, Brazil.
Atmosphere 16 01306 g006
Table 1. Artificial neural network architectures and statistical error metrics for estimating monthly mean daily GR on a horizontal surface at ground level in MJ m−2 day−1.
InputFunctionN1N2N3StageMAERMSERRMSEBiasEnsEkg
Tmax; Tmin; Tmed; Prc; R0tansig; tansig; purelin451Training0.0140.0260.00140.00020.99960.9993
Test0.0150.0270.00140.00280.99960.9990
Tmax, Tmin, and Tmed are the monthly average maximum, minimum, and mean temperatures (Era5), respectively (°C); Prc is the total monthly precipitation from the Era5 reanalysis (mm); R0 is the top-of-atmosphere solar radiation, monthly total (MJ m−2); N1, N2, and N3 represent the number of artificial neurons in the two hidden layers and in the output layer, respectively; and tansig and purelin are the hyperbolic tangent sigmoid and linear transfer functions, respectively. MAE: mean absolute error (MJ m−2 day−1); RMSE: root mean square error (MJ m−2 day−1); Bias: MJ m−2 day−1, Ens: Nash–Sutcliffe efficiency index, and Ekg: Kling–Gupta efficiency index.
Disclaimer/Publisher’s Note: The statements, opinions and data contained in all publications are solely those of the individual author(s) and contributor(s) and not of MDPI and/or the editor(s). MDPI and/or the editor(s) disclaim responsibility for any injury to people or property resulting from any ideas, methods, instructions or products referred to in the content.