Abstract
Planetary boundary layer (PBL) flow over complex terrain during a cold surge event was investigated using 3-hourly radiosonde measurements in upwind, near ridge, and downwind locations of mountains in the northeastern part of Republic of Korea and using a high-resolution (333-m) numerical simulation. A cold surge occurred on 23 January 2018 and lasted for 4 days. We analyzed onset day of the cold surge when air temperature dropped rapidly. Analysis of the radiosonde data shows that the PBL was characterized by an adiabatic layer with strong capping inversion in early morning and evening as well as during daytime in the upwind and near-ridge sites. The PBL flow at the near-ridge site was strongest among three sites except at 0600 local standard time (LST) when the PBL flow in the lee was strongest. We performed high-resolution (333-m) numerical simulations using the Weather Research and Forecasting (WRF) model. The adiabatic PBL in the upwind site at 0600 LST was simulated, although its depth was underestimated. The model reproduced the strong low-level wind at 0600 LST and large wind shear during the daytime in the lee, but it did not capture the exact timing of the large wind shear. The model showed overall good performance in simulating the vertical profile of the virtual potential temperature and wind below 2 km above ground level at the three sites, with a high index of agreement (IOA) except for the wind at 1200 and 1500 LST in the lee. To examine the cause for the different behavior of PBL flow in the lee of mountains between 0600 LST and the daytime, we calculated the Froude number for PBL flow using radiosonde measurements based on reduced gravity shallow water (RGSW) theory. At 0600 LST, the upwind Froude number F0 was close to 1, while during the daytime, it was much lower than 1. The observed lee flow behavior was consistent with the flow regime change of a single layer over an obstacle with changing F0; the flow with a propagating lee jump changes into that with a stationary lee jump with decreasing F0. Numerical simulation shows that the steepening of streamlines of lee-wave field leads to a jump-like structure in the lee of mountains during the daytime.
1. Introduction
The planetary boundary layer (PBL) is the lower part of the troposphere where we spend most of our lives. Most of air pollutants are emitted and transported within the PBL, and hence accurate predictions of PBL flow and structure are important for forecasting air quality in the PBL. Recently, as urban air mobility has emerged as a new transportation mode, demand for a more accurate prediction of PBL flows is increasing. Most of the earth’s surface is not flat, and mountains modify the PBL flow. Many observational, analytical, and modeling studies have been performed to examine the atmospheric flows over mountains [1,2,3,4]. In complex terrain, flow behaviors over mountains depend on the stability of the upwind flow; upwind flow with a low Froude number induces lee waves, while a neutral flow leads to a wake zone in the lee of mountains. On the other hand, when a mixed layer with a strong capping inversion flows over a mountain, downslope wind accompanied by a hydraulic jump can occur in the lee [5]. Such PBL flow with a strong capping inversion has been examined using the reduced gravity shallow water (RGSW) theory [6] by several studies [7,8,9]. Pettre [7] showed that the dynamics of the Mistral could be described in the framework of the RGSW theory and Drobinski et al. [8] used RGSW theory to diagnose the presence of a hydraulic jump at the top of the marine atmospheric boundary layer in the exit region of coastal mountain gaps. The modified Froude number was also suggested to diagnose the occurrence of downslope windstorms in the lee of mountains for a mixed-layer with a capping inversion [5], but only a few observational studies have been reported on the mixed layer flow with a capping inversion in the lee of mountains.
Cold surge is one of the extreme winter weathers, characterized by a rapid decrease in the air temperature and dew point and a rapid increase in the surface pressure. Changes in the strength and occurrence frequency of cold surges are important themes in current climatological research. The mechanisms of a cold surge and its variability with global warming have been extensively studied, which revealed that cold surges are strongly linked to external forcing, like Arctic oscillation and ENSO etc. [10,11,12]. However, the meso- and micro-scale features of a cold surge event have been scarcely examined. Lu et al. [13] examined the physical and circulatory features of a cold surge event in complex terrain using a high-resolution model. They showed that the cold surge flows were blocked and lifted by the mountain on its windward side, which increased the vertical extent of the cold surge upward and increased northwestward tilting in the vertical structure. A cold surge is a shallow density current; thus, occurrence of a cold surge modifies PBL structure, such as capping inversion height, and its strength, and it influences PBL flow in complex terrain. However, relatively few studies have been performed on thermal and flow structure of PBL in complex terrain during a cold surge event.
The 2018 Olympic Winter games were hosted in PyeongChang, South Korea, located in the Taebaek Mountainous (TM) region. An International Collaborative Experiment for PyeongChang Olympic and Paralympics 2018 (ICE–POP 2018) was conducted to provide the ground-based instruments for forecasting and researching various winter weathers over the complex terrain [14,15]. During the intensive observation period (IOP), radiosonde measurements were taken every 3 h at several sites in the TM region, providing a good opportunity to understand the flow structure in the complex terrain during a cold surge event.
There have been several studies on the flows in the eastern part of the TM region [16,17,18]. Most studies examined the characteristics and generation mechanisms of severe windstorms using high-resolution simulations. Jang and Chun [16] found that severe downslope windstorms on 5 April 2005 were due to reflection of the mountain waves from a critical level and hydraulic jump using the Weather Research and Forecasting (WRF) model. Lee et al. [17] demonstrated that the characteristics and generation mechanism of windstorms differ depending on local topographic features using WRF model simulation. Model evaluation in complex terrain was performed using mostly surface observations [16,17]. Few boundary layer measurements have been used for model evaluation in the TM region.
In this study, we examine the observed characteristics of PBL flow and thermal structure in the TM region during a cold surge event and interpret the observed features using RGSW theory and a high-resolution numerical simulation. In addition, we evaluate model performance to simulate the PBL structure over complex terrain against boundary-layer measurements.
2. Materials and Methods
2.1. Data
The ICE-POP 2018 field campaign was conducted to provide ground-based measurements for forecasting and researching various winter weathers over the complex terrain in the TM region [14,15]. During IOP, radiosonde measurements were taken every 3 h at several sites. In this study, we used the 3-hourly radiosonde measurements obtained at MOO, DGW, and BKC sites on the cold surge onset day during IOP. The study area is located in the mountainous area facing the East Sea to the east. Figure 1 shows the topography and land use of the study area with radiosonde measurement sites. Topography is not an idealized pattern; several ridges with different heights and valleys exist in the study area. The dominant land use in inland area is forest. The DGW site (37°40′24″ N, 128°43′7″ E, 772 m above sea level (ASL)) is located in the mountain pass with higher ridges to the south and north. The MOO site (37°33′43″ N, 128°22′39″ E, 533 m ASL) is located to the west of the DGW site, and its elevation is lower than the surrounding area. The BKC site (37°44′18″ N, 128°48′21″ E, 175 m ASL) is located in the downslope of the mountain and to the east of the DGW site (Figure 1). For westerly flows, the MOO and BKC sites represent the upwind and downwind areas of the DGW site, respectively. Specifications of the radiosonde equipment (M10, Meteomodem, Ury, France) are displayed in Table 1. We also used hourly surface meteorological variables from Automated Synoptic Observing System (ASOS) stations at Bukgangneng (BGN, 37°48′17″ N, 128°51′19″ E, 75.23 m ASL) and DGW. The instruments of ASOS satisfy standard specifications; thermistors and anemometers of ASOS have accuracies of <0.3 K and <0.5 m s−1, respectively.
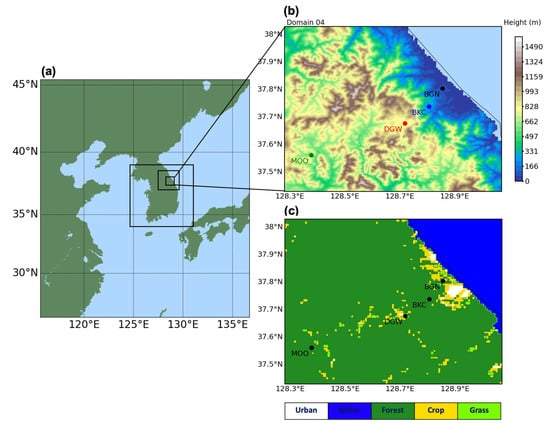
Figure 1.
(a) Model domain configuration, (b) topography and (c) land use type in domain 4. Radiosonde sites and ASOS stations are marked by dots in (b,c).

Table 1.
Specification of radiosonde (M10).
2.2. Model
The model used in this study is the WRF Model (Version 4.3.3; [19]), a fully compressible non-hydrostatic atmospheric model. The domain configuration consists of four two-way nested grids (Figure 1). The horizontal grid spacing is 9 km in domain 1 (240 × 240), 3 km in domain 2 (181 × 181), 1 km in domain 3 (181 × 163), and 0.333 km in domain 4 (211 × 211). There are 68 vertical levels defined on the terrain-following sigma coordinate, and the top of the model is at 50 hPa. The model physics used in this study are as follows. The PBL parameterization scheme of Shin and Hong [20] was used for PBL processes to cover gray zone resolution, and the Noah land surface model [21] was used for land surface processes. The longwave Rapid Radiation Transfer Model [22] and shortwave Dudhia scheme [23] were used for the radiation processes.
For the initial and boundary conditions of the model, we used the ERA5 data [24]. The land cover data used are 30-arc second data for the Asian region [25]. The topography data used in this study are the USGS 30-arc second data for domains 1 and 2 and the Shuttle Radar Topography Mission (SRTM) 3-arc second data [26] for domains 3 and 4, respectively.
A cold surge onset occurred on 23 January 2018 during ICE–POP. We performed the model simulation for the study day with 15-h spin-up time. Simulation started from 0000 UTC on 22 January.
2.3. Evaluation
To evaluate the model performance, we used root-mean-squared error (RMSE), mean bias error (MBE), and the index of agreement (IOA) [27], which are given by:
where Oi and Pi are the observed and modeled values of variables, respectively, and the subscript i refers to different vertical levels or time; n is the number of data, and the overbar indicates the mean of the variable.
For the evaluation of wind vector, we calculated RMSEu,v and IOAu,v given by:
Evaluation statistics were calculated for time series of near-surface meteorological variables and vertical profile of virtual potential temperature and wind. The radiosonde measurement data have higher vertical resolution than model vertical levels. For the calculation of evaluation statistics, we used measurement data at the height nearest to model vertical levels.
2.4. Froude Number
Mixed layer flow with a strong capping inversion is disconnected from the flow aloft. Several studies [8,9] have applied the RGSW theory to the mixed layer flow with a strong capping inversion. In the RGSW theory, the Froude number (F) is calculated as:
where and are the mean wind speed and potential temperature within the mixed layer, respectively; is the strength of the temperature inversion at the mixed layer top; D is mixed layer depth; and g is the gravitational acceleration.
According to Drobinski et al. [8], is calculated as:
where is the potential temperature at in free atmosphere, is the mean potential temperature of the mixed layer, is the lapse rate of free atmosphere, and is the mixed layer height (h = D + e, where e is terrain height). We used 4.5 km for and calculated between 2.5 km and 4.5 km.
A strong capping inversion is located at the top of the mixed layer. Therefore, we calculated the mixed-layer height as the strong inversion height (SIH) where the Brunt–Vaisala frequency, N, is the maximum below 3 km ASL:
3. Results and Discussion
3.1. General Meteorological Conditions on 23 January 2018
Figure 2 shows the time series of the 1.5-m air temperature, sea-level pressure, and 10-m wind speed measured at the BGN station from 23 to 27 January 2018. Air temperature decreased by about 10 °C and sea-level pressure increased by about 10 hPa during 24 h on 23 January, indicating the onset of a cold surge. The cold surge started on 23 January and lasted for 4 days. On 27 January, the air temperature increased, and sea-level pressure decreased, indicating the end of the cold surge. Strong wind speeds occurred on the first two days of the cold surge event. In this study, we selected the first day of the cold surge event as study case. On the study day, the sky was clear with no clouds.
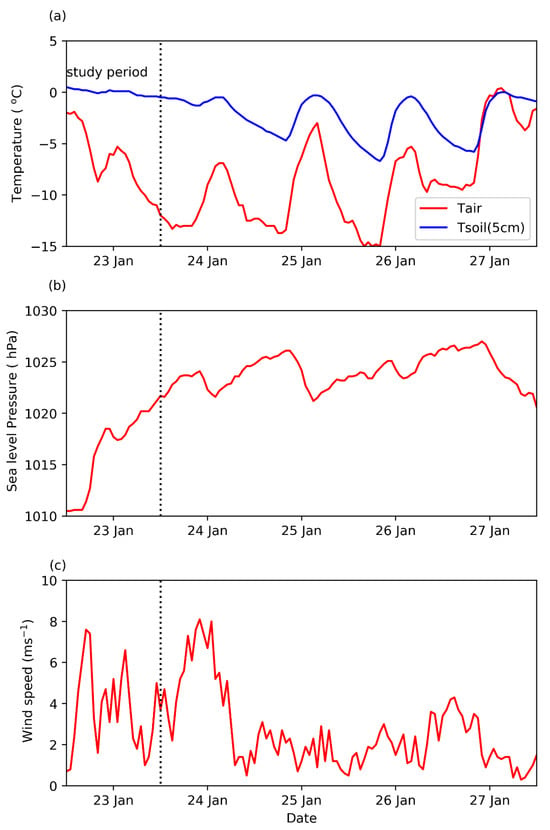
Figure 2.
The time series of (a) 1.5-m air temperature and soil temperature at 5 cm depth, (b) sea-level pressure and (c) 10-m wind speed at BGN station from 23 to 27 January 2018. The dotted line indicates the end of study period.
The surface, 850-hPa, 500-hPa, and 300-hPa weather charts at 0000 UTC on 23 January are shown in Figure 3. The surface weather chart shows that the Siberian high expands toward the Korean Peninsula, and a low-pressure system develops in the East Sea, which leads to the close packing of the isobar and hence high wind speed near the surface over the Korean Peninsula. Such a synoptic pattern draws the lower tropospheric air from the inland to the eastern coast, leading to downslope wind in the lee area of coastal mountains. The 850-hPa weather chart shows strong baroclinicity over the Korean Peninsula. The northwesterly flow blows crossing isothermal lines, leading to strong cold advection. Therefore, the low-level cold advection produces a strong inversion around 850 hPa. The low-pressure system at 500 hPa lies to the west of the surface low-pressure system, and wind backs from northwesterly at the surface to westerly at 500 hPa, indicating intense cold advection below 500 hPa. Since the westerly wind speed increases with height over the Korean Peninsula, there is no critical level where the cross-mountain flow component (westerly) becomes zero.
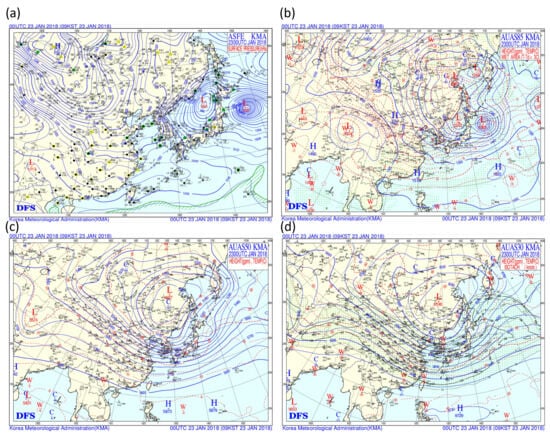
Figure 3.
(a) Surface, (b) 850-hPa, (c) 500-hPa, and (d) 300-hPa weather chart at 0000 UTC on 23 January 2018 (Source: Korean Meteorological Administration).
3.2. Near-Surface Air Temperature and Wind
In this section, we examine model performance in simulating the near-surface variables in the study area. Figure 4 compares 2-m air temperature and 10-m wind speed and direction between simulation and observation at the DGW and BGN stations. The diurnal variation in air temperature is well simulated, showing low RMSE and high IOA at both stations (Table 2). Stronger wind speeds at DGW than at BGN are well captured; however, the wind speed at both stations is overestimated and its temporal variability is not well captured at the BGN station, in particular, which is located at the foot of mountains (Table 2). Both observed and simulated wind speeds at the BGN station show large fluctuations, indicating that the model simulates the large variability in wind speeds, but does not capture the timing of strong winds. Wind directions at both stations are westerly, which is well captured in the simulation.
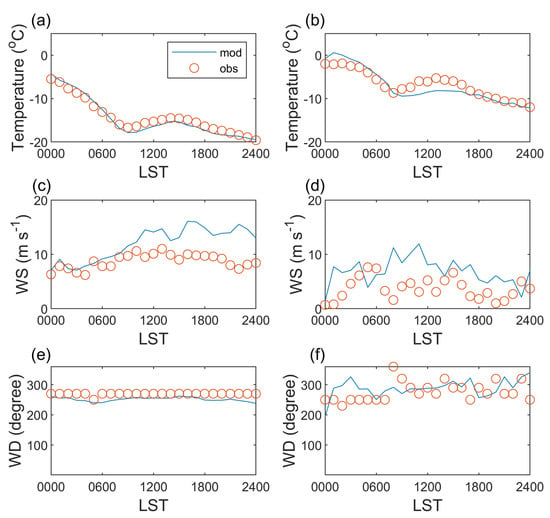
Figure 4.
Comparison of 2-m air temperature (a,b), 10-m wind speed (c,d) and 10-m wind direction (e,f) at the DGW (a,c,e) and BGN stations (b,d,f).

Table 2.
Model evaluation statistics for near-surface variables at DGW and BGN stations.
To understand the observed near-surface wind in the complex terrain, we analyzed the horizontal distributions of simulated 10-m wind, and 2-m air temperature at 0600 and 1500 local standard time (LST) in domain 3 (Figure 5a,c). The inner box in Figure 5a,c indicates the study area (domain 4). Cold air is found over the elevated interior of the inland, and the temperature on the ocean side is moderated by the open ocean, resulting in a regional pressure gradient across the coastal mountain range [28]. Over the ocean and upwind flat terrain, near-surface winds are northwesterly, but over the mountainous area, westerly winds are noted. On the study day, a synoptic-scale pressure gradient was superimposed on the regionally developed pressure gradient, providing favorable conditions for strong westerly gap flow in the mountainous area. The influence of regional pressure gradient force on the near-surface wind was stronger at 0600 LST when the downward transfer of momentum from winds aloft was weak.
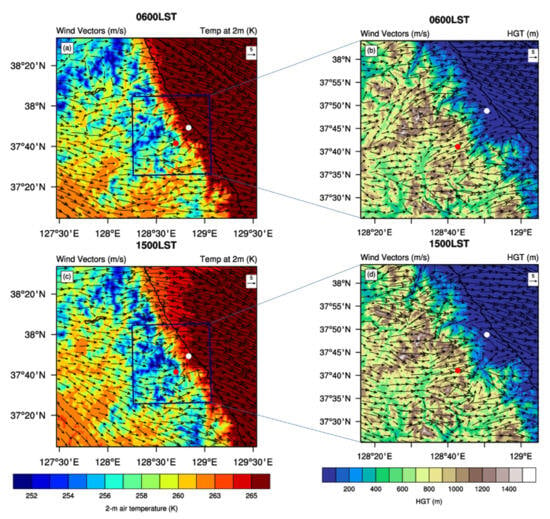
Figure 5.
Horizontal distribution of the simulated 10-m wind, and 2-m air temperature in domain 3 (a,c), and simulated 10-m and terrain height in domain 4 (b,d) at 0600 (a,b) and 1500 LST (c,d) on 23 January 2018. Blue box denotes domain 4 and red and white dots denotes the location of DGW and BGN stations, respectively.
To examine the flow in the study area in detail, we analyzed the horizontal distribution of simulated 10-m wind vectors with a terrain height in domain 4 (Figure 5b,d). At 0600 LST, along-valley flow and weak wind are shown in the valley and basin, whereas westerly flows occur near the ridge area. The valley flow is decoupled from the flow above the valley because of the suppressed vertical exchange of air between the valley and above the valley and the sheltering effect of the surrounding ridge [28]. In contrast, at 1500 LST, westerly winds blow at both valley and ridge levels due to the active vertical exchange of air between valley and ridge levels. Note that westerly winds near the DGN station (located at the mountain pass) are more intense at 1500 LST than at 0600 LST. When stable air is forced to flow over the pass, mountain waves often form, and air in the wave is not accelerated over the pass except for the resonant growth of nonlinear mountain waves. In contrast, when the mixed-layer flow with a capping inversion is forced to flow over the pass, the air is accelerated over the ridge due to the Bernoulli effect, which explains stronger westerly flows over the pass at 1500 LST than at 0600 LST.
3.3. Vertical Structure
In this section, we examine the temporal evolution of the vertical structure of virtual potential temperature and wind at upwind (MOO), near-ridge (DGW), and downwind (BKC) sites (Figure 1) on the onset day of cold surge. Figure 6 shows the vertical profiles of the observed and simulated virtual potential temperature at 3-hourly intervals from 0600 LST to 2100 LST at the MOO, DGW, and BKC sites. One thing to note in Figure 6 is a nearly adiabatic structure with strong capping inversion in the lower atmosphere. Such a thermal structure develops because the soil temperature does not decrease as rapidly as the air temperature (Figure 2), causing a large ground heat flux and hence, a positive surface sensible heat flux. However, as the cold surge continues for several days, the soil temperature also decreases, and hence ground heat flux decreases. Therefore, such an adiabatic structure occurs during the onset of the cold surge rather than over the entire cold surge period. The nearly adiabatic structure is captured by the model, but the simulated adiabatic layer depth is shallower than the observed depth. Evaluation statistics for vertical structure of potential temperature were calculated using data at 20 levels below 2 km above ground level (AGL) (Table 3). Unlike 2-m air temperature, the boundary layer has a cold bias, and the cold bias is larger at the MOO and DGW than at BKC site at 0600 LST, indicating that cold advection is overestimated in inland mountainous areas (Table 3).
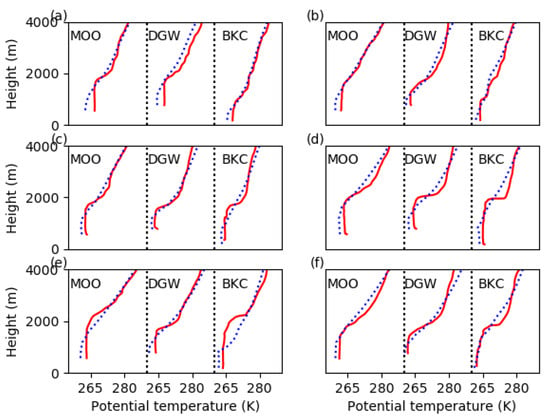
Figure 6.
Vertical profiles of the observed (solid line) and simulated (dotted line) virtual potential temperature at (a) 0600, (b) 0900, (c) 1200, (d) 1500, (e) 1800, and (f) 2100 LST at MOO, DGW, and BKC sites.

Table 3.
Evaluation statistics of vertical profiles of simulated virtual potential temperature and wind below 2 km AGL at the BKC, DGW, and MOO sites on 23 January 2018.
The formation of an adiabatic layer in the early morning allows an early development of the deep PBL, leading to less diurnal variation in the PBL on the onset day of the cold surge. At 0600 and 0900 LST, strong capping inversion height is lower at BKC than at the other sites, indicating that the inversion layer follows the terrain height. In the simulation, the strong inversion layer at the PBL top is not as evident as in the observation. This is partly due to overestimated cooling within the PBL. The simulated strong inversion height follows terrain height, which is consistent with observations. From 0900 to 1200 LST, the increase in inversion height is much larger at BKC than at the other two sites, indicating that mechanisms other than surface heating increase the inversion height at BKC. At 1200 and 1500 LST, the observed strong inversion heights are similar at the three sites but the simulated one is lower at BKC than at the other sites. At 1800 LST, a further increase in the inversion height is shown at the MOO and BKC sites despite radiative cooling, thus the inversion height at the DGW site is lowest among three sites. A large deviation between simulation and observation is shown at the BKC site. At 2100 LST, further cooling decreases the adiabatic layer depth at the MOO and DGW sites and forms a stable boundary layer at the BKC site, and such features are well simulated, showing high IOA (Table 3).
The vertical profiles of the observed wind vectors are displayed with simulations at 3-hourly intervals from 0600 to 2100 LST at three sites in Figure 7. The observed wind speed is much stronger above than below 2000 m ASL, and hence, we confined wind plots below 2000 m ASL to focus on the wind profile within the PBL. Except at 0600 LST, both observed and simulated wind speeds show maximum values at the DGW site. In both observations and simulation, a large variation in wind profile is noted at the BKC site, located in the lee of mountains, but the timing of large wind shear during the daytime is different between observations and simulation; observations show a large wind shear at 1200 LST and a well- mixed condition at 1500 LST, whereas the simulation shows the opposite. Such difference could be because the 3-hourly interval of radiosonde measurement is too coarse to capture the timing of large wind shear in the lee. Slight timing and location error in large wind shear could lead to large differences between point observations and model simulation. On the other hand, large wind shears at 1800 and 2100 LST at the BKC site are well captured in the simulation, although weak wind layer depth is underestimated. The model shows overall good performance in simulating the vertical structure of wind and potential temperature below 2 km AGL, showing a high IOA (Table 3) except for wind at 1200 and 1500 LST at the BKC site. This suggests that accurate prediction of boundary-layer wind is possible in complex terrain using a high-resolution model. However, a large uncertainty still exists in the prediction of wind in the PBL in the lee of mountains during the daytime, even when a high-resolution model is used. To reduce uncertainty in the PBL wind in the lee, more continuous observations at several points in the lee are required.
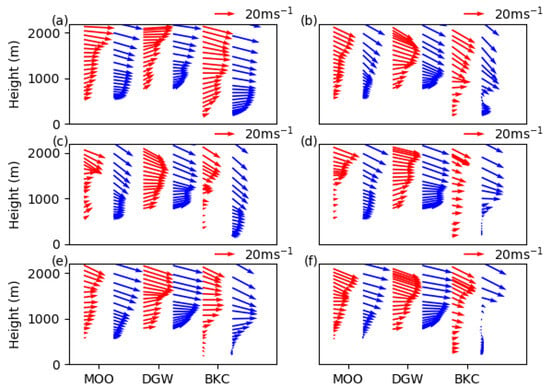
Figure 7.
Vertical profiles of the observed (red) and simulated (blue) wind vectors at (a) 0600, (b) 0900, (c) 1200, (d) 1500, (e) 1800, and (f) 2100 LST at MOO, DGW, and BKC sites.
3.4. Application of the Reduced Gravity Shallow Water (RGSW) Theory
To interpret the observed different behavior of flow at the BKC site between early morning (0600 LST) and the daytime (1200–1800 LST), we applied the RGSW theory [6] to the flow over mountains. The application of the RGSW theory is typically justified by the presence of a relatively sharp inversion above the less-stratified shallow flow. In the shallow water theory, the flow regime of the hydrostatic single layer over an obstacle is classified in terms of the upstream flow Froude number, F0, and dimensionless obstacle height, , where is the maximum height of the obstacle and is the depth of the upstream layer. Figure 8 shows the flow regime on the F0 − diagram [29]. The flow over the obstacle is classified into four regimes: subcritical flow, supercritical flow, flow with jump, and total blocked flow. The flow in region III experiences flow transitions from subcritical flow to supercritical flow at the ridge top, and flow on the lee side is supercritical (F > 1) until it becomes subcritical flow (F < 1) in a lee jump. In region III, flow with a small F0 (<< 1) has a stationary lee jump over the slope, whereas that with a large F0 has a propagating lee jump [29].
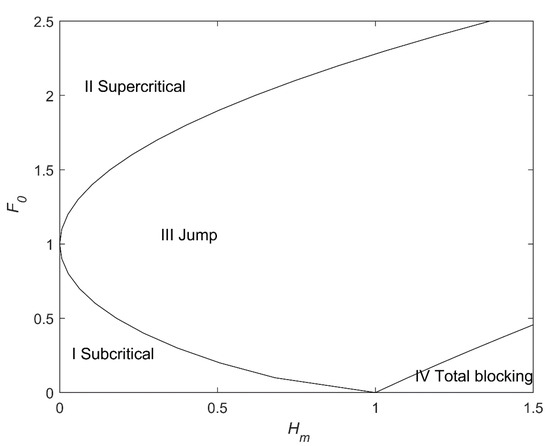
Figure 8.
Flow regime of the F0 − Hm diagram for a hydrostatic single-layer flow over an obstacle (from Baines 1995 [29]). F0 is the upwind flow Froude number and Hm is the obstacle height normalized by the layer depth.
To interpret observations at the BKC site, we used F at the MOO site as F0 and peak height (1300 m) nearest to the BKC site as . The capping inversion strength is larger than 5 K, except for 0900 LST (Figure 9a) at MOO site. Therefore, we focus on flows at 0600, 1200, 1500, and 1800 LST when sharp inversion is well-defined at the MOO site. For the mixed layer depth between 1000 and 2000 m, ranges from 0.65 to 1.3. Therefore, most flows correspond to flow regime III rather than to the subcritical or supercritical flow regime. At 0600 LST, F0 is close to 1, and F at the BKC site is larger than 1, indicating a supercritical flow on the lee side. On the other hand, during the daytime, F0 ranges from 0.5 to 0.7, and F at the BKC site is <1, indicating a subcritical flow on the lee side. This suggests that flow at 0600 LST corresponds to flow with a propagating lee jump, while flows with smaller F0 during the daytime correspond to flow with a stationary lee jump. F at the DGW site also supports the occurrence of flow transition from subcritical to supercritical flow near the ridge top, showing F larger than 1, except at 1500 LST.
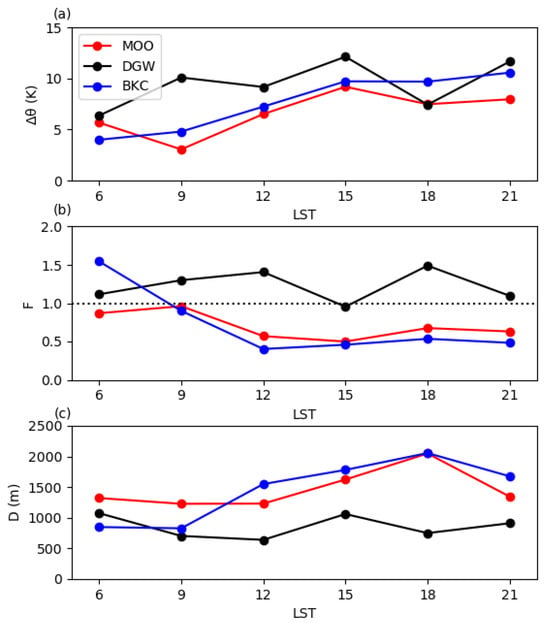
Figure 9.
Time series of (a) strength of inversion, (b) Froude number, and (c) mixed layer depth.
To examine how the model simulates PBL flow structure crossing the mountains, we examined the simulated vertical cross-section of the horizontal wind speed and potential temperature crossing the BKC site (black dot) in the east-west direction at 0600 and 1300 LST in Figure 10. In the simulation, a subcritical flow at the BKC site occurred at 1300 LST; therefore, we analyzed the results at that time. The mountain is asymmetrical, with a steeper lee than the windward side. The different flow behavior on the lee side between 0600 and 1300 LST is captured in the simulation, although mixed-layer depth is shallower than the observed one, and inversion at the top of the mixed layer is not sharp. In the simulation, a stratified flow over the mountain forms a lee wave. The horizontal wavelength of the wave is longer at 0600 LST than that at 1300 LST. This is consistent with the finding of Vosper [30] that a decrease in F0 leads to shortening wavelength of the lee wave. The steepening of streamlines in the lee-wave field at 1300 LST results in a jump-like structure half-way down the lee slope. Doyle and Durran [31] demonstrated that increasing the surface heat flux above the lee slope increases the vertical extent of rotor circulation, which could contribute to the steepening of the streamline. Although the downslope wind is not severe, wind shear in both horizontal and vertical directions is large in the PBL at 1300 LST. Such large wind shears in the PBL can cause severe aviation hazards. The mixed layer with a capping inversion is common PBL structure during the daytime. Therefore, caution for large wind shears in aviation is needed around high mountains during the daytime.
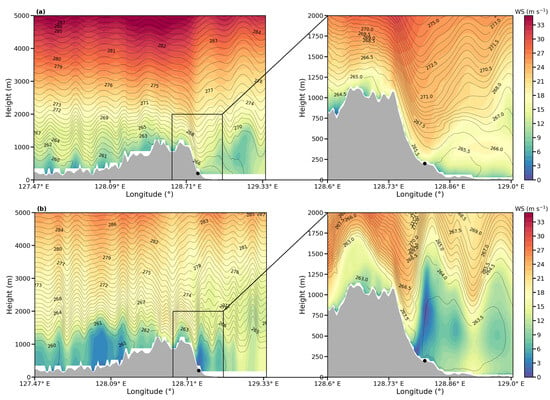
Figure 10.
Longitude–height cross-section of the potential temperature (K) and westerly wind speed (m s−1) crossing the BKC site (black dot) at (a) 0600 LST and (b) 1300 LST on 23 January 2018.
4. Summary and Conclusions
We investigated the planetary boundary layer (PBL) flows over a complex terrain during the onset of a cold surge using 3-hourly radiosonde measurements at three sites (upwind, near ridge, downwind of mountains) in the northeastern part of South Korea, as well as a high-resolution (333-m) numerical simulation. The cold surge onset occurred on 23 January 2018 and lasted for 4 days. On the onset day, the Siberian high expanded toward the Korean Peninsula, and a low-pressure system developed in the East Sea, leading to close packing of the isobars, and hence high wind speed near the surface over the Korean Peninsula.
Analysis of the radiosonde data showed that the PBL was characterized by an adiabatic layer with a strong capping inversion in the early morning and evening as well as during the daytime. Thus, the PBL shows less diurnal variation on a cold-surge onset day. The observed wind speeds showed the maximum value at the DGW site, located in the mountain pass among the three sites, whereas a large variation in the observed wind profiles was noted at the BKC site, located in the lee of the mountains.
We ran a WRF model and validated model results against near-surface observations and radiosonde measurements. The model simulated the diurnal variation in near-surface temperature and wind direction well at two stations, but it did not simulate the temporal variability of wind speed, particularly at the BGN site, located in the lee of the mountain. The nearly adiabatic structure was captured by the model, but the simulated adiabatic layer depth was much shallower than the observed one. Strong winds at pass were well simulated, and large variation in wind in the lee was also captured, but the timing of large wind shears during the daytime was not well captured. The model shows overall good performance in simulating the vertical structure of wind and virtual potential temperature below 2 km AGL, showing a high IOA except for wind at 1200 and 1500 LST at the BKC site.
We examined the different behaviors of the PBL flow in the lee of mountains using the RGSW theory. Based on the upstream Froude number, the observed PBL flow regime changes from a flow with a propagating lee jump in the early morning (0600 LST) to a flow with a stationary lee jump during the daytime. This is consistent with the observed flow behavior in the lee of mountains: strong near-surface wind in the early morning and weak surface wind during the daytime. To identify the occurrence of the lee jump, we analyzed vertical cross-sections of the simulated potential temperature and wind speed crossing the BKC site. The model confirmed the occurrences of strong near-surface winds at 0600 LST and jump-like structure during the daytime in the lee of mountains.
Although the very high-resolution model shows good performance in simulating PBL flow in complex terrain, it still shows large uncertainty in wind simulation in the lee of mountains during the daytime. The occurrence of a jump-like structure in the lee could be common in the daytime PBL flow with a strong capping inversion, and therefore, for safe aviation in the PBL, caution is needed for occurrence of turbulence due to large wind shear in the lee of mountains during the daytime.
Author Contributions
Conceptualization, methodology, formal analysis, writing Y.-H.L., model simulation and visualization, H.-J.L., measurement and funding acquisition G.L. All authors have read and agreed to the published version of the manuscript.
Funding
This work was funded by the Korea Meteorological Administration Research and Development Program under grant RS-2023-00237740.
Institutional Review Board Statement
Not applicable.
Informed Consent Statement
Not applicable.
Data Availability Statement
Data are available upon request to Kwonil Kim (kwonil.kim.0@gmail.com) or Gyuwon Lee (gyuwon@knu.ac.kr). Based on the ICE-POP 2018 data policy, the current data are not available publicly.
Acknowledgments
The authors greatly appreciate the participants in the World Weather Research Programme research development project and forecast demonstration project “International Collaborative Experiments for Pyeongchang 2018 Olympic and Paralympic winter games” (ICE-POP 2018) hosted by the Korea Meteorological Administration (KMA). The authors thank Kwonil Kim at Stony Brook University for preparing the dataset.
Conflicts of Interest
The authors declare no conflicts of interest.
References
- Grisogono, B.; Belušić, D. A Review of Recent Advances in Understanding the Meso- and Microscale Properties of the Severe Bora Wind. Tellus A 2009, 61, 1–16. [Google Scholar] [CrossRef]
- Rotunno, R.; Bryan, G.H. Numerical Simulations of Two-Layer Flow Past Topography. Part I: The Leeside Hydraulic Jump. J. Atmos. Sci. 2018, 75, 1231–1241. [Google Scholar] [CrossRef]
- Smith, R.B. 100 Years of Progress on Mountain Meteorology Research. Meteorol. Monogr. 2019, 59, 20.1–20.73. [Google Scholar] [CrossRef]
- Cheng, F.Y.; Wang, Y.T.; Huang, M.Q.; Lin, P.L.; Lin, C.H.; Lin, P.H.; Wang, S.H.; Tsuang, B.J. Boundary Layer Characteristics Over Complex Terrain in Central Taiwan: Observations and Numerical Modeling. J. Geophys. Res. Atmos. 2022, 127, e2021JD035726. [Google Scholar] [CrossRef]
- Stull, R.B. An Introduction to Boundary Layer Meteorology; Kluwer: Alphen aan den Rijn, The Netherlands, 1988; p. 670. [Google Scholar]
- Long, R.R. Some aspects of the flow of stratified fluids: II. Experiments with a two-fluid system. Tellus 1954, 6, 97–115. [Google Scholar] [CrossRef]
- Pettre, P. On the problem of violent valley winds. J. Atmos. Sci. 1982, 39, 542–554. [Google Scholar] [CrossRef][Green Version]
- Drobinski, P.; Flamant, C.; Dusek, J.; Flamant, P.H.; Pelon, J. Observational Evidence and Modelling of an Internal Hydraulic Jump at the Atmospheric Boundary-Layer Top During a Tramontane Event. Bound. Layer Meteorol. 2001, 98, 497–515. [Google Scholar] [CrossRef]
- Flamant, C.; Drobinski, P.; Nance, L.; Banta, R.; Darby, L.; Dusek, J.; Hardesty, M.; Pelon, J.; Richard, E. Gap Flow in an Alpine Valley during a Shallow South Föhn Event: Observations, Numerical Simulations and Hydraulic Analogue. Q. J. R. Meteorol. Soc. 2002, 128, 1173–1210. [Google Scholar] [CrossRef]
- Thompson, D.W.; Wallace, J.M. The Arctic Oscillation Signature in the Wintertime Geopotential Height and Temperature Fields. Geophys. Res. Lett. 1998, 25, 1297–1300. [Google Scholar] [CrossRef]
- Jeong, J.H.; Ho, C.H. Changes in Occurrence of Cold Surges over East Asia in Association with Arctic Oscillation: Cold Surges and Ao Over East Asia. Geophys. Res. Lett. 2005, 32, L14704. [Google Scholar] [CrossRef]
- Chen, T.C.; Huang, W.R.; Yoon, J.H. Interannual Variation of the East Asian Cold Surge Activity. J. Clim. 2004, 17, 401–413. [Google Scholar] [CrossRef]
- Lu, F.C.; Juang, H.M.H.; Liao, C.C. A Numerical Case Study of the Passage of a Cold Surge across Taiwan. Meteorol. Atmos. Phys. 2007, 95, 27–52. [Google Scholar] [CrossRef]
- Gehring, J.; Oertel, A.; Vignon, É.; Jullien, N.; Besic, N.; Berne, A. Microphysics and Dynamics of Snowfall Associated with a Warm Conveyor Belt over Korea. Atmos. Chem. Phys. 2020, 20, 7373–7392. [Google Scholar] [CrossRef]
- Kim, K.; Bang, W.; Chang, E.C.; Tapiador, F.J.; Tsai, C.L.; Jung, E.; Lee, G. Impact of Wind Pattern and Complex Topography on Snow Microphysics during International Collaborative Experiment for PyeongChang 2018 Olympic and Paralympic Winter Games (ICE-POP 2018). Atmos. Chem. Phys. 2021, 21, 11955–11978. [Google Scholar] [CrossRef]
- Jang, W.; Chun, H.Y. A Numerical Study on Severe Downslope Windstorms Occurred on 5 April 2005 at Gangneung and Yangyang, Korea. Asia Pac. J. Atmos. Sci. 2010, 46, 155–172. [Google Scholar] [CrossRef]
- Lee, J.; Seo, J.M.; Baik, J.J.; Park, S.B.; Han, B.S. A Numerical Study of Windstorms in the Lee of the Taebaek Mountains, South Korea: Characteristics and Generation Mechanisms. Atmosphere 2020, 11, 431. [Google Scholar] [CrossRef]
- Shin, Y.; Kim, J.H.; Chun, H.Y.; Jang, W.; Son, S.W. Classification of Synoptic Patterns with Mesoscale Mechanisms for Downslope Windstorms in Korea Using a Self-Organizing Map. J. Geophys. Res. Atmos. 2022, 127, e2021JD035867. [Google Scholar] [CrossRef]
- Skamarock, W.C.; Klemp, J.B.; Dudhia, J.; Gill, D.O.; Barker, D.M.; Duda, M.G.; Huang, X.Y.; Wang, W.; Powers, J.G. A description of the advanced Research WRF version 3; NCAR/TN-475+STR Technical Note; NCAR: Boulder, CO, USA, 2008. [Google Scholar]
- Shin, H.H.; Hong, S.Y. Representation of the subgrid-scale turbulent transport in convective boundary layers at gray-zone resolutions. Mon. Weather Rev. 2015, 143, 250–271. [Google Scholar] [CrossRef]
- Mitchell, K. The Community Noah Land-Surface Model (LSM). 2005. Available online: https://ftp.emc.ncep.noaa.gov/mmb/gcp/ldas/noahlsm/ver_2.7.1/ (accessed on 24 February 2023).
- Mlawer, E.J.; Taubman, S.J.; Brown, P.D.; Jacono, M.J.; Clough, S.A. Radiative transfer for inhomogeneous atmosphere: RRTM, a validated correlated k-model for the long-wave. J. Geophys. Res. 1997, 102, 16663–166682. [Google Scholar] [CrossRef]
- Dudhia, J. Numerical study of convection observed during the Winter Monsoon Experiment using a mesoscale two–dimensional model. J. Atmos. Sci. 1989, 46, 3077–3107. [Google Scholar] [CrossRef]
- Hersbach, H.; Bell, B.; Berrisford, P.; Hirahara, S.; Horányi, A.; Muñoz-Sabater, J.; Nicolas, J.; Peubey, C.; Radu, R.; Schepers, D.; et al. The ERA5 Global Reanalysis. Q. J. R. Meteorol. Soc. 2020, 146, 1999–2049. [Google Scholar] [CrossRef]
- Park, J.Y.; Suh, M.S. Improvement of MODIS land cover classification over the Asia-Oceania region. Korean J. Remote Sens. 2015, 31, 51–64. [Google Scholar] [CrossRef][Green Version]
- Reuter, H.I.; Nelson, A.; Jarvis, A. An evaluation of void filling interpolation methods for SRTM data. Int. J. Geogr. Inf. Sci. 2007, 21, 983–1008. [Google Scholar] [CrossRef]
- Willmott, C.J.; Ackleson, S.G.; Davis, R.E.; Feddema, J.J.; Klink, K.M.; Legates, D.R.; O’Donnell, J.; Rowe, C.M. Statistics for the Evaluation and Comparison of Models. J. Geophys. Res. Ocean. 1985, 90, 8995–9005. [Google Scholar] [CrossRef]
- Whiteman, C.D. Mountain Meteorology, Fundamentals and Application; Oxford University Press: Oxford, UK, 2000; p. 355. [Google Scholar]
- Baines, P.G. Topographic Effects in Stratified Flows; Cambridge University Press: Cambridge, UK, 1995; p. 482. [Google Scholar]
- Vosper, S.B. Inversion Effects on Mountain Lee Waves. Q. J. R. Meteorol. Soc. 2004, 130, 1723–1748. [Google Scholar] [CrossRef]
- Doyle, J.D.; Durran, D.R. The dynamics of Mountain-wave-induced rotors. J. Atmos. Sci. 2002, 59, 186–201. [Google Scholar] [CrossRef]
Disclaimer/Publisher’s Note: The statements, opinions and data contained in all publications are solely those of the individual author(s) and contributor(s) and not of MDPI and/or the editor(s). MDPI and/or the editor(s) disclaim responsibility for any injury to people or property resulting from any ideas, methods, instructions or products referred to in the content. |
© 2024 by the authors. Licensee MDPI, Basel, Switzerland. This article is an open access article distributed under the terms and conditions of the Creative Commons Attribution (CC BY) license (https://creativecommons.org/licenses/by/4.0/).