Abstract
This study investigated the influence of sea–land breezes on nocturnal spatial and temporal distribution of ozone (O3) and its potential effects on particulate nitrate formation in Qingdao, a coastal city in northern China. Observation campaigns were conducted to measure surface air pollutants and meteorological factors during a typical sea–land breezes event from 22 to 23 July 2022. A coherent Doppler lidar (CDL) system was employed to continuously detect three-dimensional wind fields. The results revealed that nocturnal ozone levels were enhanced by a conversion of sea–land breezes. Initially, the prevailing northerly land breeze transported high concentrations of O3 and other air pollutants from downtown to the Yellow Sea. As the sea breeze developed in the afternoon, the sea breeze front advanced northward, resulting in a flow of high O3 concentrations back into inland areas. This penetration of the sea breeze front led to a notable spike in O3 concentrations between 16:00 on 22 July and 02:00 on 23 July across downtown areas, with an average increase of over 70 μg/m3 within 10 min. Notably, a time lag in peak O3 concentration was observed with southern downtown areas peaking before northern rural areas. During this period, combined pollution of O3 and PM2.5 was also observed. These findings indicated that the nighttime increase in O3 concentrations, coupled with enhanced atmospheric oxidation, would likely promote the secondary conversion of gaseous precursors into PM2.5.
1. Introduction
Surface ozone (O3) is a secondary pollutant generated by the photochemical reaction of nitrogen oxides (NOx) and volatile organic compounds (VOCs), playing a crucial role in atmospheric chemistry [1,2]. O3 pollution not only impacts air quality and climate change but also poses significant risks to human health, crop yields, and ecosystems [3,4,5]. Although the Clean Air Action Plan (CAAP, 2013–2017) and the Blue Sky Protection Campaign (BSPC, 2018–2020) successfully reduced PM2.5 concentration in China, O3 concentrations showed a fluctuating but upward trend [6,7], particularly in the central and eastern regions [8].
The atmospheric chemical and physical processes of surface O3 exhibited distinct differences between day and night [9], typically showing a unimodal diurnal variation that peaks in the afternoon due to photochemical formation from NOx (NO and NO2) and volatile organic compounds (VOCs) in the presence of sunlight [10] and reaches a minimum before sunrise because of chemical destruction (such as NO titration, NO + O3→NO2 + O2) or dry deposition [11]. However, in recent years, significant nocturnal O3 enhancement (NOE) events, referring to the phenomenon of nighttime O3 concentrations rising by 5 to 30 ppbv [12,13], have been observed at various sites around the world, such as urban and rural sites in northern Portugal [14], multiple urban sites in UK [15], and southeast United States [16]. These increases were attributed to the horizontal transport of O3 from upwind-polluted regions or dynamic atmospheric processes, such as turbulent mixing and vertical mixing triggered by convective storms or low-level jets [17,18,19]. Elevated nocturnal O3 levels could enhance the nighttime atmospheric oxidation capacity, promoting the formation of secondary pollutants such as particulate nitrate and secondary organic aerosols [13,20].
With half of the world’s population residing within 100 km of coastlines, air quality in coastal areas present a significant health risk to residents [21]. Sea–land breezes are one of the most common mesoscale circulation pattern in these regions, resulting from uneven heating induced by differences in heat capacity between land and sea [22]. Studies have highlighted that air quality is typically worse on sea–land breezes days than on non-sea–land breezes days [23,24,25,26]. Moreover, O3 pollution events during sea–land breezes days remain particularly complex due to spatial and temporal variations in air temperature (T), relative humidity (RH), and wind fields [27,28,29]. These variations not only impact photochemical reaction conditions but also atmospheric diffusion conditions, leading to inhomogeneous distributions of O3 or secondary aerosol [27,30,31]. Therefore, understanding the influence of wind flow and pollutant dispersion on O3 distribution is essential for effectively addressing air quality issues in coastal regions.
While many studies conducted in northern China have focused on O3 characteristics, meteorological causes, or formation sensitivities [32,33,34,35], less attention has been paid to nocturnal O3 concentrations in coastal regions [36]. Qingdao, an important coastal city located in east of Shandong province, presents an ideal location for examining O3 pollution processes influenced by sea–land breezes [37]. The objectives of this study were to (a) analyze the impact of sea–land breezes on the spatial and temporal distribution of O3 during this pollution episode and (b) explore the potential influence of O3 on nighttime particulate nitrate formation. Thus, ground-based Lidar measurements were employed to investigate three-dimensional (3D) wind fields in Qingdao from 22 to 23 July 2022. Variations in ground-level air pollutant concentrations were comprehensively analyzed in conjunction with meteorological data and synoptic weather patterns. Our results provided insights into nocturnal ozone enhancement (NOE) influenced by sea–land breezes in the northern coastal region of China.
2. Materials and Methods
2.1. Observation Materials
Hourly surface concentration of O3, PM2.5, NO2, NO, and CO from 22 to 23 July 2022 were observed at a supersite in Laoshan (LS), Qingdao (36.11° N, 120.47° E) [38], as depicted in Figure 1. Concurrently, hourly meteorological data, including wind direction, wind speed, T, RH, and solar radiation (SR), were observed. Additionally, surface O3 concentrations were obtained from an ambient-air-quality-monitoring station network in Qingdao to analyze the spatial and temporal distribution of O3. All data were reported in local time (LT, LT = UTC + 8). Synoptic weather charts depicting 500 hPa and 850 hPa geopotential height, as well as sea level pressure, were sourced from the Korea Meteorological Administration (https://www.kma.go.kr/nchn/image/chart/analysis-chart.do, accessed on 24 July 2022).
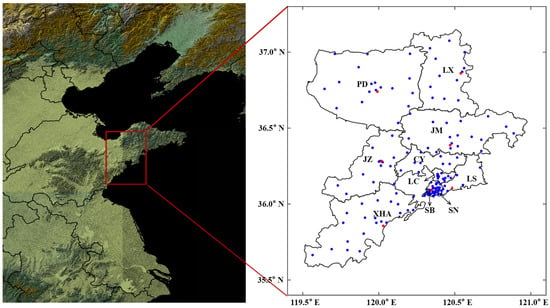
Figure 1.
Locations of air-quality-monitoring stations (blue circles), wind field sites (red squares), and supersite (red triangle).
2.2. Wind Fields
Ground-level winds were observed at LS, Xihaian (XHA), Shibei (SB), Jiaozhou (JZ), Jimo (JM), Laixi (LX), and Pingdu (PD) to analyze the evolution of sea–land breezes. Three-dimensional wind profiles were collected at SB, yard of Qingdao Eco-Environmental Monitoring Center of Shandong Province (36.07° N, 120.34° E), by using a coherent Doppler lidar (CDL) system manufactured by Qingdao Leice Transient Technology Co., Ltd, Qingdao, China. [39]. The monitoring site was located approximately 1.2 km from the coastline. The CDL system was deployed on the roof of a container, approximately 3 m above ground level, and operated in Doppler-Beam-Scanning mode with an angle of 60° to the vertical direction and a laser wavelength of 1.5 μm. It provided continuous 3D wind profiles with a spatial resolution of 30 m across altitudes ranging from 77 to 2000 m. Wind speed measurement accuracy was less than 0.1 m/s, and wind direction measurement accuracy was within 3°. Horizontal wind direction and speed, as well as vertical wind speed with a time resolution of 10 min, were used for analysis.
2.3. Criteria to Identify Sea–Land Breezes
As established in previous studies [37], days meeting specific criteria, including wind direction, wind speed, occurrence time, and duration, were classified as sea–land breeze days. Considering the direction of the coastline in Qingdao, a sea breeze was defined by wind directions between 50° and 210°, while a land breeze was defined by wind directions between 0° and 30° or 230° to 360°.
The following criteria were applied [40,41,42]:
- Following the sea and land breeze diurnal variation pattern, a period from 01:00 to 08:00 was considered as the land breeze period; 09:00–12:00 was marked as the transition from the land to sea breeze; 13:00–20:00 was identified as the sea breeze period; and 21:00–00:00 was noted as the transition from the sea breeze to the land breeze.
- Sea breeze occurrences were required to last at least 4 h during the sea breeze period, while land breeze occurrences were limited to a maximum of 2 h.
- Land breeze occurrences were required to last at least 4 h, whereas sea breeze occurrences should not exceed 2 h.
- Wind speeds exceeding 10 m/s were excluded from sea–land breezes analysis to eliminate interference from large-scale weather systems.
Additionally, the absolute difference in wind direction between 02:00 and 14:00 was set between 90° and 270°.
2.4. HYSPLIT Model
Air mass back-trajectories were calculated using the National Oceanic and Atmospheric Administration (NOAA) Hybrid Single Particle Lagrangian Integrated Trajectory (HYSPLIT) model, utilizing CDC1 Meteorological data. To trace the local or regional transport sources of O3 at midnight (00:00 on 23 July), 24 h backward trajectories were designated at SB site (120.34° E,36.07° N) at altitudes of 100, 500, and 1000 m above the ground level.
3. Results and Discussion
3.1. Variation in Air Pollutant Concentrations and Meteorological Data
Hourly variations in wind direction, wind speed, T, RH, precipitation, SR, and concentrations of O3, NO2, NO, CO, and PM2.5 observed at LS from 22 to 23 July 2022, were depicted in Figure 2. O3 pollution was evident in Qingdao over the two consecutive days. The daily maximum 8 h average O3 concentration (MDA8) on 22 July and 23 July were 215 µg/m3 and 181 µg/m3, respectively, exceeding the national secondary standard limit of 160 µg/m3 for 1.34 and 1.13 times.
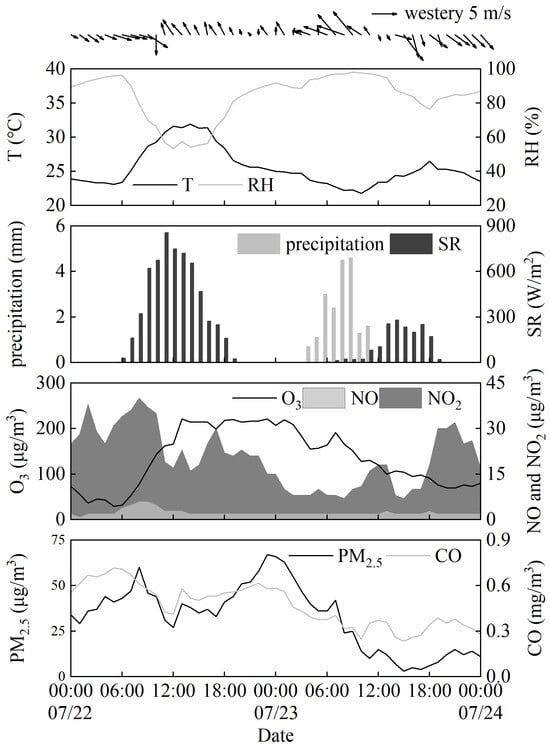
Figure 2.
Hourly variations of wind direction, wind speed, air temperature (T), relative humidity (RH), precipitation, solar radiation (SR), as well as concentrations of O3, NO, NO2, PM2.5, and CO.
Typically, O3 concentrations exhibited a unimodal distribution, peaking between 15:00 and 16:00 [43]. However, on both days, O3 concentration remained unusually high for extended periods during nighttime. A rapid increase in O3 was observed from 06:00 to 13:00 on 22 July, reaching a peak of 221 µg/m3 at 13:00, with an increase rate of 26 µg/(m3·h). Although SR decreases rapidly after sunset, resulting in weakened photochemical reactions, the O3 concentration remained high and comparable to midday peak levels. High levels of O3, averaging (215 ± 6) µg/m3, persisted until early morning on 23 July at 02:00. Afterward, the O3 concentration gradually declined, but with a slight increase observed from 05:00 to 08:00 on 23 July.
Between 01:00 and 02:00 on 23 July, the change rate in the hourly O3 concentration (∆O3/∆t) was 12 μg/(m3·h). According to previous studies [12,13], an hourly nocturnal (between 20:00 and 06:00) increase in O3 concentration exceeding 10 μg/m3 from the previous hour can be identified as an NOE event. O3 formation in the nocturnal boundary layer is impossible without SR, as nocturnal O3 depletion is primarily driven by dry deposition and chemical reactions with NOx [2,6,10,11]. Therefore, the increase in O3 concentration in the nighttime required further investigation.
On 22 July, higher concentrations of PM2.5, NOx, and CO were observed alongside a northerly land breeze. High T, peaking of 31.9 °C at 14:00, a total daily SR of 5968 W/m2, and low average RH of 66%, were conducive to local formation of O3 produced from photochemistry of NOx and VOCs, leading to a rapid increase in O3 concentration. In contrast, on 23 July, the highest temperature dropped to 26.5 ℃ at 18:00, with lower daily cumulative SR of only 1684 W/m2 and higher average RH of 90%. Additionally, 9.3 mm of precipitation fell from 04:00 to 11:00, facilitating the wet removal of air pollutants. These atmospheric conditions contributed to a reduction in air pollutant levels and inhibited local O3 formation.
MDA8s were observed from 16:00 to 23:00 on 22 July and from 01:00 to 08:00 on 23 July, rather than during the period of intense photochemical activities from noon to dusk, suggesting that the high O3 levels during the NOE event may be influenced by the transport of O3 pollution [44]. Notable, at 13:00 on 22 July, the wind direction near the ground shifted from land breeze to sea breeze, persisting for approximately 25 h until noon on 23 July. This wind shift indicated that the NOE pollution process may be related to the conversion from land breeze to sea breeze.
It is also worth noting that the daily variation in the PM2.5 concentration exhibited a bimodal distribution on 22 July. The first peak of 60 μg/m3 occurred around 08:00. The PM2.5 concentration remained relatively low from 11:00 to 17:00 but rose again after 18:00, reaching a second peak of 67 μg/m3 at 23:00.
3.2. Synoptic Weather Patterns and Backward Trajectories
O3 pollution is generally associated with dominant weather patterns [23]. On 22 July, Qingdao and its surrounding regions were predominantly under the influence of a high-pressure ridge (584–588 dagpm), resulting in clear weather conditions that intensified SR (Figure 3). These atmospheric conditions were conductive for photochemical reactions of O3 generation from O3 precursors (NOx and VOCs) [32], leading to a rapid increase in hourly concentration of O3 up to 221 µg/m3 at 13:00. The circulation pattern exhibited a shift in wind currents from northwest to southwest, with relatively sparse isobars at 850 hPa geopotential height, facilitating the development of local circulations [36], such as sea–land breezes. These breezes can transport O3 from inland areas to coastal areas and then back to inland areas [24]. Additionally, a ground temperature inversion occurred at night, extending a height of 311 m and exhibiting a strength of 0.7 °C/100 m. This inversion prevents vertical mixing, contributing to the accumulation of O3 formed during the day and trapping the air pollutants in the stable nighttime boundary layer. Consequently, nocturnal high levels of O3 concentration could be attributed to both the intense formation of O3 in daytime and/or potential O3 transport. In contrast, on 23 July, Qingdao and its adjacent regions were positioned ahead of a trough, as discerned by 500 hPa geopotential height field. A low-pressure vortex moved eastward at the 850 hPa geopotential height, coupled with the passage of a cold front at the surface. The cold front brought precipitation, which inhibited local O3 formation.
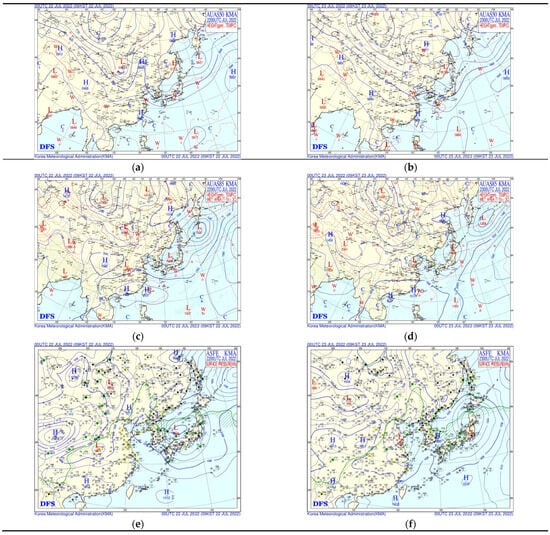
Figure 3.
Synoptic weather charts of 500 hPa geopotential height (a,b), 850 hPa geopotential height (c,d), and sea-level pressure (e,f) at 08:00 on 22–23 July 2022. (https://www.kma.go.kr/nchn/image/chart/analysis-chart.do, accessed on 24 July 2022).
To better understand the transport of ground-level O3 at midnight, 24 h backward trajectories of air masses were calculated at 00:00 on 23 July. The trajectories at 100, 500, and 1000 m above Qingdao were depicted in Figure 4 (red: 100 m; blue: 500 m; green: 1000 m). Analysis of these trajectories revealed no crossover among different heights, indicating limited vertical mixing. The air masses predominantly originated from local sources rather than long-range transport, as the trajectories remained within a distance of less than 150 km. The air masses initially came from local inland areas, then moved towards the Yellow sea before returning inland. It can also be inferred that the NOE event was influenced by the transition between land breeze and sea breeze.
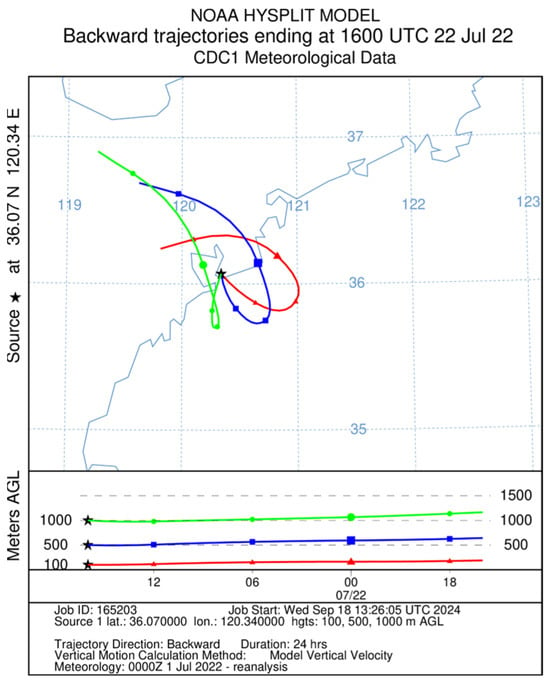
Figure 4.
Backward trajectories ending at 00:00 23 July 2022.
3.3. Effect of Sea/Land Breezes on Spatial and Temporal Distribution of Ozone
Analysis of surface-wind flows from 22 to 23 July revealed that offshore winds were predominantly northerly (Figure 5). Around noon on 22 July, winds in southern downtown shifted to an onshore southeasterly flow, creating a ‘head-to-head wind’ zone along the coastline due to the convergence of land and sea breezes. By the afternoon, the sea breeze strengthened, altering the wind direction to an onshore southerly or southeasterly flow from southern coastal areas to northern inland regions. At 11:00, wind at LS had fully transitioned to a sea breeze, followed by XHA at 13:00, SB at 16:00, JZ at 18:00, and JM at 20:00, while PD and LX in the northern rural areas remained under land breeze dominance. The sea breeze persisted until early morning on 23 July as surface cyclone weakened, after which it quickly shifted to a northerly wind, eliminating the sea–land breezes convergence zones.
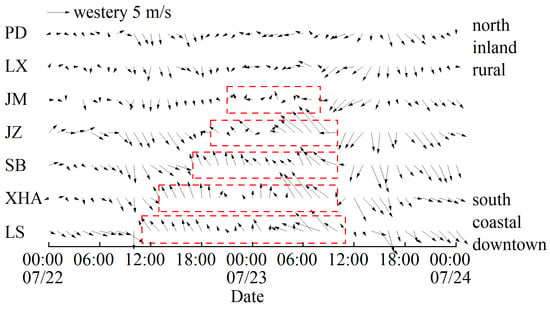
Figure 5.
Surface winds observed in LS, XHA, SB, JZ, JM, LX and PD on 22–23 July 2022. (The red rectangles indicate the duration of the sea breeze.).
Based on 3D wind profiles at SB (Figure 6), before the occurrence of sea breeze on 22 July, a northerly land breeze prevailed up to 2 km near the ground. At 16:00, the wind gradually shifted to sea breeze at lower altitudes, with height expanding from 300 m to 700 m, ultimately reaching approximately 1.2 km at midnight. Influenced by the surface cyclone, the sea breeze continued until noon on 23 July, before shifting to northerly winds after 13:00. During this period, downdrafts dominated, with weak updrafts occurring near the surface up to 500 m.
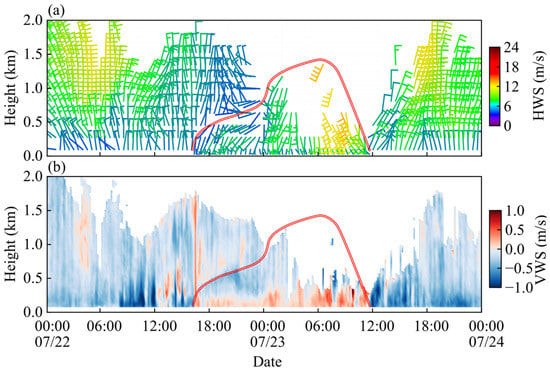
Figure 6.
Vertical distributions of the (a) horizontal wind direction and wind speed and (b) vertical wind speed (negative presents downdraught; positive presents updraught) at SB on 22–23 July 2022. (The double red line represents the height of the sea breeze.).
It can be inferred that the sea breeze lasted for up to 25 h (LS site) and penetrated inland up to 50 km from the coastline, reaching a maximum height of 1.2 km (SB site). Under conditions of strong SR, high T, and weak northerly wind on 22 July, precursors like NOx and VOCs underwent photochemical reactions downtown, leading to enhanced generation of O3. The high levels of O3 were gradually transported from downtown to the Yellow Sea by northerly winds, causing high O3 accumulations over the ocean. The ‘head-to-head wind’ along the coastline led to rapid increases in O3 concentration within the sea–land breezes convergence zone (Figure 7). As the sea breeze developed in the afternoon, it carried O3-rich air back to land, resulting in the average O3 concentration pollution in this convergence zone being approximately 100 μg/m3 higher than that in non-convergence zones. These results were consistent with findings found in Ningbo [24] and Tianjin [35].
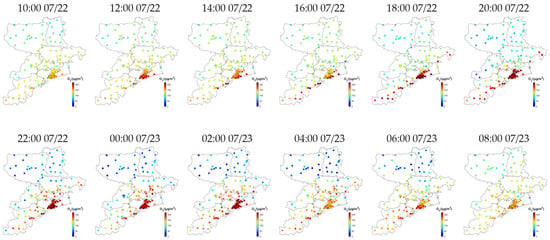
Figure 7.
Spatial and temporal distribution of O3 concentration in Qingdao from 10:00 on 22 July to 08:00 on 23 July 2022.
The sea breeze from the Yellow sea blows horizontally towards inland, with its landward edge defined as the sea breeze front [45]. As the sea breeze strengthened, the sea breeze front advanced northward, leading to a flow of high O3 concentrations back towards northward inland areas. This caused a distinct spike in O3 concentrations in downtown areas from south to north between 16:00 and 21:00 (Figure 8), with an average increase of more than 70 μg/m3 within 10 min at multiple sites. Eventually, the sea breeze front moved past downtown, penetrating further inland toward rural areas and resulting in high-concentration O3 zones migrating from southern downtown to northern rural areas (JZ and JM), demonstrating a time lag in peak O3 concentration. Similar high-concentration O3 zones behind the moving sea breeze fronts were also observed in Hangzhou [25] and New York [46]. Despite NOx titration, lower boundary layer height, ground temperature inversion, and strong sea breeze induced by ground cyclone, the O3 concentration remained elevated at night, likely due to backflow of O3 from offshore areas.
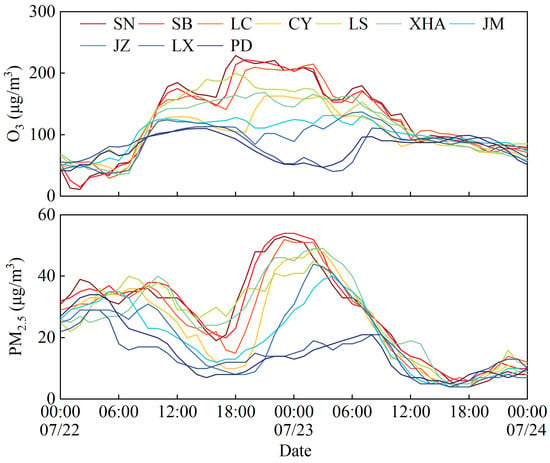
Figure 8.
Hourly variation in O3 concentration for 10 districts in Qingdao on 22–23 July 2022.
By early morning on 23 July, the O3 concentration started to decline due to wet scavenging. However, a slight increase of around 30 μg/m3 in O3 was observed around 07:00 in southern downtown, attributed to the retreat of sea breeze and a rapid transition of land breeze.
3.4. Potential Influence of NOE on Particulate Nitrate Formation
From the evening of 22 July to the morning of 23 July, significant positive correlations were observed between O3 and PM2.5 concentrations in the regions of SN, SB, LC, CY, LS, XHA, JZ, and JM (Figure 9), with R values ranging from 0.5 to 0.9. These areas were both influenced by the sea breeze. In contrast, the R values in LX and PD were −0.1 and −0.2, respectively, indicating insignificant negative correlations between the O3 and PM2.5 concentrations. In the convergence zone of the sea and land breezes, the PM2.5 concentration increased rapidly, resulting in a combined pollution of PM2.5 and O3 occurring chronologically from south to north as the sea breeze developed.
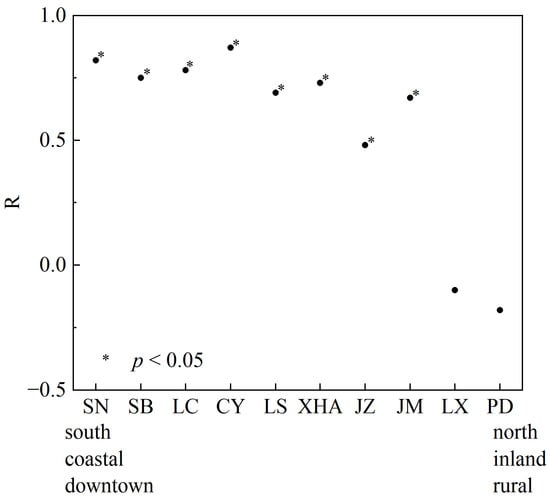
Figure 9.
R values between O3 and PM2.5 from the evening of 22 July to the morning of 23 July 2022.
The NOE, coupled with enhanced atmospheric oxidation, would promote the secondary conversion of gaseous precursors into PM2.5 [47]. Secondary inorganic ions (SNAs), including nitrate, ammonium, and sulfate, were major components of PM2.5. During the first PM2.5 peak around 8:00 on 22 July, the O3 concentration was 78 μg/m3, and SNA concentrations accounted for 38% of PM2.5 (Figure 10). Specifically, nitrate, sulfate, and ammonium accounted for 13.6%, 8.5%, and 13.8% of PM2.5, respectively. In contrast, by the second PM2.5 peak around 23:00 on 22 July, the O3 concentration had increased to 221 μg/m3, and the SNA concentrations rose to 65% of PM2.5. Nitrate, sulfate, and ammonium accounted for 32.3%, 14.9%, and 15.6% of PM2.5, respectively. The proportion of SNA, particularly nitrates, increased notably during nocturnal O3 pollution period, indicating a potential secondary conversion process.
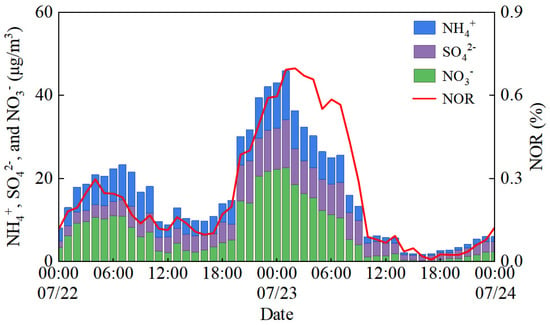
Figure 10.
Hourly variation in NH4+, SO42−, and NO3− concentrations and NOR in LS on 22–23 July 2022.
Nitrogen oxidation rate (NOR, NOR = [NO3−]/([NO3−] + [NO2])) has been widely used to evaluate the efficiency of the secondary transformation of NO2 to NO3− [48]. From 20:00 on 22 July to 02:00 on 23 July, the average Ox (O3 + NO2) concentration was (227 ± 16) μg/m3, with NOR values ranging from 0.39 to 0.70, averaging 0.55. This suggested that the nocturnal increase in O3 concentration likely promoted the generation of secondary particles [13]. Previous studies have indicated that nocturnal O3 can react with NOx to produce NO3 radicals and N2O5, which subsequently form HNO3 and contribute to particulate nitrate formation [47,49]. Additionally, the increase in RH during the nighttime can also promote the reactions of NO2, O3, and NO3 to generate N2O5 [50]. Further investigation is required to fully understand the role of NOE in promoting particulate nitrate formation through N2O5 heterogeneous hydrolysis.
4. Conclusions
The effects of sea–land breezes on NOE and its potential influence on particulate nitrate formation were investigated using surface air pollutants and meteorological observations, along with continuous 3D wind profiles in Qingdao from 22 to 23 June 2022. On 22 July, O3 was generated by accelerated local photochemical reactions under a weak, high-pressure synoptic pattern characterized by high T and intense SR. This weak synoptic pattern was favorable for the development of local circulations, such as sea–land breezes. The land breeze initially dominated before noon on 22 July, shifting to the sea breeze in the afternoon, lasting until the next morning, before transitioning back to land breeze again between 09:00 and 12:00 on 23 July. The sea breeze lasted for up to 25 h, penetrating inland as far as 50 km from the coastline and reaching a maximum height of 1.2 km. A “head-to-head wind” convergence zone was created due to the conversion between land breeze and sea breeze, which had a significant influence on the spatial–temporal O3 distribution and made it more complicated in coastal areas.
The prevailing northerly land breeze first transported high levels of O3 and other air pollutants from downtown to the Yellow Sea. In the afternoon, the developing sea breeze brought O3-rich air mass back inland. However, as the sea breeze strengthened and a strong ground temperature inversion formed at night, the diffusion of air pollutants was inhibited, resulting in elevated O3 and PM2.5 concentrations at midnight. The penetration of the sea breeze front led to further inland transport of O3 and PM2.5, with a distinct spike in O3 and PM2.5 concentrations observed from southern downtown to northern rural areas between 16:00 on 22 July and 02:00 on 23 July. These findings showed that the nighttime increase in O3 concentrations and enhanced atmospheric oxidation would promote the secondary conversion of gaseous precursors to PM2.5. It is necessary for further comprehensive research to fully understand the underlying causes of this combined O3 and PM2.5 pollution.
Author Contributions
Conceptualization, H.M. and J.L. (Jianjun Li); validation, H.M., J.L. (Jiahong Liu), L.W. and J.L. (Jianjun Li); formal analysis, H.M.; investigation, H.M. and J.L. (Jiahong Liu); data curation, H.M., J.L. (Jiahong Liu) and L.W.; writing—original draft preparation, H.M. and J.L. (Jianjun Li); writing—review and editing, H.M., J.L. (Jiahong Liu), L.W., L.S. and J.L. (Jianjun Li); visualization, J.L. (Jiahong Liu) and L.W.; supervision, J.L. (Jianjun Li); project administration, H.M. and J.L. (Jianjun Li); funding acquisition, H.M. and J.L. (Jianjun Li). All authors have read and agreed to the published version of the manuscript.
Funding
This research was funded by the Shandong Provincial Natural Science Foundation of China, grant number ZR2021MD013.
Institutional Review Board Statement
Not applicable.
Informed Consent Statement
Not applicable.
Data Availability Statement
Data are contained within the article.
Conflicts of Interest
The authors declare no conflicts of interest. The funders had no role in the design of the study; in the collection, analyses, or interpretation of data; in the writing of the manuscript; or in the decision to publish the results.
References
- Lu, X.; Hong, J.Y.; Zhang, L.; Cooper, O.R.; Schultz, M.G.; Xu, X.; Wang, T.; Gao, M.; Zhao, Y.; Zhang, Y. Severe surface ozone pollution in China: A global perspective. Environ. Sci. Technol. Lett. 2018, 5, 487–494. [Google Scholar] [CrossRef]
- Wang, T.; Xue, L.K.; Brimblecombe, P.; Lam, Y.F.; Li, L.; Zhang, L. Ozone pollution in China: A review of concentrations, meteorological influences, chemical precursors, and effects. Sci. Total Environ. 2017, 575, 1582–1596. [Google Scholar] [CrossRef] [PubMed]
- Lefohn, A.S.; Malley, C.S.; Smith, L.; Wells, B.; Hazucha, M.; Simon, H.; Naik, V.; Mills, G.; Schultz, M.G.; Paoletti, E.; et al. Tropospheric ozone assessment report: Global ozone metrics for climate change, human health, and crop/ecosystem research. Elem. Sci. Anth. 2018, 6, 27. [Google Scholar] [CrossRef]
- Feng, Z.; De Marco, A.; Anav, A.; Gualtieri, M.; Sicard, P.; Tian, H.; Fornasier, F.; Tao, F.; Guo, A.; Paoletti, E. Economic losses due to ozone impacts on human health, forest productivity and crop yield across China. Environ. Int. 2019, 131, 104966. [Google Scholar] [CrossRef]
- Hu, W.; Yang, J.N. Effect of ambient ozone pollution on disease burden globally: A systematic analysis for the global burden of disease study 2019. Sci. Total Environ. 2024, 926, 171739. [Google Scholar] [CrossRef] [PubMed]
- Wang, T.; Xue, L.K.; Feng, Z.Z.; Dai, J.N.; Zhang, Y.N.; Tan, Y. Ground-level ozone pollution in China: A synthesis of recent findings on influencing factors and impacts. Environ. Res. Lett. 2022, 17, 063003. [Google Scholar] [CrossRef]
- Ding, S.; Wei, Z.; Liu, S.; Zhao, R. Uncovering the evolution of ozone pollution in China: A spatiotemporal characteristics reconstruction from 1980 to 2021. Atmos. Res. 2024, 307, 107472. [Google Scholar] [CrossRef]
- Li, K.; Jacob, D.J.; Shen, L.; Lu, X.; De Smedt, I.; Liao, H. Increases in surface ozone pollution in China from 2013 to 2019: Anthropogenic and meteorological influences. Atmos. Chem. Phys. 2020, 20, 11423–11433. [Google Scholar] [CrossRef]
- Lal, S.; Naja, M.; Subbaraya, B.H. Seasonal variations in surface ozone and its precursors over an urban site in India. Atmos. Environ. 2000, 34, 2713–2724. [Google Scholar] [CrossRef]
- Seo, J.H.; Jeon, H.W.; Sung, U.J.; Sohn, J.R. Impact of the COVID-19 outbreak on air quality in Korea. Atmosphere 2020, 11, 1137. [Google Scholar] [CrossRef]
- Kim, S.; Jeong, D.; Sanchez, D.; Wang, M.; Seco, R.; Blake, D.; Meinardi, S.; Barletta, B.; Hughes, S.; Jung, J.; et al. The controlling factors of photochemical ozone production in Seoul, South Korea. Aerosol Air Qual. Res. 2018, 18, 2253–2261. [Google Scholar] [CrossRef]
- Wang, J.; Wang, D.; Ge, B.; Lin, W.; Ji, D.; Pan, X.; Li, J.; Wang, Z. Increase in daytime ozone exposure due to nighttime accumulation in a typical city in eastern China during 2014–2020. Atmos. Pollut. Res. 2022, 13, 101387. [Google Scholar] [CrossRef]
- An, C.; Li, H.; Ji, Y.; Chu, W.; Yan, X.; Chai, F. A review on nocturnal surface ozone enhancement: Characterization, formation causes, and atmospheric chemical effects. Sci. Total Environ. 2024, 921, 170731. [Google Scholar] [CrossRef]
- Sousa, S.I.V.; Alvim-Ferraz, M.C.M.; Martins, F.G. Identification and origin of nocturnal ozone maxima at urban and rural areas of Northern Portugal—Influence of horizontal transport. Atmos. Environ. 2011, 45, 942–956. [Google Scholar] [CrossRef]
- Kulkarni, P.S.; Bortoli, D.; Silva, A.M.; Reeves, C.E. Enhancements in nocturnal surface ozone at urban sites in the UK. Environ Sci. Pollut. Res. 2015, 22, 20295–20305. [Google Scholar] [CrossRef] [PubMed]
- Johnson, M.S.; Kuang, S.; Wang, L.; Newchurch, M.J. Evaluating summer-time ozone enhancement events in the southeast United States. Atmosphere 2016, 7, 108. [Google Scholar] [CrossRef]
- Reitebuch, O.; Strassburger, A.; Emeis, S.; Kuttler, W. Nocturnal secondary ozone concentration maxima analysed by sodar observations and surface measurements. Atmos. Environ. 2000, 34, 4315–4329. [Google Scholar] [CrossRef]
- Wang, K.; Xie, F.; Sulaymon, I.D.; Gong, K.; Li, N.; Li, J.; Hu, J. Understanding the nocturnal ozone increase in Nanjing, China: Insights from observations and numerical simulations. Sci. Total Environ. 2023, 859, 160211. [Google Scholar] [CrossRef]
- Wu, Y.; Chen, W.; You, Y.; Xie, Q.; Jia, S.; Wang, X. Quantitative impacts of vertical transport on the long-term trend of nocturnal ozone increase over the Pearl River Delta region during 2006-2019. Atmos. Chem. Phys. 2023, 23, 453–469. [Google Scholar] [CrossRef]
- Wang, H.; Lu, K.; Tan, Z.; Chen, X.; Liu, Y.; Zhang, Y. Formation mechanism and control strategy for particulate nitrate in China. J. Environ. Sci. 2023, 123, 476–486. [Google Scholar] [CrossRef]
- Barragán, J.M.; De Andrés, M. Analysis and trends of the world’s coastal cities and agglomerations. Ocean Coast. Manag. 2015, 114, 11–20. [Google Scholar] [CrossRef]
- Pokhrel, R.; Lee, H. Estimation of the effective zone of sea/land breeze in a coastal area. Atmos. Pollut. Res. 2011, 2, 106–115. [Google Scholar] [CrossRef]
- Mavrakou, T.; Philippopoulos, K.; Deligiorgi, D. The impact of sea breeze under different synoptic patterns on air pollution within Athens basin. Sci. Total Environ. 2012, 433, 31–43. [Google Scholar] [CrossRef] [PubMed]
- Zhao, D.; Xin, J.; Wang, W.; Jia, D.; Wang, Z.; Xiao, H.; Liu, C.; Zhou, J.; Tong, L.; Ma, Y.; et al. Effects of the sea-land breeze on coastal ozone pollution in the Yangtze River Delta, China. Sci. Total Environ. 2022, 807, 150306. [Google Scholar] [CrossRef]
- Han, Z.S.; Liu, H.N.; Yu, B.; Wang, X.Y. The effects of coastal local circulations and their interactions on ozone pollution in the Hangzhou metropolitan area. Urban Clim. 2023, 48, 101417. [Google Scholar] [CrossRef]
- Varaprasad, V.; Kanawade, V.P.; Narayana, A.C. Association between sea-land breeze and particulate matter in five coastal urban locations in India. Sci. Total Environ. 2024, 913, 169773. [Google Scholar] [CrossRef]
- Zhu, L.; Meng, Z.; Zhang, F.; Markowski, P.M. The influence of sea-and land-breeze circulations on the diurnal variability in precipitation over a tropical island. Atmos. Chem. Phys. 2017, 17, 13213–13232. [Google Scholar] [CrossRef]
- Shen, L.; Zhao, C. Dominance of shortwave radiative heating in the sea-land breeze amplitude and its impacts on atmospheric visibility in Tokyo, Japan. J. Geophys. Res. Atmos. 2020, 125, e2019JD031541. [Google Scholar] [CrossRef]
- Noble, S.; Viner, B.; Wermter, J. Summary of atmospheric characteristics of days with inland penetrating sea breezes from 2015 to 2021. Atmos. Sci. Lett. 2024, 25, 1192. [Google Scholar] [CrossRef]
- Xu, J.; Zhong, K.; Wang, Y.; He, J.; Kang, Y. Influences of daily solar radiation intensity on the sea-land breeze and pollutant dispersion in coastal areas. Build. Environ. 2024, 258, 111600. [Google Scholar] [CrossRef]
- Yang, J.; Xin, J.; Zhang, Y.; Xiao, X.; Xia, J.C. Contributions of sea–land breeze and local climate zones to daytime and nighttime heat island intensity. NPJ Urban Sustain. 2022, 2, 12. [Google Scholar] [CrossRef]
- Dong, Y.; Li, J.; Guo, J.; Jiang, Z.; Chu, Y.; Chang, L.; Yang, Y.; Liao, H. The impact of synoptic patterns on summertime ozone pollution in the North China Plain. Sci. Total Environ. 2020, 735, 139559. [Google Scholar] [CrossRef] [PubMed]
- Wang, X.; Zhao, W.; Zhang, T.; Qiu, Y.; Ma, P.; Li, L.; Wang, L.; Wang, M.; Zheng, D.; Zhao, W. Analysis of the characteristics of ozone pollution in the North China Plain from 2016 to 2020. Atmosphere 2022, 13, 715. [Google Scholar] [CrossRef]
- Sun, J.; Shen, Z.; Wang, R.; Li, G.; Zhang, Y.; Zhang, B.; He, K.; Tang, Z.; Xu, H.; Qu, L.; et al. A comprehensive study on ozone pollution in a megacity in North China Plain during summertime: Observations, source attributions and ozone sensitivity. Environ. Int. 2021, 146, 106279. [Google Scholar] [CrossRef]
- Gong, C.; Liao, H. A typical weather pattern for ozone pollution events in North China. Atmos. Chem. Phys. 2019, 19, 13725–13740. [Google Scholar] [CrossRef]
- Hao, T.; Chen, S.; Liu, J.; Tang, Y.; Han, S. An observational study on the impact of sea-land breeze and low-level jet on air pollutant transport in the Bohai Bay. Atmos. Pollut. Res. 2024, 15, 102143. [Google Scholar] [CrossRef]
- Guo, Z.; Cao, L.; Guo, J.; Shang, M.; Guo, X. On three types of sea breeze in Qingdao of East China: An observational analysis. Front. Environ. Sci. 2023, 11, 1188952. [Google Scholar] [CrossRef]
- Wu, Y.; Liu, B.; Meng, H.; Wang, F.; Li, S.; Xu, M.; Shi, L.; Zhang, S.; Feng, Y.; Hopke, P.K. Unexpected changes in source apportioned results derived from different ambient VOC metrics. Environ. Int. 2024, 190, 108910. [Google Scholar] [CrossRef]
- Wang, X.; Dai, G.; Wu, S.; Zhu, P.; Li, Z.; Song, X.; Zhang, S.; Xu, J.; Yin, J.; Qin, S.; et al. Classification of turbulent mixing driven sources in marine atmospheric boundary layer with use of shipborne coherent doppler lidar observations. J. Geophys. Res. Atmos. 2023, 128, 2023JD038918. [Google Scholar] [CrossRef]
- Furberg, M.; Steyn, D.G.; Baldi, M. The climatology of sea breezes on Sardinia. Int. J. Climatol. 2002, 22, 917–932. [Google Scholar] [CrossRef]
- Hai, S.; Miao, Y.; Sheng, L.; Wei, L.; Chen, Q. Numerical study on the effect of urbanization and coastal change on sea breeze over Qingdao, China. Atmosphere 2018, 9, 345. [Google Scholar] [CrossRef]
- Nie, X.; Mao, H.; Li, P.; Li, T.; Zhou, J.; Wu, Y.; Yang, M.; Zhen, J.; Wang, X.; Wang, Y. Total gaseous mercury in a coastal city (Qingdao, China): Influence of sea-land breeze and regional transport. Atmos. Environ. 2020, 235, 117633. [Google Scholar] [CrossRef]
- Duan, J.; Tan, J.; Yang, L.; Wu, S.; Hao, J. Concentration, sources and ozone formation potential of volatile organic compounds (VOCs) during ozone episode in Beijing. Atmos. Res. 2008, 88, 25–35. [Google Scholar] [CrossRef]
- He, C.; Lu, X.; Wang, H.; Wang, H.; Li, Y.; He, G.; He, Y.; Wang, Y.; Zhang, Y.; Liu, Y. The unexpected high frequency of nocturnal surface ozone enhancement events over China: Characteristics and mechanisms. Atmos. Chem. Phys. 2022, 22, 15243–15261. [Google Scholar] [CrossRef]
- Miller, S.T.K.; Keim, B.D.; Talbot, R.W.; Mao, H. Sea breeze: Structure, forecasting, and impacts. Rev. Geophys. 2003, 41, 1011. [Google Scholar] [CrossRef]
- Han, Z.S.; González-Cruz, J.E.; Liu, H.N.; Melecio-Vázquez, D.; Gamarro, H.; Wu, Y.H.; Moshary, F.; Bornstein, R. Observed sea breeze life cycle in and around NYC: Impacts on UHI and ozone patterns. Urban Clim. 2022, 42, 101109. [Google Scholar] [CrossRef]
- Li, X.; Ren, J.; Huang, R.; Chen, L.; Li, Y.; Qiao, X.; Cheng, Y.; Zhao, B.; Yin, D.; Gao, D.; et al. The aggravation of summertime nocturnal ozone pollution in China and its potential impact on the trend of nitrate aerosols. Geophys. Res. Lett. 2023, 50, 2023GL103242. [Google Scholar] [CrossRef]
- Luo, L.; Pan, Y.Y.; Zhu, R.G.; Zhang, Z.Y.; Zheng, N.J.; Liu, Y.H.; Liu, C.; Xiao, H.W.; Xiao, H.Y. Assessment of the seasonal cycle of nitrate in PM2.5 using chemical compositions and stable nitrogen and oxygen isotopes at Nanchang, China. Atmos. Environ. 2020, 225, 117371. [Google Scholar] [CrossRef]
- Wang, S.; Wang, L.; Wang, N.; Ma, S.; Su, F.; Zhang, R. Formation of droplet-mode secondary inorganic aerosol dominated the increased PM2.5 during both local and transport haze episodes in Zhengzhou, China. Chemosphere 2021, 269, 128744. [Google Scholar] [CrossRef]
- Yun, H.; Wang, W.; Wang, T.; Xia, M.; Yu, C.; Wang, Z.; Poon, S.C.N.; Yue, D.L.; Zhou, Y. Nitrate formation from heterogeneous uptake of dinitrogen pentoxide during a severe winter haze in southern China. Atmos. Chem. Phys. 2018, 18, 17515–17527. [Google Scholar] [CrossRef]
Disclaimer/Publisher’s Note: The statements, opinions and data contained in all publications are solely those of the individual author(s) and contributor(s) and not of MDPI and/or the editor(s). MDPI and/or the editor(s) disclaim responsibility for any injury to people or property resulting from any ideas, methods, instructions or products referred to in the content. |
© 2024 by the authors. Licensee MDPI, Basel, Switzerland. This article is an open access article distributed under the terms and conditions of the Creative Commons Attribution (CC BY) license (https://creativecommons.org/licenses/by/4.0/).