Correction: Wu, K.-L.; Shan, L. Make Way for the Wind—Promoting Urban Wind Corridor Planning by Integrating RS, GIS, and CFD in Urban Planning and Design to Mitigate the Heat Island Effect. Atmosphere 2024, 15, 257

Figure/Table
Formatting
References
Text Correction


| Poor Ventilation Reasons | Label No. | CFD Simulation Result | Poor Ventilation Building Layout Patterns | Suggested Scenarios Building Layout Patterns | ||
|---|---|---|---|---|---|---|
| The distance between buildings is too small in the wind corridor paths | OB1 |  |  | Short spacing |  | Maintain proper spacing |
| The windward building is too long and too tall, which blocks the airflows of summer winds | OB2, OB7 |  | 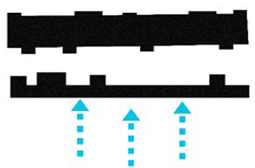 | Too long and too tall buildings | 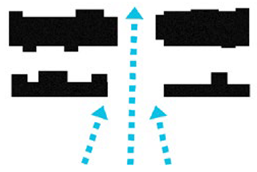 | Separate long and tall buildings |
| The distance between buildings is too small, and the alley is too narrow | OB3 |  |  | Narrow alleys and small building spacing | 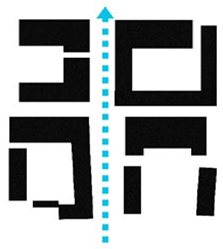 | Maintain proper alley width and building spacing |
| Illegal building units and illegal building additions, which block ventilation | OB4 | 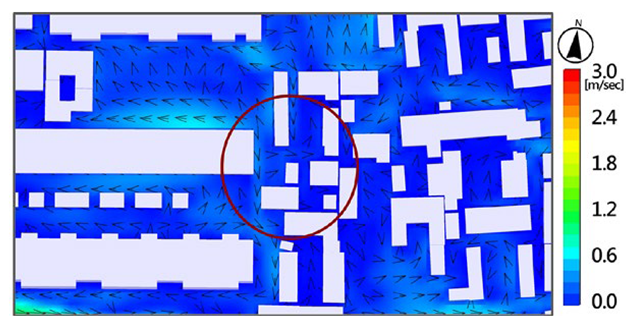 | 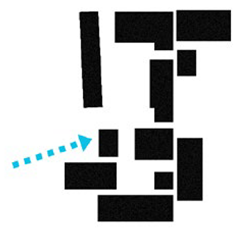 | Illegal building units and additions blocking ventilation | 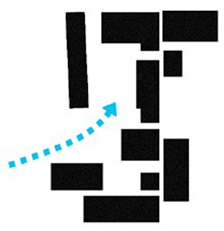 | Clean illegal building units and building additions |
| Enclosed square-shaped traditional building units, resulting in poor ventilation | OB5 | 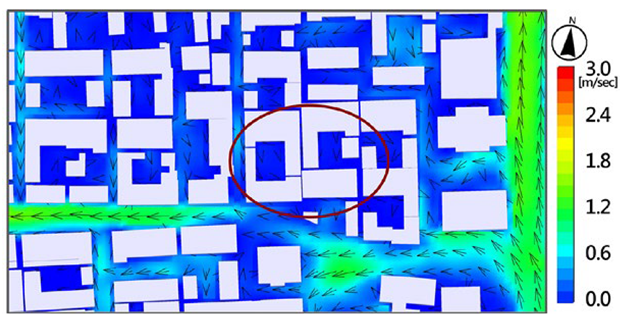 |  | Enlosed square-shaped buildings prevent ventilation | 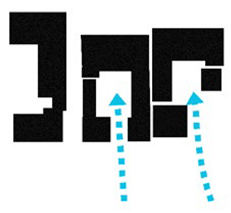 | Maintain proper openings for square-shaped buildings |
| The long L-shaped building form, which is unfavorable to ventilation | OB6 | 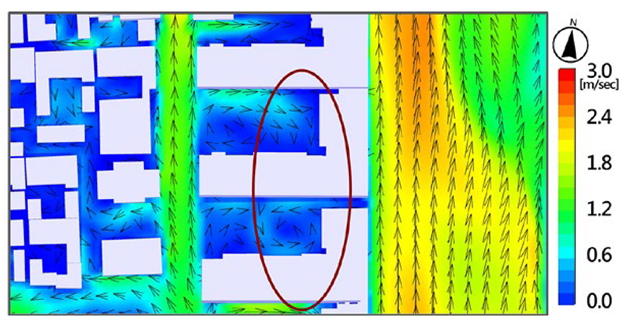 |  | Long L-shahed buildings prevent ventilation |  | Maintain proper openings for long L-shaped buildings |
| Good Ventilation Reasons | Label No. | CFD Simulation Result | Good Ventilation Building Layout Patterns |
|---|---|---|---|
| Employing scattered building layout model and maintaining sufficient distance between adjacent buildings | OG1 | 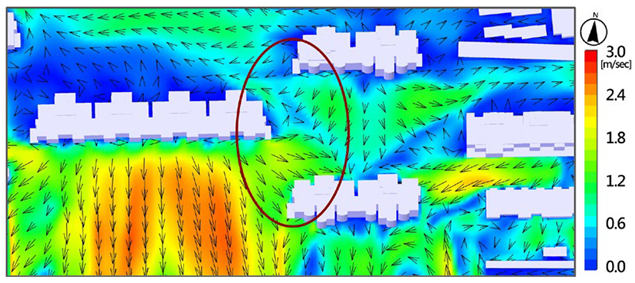 | 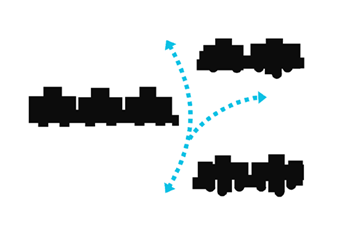 |
| The width of the street meets the ventilation requirements and the orientation of the street consistent with the direction of the summer prevailing wind | OG2 | 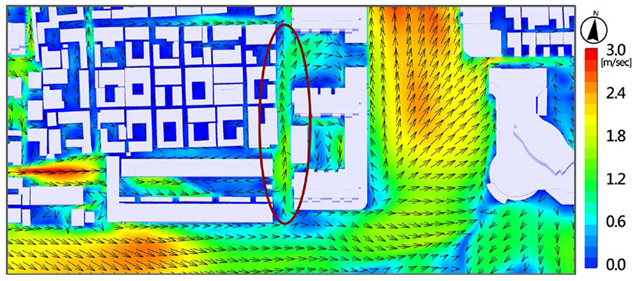 |  |
| Poor Ventilation Reasons | Label No. | CFD Simulation Result | Poor Ventilation Building Layout Patterns | Suggested Scenarios Building Layout Patterns | ||
|---|---|---|---|---|---|---|
| Lack of proper building ventilation openings in the summer prevailing wind direction | NB1 |  |  | No proper building openings | 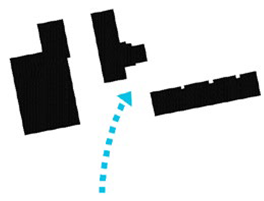 | Maintain proper building openings |
| Long and tall building volume, which prevents summer prevailing wind flow to the communities | NB2 | 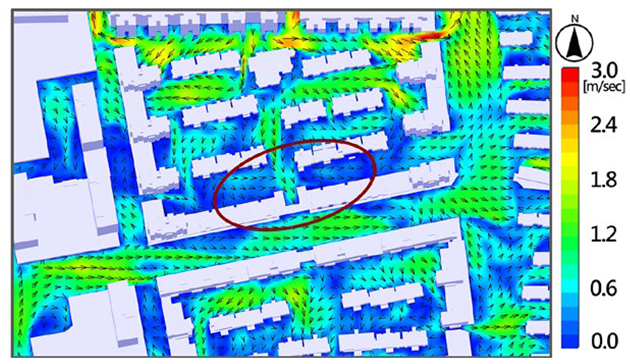 |  | Long and tall buildings | 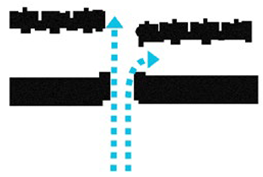 | Separate the long and tall buildings |
| Spacing of adjacent buildings is too small, resulting in poor ventilation | NB3 NB5 NB7 | 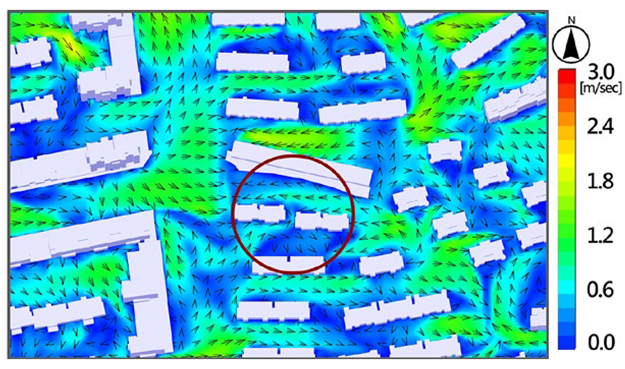 | 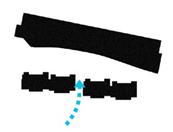 | Small spacings between buildings | 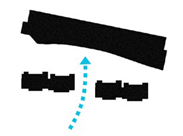 | Maintain proper building spacings |
| Summer windward buildings are too long and without proper ventilation openings | NB4 | 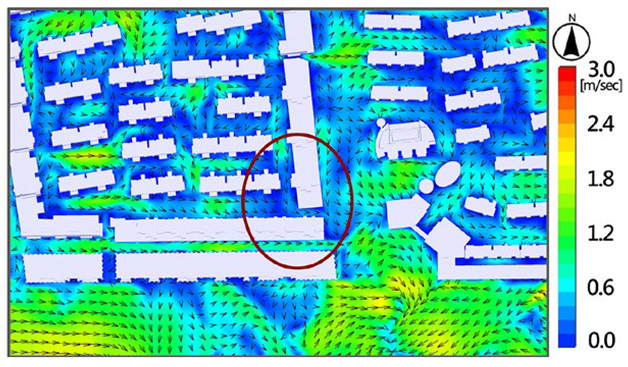 |  | No proper openings of windward buildings |  | Maintain proper openings of windward buildings |
| Lack of adequate ventilation openings on the windward street corner | NB6 |  |  | No proper openings on windward street corner |  | Maintain proper openings of windward street corner |
| Good Ventilation Reasons | Label No. | CFD Simulation Result | Good Ventilation Building Layout Patterns |
|---|---|---|---|
| Scattered building layout model with proper distance between buildings, which is conducive to good ventilation | NG1 NG2 |  | 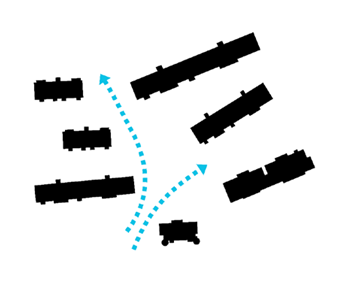 |
| Maintain appropriate building openings and spacing at street corners to facilitate the introduction of summer inflow wind | NG3 | 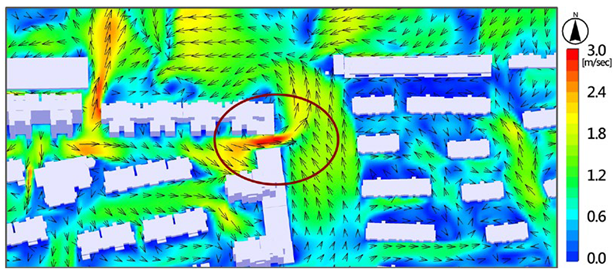 | 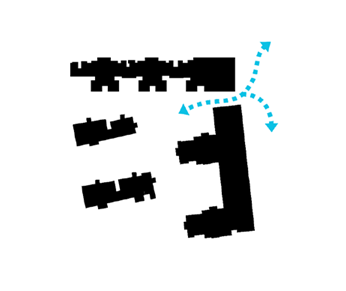 |
| Appropriate building spacing, proper street orientation, and scattered building layout, which are conducive to wind circulation | NG4 | 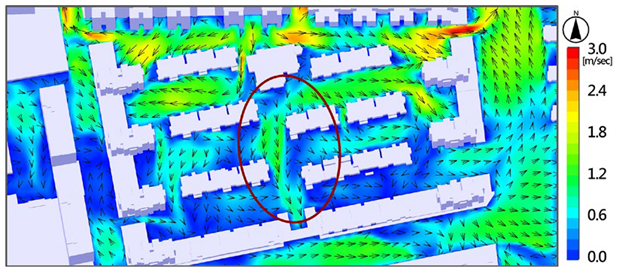 |  |
- 3. According to urban planning practice in the research region, it is recommended that the first-level urban wind corridors has a width of 200–300 m, and the second-level urban wind corridors has a width of 80–200 m.
- 5. National land planning and urban land use planning should avoid allocating polluting industries or polluting land use activities in upwind areas where the inflow wind blows into the city. It is suggested that polluting industries or polluting land use activities should not be placed on main urban wind corridor paths. If there is a need, it should be placed at the end of the urban wind corridor path.
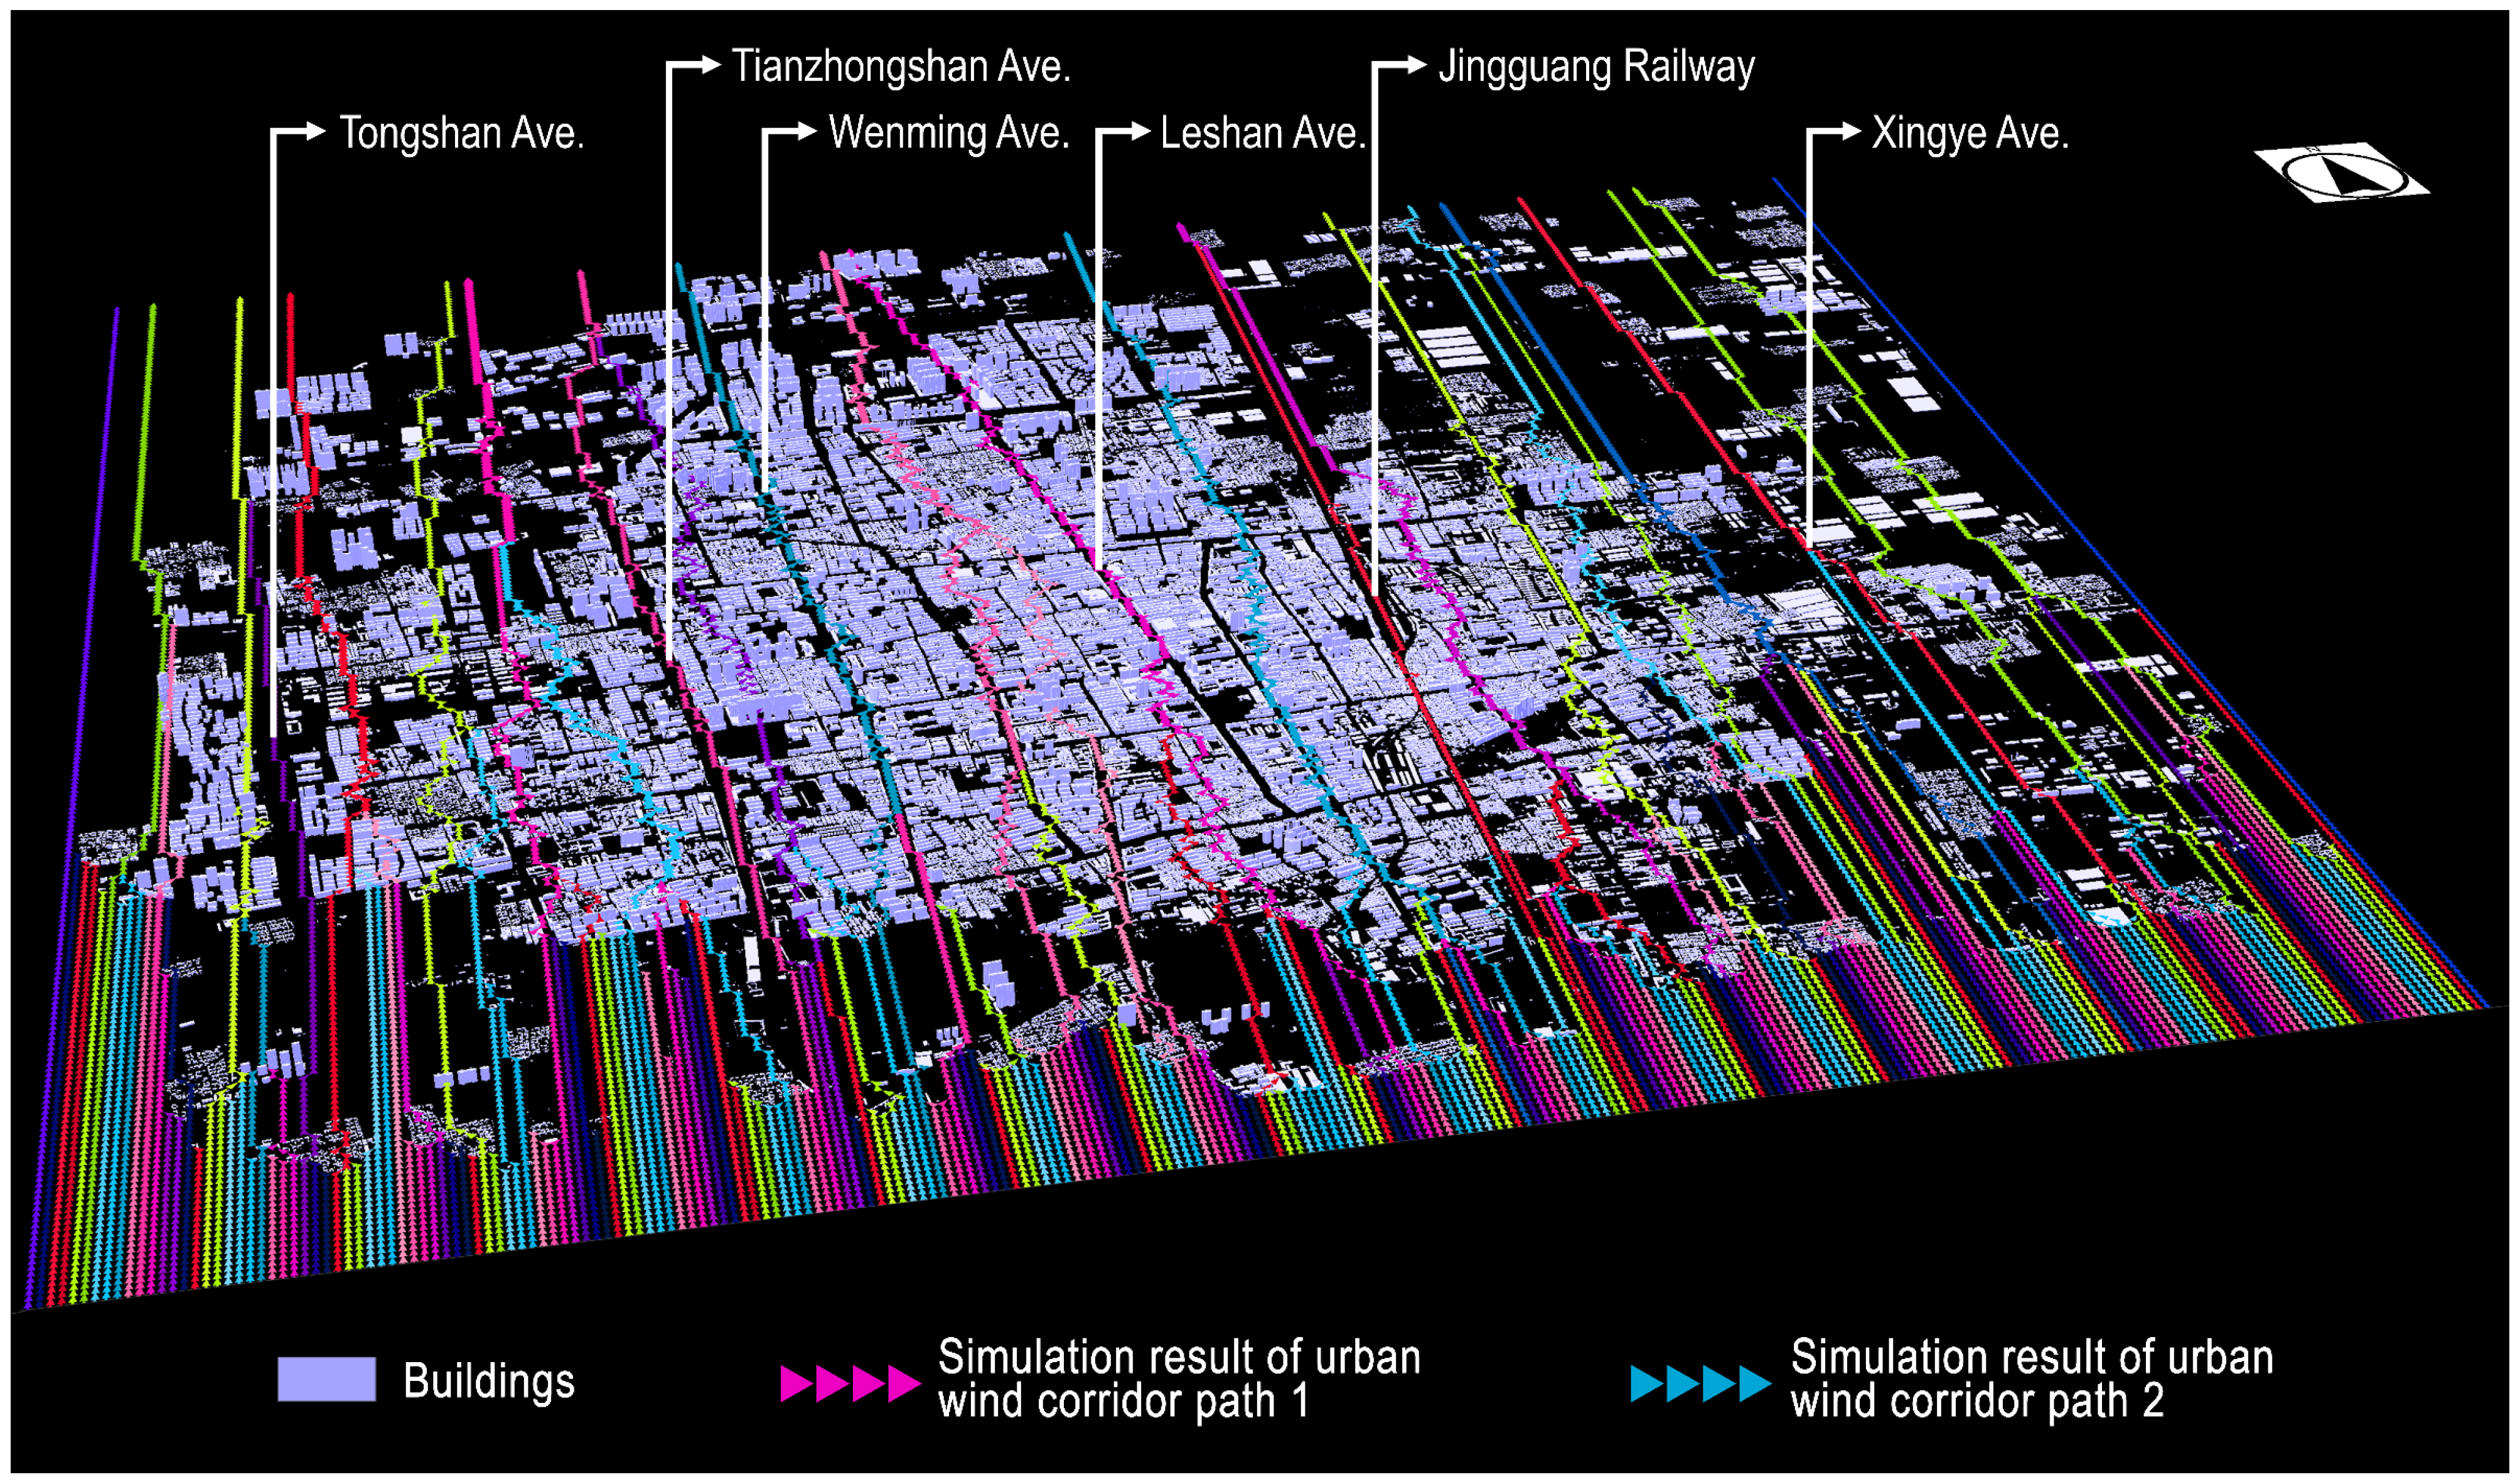
- 8. Railway lines and spacious arterial roads have the potential to serve as main urban wind corridors. Therefore, when conducting the comprehensive planning of a city, the orientation and structure of the main road system as well as the establishment of green belts on both sides of the main roads/railways should be considered in order to meet the need of developing urban wind corridors.
References
- Wu, K.-L.; Shan, L. Make Way for the Wind—Promoting Urban Wind Corridor Planning by Integrating RS, GIS, and CFD in Urban Planning and Design to Mitigate the Heat Island Effect. Atmosphere 2024, 15, 257. [Google Scholar] [CrossRef]
- Wu, K.-L. Research on Simulation Analysis and Planning Guidances of Ventilation Environment Improvement in the Demonstration Districts of the Central Urban Area of Zhumadian City; Final Research Report of the Research Project Commissioned; Urban Planning and Design Institute of Shenzhen: Shenzhen, China, 2019. (In Chinese) [Google Scholar]
Disclaimer/Publisher’s Note: The statements, opinions and data contained in all publications are solely those of the individual author(s) and contributor(s) and not of MDPI and/or the editor(s). MDPI and/or the editor(s) disclaim responsibility for any injury to people or property resulting from any ideas, methods, instructions or products referred to in the content. |
© 2024 by the authors. Licensee MDPI, Basel, Switzerland. This article is an open access article distributed under the terms and conditions of the Creative Commons Attribution (CC BY) license (https://creativecommons.org/licenses/by/4.0/).
Share and Cite
Wu, K.-L.; Shan, L. Correction: Wu, K.-L.; Shan, L. Make Way for the Wind—Promoting Urban Wind Corridor Planning by Integrating RS, GIS, and CFD in Urban Planning and Design to Mitigate the Heat Island Effect. Atmosphere 2024, 15, 257. Atmosphere 2024, 15, 1214. https://doi.org/10.3390/atmos15101214
Wu K-L, Shan L. Correction: Wu, K.-L.; Shan, L. Make Way for the Wind—Promoting Urban Wind Corridor Planning by Integrating RS, GIS, and CFD in Urban Planning and Design to Mitigate the Heat Island Effect. Atmosphere 2024, 15, 257. Atmosphere. 2024; 15(10):1214. https://doi.org/10.3390/atmos15101214
Chicago/Turabian StyleWu, Kang-Li, and Liang Shan. 2024. "Correction: Wu, K.-L.; Shan, L. Make Way for the Wind—Promoting Urban Wind Corridor Planning by Integrating RS, GIS, and CFD in Urban Planning and Design to Mitigate the Heat Island Effect. Atmosphere 2024, 15, 257" Atmosphere 15, no. 10: 1214. https://doi.org/10.3390/atmos15101214
APA StyleWu, K.-L., & Shan, L. (2024). Correction: Wu, K.-L.; Shan, L. Make Way for the Wind—Promoting Urban Wind Corridor Planning by Integrating RS, GIS, and CFD in Urban Planning and Design to Mitigate the Heat Island Effect. Atmosphere 2024, 15, 257. Atmosphere, 15(10), 1214. https://doi.org/10.3390/atmos15101214