Article

Determining the Axial Orientations of a Large Number of Flux Transfer Events Sequentially Observed by Cluster during a High-Latitude Magnetopause Crossing

1
College of Physics and Electronics, Hunan Institute of Science and Technology, Yueyang 414006, China
2
State Key Laboratory of Space Weather, National Space Science Center, Chinese Academy of Sciences, Beijing 100190, China
*
Author to whom correspondence should be addressed.
Atmosphere 2024, 15(10), 1215; https://doi.org/10.3390/atmos15101215
Submission received: 12 August 2024 / Revised: 7 October 2024 / Accepted: 9 October 2024 / Published: 11 October 2024
(This article belongs to the Special Issue Research and Space-Based Exploration on Space Plasma)

Abstract

:
Flux transfer events (FTEs) are magnetic structures generally believed to originate from time-varying magnetic reconnection at the Earth’s magnetopause. Despite years of research, the mechanism of how FTEs are formed through reconnection remains controversial. In various models, FTEs exhibit different global configurations. Studying the FTE axial orientation can provide insights into their global shape, thereby helping to distinguish the generation mechanisms. In this paper, taking advantage of the orbital characteristics of the four Cluster spacecraft, we devised a multi-spacecraft timing method to determine the axes of a total of 57 FTEs observed sequentially by Cluster during a high-latitude duskside magnetopause crossing. During the nearly five-hour observation, the interplanetary magnetic field (IMF) experienced a large rotation, leading to a substantial rotation of the magnetosheath magnetic field. The analysis results show two new features of the FTE axis that have not been reported before: (1) the axes of the FTEs gradually rotate in response to the turning of the IMF and the magnetosheath magnetic field; (2) the axes of the FTEs vary between the direction of the magnetosheath magnetic field and the direction of the reconnection X-line. These features indicate that FTEs may have a more complex global configuration than depicted by traditional FTE models.

1. Introduction

Magnetic reconnection occurring at the Earth’s magnetopause is an important physical process that can transport energy and mass from solar wind to the Earth’s inner magnetosphere. It is generally believed that when the interplanetary magnetic field (IMF) is southward, reconnection occurs at the low-latitude dayside magnetopause, and when the IMF is northward, the reconnection may occur between the magnetosheath and lobe magnetic fields at high latitudes (e.g., [1,2,3,4]).
When reconnection occurs in a time-varying manner, it generates a magnetic structure termed as a flux transfer event (FTE), which manifests in satellite measurements as a bipolar variation in the normal component of the magnetic field ( B n ). Despite years of research, the mechanism of how FTEs are formed through reconnection remains controversial. Russell and Elphic [5,6] proposed that the magnetosheath magnetic field and the magnetospheric magnetic field connect through a very localized region at the magnetopause, forming an elbow-shaped configuration; however, in the multiple X-line reconnection model proposed by Lee and Fu [7], reconnection can occur along multiple extended X-lines, forming a natural helical magnetic flux rope. In the single X-line reconnection model by Scholer [8], reconnection proceeds continuously along a single elongated X-line, but due to variations in the reconnection rate, bubble-like structures are released from the reconnection sites. So far, there is considerable evidence supporting each of these three models (see the comprehensive reviews by Paschmann et al. [9] and Zhang et al. [10]).
It is generally believed that the global configuration of FTEs in the elbow model proposed by Russell and Elphic differs from that in the single X-line or multiple X-line reconnection models. In the elbow-shaped model, FTEs consist of the magnetospheric branch, the magnetosheath branch, and the bend that connects them; unless the satellite happens to encounter the bend, the observed FTE axis will mainly align with the direction of the magnetospheric or magnetosheath magnetic field. In contrast, in the single/multiple X-line models, regardless of whether the satellite encounters a bubble-like structure or a twisted flux rope, the FTE axis will follow the direction of the reconnection X-line [11]. Therefore, studying the axis of FTEs may help us differentiate the former model from the latter two. Overall, previous related research seems to be more supportive of the configurations depicted in the latter two models. For instance, Fear et al. [12] studied a series of FTEs observed at the dayside magnetopause under high magnetic shear and found that their axes were more likely to be aligned with the reconnection X-line pointing in the dawn–dusk direction rather than along the magnetosheath/magnetospheric magnetic field direction pointing north–south, indicating that these flux tubes may have formed along a longer reconnection line rather than resembling an elbow-shaped flux tube. Using joint observations from THEMIS (Time History of Events and Macroscale Interactions during Substorms) and ARTEMIS (Acceleration, Reconnection, Turbulence and Electrodynamics of the Moon’s Interaction with the Sun), Eastwood et al. [13] found that FTEs formed at the dayside magnetopause initially aligned with the X-line direction and were bent during subsequent propagation in the tailward direction. Utilizing data from TC1, Trenchi et al. [14] observed an FTE that passed near the reconnection line, with its axis parallel to the X-line, suggesting that its formation mechanism is closer to the single/multiple X-line reconnection model rather than the elbow-shaped model. Trenchi et al. [15] also studied a series of FTEs observed by Cluster at the subsolar magnetopause, one of which could be well reconstructed using the GS method, and its axis was nearly parallel to the X-line, consistent with the single/multiple X-line reconnection model. However, they also found that the axes of other FTEs exhibited significant variations despite relatively stable conditions, and they inferred that this might be due to the different reconnection onset times or reconnection rates along the X-line.
However, there is also observational evidence suggesting that FTEs may have a more complex three-dimensional configuration at the magnetopause. Wang et al. [16] found that the axes of FTEs observed by TC1 in the low-latitude region were aligned with the low-latitude component reconnection X-line, while at the same time, the axes of FTEs observed by Cluster in the high-latitude polar region were roughly pointing in the IMF direction. From this, they concluded that the global configuration of FTEs is more consistent with the elbow-shaped model. Moreover, Zhong et al. [17] studied an FTE observed by THEMIS at the dayside magnetopause, which has been proven to be formed by multiple X-line reconnection. They found that the azimuthally extended section of this FTE was parallel to the direction of the X-line, while the axis of the magnetospheric branch was essentially aligned with the local unperturbed magnetospheric field lines, exhibiting a complex three-dimensional geometry.
From the aforementioned studies, it is evident that systematic research on the orientation of FTEs can provide valuable information about their global configuration, thereby addressing important questions such as how FTEs are generated by reconnection and how they evolve subsequently. However, due to the limitations of the methods for determining the axis orientation (see Li et al. [18] for an overview), there are still relatively few such studies. In this paper, we use a multi-spacecraft timing method to determine the axes of a total of 57 FTEs sequentially observed by Cluster during a high-latitude duskside magnetopause crossing. At the time, the four Cluster spacecraft formed a tetrahedral configuration, allowing the axes of the FTEs to be well determined using the timing method. During the nearly five-hour crossing, the B z component of the IMF remained positive, but changes in its B x and B y components caused a significant directional rotation. Our analysis clearly demonstrates the impact of such a rotation on the orientation of the FTEs. Additionally, the results show that the axes of the observed events are confined between the direction of the reconnection X-line and the magnetosheath magnetic field. These findings will be discussed within the framework of the main FTE models cited above.

2. Event Overview

2.1. Instrumentation and Data

In this paper, we present in situ measurements from the four-spacecraft Cluster mission [19], using the spin resolution ( ~ 4   s ) data of magnetic fields and ion moments from the Cluster Fluxgate Magnetometer instruments (FGM) [20] and the Hot Ion Analyzer on the Cluster Ion Spectrometry instrument (CIS-HIA), respectively [21]. The upstream solar wind conditions are derived from 5 min averaged data at the bow shock nose provided by the OMNI high-resolution data set [22]. Unless otherwise specified, vectors are expressed in the Geocentric Solar Magnetospheric (GSM) coordinate system throughout this paper.

2.2. Locations and Trajectories

As shown in Figure 1a,b, during the time interval from 09:40 to 14:50 UT on 10 November 2002, the four spacecraft were located near the duskside magnetopause at the high-latitude tailward of the southern cusp. At the beginning of this interval, C1 was located at ( 5.7 ,   13.0 , 12.0 )   R E in the GSM coordinate system, while the relative positions of C2, C3, and C4 with respect to C1 were ( 1045 ,   3074 ,   534 ) , ( 1126 ,   2955 , 2271 ) , and ( 3586 ,   5467 ,   645 )   km in GSM, respectively, forming an irregular tetrahedron with the shortest side of ~ 2800   km , the longest side of ~ 6600   km , and the average side of ~ 4100   km . During this interval, the Cluster tetrahedron was mainly moving sunward and dawnward. Figure 1c,d shows the relative positions of the four Cluster spacecraft in the local LMN coordinate system, where N is directed outward along the magnetopause normal, L is along the projection of the Earth’s magnetic dipole on the magnetopause plane, and M completes the right-handed coordinate system. The magnetopause normal N was obtained through a minimum variance analysis of the magnetic field data (MVAB) [23] when the four spacecraft crossed the magnetopause (which will be discussed in more detail in Section 2.5). In the GSM coordinate, the L, M, and N unit vectors are ( 0.130 ,   0.624 ,   0.770 ) , ( 0.878 , 0.434 ,   0.203 ) , and ( 0.461 ,   0.650 , 0.604 ) , respectively. It can be seen that, in the magnetopause plane (i.e., the LM plane), the Cluster constellation extended ~ 3400   km in the L direction and ~ 5400   km in the M direction. Perpendicular to the magnetopause (i.e., in the N direction), the constellation had a smaller extension of ~ 2800   km , with C1 at the innermost, C3 at the outermost, and C2 and C4 in between. In the LMN coordinate, the positions of C2, C3, and C4 relative to C1 were ( 2194 , 2142 ,   1195 ) , ( 52 , 2731 ,   2775 ) , and ( 3443 , 5388 ,   1512 )   km , respectively. During the event, Cluster primarily moved along the magnetopause, traveling ~ 15,000   km in the M direction, a significantly smaller distance of ~ 5000   km in the L direction, but with almost no movement in the N direction.

2.3. Solar Wind Condition

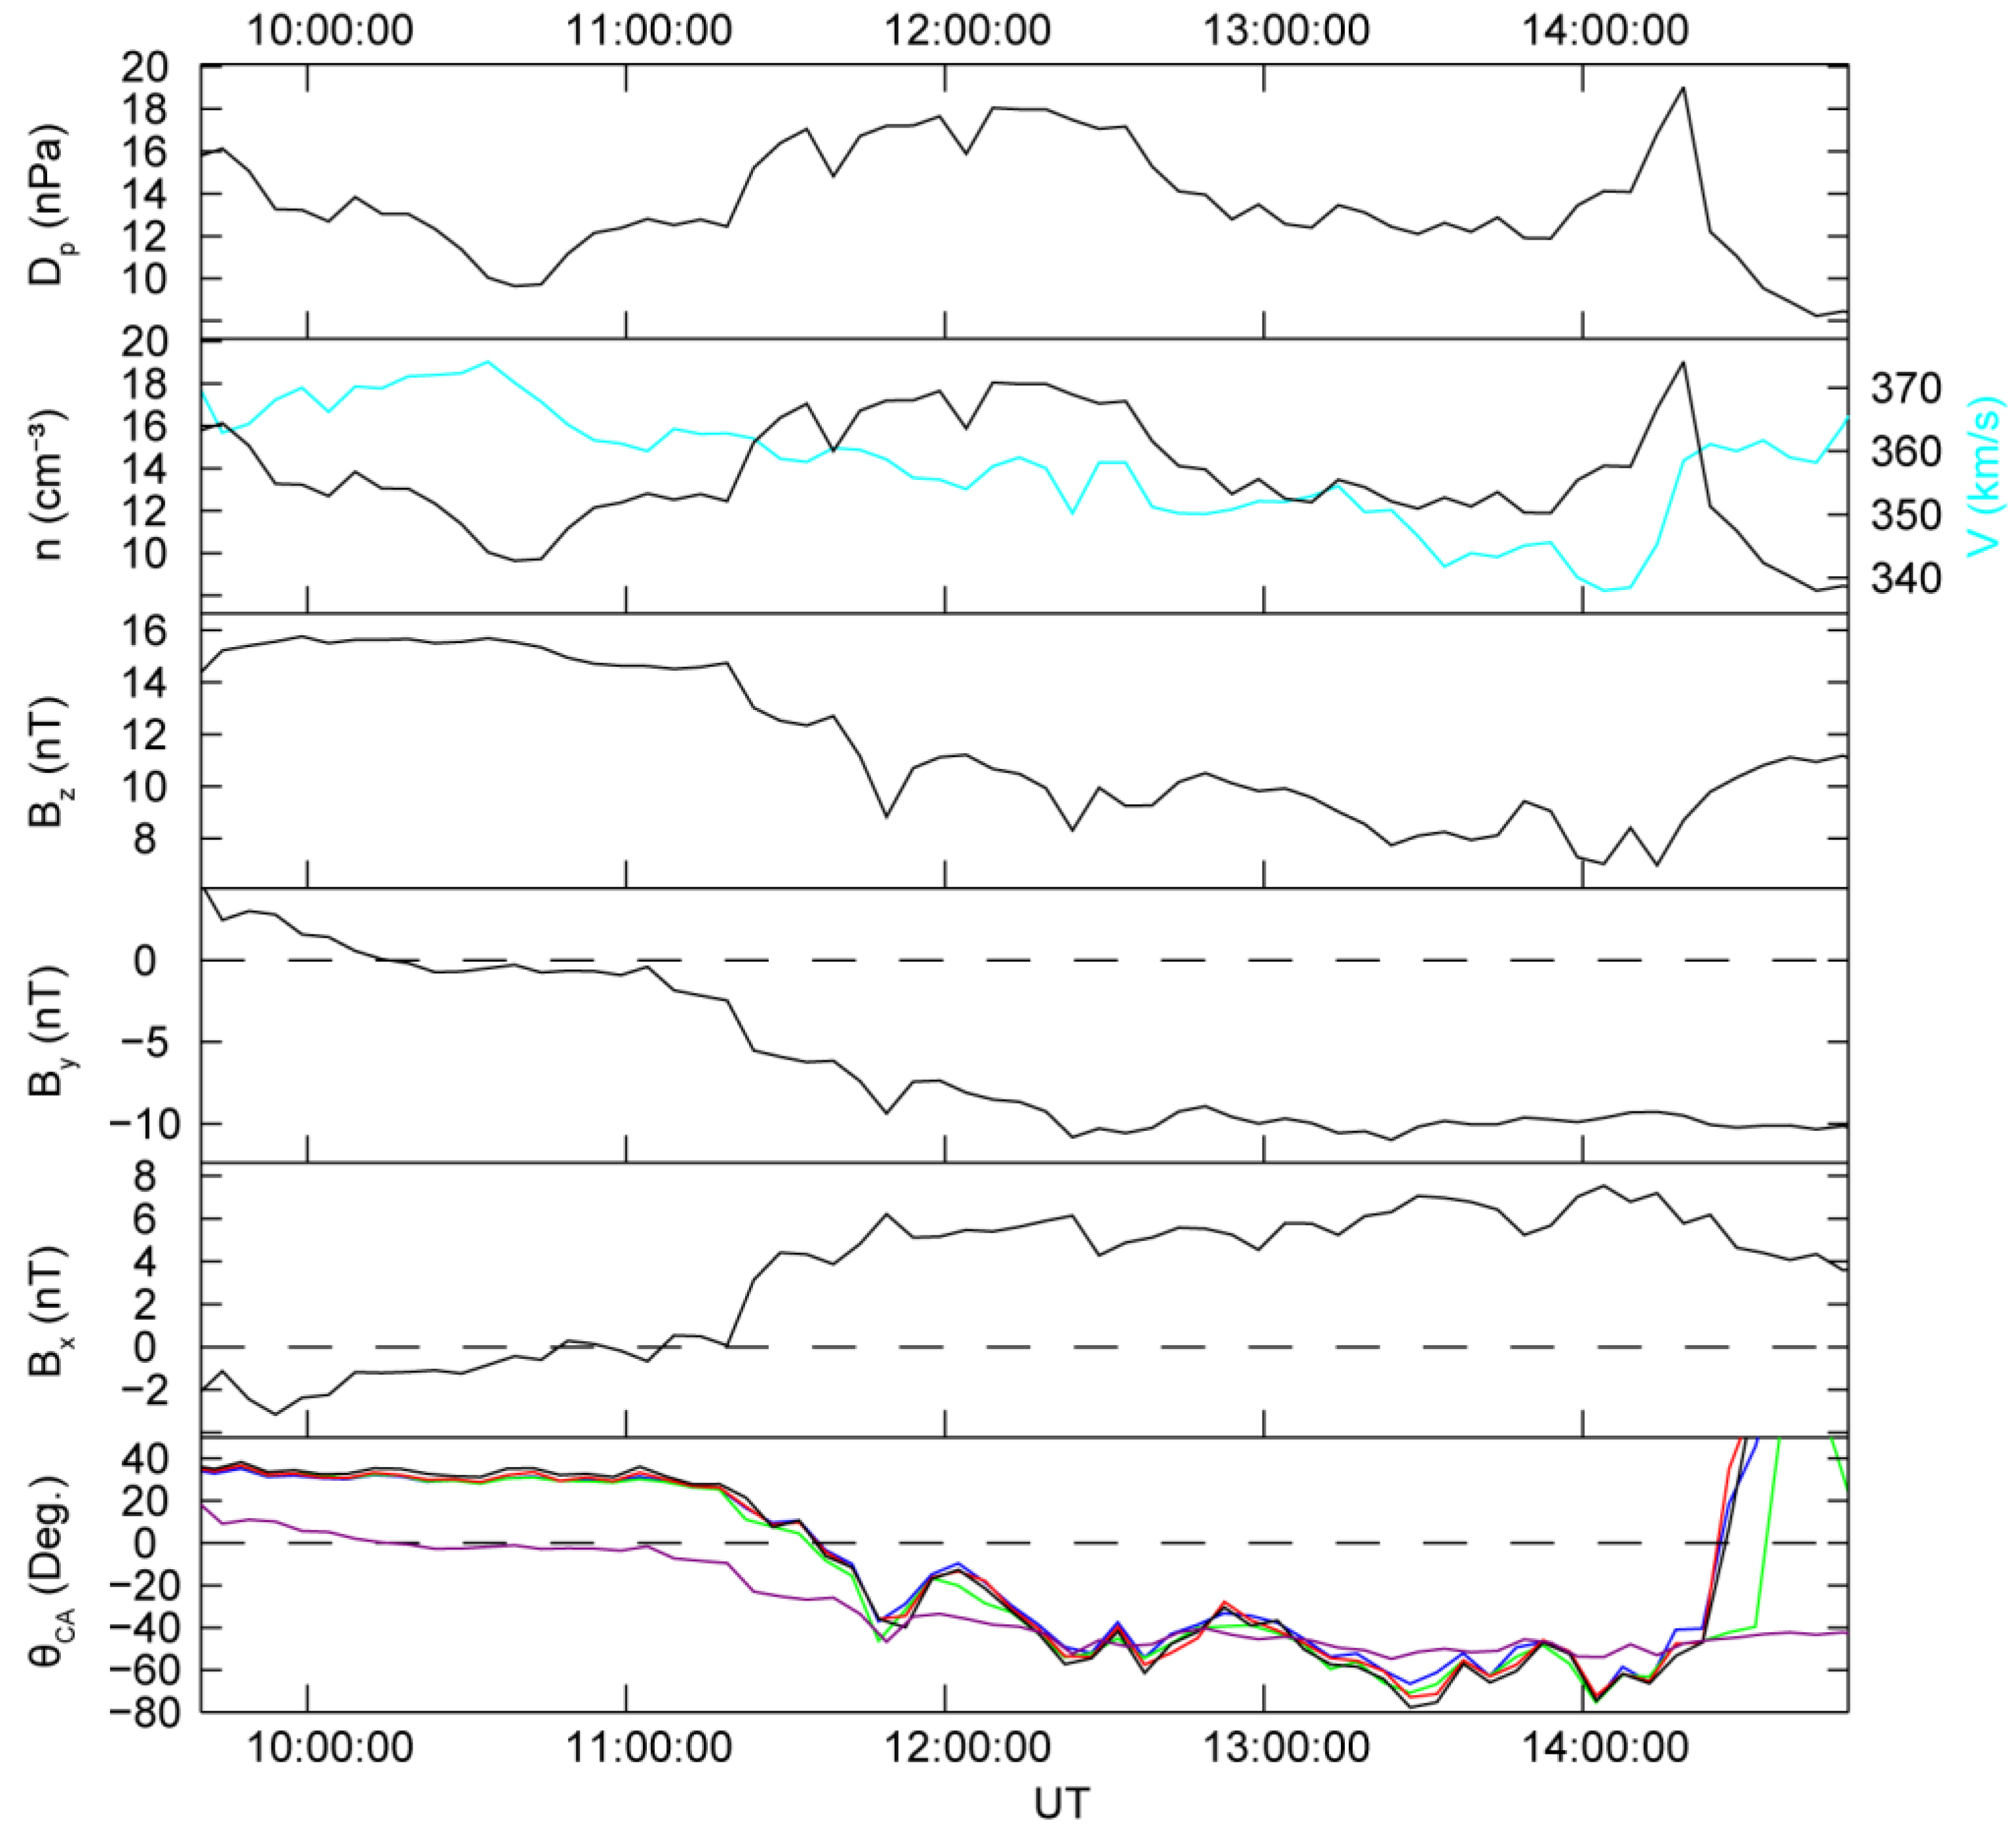
Figure 2 presents the solar wind data observed during the time interval of interest. The data are time-shifted by ~ 14 min by comparing the features of the plasma and magnetic field in the solar wind and the magnetosheath. During the observation interval, the solar wind plasma parameters remained relatively stable, and the density, flow speed, and dynamic pressure varied around average values of 13.6   cm 3 , 357.5   km / s , and 2.9   nPa , respectively. Except for a sudden increase around 14:20 UT, there was an overall gradual decrease in density and dynamic pressure after 12:00 UT, which might have caused a slight outward expansion of the magnetopause, leading to the spacecraft in the magnetosheath crossing the magnetopause into the magnetosphere. On the other hand, the solar wind magnetic field exhibited more noticeable variations. The B x and B y components reversed their signs, changing from ~ 4 to ~ 6   nT and from ~ 5 to ~ 10   nT , respectively, while the B z component decreased from ~ 15 to ~ 8   nT but stayed positive during the whole time interval. Due to these changes, the IMF direction gradually rotated from northward and slightly duskward to northward and dawnward, with the IMF clock angle (defined as θ C A = tan 1 ( B y / B z ) , where 0 ° corresponds to the IMF pointing northward, 90 ° to dawnward, and 90 ° to duskward) experiencing a significant change from ~ 10 ° to ~ 50 ° .

2.4. Cluster Observations

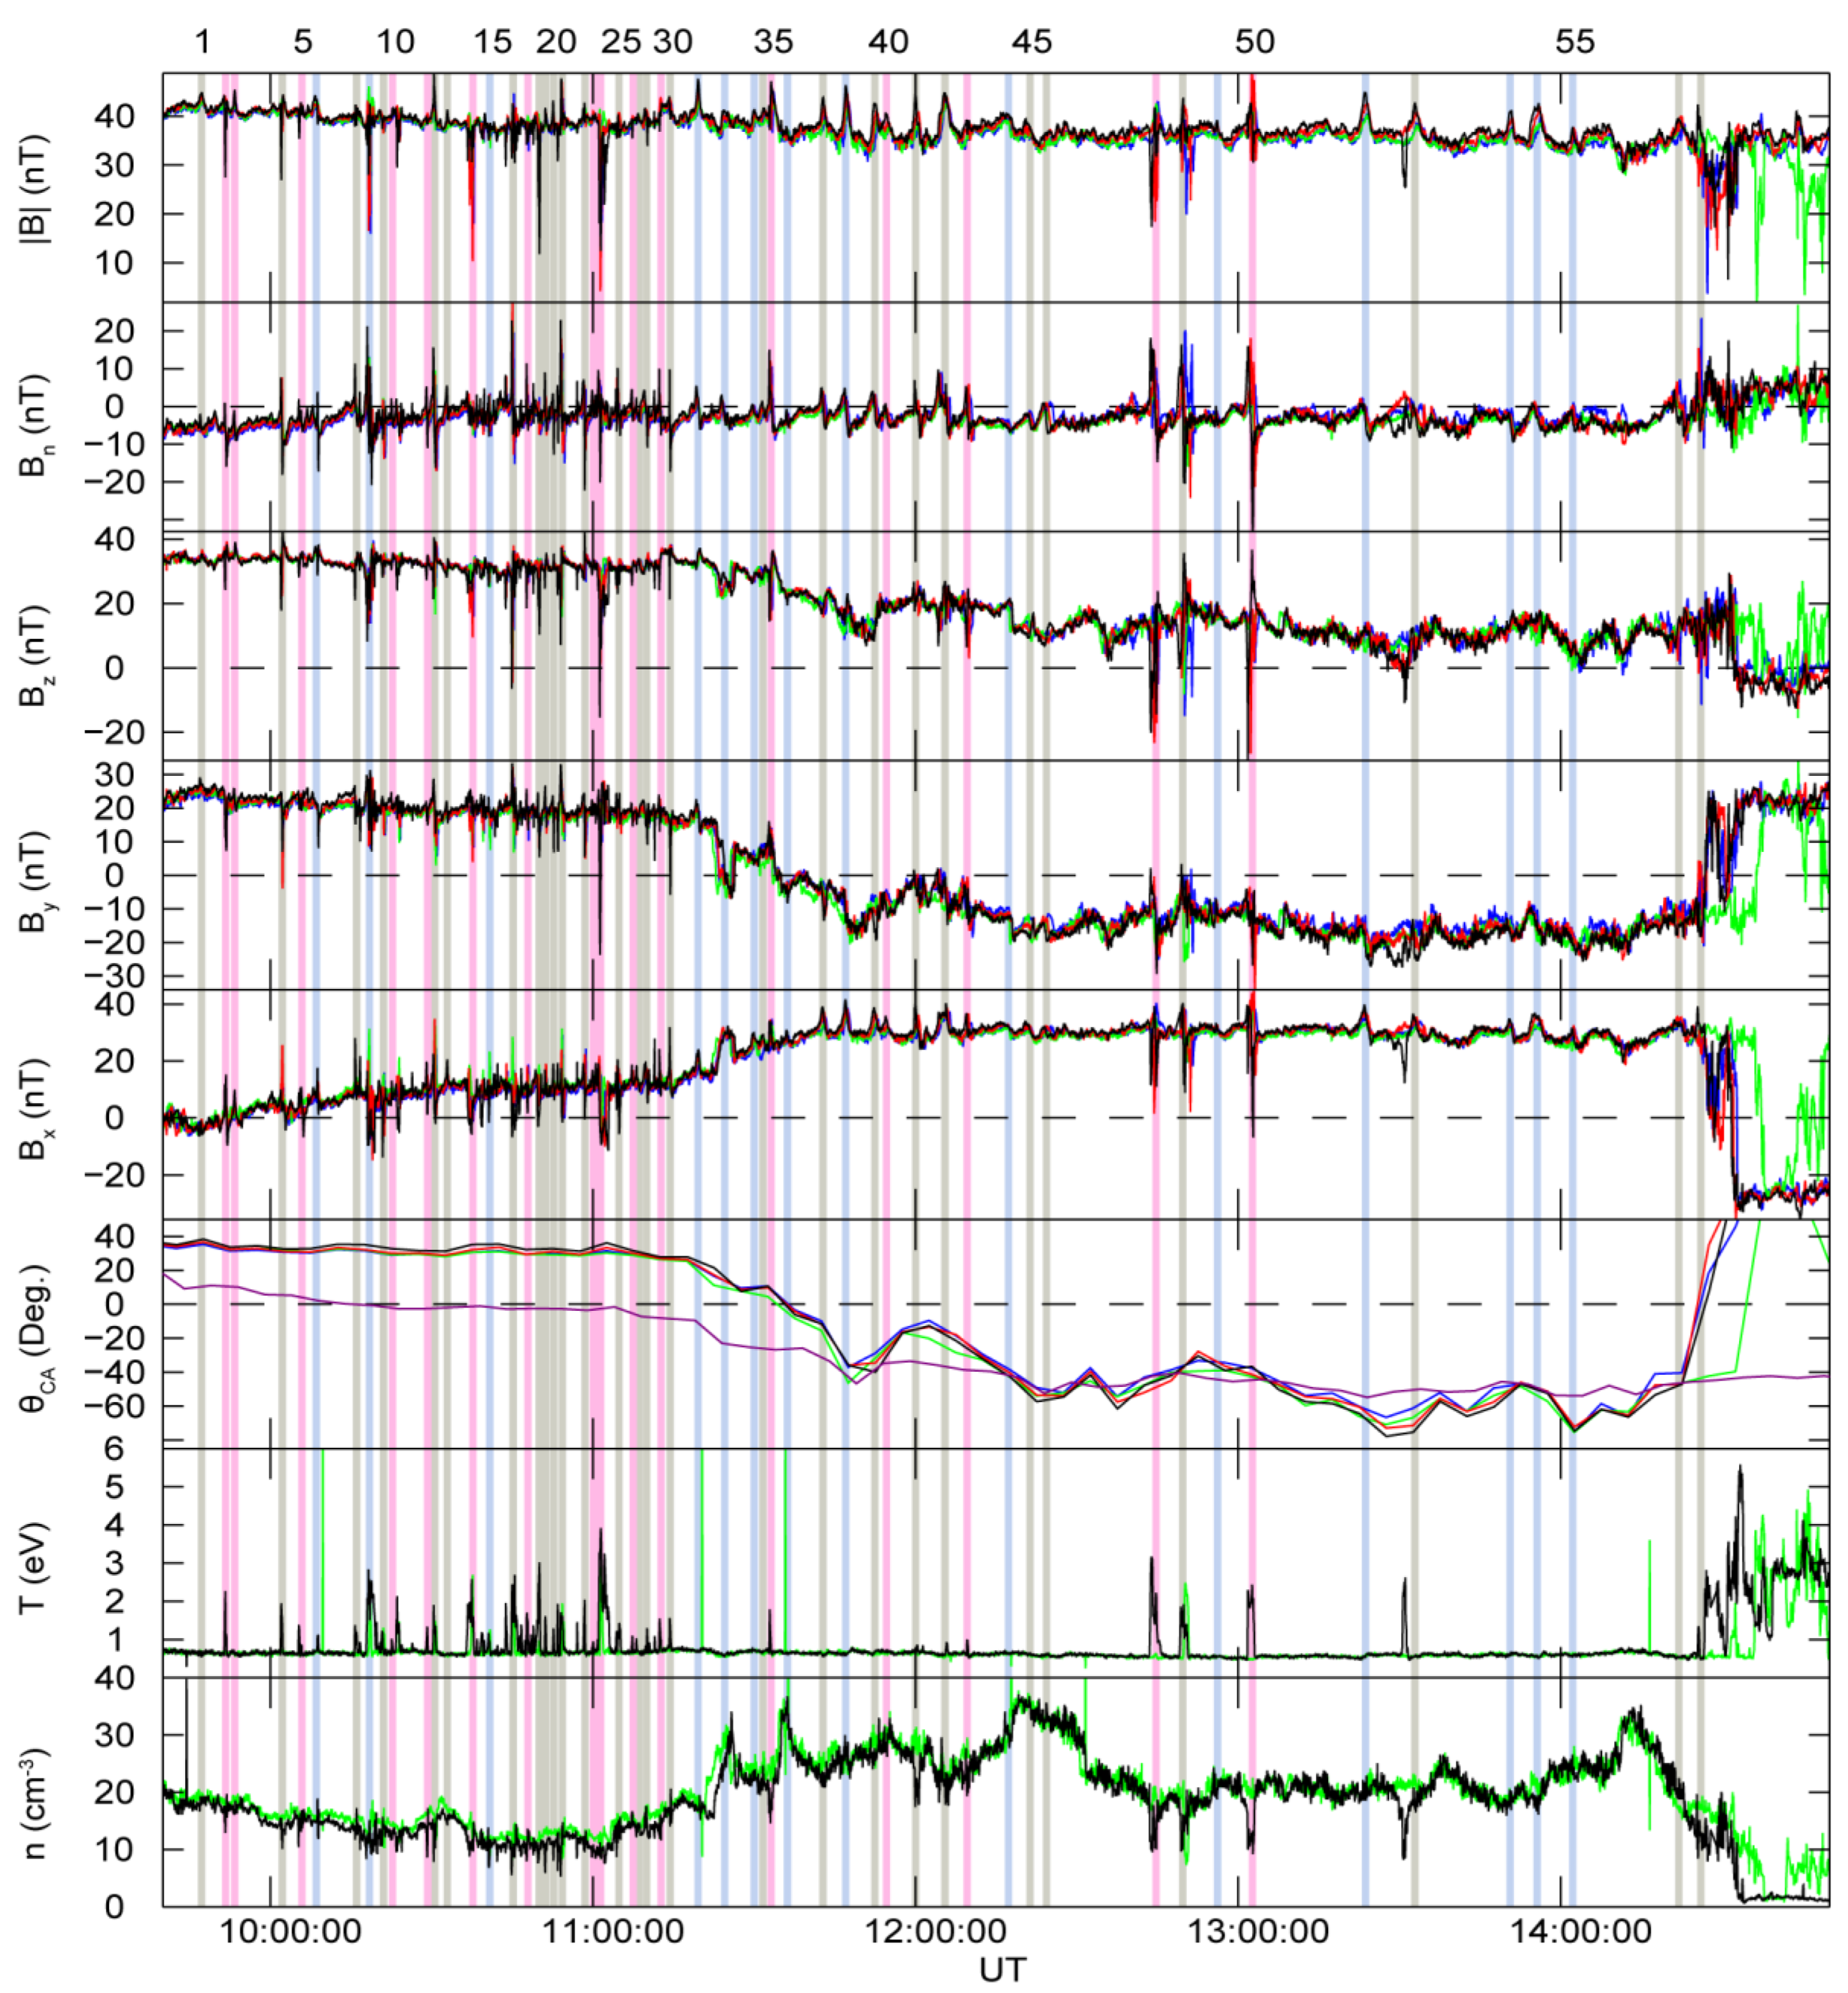
Figure 3 presents observations from the four Cluster spacecraft. Until 14:30 UT, Cluster remained in the magnetosheath, characterized by high ion density and low temperature. Variations in the magnetic field, clock angle, and ion density within the magnetosheath were highly correlated with the corresponding parameters in the solar wind. The B y component of the magnetic field reversed sign from ~ 20 to ~ 20   nT , while the B x and B z components changed from ~ 0 to ~ 30   nT and from ~ 35 to ~ 10   nT , respectively. The corresponding clock angle rotated from ~ 40 ° to ~ 60 ° , exhibiting a larger rotation than that of the solar wind, possibly due to the draping effect around the magnetopause. Around 14:30 UT, the four spacecraft successively crossed the magnetopause and entered the magnetosphere, characterized by low ion density and high temperature. The magnetospheric magnetic field averaged from the measurement of C1 during 14:36:23–14:53:18 UT is ( 27.4 ,   22.7 , 5.0 )   nT , consistent with the Tsyganenko01 model [24] magnetic field shown as the dotted line in Figure 1.
In addition to the large rotation of the magnetosheath magnetic field, another remarkable feature during this time interval is the emergence of a large number of FTEs, manifested by the bipolar variation of B n and the enhancement of magnetic field magnitude. A total of 57 events (labeled chronologically as events 1–57 and highlighted with colored shadings, as shown in Figure 3) were identified, with an average occurrence frequency of about 5 to 6 min, and a higher frequency in the first half of the interval compared to the second half. In addition to the magnetic field signals, some events were also accompanied by an increase in plasma temperature and a decrease in density, indicating that these events brought the magnetosphere closer to the spacecraft as they passed.

2.5. Magnetopause Normal

In this subsection, we use the MVAB method to determine the normal to the magnetopause near the observation site. The MVAB is devised based on the assumption that the observed magnetic field structure is one-dimensional. By solving the following eigenvalue equation
ν = 1 3 M μ ν B n ν = λ n μ
where the subscript μ , ν = 1 , 2 , 3 denote the Cartesian components, and
M μ ν B = 1 N i = 1 N B μ ( i ) B ν ( i ) [ 1 N i = 1 N B μ ( i ) ] [ 1 N i = 1 N B ν ( i ) ]
is the magnetic variance matrix constructed from a total of N measured magnetic field data, the three eigenvalues λ 1 , λ 2 , and λ 3 (where λ 1 > λ 2 > λ 3 ) and the corresponding eigenvectors x ^ 1 , x ^ 2 , and x ^ 3 can be obtained. The eigenvector x ^ 3 , corresponding to the minimum variance, can be used as the estimator for the vector normal to magnetopause, and λ 3 represents the variance of the magnetic field component along this direction.
The four Cluster spacecraft (C1–C4) successively crossed the magnetopause from the magnetosheath into the magnetosphere at 14:31:52, 14:32:04, 14:37:18, and 14:32:49 UT, respectively. Applying the MVAB to the combined magnetic field data of these spacecraft for three minutes before and after crossing the magnetopause (C1: 14:30:22–14:33:22; C2: 14:30:34–14:33:34; C3: 14:35:48–14:38:48; C4: 14:31:19–14:34:19), the maximum, intermediate, and minimum eigenvalues of the magnetic variance matrix were obtained as λ 1 = 696.6 , λ 2 = 46.1 , and λ 3 = 12.7   ( nT ) 2 , respectively, with the corresponding eigenvectors x ^ 1 = 0.887 , 0.353 ,   0.296 , x ^ 2 = 0.021 , 0.673 , 0.740 , and x ^ 3 = 0.461 ,   0.650 , 0.604 .
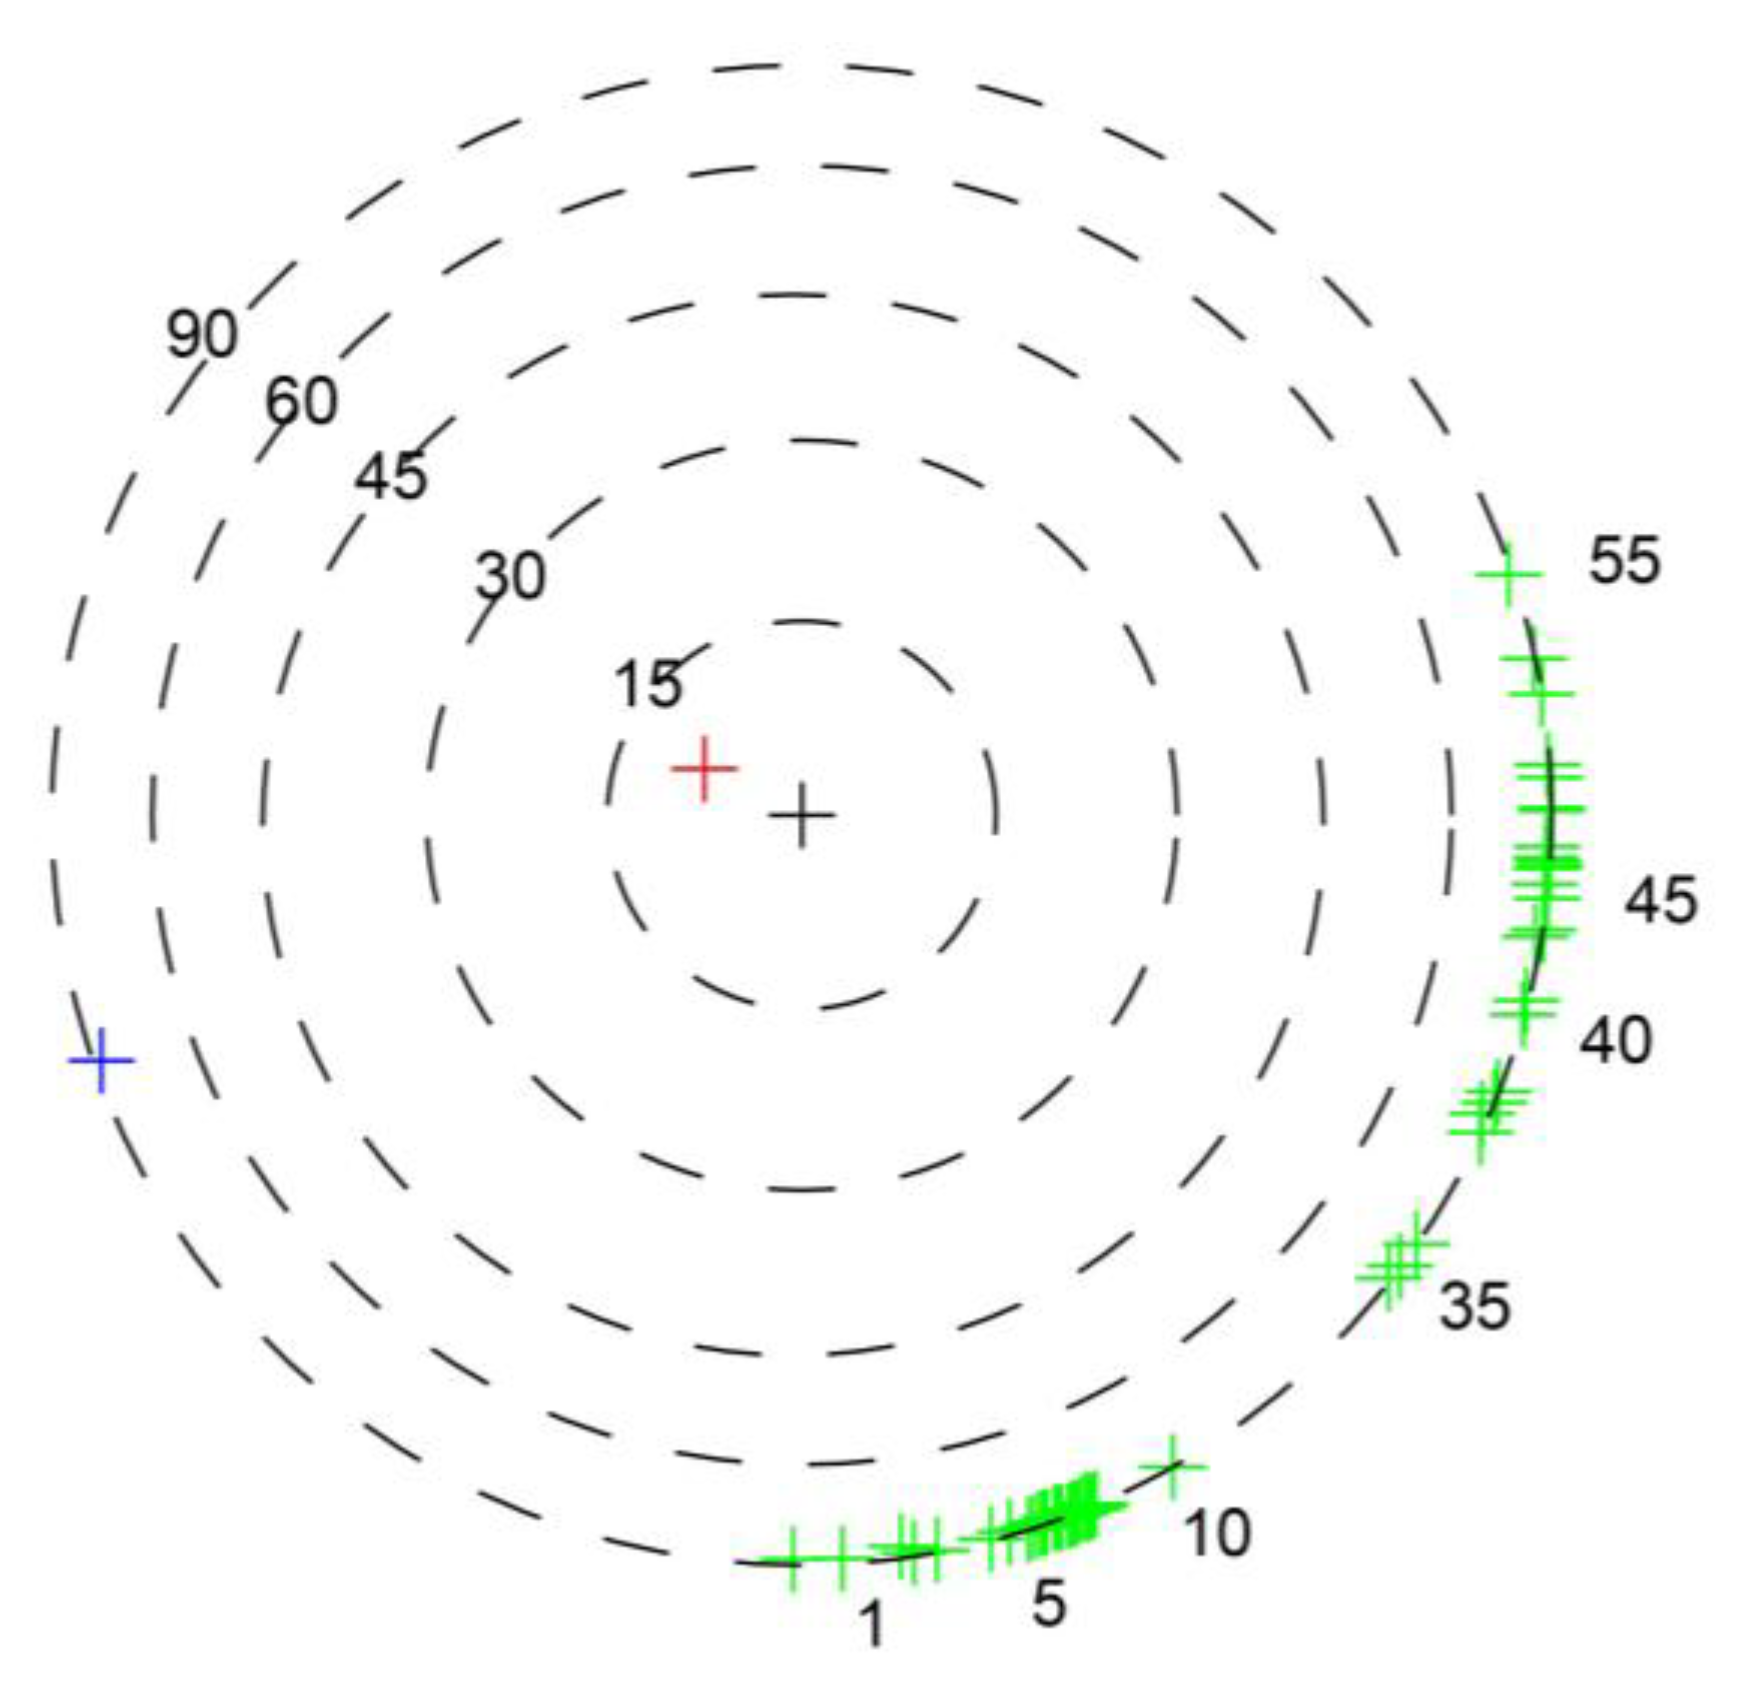
To verify that the obtained x ^ 3 represents the true normal direction of the magnetopause, we also used the Shue98 magnetopause model [25] to calculate the model magnetopause normal direction n ^ s 98 , relevant to the spacecraft locations. At the particular position of the spacecraft, n ^ s 98 = ( 0 . 341 ,   0 . 645 ,   0.684 ) in the GSM coordinate system. As shown in Figure 4, x ^ 3 is very close to n ^ s 98 , with an angle of only 8.2 ° . Additionally, in Figure 4, it can be seen that x ^ 3 is nearly perpendicular to the measured magnetospheric magnetic field and the magnetosheath magnetic field near each event, which is consistent with the magnetopause being approximated as a tangential discontinuity. These indicate that x ^ 3 accurately represents the normal direction of the magnetopause, so we take n ^ m p = x ^ 3 .

3. FTE Orientations from Multi-Spacecraft Timing Analysis

3.1. Multi-Spacecraft Timing Analysis

Taking advantage of the orbital configuration of the Cluster constellation during the observation interval, we devise a multi-spacecraft timing method similar to that used by Trenchi et al. [15] to determine the axes of all 57 FTEs mentioned above. This method is based on the following assumptions: (1) FTEs are contained within the magnetopause plane and move along the magnetopause; (2) the magnetic field structure does not change with time as the FTE passes by the satellite. Therefore, the signals of B n bipolar variation observed by all satellites should be similar, with the only difference being the timing of their appearance, due to the different times of the FTE passing by each satellite. The process of determining the FTE axes using this method is as follows: (1) determine the velocity of the FTE structure using the DeHoffmann–Teller (HT) analysis [26]; (2) take a trial axis on the LM plane and calculate the time difference of the FTE passing by each satellite assuming the FTE is along this axis; (3) time-shift the Bn curves measured by each satellite by the corresponding time difference and then calculate the synchronization rate of these time-shifted Bn curves (measured by the average Pearson’s correlation coefficient); (4) rotate the trial axis on the LM plane to find the axis with the highest synchronization rate, which is taken as the optimal FTE axis. In the following, we first select two events as benchmark cases, and then present the analysis results for all events.

3.2. Case Event 1 (~11:19:33 UT)

As shown in Figure 5a, this FTE (labeled as FTE31) appears around 11:19:33 UT. We determine its axis as follows:
(1) Calculate the velocity of the FTE. By performing HT analysis on the data from C3 between 11:19:03 and 11:20:03 UT, we obtain V H T = ( 243.8 ,   135.1 , 33.6 )   km / s and c c H T = 0 . 9995 , indicating the existence of an excellent HT coordinate system in which the FTE can be regarded as magnetically stationary. The angle between V H T and the magnetopause normal n ^ m p is 90.8 ° , indicating that the FTE is indeed moving along the magnetopause.
(2) Take a trial axis. As shown in Figure 5a, project the spacecraft positions at the time of the event and V H T onto the LM plane. Select C1 as the reference spacecraft and its projected position as the origin. Take a trial axis on the LM plane that passes through C1 and set the angle between this axis and the L-axis as θ . As an initial trial axis, we start with θ = 90 ° , which corresponds to an axis direction of Z ^ = ( 0.878 ,   0.434 , 0.203 ) in GSM. According to the geometric relationship, it is easy to calculate that the FTE’s speed perpendicular to the axis on the LM plane is | V | = 26 . 7   km / s . The distances from the projected positions of C2, C3, and C4 to the axis are 2156, 227, and 3873 km, respectively, where a positive sign indicates that the spacecraft is on the side of V and a negative sign indicates that the spacecraft is on the opposite side. Consequently, the time differences for the FTE to pass by C1–C4 are 0, 80.6, 8.5, and 144.8 s, respectively.
(3) Calculate the synchronization coefficient of the time-shifted B n curves. Select a four-minute time interval around the event (from 11:17:33 to 11:21:33 UT), keep the B n curve of C1 unchanged, and shift the B n curves of C2–C3 along the time axis to the left by 80.6, 8.5, and 144.8 s, respectively. To measure the synchronization rate of these four curves within the chosen time interval, the following synchronization coefficient is defined:
χ = < P i j >
where the angle brackets < > denote the average and P i j is the linear Pearson correlation coefficient of the time-shifted B n curves between the i-th and j-th spacecraft in Cluster. The value of P i j ranges from 1 to 1 , and P i j = 1 indicates complete synchronization of the two curves. For the current event and the current trial axis, we obtain χ = 0 . 187 , indicating a poor synchronization rate, and hence the current axis is not the correct one.
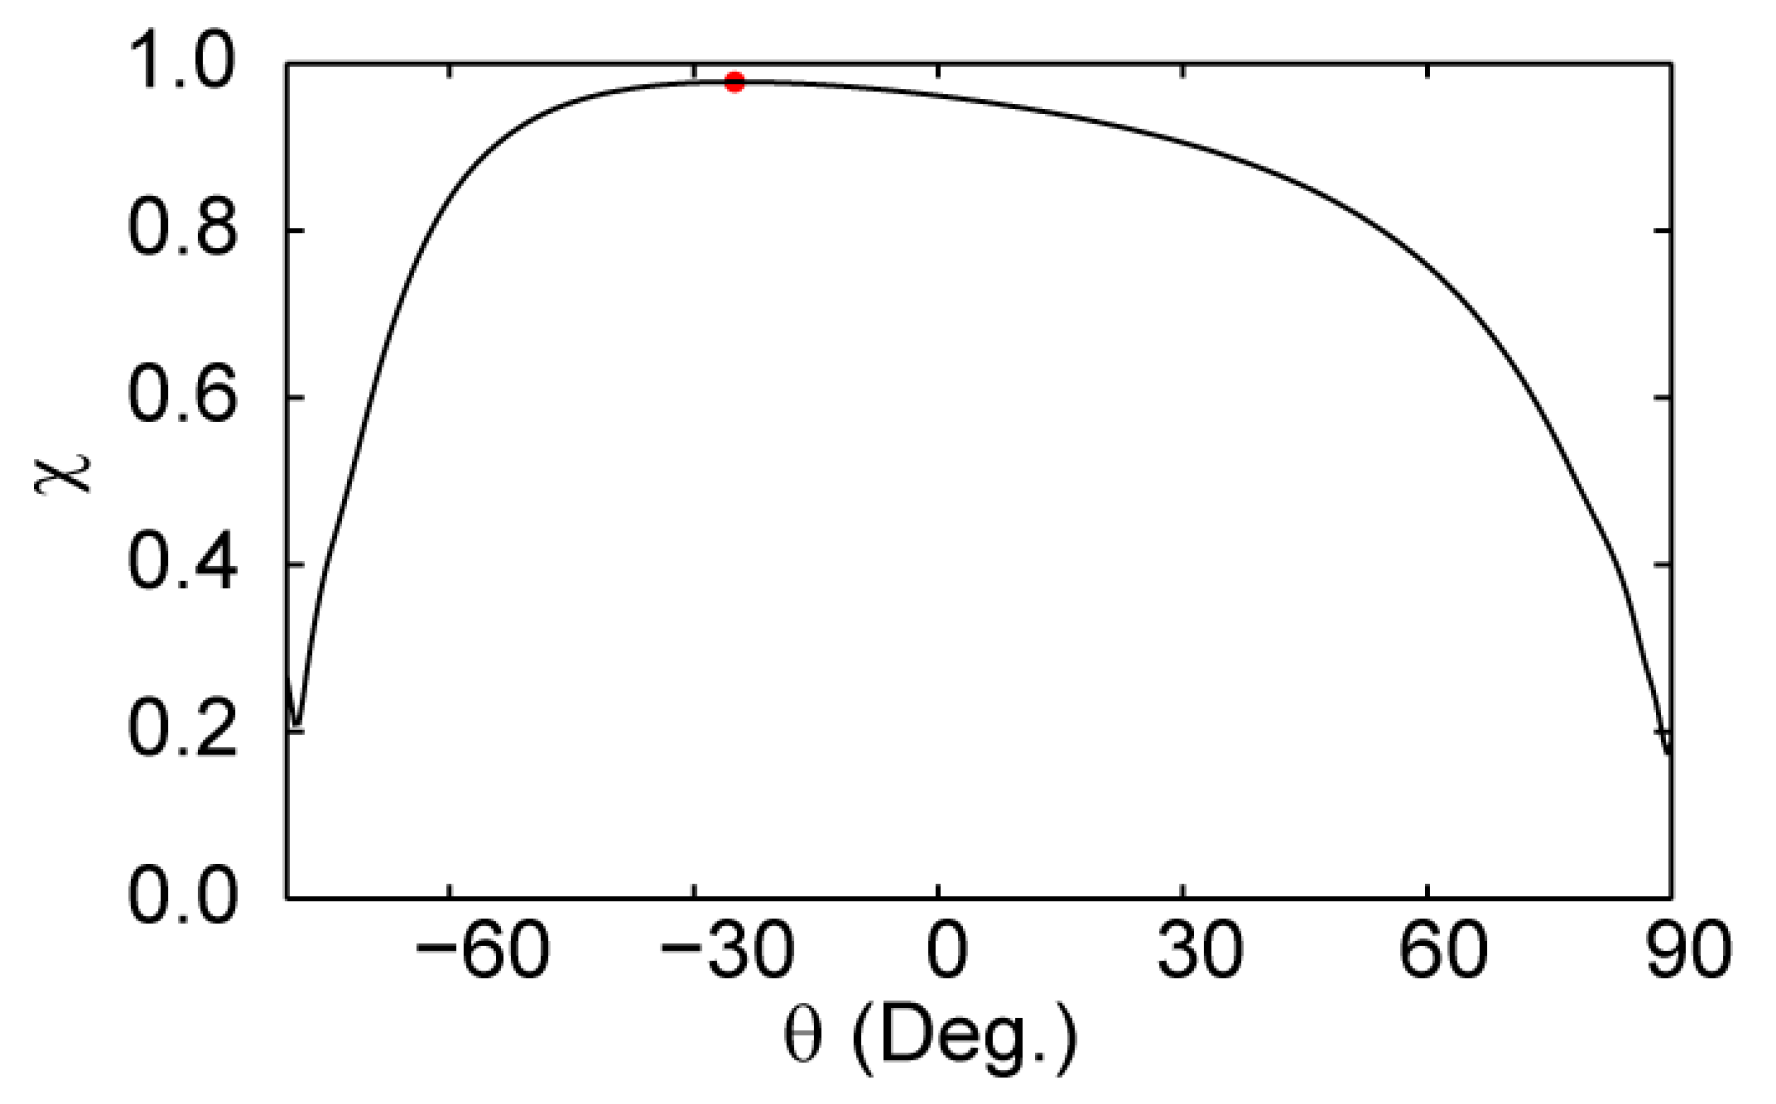
(4) Determine the optimal axis. Rotate the trial axis on the LM plane and repeat steps (2) and (3) to obtain the functional relationship χ ( θ ) of χ varying with θ . As shown in Figure 6, at θ = 25 ° , χ reaches its maximum value of 0.978, and the corresponding optimal axis is Z ^ a x i s = ( 0 . 253 ,   0 . 749 ,   0 . 613 ) in GSM. The obtained time difference for the FTE to pass through C1–C4 is 0, 6.2, 12.0, and 15.5 s, respectively. After time-shifting the B n curves of C2–C3 by the corresponding time differences, as shown in Figure 5b, it can be seen that all the curves are nearly synchronized now.
Finally, in Figure 5c, we plot the obtained FTE axis, magnetosheath magnetic field, magnetospheric magnetic field, and reconnection X-line together on the LM plane. The magnetosheath magnetic field B m s h = ( 17 . 1 ,   16 . 4 ,   31 . 6 )   nT was obtained by averaging the magnetic field data measured by C3 from 11:18:31 to 11:18:57 UT, during which time C3 was fully immersed in the magnetosheath near the FTE. According to the component merging model [27,28], we use the following formula to calculate the direction of the reconnection X-line:
Z ^ x l i n e = n ^ m p × ( B m s p h B m s h ) | n ^ m p × ( B m s p h B m s h ) |
thereby obtaining Z ^ x l i n e = ( 0.347 ,   0.759 ,   0.552 ) in GSM for this event. As can be seen from the figure, the FTE axis is very close to the reconnection X-line, with the angle between the two being only 6.4 ° .

3.3. Case Event 2 (~11:42:47 UT)

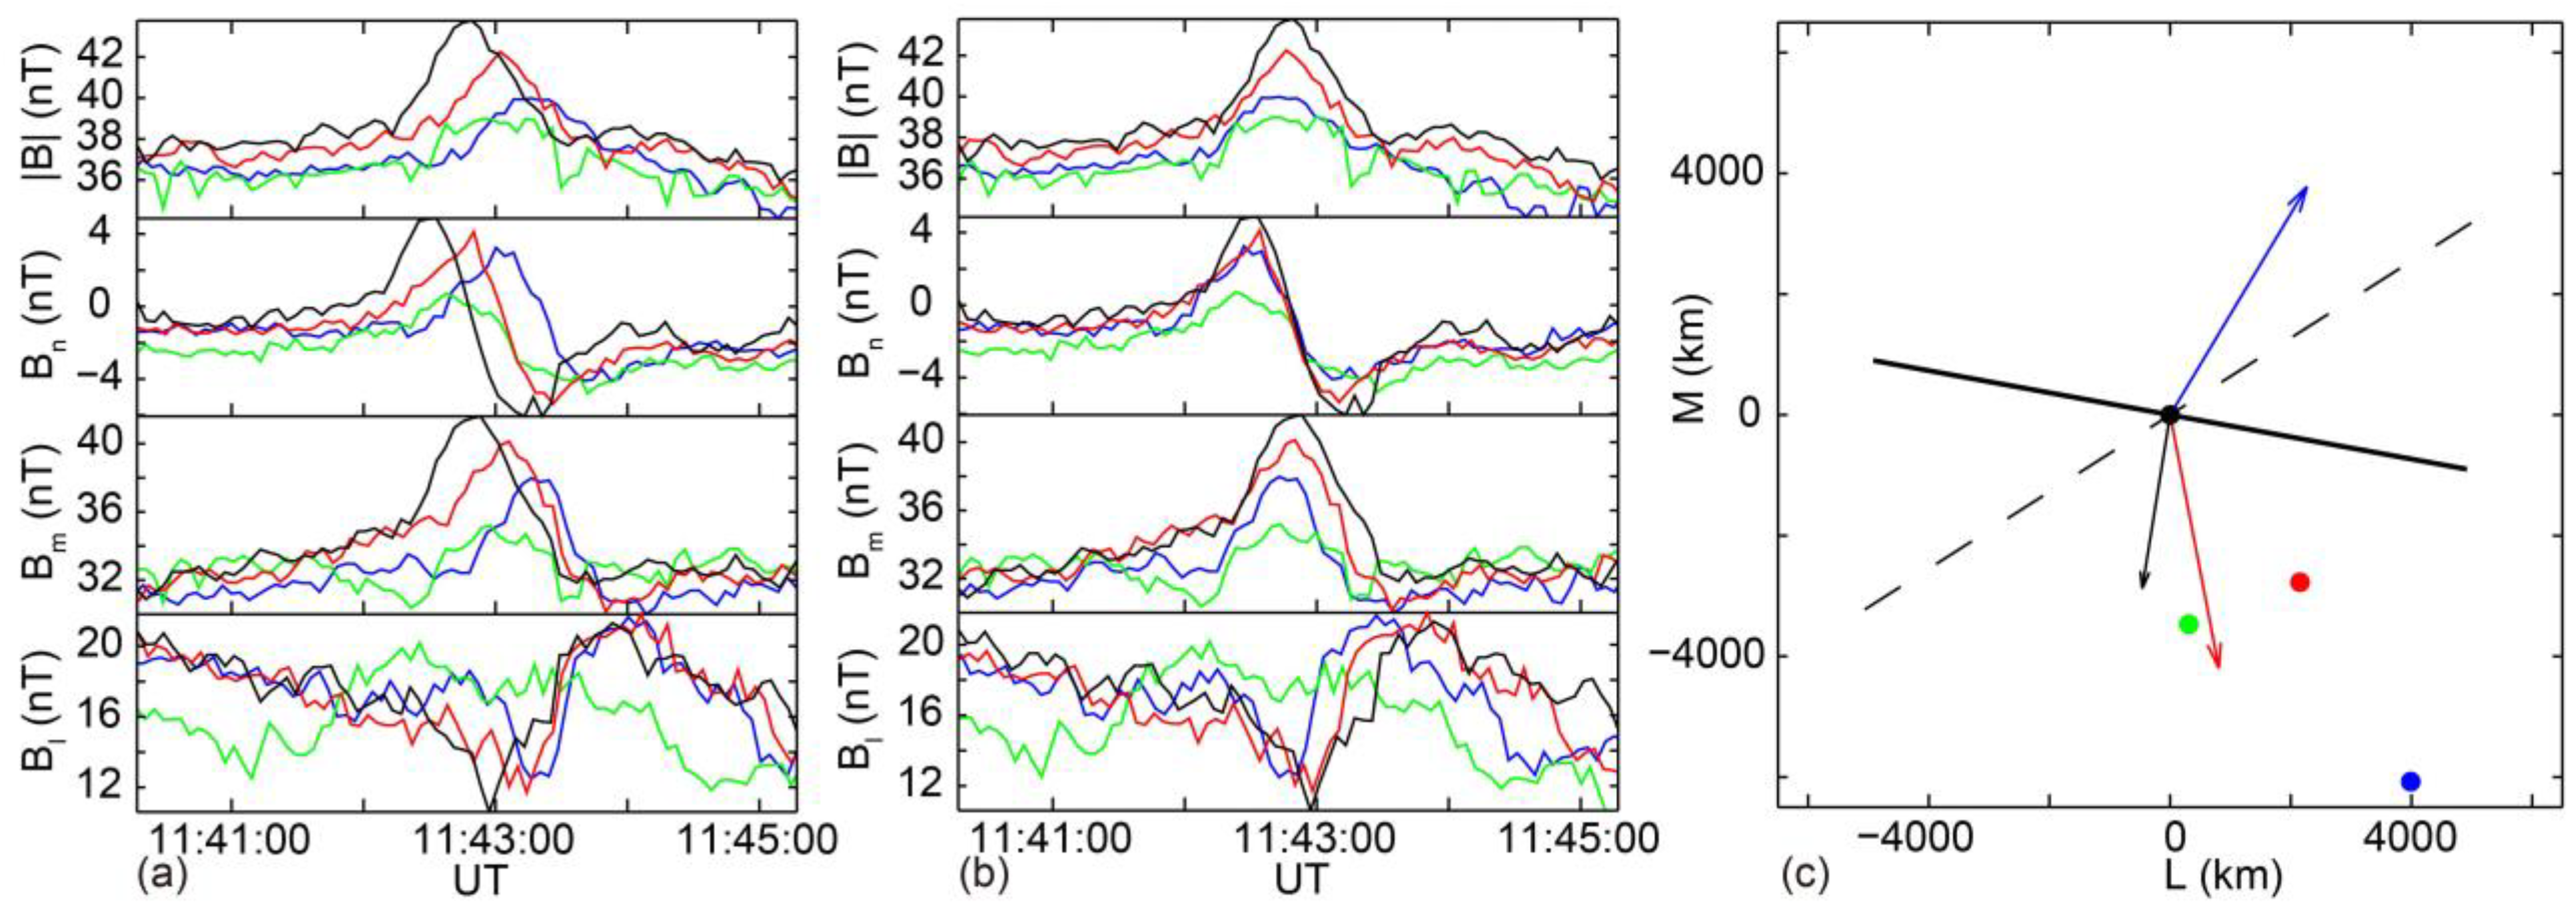
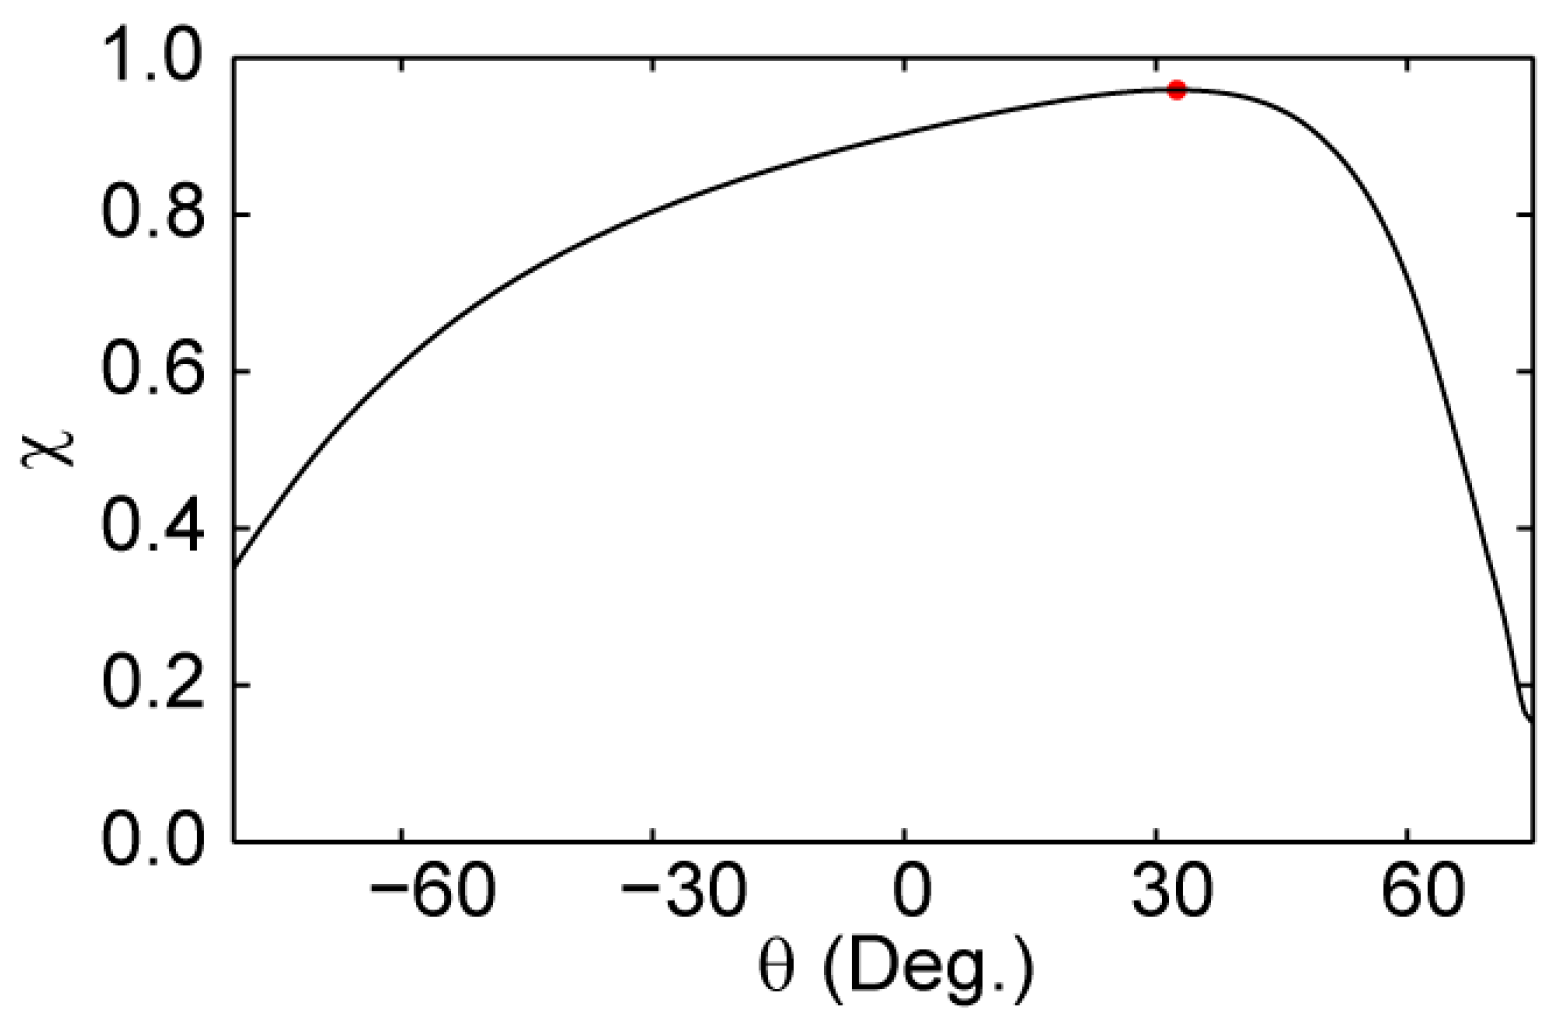
As shown in Figure 7a, this FTE (labeled as FTE37) appears around 11:42:47 UT. By performing HT analysis on the data from C3 between 11:42:17 and 11:43:17 UT, we obtain V H T = ( 260.2 ,   93.5 , 91.9 )   km / s and c c H T = 0 . 9978 . The angle between V H T and the magnetopause normal n ^ m p is 90.7 ° . The relationship curve of χ ( θ ) is shown in Figure 8, where at θ = 32 . 5 ° , χ reaches its maximum value of 0.959. The corresponding optimal axis is Z ^ a x i s = ( 0.581 ,   0.293 ,   0.759 ) . The time differences for the FTE to pass through C1–C4 are 0, 16.1, 14.2, and 33.4 s, respectively. After shifting the B n curves of C2–C3 along the time axis by the corresponding time differences, as shown in Figure 7b, it can be seen that all the curves are nearly synchronized.
In Figure 7c, the obtained FTE axis, magnetosheath magnetic field, magnetospheric magnetic field, and reconnection X-line for this event are displayed. The magnetosheath magnetic field B m s h = ( 29.5 , 2.7 ,   21.7 )   nT is obtained by averaging the nearby magnetosheath magnetic field data measured by C3 from 11:41:58 to 11:42:18 UT. The reconnection X-line Z ^ x l i n e = ( 0.030 ,   0.692 ,   0.721 ) is determined according to Equation (2). It can be seen from the figure that the FTE axis is closer to the magnetosheath magnetic field, with an angle of 26.6 ° between the two. In comparison, the angle between the FTE axis and the X-line reaches 42.8 ° .

3.4. FTE Orientations of All Observed FTEs

In Table 1, we summarize important parameters obtained for each FTE, such as the event time, the HT velocity, the FTE axis derived from the multi-spacecraft timing method, the magnetosheath field measured in the vicinity and the reconnection X-line direction calculated from Equation (2).
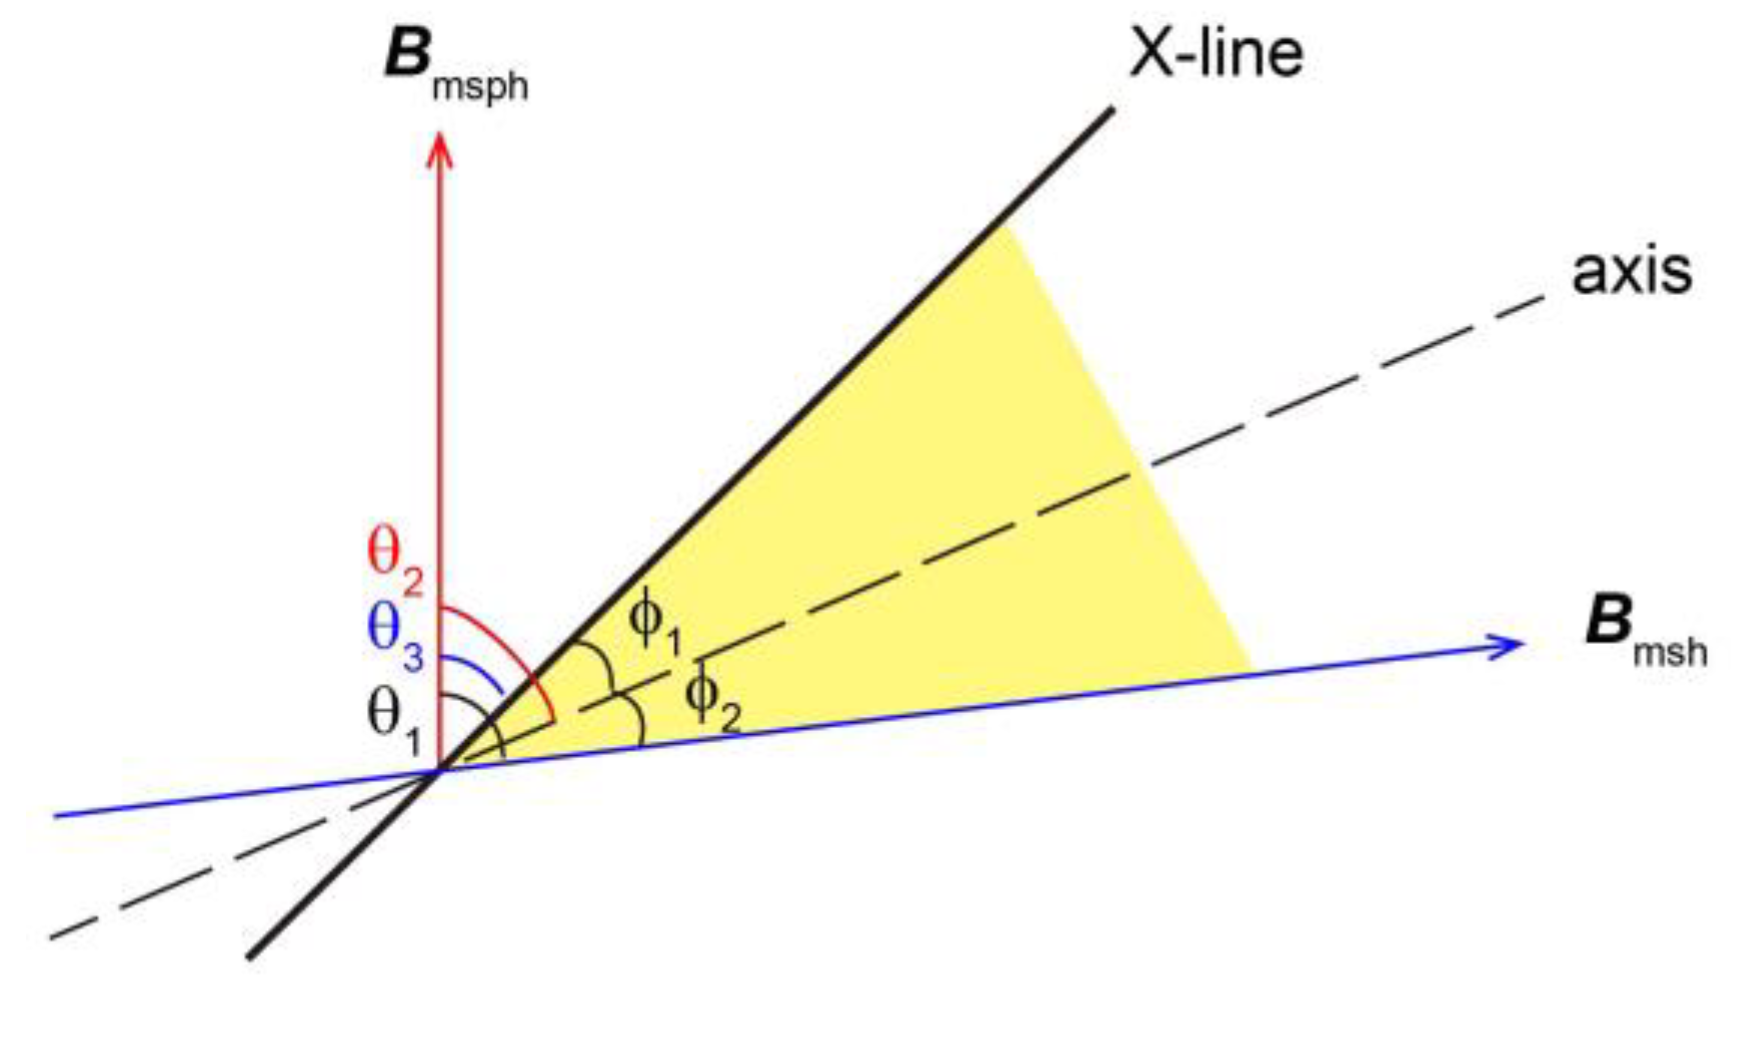
To analyze the geometric relationships among the FTE axis, the magnetosheath magnetic fields, the magnetospheric magnetic fields, and the reconnection X-lines, as shown in Figure 9, we defined the following angles: θ 1 is the angle between the magnetospheric and magnetosheath magnetic fields; θ 2 is the angle between the magnetospheric magnetic field and the FTE axis; θ 3 is the angle between the magnetospheric magnetic field and the reconnection X-line; ϕ 1 is the angle between the axis and the X-line; ϕ 2 is the angle between the axis and the magnetosheath magnetic field; and ϕ = ϕ 1 + ϕ 2 is the angle between the reconnection X-line and the magnetosheath magnetospheric magnetic field.
In Figure 10a, the angles θ 1 , θ 2 , and θ 3 for each FTE are presented. It can be seen that θ 1 (black dots) is gradually increasing from an initial 70° to a final 170°, indicating that as the IMF rotates, the magnetosheath magnetic field also rotates. Naturally, the reconnection X-line follows this rotation, as evidenced by the angle θ 3 (blue dots), which also gradually increases from an initial 30° to a final 80°. At the same time, θ 2 (red dots) also shows a clear trend of increasing, indicating that the FTE axis is also following the rotation of the IMF and the magnetosheath magnetic field. Another notable feature of the θ 2 curve in the figure is that it is sandwiched between the θ 1 and θ 3 curves, indicating that the FTE axis is confined to the area between the X-line and the magnetosheath magnetic field (the shaded area in Figure 9). To study the proximity of the FTE axis to the X-line or the magnetosheath magnetic field for each event, we define a quantity: η = ϕ 1 ϕ = ϕ 1 ϕ 1 + ϕ 2 . When η > 2 3 , η < 1 3 , and 2 3 η 1 3 , the FTE axis can be considered to be “closer” to the magnetosheath magnetic field, “closer” to the X-line, or in between, respectively. As shown in Figure 10b, the number of events for the three cases is 19 (33.3%, red dots), 14 (24.6%, blue dots), and 24 (42.1%, green dots), respectively, and there is no significant trend indicating that the FTE axis is notably closer to the magnetosheath magnetic field or the reconnection X-line.

4. Discussion

In the analysis results presented above, we found that the axes of the observed FTEs are distributed in the region between the reconnection X-line and the magnetosheath magnetic field, a new feature that has never been found in previous axial studies. The following discussion will address this important finding within the framework of different FTE models.

4.1. Elbow-Shaped Model

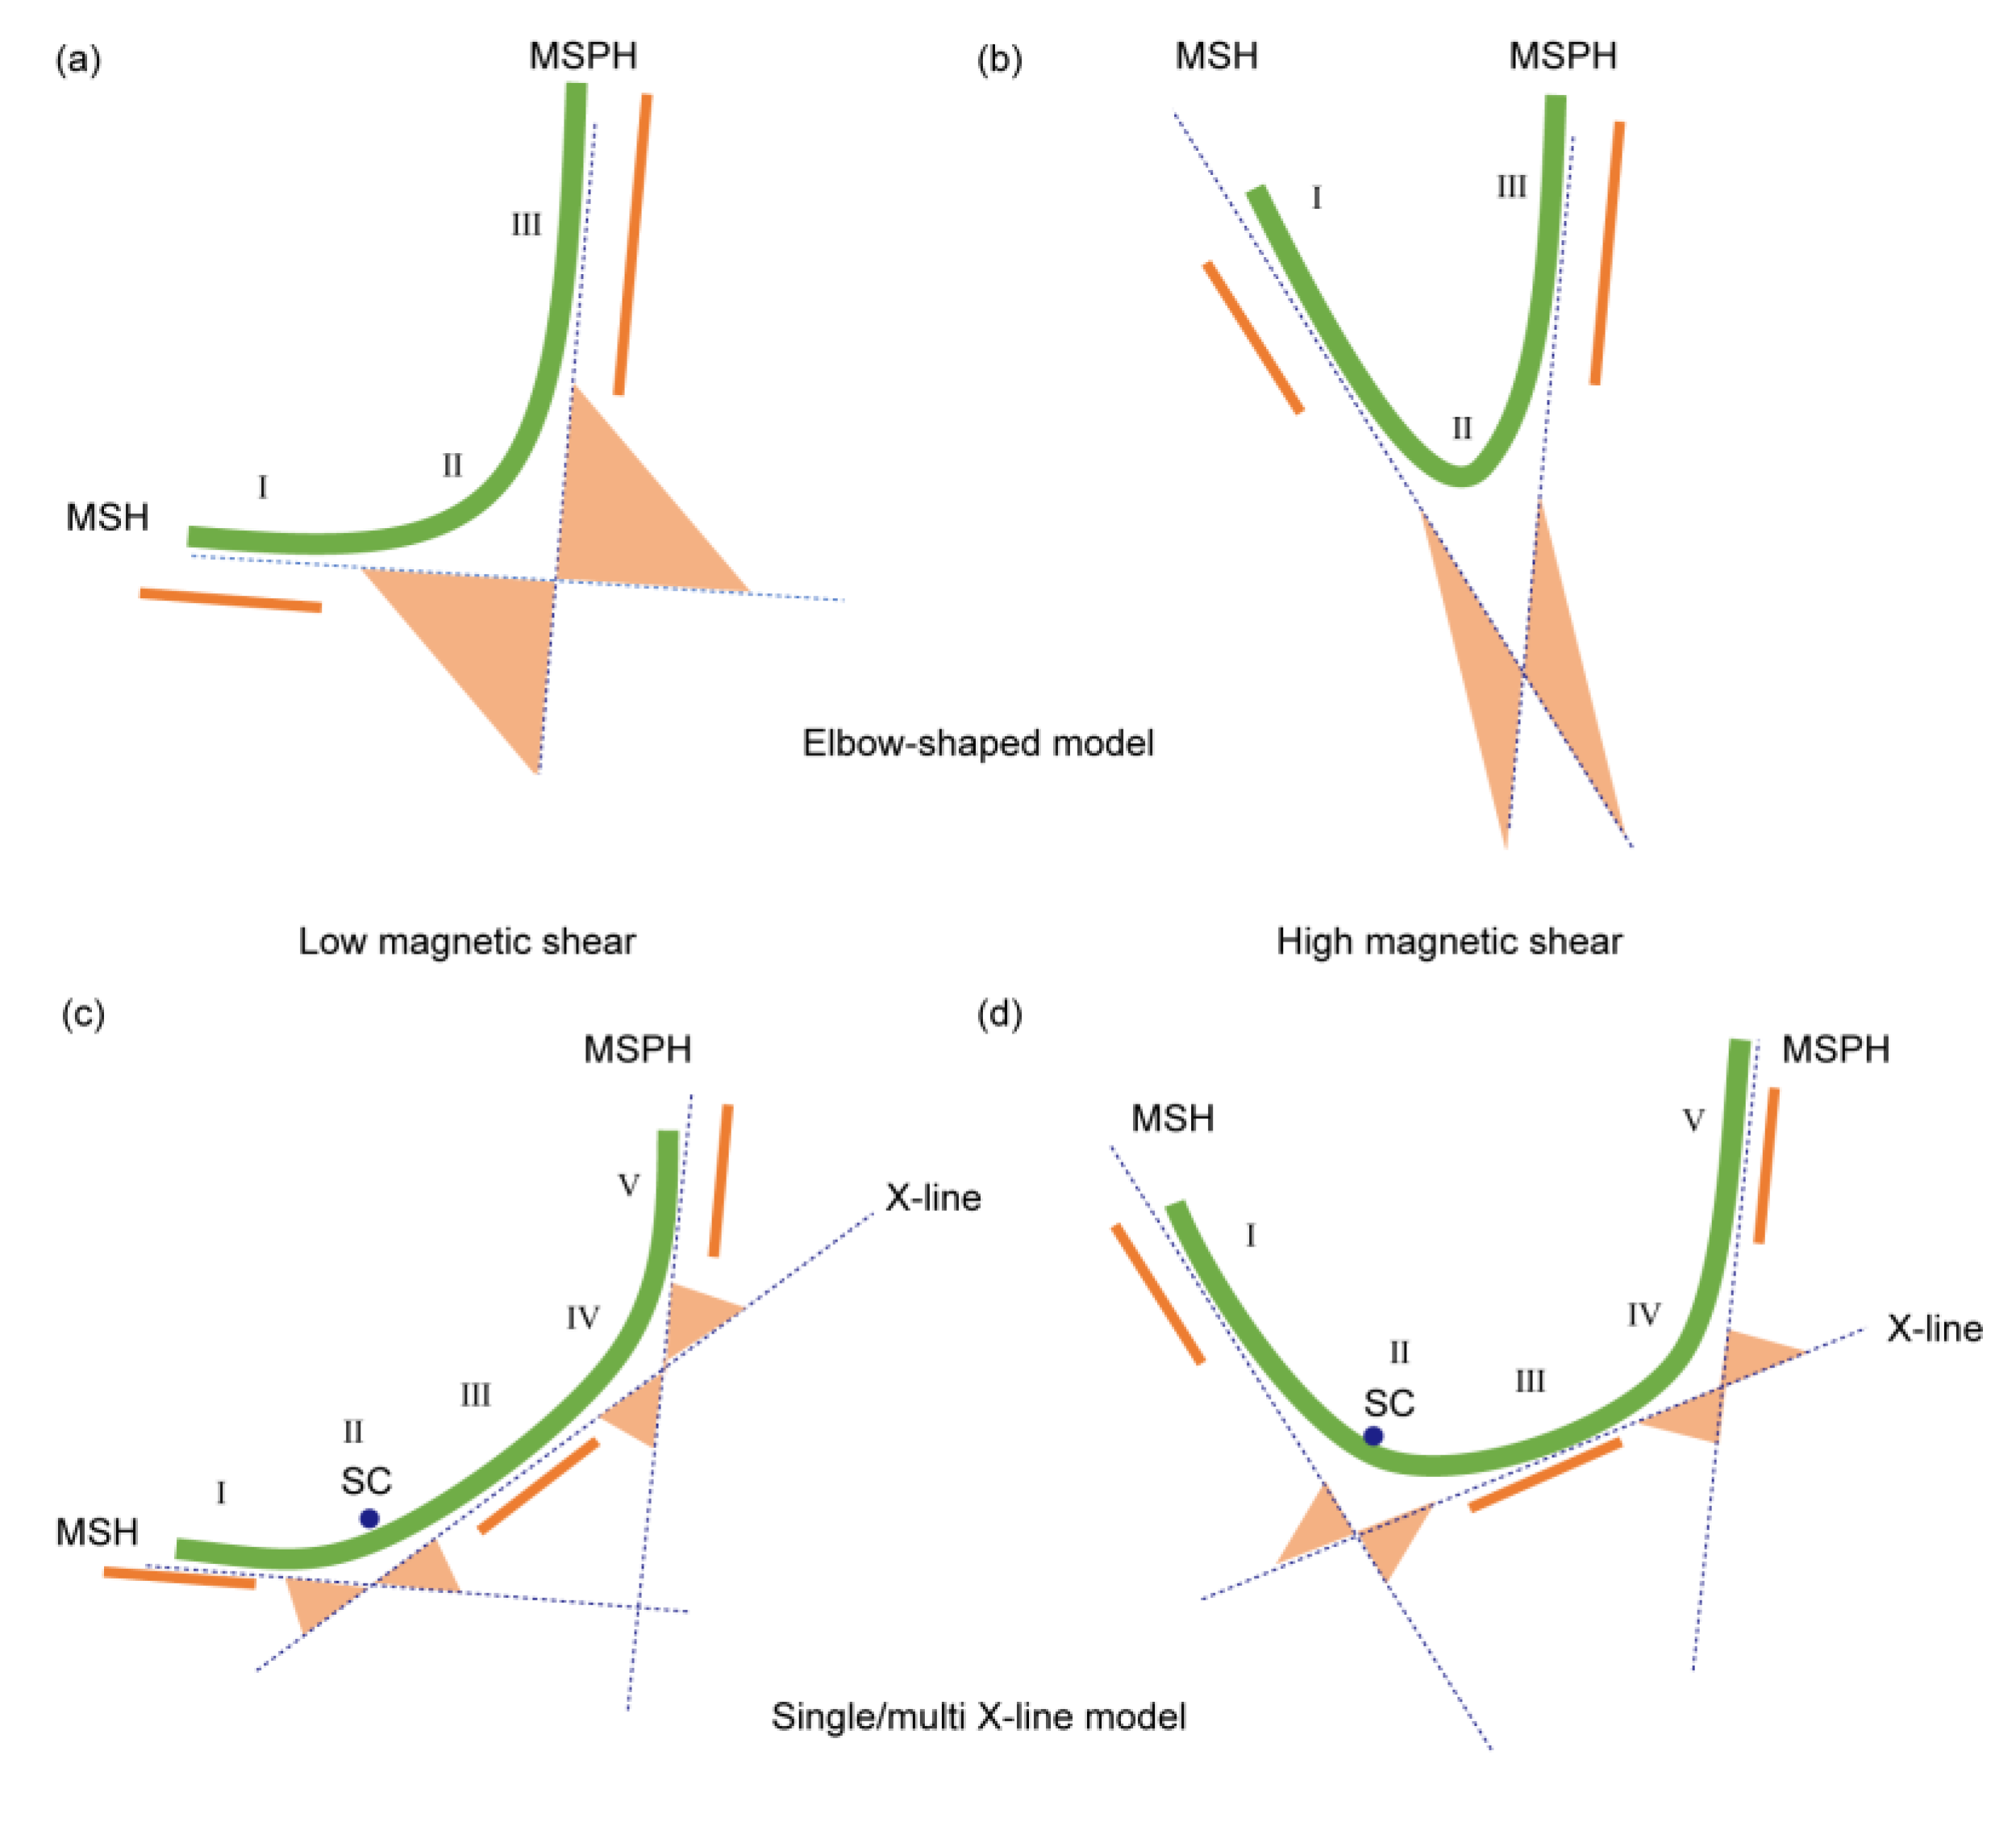
As shown in Figure 11a,b, in the elbow-shaped model, FTEs can be divided into three regions according to the axial orientation: (Region I) the magnetosheath branch, where the FTE axis is close to the magnetosheath magnetic field; (Region II) the connection region, where the FTE axis is located between the magnetospheric and magnetosheath magnetic fields (the orange shaded area in the figure); and (Region III) the magnetospheric branch, where the FTE axis is close to the magnetospheric magnetic field. This prediction is difficult to reconcile with our observational results unless it is assumed that the spacecraft happened to be located in the part of the connection region close to the magnetosheath branch. Moreover, as shown in Figure 11b, when the angle between the magnetosheath and magnetospheric magnetic fields is large, the connection region is very narrow and the probability of being encountered by the spacecraft is low, so the observed FTEs should essentially be aligned with the direction of the magnetosheath or magnetospheric magnetic field. However, in the later part of our observation interval, when the angle between the magnetosheath and magnetospheric magnetic fields approaches ~ 170 ° , the FTE axes do not exhibit a closer alignment with the direction of the magnetosheath or magnetospheric magnetic field; on the contrary, quite a number of them are close to the direction of the reconnection X-line. In summary, it can be concluded that the elbow-shaped model is inconsistent with our observations.

4.2. Single or Multiple X-Line Model

The fact that the axis varies between the magnetosheath magnetic field and the reconnection X-line indicates that the FTEs observed are not merely bubble structures released from reconnection sites or helical flux ropes formed by multiple X-line reconnections but should include the magnetospheric and magnetosheath branches as described in the elbow-shaped model and as proposed by Zhong et al. [17]. Based on such considerations, we propose the following hypothesis. As shown in Figure 11c,d, in the single/multiple X-line model, FTEs can be divided into five regions according to the axial orientation: (Region I) the magnetosheath branch, where the FTE axis is close to the magnetosheath magnetic field; (Region II) the connection region between the magnetosheath magnetic field line and the reconnection region, where the FTE axis lies between the magnetosheath magnetic field and the X-line; (Region III) the reconnection region, where the FTE axis is close to the reconnection X-line; (Region IV) the connection region between the magnetospheric magnetic field line and the reconnection region, where the FTE axis lies between the magnetospheric magnetic field and the X-line; and (Region V) the magnetospheric branch, where the FTE axis is close to the magnetospheric magnetic field. Clearly, if it is assumed that the spacecraft was in Region II during observation, then the single/multiple X-line model is in perfect agreement with our observations: the FTE observed in this region has its axis located between the magnetosheath magnetic field and the reconnection X-line, and its overall direction will turn with the increase in magnetic shear.

5. Summary

On November 10, 2002, from 09:40 to 14:50 UT, the Cluster spacecraft observed a large number of FTEs emerging continuously near the duskside magnetopause in the high-latitude region tailward of the southern cusp. During this interval, the IMF experienced a large rotation, which led to a large rotation of the magnetosheath magnetic field near Cluster. Taking advantage of the orbital configuration of the Cluster constellation at the time, we used a multi-spacecraft timing method to determine the axial orientations of all 57 FTEs identified during the observation interval. Our analysis reveals two previously unreported features of the FTE axis: (1) the axis of the FTE gradually turns with the rotation of the IMF and the magnetosheath magnetic field; (2) the axis of the FTE is confined to vary between the direction of the magnetosheath magnetic field and the reconnection X-line. These features cannot be simply explained by the elbow-shaped model, but they are completely consistent with the modified single/multiple X-line reconnection model that takes into account both the magnetosheath and magnetospheric branches.

Author Contributions

Conceptualization, Z.L. and T.C.; methodology, Z.L.; software, Z.L. and L.L.; validation, L.L.; formal analysis, Z.L.; investigation, Z.L.; resources, Z.L. and T.C.; data curation, Z.L. and L.L.; writing—original draft preparation, Z.L.; writing—review and editing, Z.L. and T.C.; visualization, Z.L. and L.L.; supervision, T.C.; project administration, T.C.; funding acquisition, Z.L. All authors have read and agreed to the published version of the manuscript.

Funding

This research was funded by the Hunan Provincial Natural Science Foundation of China (No. 2021JJ40223).

Institutional Review Board Statement

Not applicable.

Informed Consent Statement

Not applicable.

Data Availability Statement

Data were downloaded from the Cluster Science Archive (CSA) interfaces (https://www.cosmos.esa.int/web/csa/access) (accessed on 10 September 2023) and the GSFC/SPDF OMNIWeb interface (https://omniweb.gsfc.nasa.gov) (accessed on 7 October 2023).

Acknowledgments

The authors are grateful to the Cluster FGM and CIS PIs and instrument teams and to the Cluster Science Archive for providing the data used in this study. The authors kindly acknowledge N. Papitashvili and J. King at the National Space Science Data Center of the Goddard Space Flight Center for their 5 min OMNI data and the NASA CDAWeb team for making these data available.

Conflicts of Interest

The authors declare no conflicts of interest.

References

  1. Dungey, J.W. Interplanetary Magnetic Field and Auroral Zones. Phys. Rev. Lett. 1961, 6, 47. [Google Scholar] [CrossRef]
  2. Dungey, J.W. The Structure of the Exosphere or Adventures in Velocity Space. In Geophysics, the Earth’s Environment (Proceedings of the 1962 Les Houches Summer School); De Witt, J.H.C., Le Beau, L., Eds.; Gordon and Breach: New York, NY, USA, 1963; pp. 502–552. [Google Scholar]
  3. Gosling, J.T.; Thomsen, M.F.; Bame, S.J.; Elphic, R.C.; Russell, C.T. Observations of Reconnection of Interplanetary and Lobe Magnetic-Field Lines at the High-Latitude Magnetopause. J. Geophys. Res. Space Phys. 1991, 96, 14097–14106. [Google Scholar] [CrossRef]
  4. Fuselier, S.A.; Petrinec, S.M.; Trattner, K.J.; Lavraud, B. Magnetic Field Topology for Northward IMF Reconnection: Ion Observations. J. Geophys. Res. Space Phys. 2014, 119, 9051–9071. [Google Scholar] [CrossRef]
  5. Russell, C.T.; Elphic, R.C. Initial ISEE Magnetometer Results—Magnetopause Observations. Space Sci. Rev. 1978, 22, 681–715. [Google Scholar] [CrossRef]
  6. Russell, C.T.; Elphic, R.C. ISEE Observations of Flux-Transfer Events at the Dayside Magnetopause. Geophys. Res. Lett. 1979, 6, 33–36. [Google Scholar] [CrossRef]
  7. Lee, L.C.; Fu, Z.F. A Theory of Magnetic-Flux Transfer at the Earth’s Magnetopause. Geophys. Res. Lett. 1985, 12, 105–108. [Google Scholar] [CrossRef]
  8. Scholer, M. Magnetic-Flux Transfer at the Magnetopause Based on Single X-Line Bursty Reconnection. Geophys. Res. Lett. 1988, 15, 291–294. [Google Scholar] [CrossRef]
  9. Paschmann, G.; Oieroset, M.; Phan, T. In-Situ Observations of Reconnection in Space. Space Sci. Rev. 2013, 178, 385–417. [Google Scholar] [CrossRef]
  10. Zhang, H.; Zong, Q.; Connor, H.; Delamere, P.; Facsko, G.; Han, D.; Hasegawa, H.; Kallio, E.; Kis, A.; Le, G.; et al. Dayside Transient Phenomena and Their Impact on the Magnetosphere and Ionosphere. Space Sci. Rev. 2022, 218, 40. [Google Scholar] [CrossRef]
  11. Fear, R.C.; Milan, S.E.; Fazakerley, A.N.; Lucek, E.A.; Cowley, S.W.H.; Dandouras, I. The Azimuthal Extent of Three Flux Transfer Events. Ann. Geophys. 2008, 26, 2353–2369. [Google Scholar] [CrossRef]
  12. Fear, R.C.; Milan, S.E.; Oksavik, K. Determining the Axial Direction of High-Shear Flux Transfer Events: Implications for Models of FTE Structure. J. Geophys. Res. Space Phys. 2012, 117, A09220. [Google Scholar] [CrossRef]
  13. Eastwood, J.P.; Phan, T.D.; Fear, R.C.; Sibeck, D.G.; Angelopoulos, V.; Oieroset, M.; Shay, M.A. Survival of Flux Transfer Event (FTE) Flux Ropes Far Along the Tail Magnetopause. J. Geophys. Res. Space Phys. 2012, 117, 9. [Google Scholar] [CrossRef]
  14. Trenchi, L.; Marcucci, M.F.; Reme, H.; Carr, C.M.; Cao, J.B. TC-1 Observations of a Flux Rope: Generation by Multiple X Line Reconnection. J. Geophys. Res. Space Phys. 2011, 116, A05202. [Google Scholar] [CrossRef]
  15. Trenchi, L.; Fear, R.C.; Trattner, K.J.; Mihaljcic, B.; Fazakerley, A.N. A Sequence of Flux Transfer Events Potentially Generated by Different Generation Mechanisms. J. Geophys. Res. Space Phys. 2016, 121, 8624–8639. [Google Scholar] [CrossRef]
  16. Wang, J.; Pu, Z.Y.; Zhou, X.Z.; Zhang, X.G.; Dunlop, M.W.; Fu, S.Y.; Xie, L.; Zong, Q.G.; Xiao, C.J.; Wang, X.G.; et al. Coordinated Cluster/Double Star Observations of Dayside Flux Transfer Events on 6 April 2004. Sci. China Ser. E Technol. Sci. 2008, 51, 1611–1619. [Google Scholar] [CrossRef]
  17. Zhong, J.; Pu, Z.Y.; Dunlop, M.W.; Bogdanova, Y.V.; Wang, X.G.; Xiao, C.J.; Guo, R.L.; Hasegawa, H.; Raeder, J.; Zhou, X.Z.; et al. Three-Dimensional Magnetic Flux Rope Structure Formed by Multiple Sequential X-Line Reconnection at the Magnetopause. J. Geophys. Res. Space Phys. 2013, 118, 1904–1911. [Google Scholar] [CrossRef]
  18. Li, Z.Y.; Chen, T.; Yan, G.Q. New Method for Determining Central Axial Orientation of Flux Rope Embedded within Current Sheet Using Multipoint Measurements. Sci. China Earth Sci. 2016, 59, 2037–2052. [Google Scholar] [CrossRef]
  19. Escoubet, C.P.; Fehringer, M.; Goldstein, M. The Cluster Mission—Introduction. Ann. Geophys. 2001, 19, 1197–1200. [Google Scholar] [CrossRef]
  20. Balogh, A.; Carr, C.M.; Acuna, M.H.; Dunlop, M.W.; Beek, T.J.; Brown, P.; Fornacon, K.H.; Georgescu, E.; Glassmeier, K.H.; Harris, J.; et al. The Cluster Magnetic Field Investigation: Overview of in-Flight Performance and Initial Results. Ann. Geophys. 2001, 19, 1207–1217. [Google Scholar] [CrossRef]
  21. Rème, H.; Aoustin, C.; Bosqued, M.; Dandouras, I.; Lavraud, B.; Sauvaud, J.A.; Barthe, A.; Bouyssou, J.; Camus, T.; Coeur-Joly, O.; et al. First Multispacecraft Ion Measurements in and near the Earth’s Magnetosphere with the Identical Cluster Ion Spectrometry (CIS) Experiment. Ann. Geophys. 2001, 19, 1303–1354. [Google Scholar] [CrossRef]
  22. King, J.H.; Papitashvili, N.E. Solar Wind Spatial Scales in and Comparisons of Hourly Wind and Ace Plasma and Magnetic Field Data. J. Geophys. Res. Space Phys. 2005, 110, 2004JA010649. [Google Scholar] [CrossRef]
  23. Sonnerup, B.U.Ö.; Scheible, M. Minimum and Maximum Variance Analysis. In Analysis Methods for Multi-Spacecraft Data; Götz Paschmann, P.W.D., Ed.; ESA Publications Division: Noordwijk, The Netherlands, 1998; pp. 185–220. [Google Scholar]
  24. Tsyganenko, N.A. A Model of the near Magnetosphere with a Dawn-Dusk Asymmetry—2. Parameterization and Fitting to Observations. J. Geophys. Res. Space Phys. 2002, 107, 17. [Google Scholar] [CrossRef]
  25. Shue, J.H.; Chao, J.K.; Fu, H.C.; Russell, C.T.; Song, P.; Khurana, K.K.; Singer, H.J. A New Functional Form to Study the Solar Wind Control of the Magnetopause Size and Shape. J. Geophys. Res. Space Phys. 1997, 102, 9497–9511. [Google Scholar] [CrossRef]
  26. Khrabrov, A.V.; Sonnerup, B.U.Ö. Dehoffmann-Teller Analysis. In Analysis Methods for Multi-Spacecraft Data; Götz Paschmann, P.W.D., Ed.; ESA Publications Division: Noordwijk, The Netherlands, 1998; pp. 221–248. [Google Scholar]
  27. Sonnerup, B.U.Ö. The Reconnecting Magnetosphere. In Magnetospheric Physics; McCormac, B.M., Ed.; D. Reidel: Dordrecht, The Netherlands, 1974; p. 23. [Google Scholar]
  28. Gonzalez, W.D.; Mozer, F.S. Quantitative Model for Potential Resulting from Reconnection with an Arbitrary Interplanetary Magnetic-Field. J. Geophys. Res. 1974, 79, 4186–4194. [Google Scholar] [CrossRef]
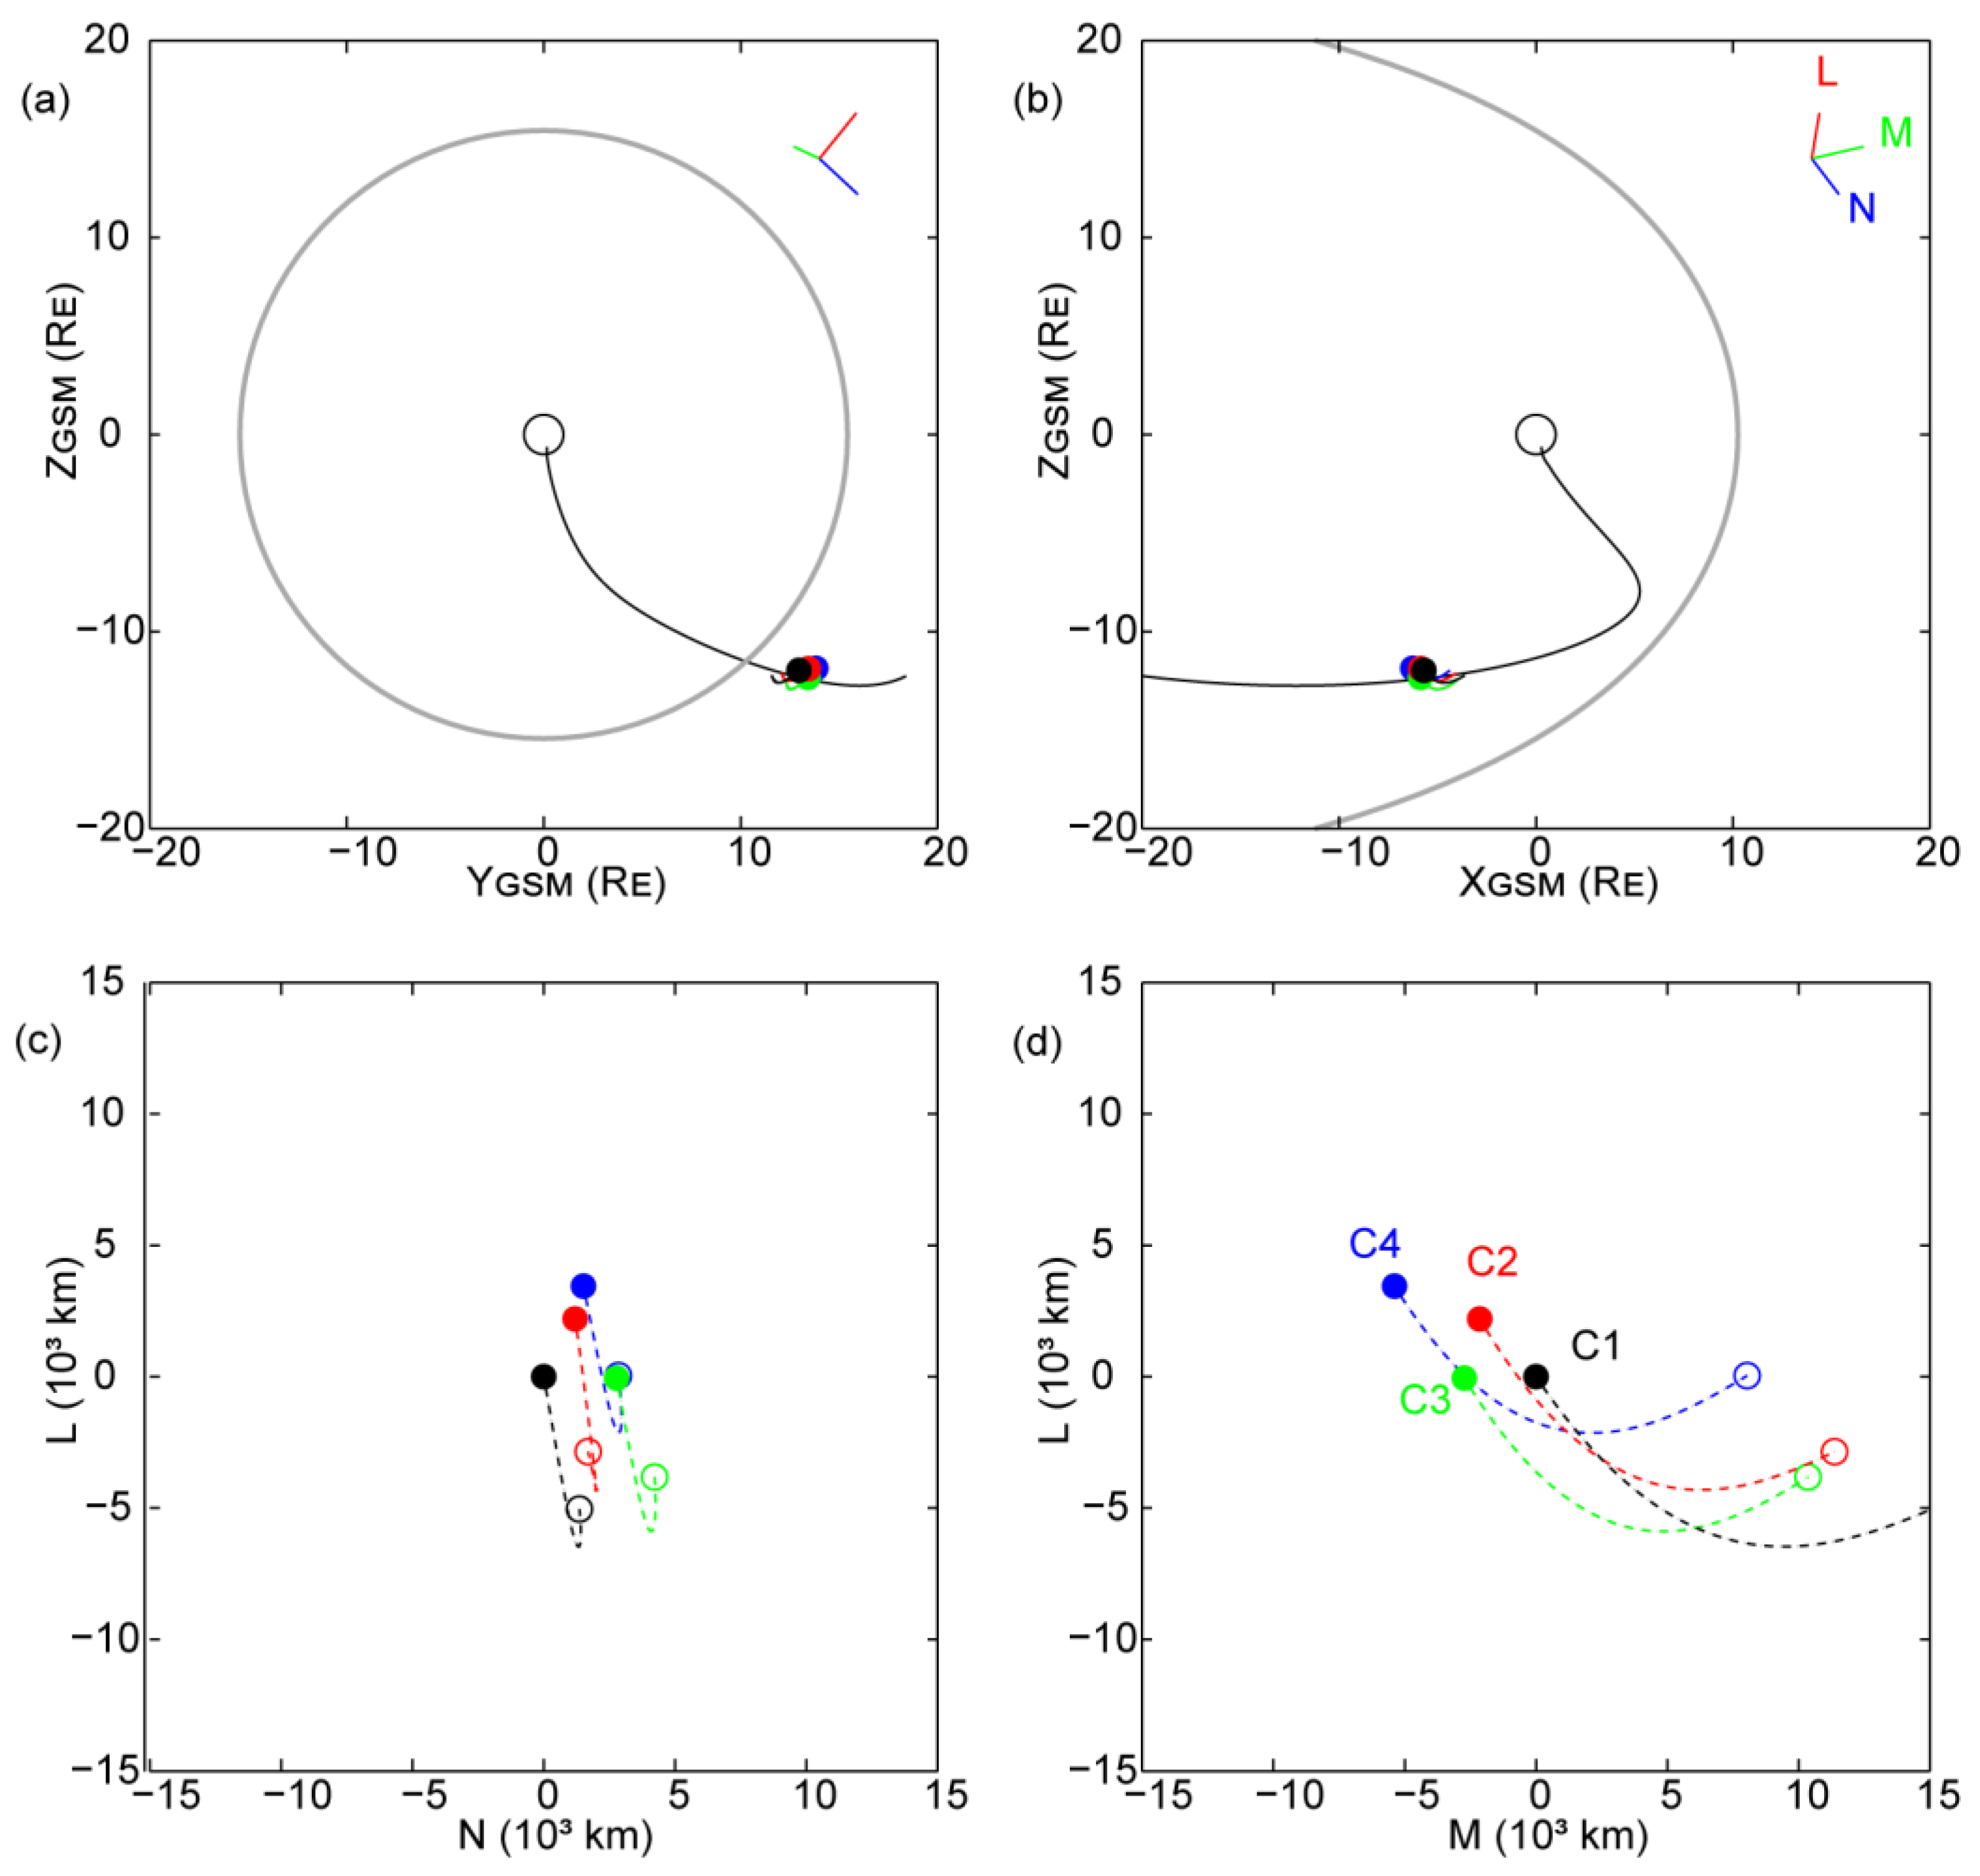
Figure 1. The positions and trajectories of the four Cluster spacecraft during the observation interval in the GSM YZ plane (a), GSM XZ plane (b), LMN NL plane (c) and LMN ML plane (d). The solid dots represent the positions of the Cluster spacecraft at the start time, with the curves extending from these points indicating the spacecraft trajectories, and the hollow dots represent the positions at the end time. C1–C4 are distinguished using black, red, green, and blue, respectively, and this convention is also used in the following figures. In the upper panel, the thick gray line shows the Shue98 model magnetopause, the black solid line shows a magnetospheric magnetic field line from the Tsyganenko01 model, which is traced through Cluster, and the red, green, and blue lines in the upper right corner are the projections of the L, M, and N axes of the LMN coordinate system, respectively.
Atmosphere 15 01215 g001
Figure 2. Solar wind conditions, propagated to the bow shock by OMNI and then lagged by a further 14 min to account for the convection time of plasma through the magnetosheath to the observation site. From top: solar wind dynamic pressure, density (black line) and flow speed (cyan line), GSM components of the IMF, the clock angle ( θ C A = tan 1 ( B y / B z ) ) of the IMF (purple line), and the magnetic field observed by the four Cluster spacecraft.
Atmosphere 15 01215 g002
Figure 3. Overview of Cluster observations. From top: the magnetic field magnitude, B n component, and GSM components, the clock angle, ion temperature, and density. The numbers at the top label a total of 57 events identified during this interval. The red, blue, and gray shadings highlight events with axes close to the magnetosheath magnetic field, close to the reconnection X-line, and in between, respectively (see Section 3.4 for detailed descriptions).
Atmosphere 15 01215 g003
Figure 4. Polar plots of the magnetopause normal derived from MVAB (central plus), Shue98 magnetopause normal (red plus), the magnetospheric magnetic field (blue plus), and the magnetosheath magnetic field near each event (green pluses). Concentric circles about the bull’s eye show angular deviations of 15 ° , 30 ° , 45 ° , 60 ° , and 90 ° . The numbers next to the green plus signs are the corresponding event numbers.
Atmosphere 15 01215 g004
Figure 5. Case event 1. (a) Original magnetic field data measured by the four Cluster spacecraft; (b) magnetic field data measured by C1 together with the data measured by C2–C3 delayed with the best time shift; (c) the LM plane. Solid dots represent the spacecraft projected positions during the event. Black, red, and blue arrows represent the projections of the HT velocity, magnetospheric magnetic field, and magnetosheath magnetic field, respectively. The thick line is the projection of the reconnection X-line, and the dashed line is the FTE axis obtained using the multi-spacecraft timing method.
Atmosphere 15 01215 g005
Figure 6. The functional relationship of χ ( θ ) for case event 1. The red dot indicates the location of a maximum value on the curve.
Atmosphere 15 01215 g006
Figure 7. Case event 2. The format is the same as Figure 5.
Atmosphere 15 01215 g007
Figure 8. The functional relationship of χ ( θ ) for case event 2.
Atmosphere 15 01215 g008
Figure 9. Definitions of the angles θ 1 , θ 2 , θ 3 , ϕ 1 , and ϕ 2 .
Atmosphere 15 01215 g009
Figure 10. The geometric relationships of the FTE axis, the magnetosheath magnetic field, the magnetospheric magnetic field, and the reconnection X-line. (a) The angles θ 1 , θ 2 , and θ 3 for each FTE, defined as the angle of the magnetospheric field with respect to the magnetosheath field (black dots), the axial direction of the FTE (red dots), and the reconnection X-line (blue dots), respectively. The gray thick lines represent the piecewise linear functions fitted to the data points. (b) The η value for each event, with red, blue, and green dots indicating that the axis of the event is closer to the magnetosheath magnetic field, closer to the X-line, or in between, respectively.
Atmosphere 15 01215 g010
Figure 11. Global configurations of FTE: in the elbow-shaped model with low magnetic shear (a) and high magnetic shear (b); in the multiple X-line reconnection model with low magnetic shear (c) and high magnetic shear (d). The overall shape of the FTE is outlined with a green thick line. Roman numerals denote the different regions of the FTE with different axial orientations, and the orange solid lines and shadings show the axial orientation of the FTE in these regions.
Atmosphere 15 01215 g011
Table 1. Axial analysis results for all FTEs.
FTE No.Event TimeHT VelocityFTE Axial OrientationMagnetosheath Magnetic FieldReconnection X-Line
109:47:13(−299.3, 111.0, −63.8)(−0.140, 0.725, 0.673)(−2.8, 24.7, 33.0)(−0.586, 0.734, 0.342)
209:51:42(−294.7, 145.8, −25.3)(−0.109, 0.717, 0.688)(−0.3, 23.9, 33.8)(−0.560, 0.741, 0.369)
309:53:22(−291.2, 38.1, −165.5)(−0.086, 0.710, 0.698)(1.4, 20.5, 35.3)(−0.518, 0.749, 0.411)
410:02:14(−294.8, 209.9, 68.4)(−0.078, 0.708, 0.701)(4.8, 22.1, 33.5)(−0.499, 0.752, 0.429)
510:05:52(−290.9, 142.2, −19.9)(−0.078, 0.708, 0.701)(3.5, 22.6, 33.9)(−0.516, 0.750, 0.413)
610:08:33(−273.8, 185.5, 41.2)(−0.347, 0.758, 0.550)(7.8, 21.5, 33.9)(−0.473, 0.755, 0.452)
710:16:03(−277.9, 156.1, −2.4)(−0.094, 0.712, 0.695)(10.1, 21.0, 32.4)(−0.441, 0.758, 0.479)
810:18:26(−283.9, 211.1, 37.1)(−0.312, 0.756, 0.575)(9.5, 18.7, 32.2)(−0.418, 0.759, 0.497)
910:21:03(−272.8, 221.9, 86.5)(−0.094, 0.712, 0.695)(8.0, 19.7, 33.8)(−0.451, 0.757, 0.471)
1010:22:42(−331.3, 69.4, −170.0)(0.250, 0.557, 0.791)(9.5, 18.8, 33.2)(−0.427, 0.759, 0.490)
1110:29:15(−288.9, 99.4, −90.0)(0.280, 0.539, 0.794)(9.4, 19.1, 31.8)(−0.421, 0.759, 0.495)
1210:30:36(−225.7, 203.4, 84.6)(−0.124, 0.721, 0.681)(9.8, 18.6, 32.5)(−0.417, 0.759, 0.498)
1310:32:54(−238.8, 127.1, −2.1)(−0.063, 0.703, 0.708)(11.0, 17.0, 31.1)(−0.381, 0.759, 0.526)
1410:37:41(−281.7, 168.6, −7.9)(0.152, 0.612, 0.775)(12.0, 19.6, 31.1)(−0.405, 0.759, 0.508)
1510:40:48(−249.5, 217.3, 103.3)(−0.193, 0.738, 0.646)(9.3, 18.2, 32.0)(−0.412, 0.759, 0.502)
1610:45:09(−260.4, 219.9, 66.6)(0.198, 0.588, 0.784)(12.8, 19.0, 30.7)(−0.390, 0.759, 0.519)
1710:47:55(−294.7, 139.2, −46.0)(0.107, 0.635, 0.764)(9.4, 18.4, 32.7)(−0.420, 0.759, 0.496)
1810:50:00(−306.1, 144.8, −60.0)(0.037, 0.665, 0.745)(12.4, 19.6, 32.2)(−0.411, 0.759, 0.503)
1910:51:17(−319.0, 70.7, −157.0)(0.083, 0.645, 0.758)(9.5, 17.2, 31.7)(−0.398, 0.759, 0.513)
2010:52:46(−275.4, 140.9, −32.9)(−0.009, 0.684, 0.729)(10.5, 18.1, 30.9)(−0.395, 0.759, 0.516)
2110:54:19(−263.9, 194.5, 30.1)(−0.147, 0.727, 0.670)(11.2, 18.0, 31.4)(−0.394, 0.759, 0.516)
2210:58:31(−255.9, 202.2, 47.9)(−0.032, 0.692, 0.720)(12.4, 17.8, 31.7)(−0.387, 0.759, 0.522)
2311:00:04(−281.0, 158.7, −6.9)(0.122, 0.627, 0.768)(10.3, 18.2, 32.3)(−0.408, 0.759, 0.505)
2411:01:25(−328.9, 159.2, −57.8)(0.273, 0.543, 0.793)(13.0, 19.3, 31.9)(−0.402, 0.759, 0.510)
2511:04:50(−270.0, 140.4, −39.8)(0.076, 0.649, 0.756)(11.6, 16.4, 30.7)(−0.368, 0.759, 0.536)
2611:07:28(−305.5, 96.4, −107.9)(0.206, 0.583, 0.785)(12.2, 17.4, 31.4)(−0.381, 0.759, 0.526)
2711:08:35(−248.8, 182.0, 34.8)(0.022, 0.672, 0.740)(12.7, 18.4, 32.0)(−0.394, 0.759, 0.516)
2811:09:59(−233.1, 178.4, 32.2)(−0.047, 0.698, 0.714)(12.3, 18.0, 31.1)(−0.385, 0.759, 0.523)
2911:12:39(−325.4, 68.5, −154.6)(0.145, 0.616, 0.773)(11.8, 17.6, 32.1)(−0.391, 0.759, 0.518)
3011:14:22(−306.2, 91.5, −115.2)(−0.063, 0.703, 0.708)(11.9, 17.8, 36.3)(−0.423, 0.759, 0.493)
3111:19:33(−243.8, 135.1, −33.6)(−0.253, 0.748, 0.612)(17.1, 16.4, 31.7)(−0.346, 0.758, 0.551)
3211:24:30(−271.1, 79.9, −111.6)(0.190, 0.592, 0.782)(28.5, −1.8, 22.8)(−0.048, 0.698, 0.714)
3311:30:00(−216.7, 98.5, −41.0)(0.145, 0.616, 0.773)(24.1, 3.8, 27.5)(−0.152, 0.728, 0.667)
3411:31:37(−262.9, 83.9, −98.9)(0.429, 0.432, 0.792)(27.1, 3.3, 26.9)(−0.136, 0.724, 0.675)
3511:33:07(−309.2, 80.6, −153.0)(0.488, 0.382, 0.784)(26.7, 4.1, 28.4)(−0.158, 0.730, 0.664)
3611:36:11(−348.7, 89.6, −189.0)(0.190, 0.592, 0.782)(26.6, −4.5, 23.7)(−0.033, 0.693, 0.720)
3711:42:47(−260.1, 93.4, −91.9)(0.581, 0.293, 0.758)(29.5, −2.7, 21.8)(−0.030, 0.691, 0.721)
3811:47:00(−263.9, 76.1, −100.6)(0.352, 0.490, 0.796)(31.9, −13.1, 11.8)(0.149, 0.614, 0.774)
3911:52:26(−229.7, 70.8, −73.6)(0.482, 0.388, 0.785)(28.9, −8.9, 13.3)(0.107, 0.634, 0.765)
4011:54:35(−274.2, 85.0, −116.2)(0.739, 0.095, 0.666)(29.5, −7.5, 19.1)(0.037, 0.665, 0.745)
4112:00:02(−257.4, 83.5, −104.4)(0.488, 0.382, 0.784)(28.3, −3.3, 20.9)(−0.016, 0.689, 0.726)
4212:05:28(−340.0, 112.1, −140.0)(0.721, 0.121, 0.681)(35.1, −9.2, 16.9)(0.068, 0.652, 0.754)
4312:09:35(−315.5, 107.7, −128.1)(0.779, 0.029, 0.625)(28.3, −11.7, 15.2)(0.112, 0.632, 0.766)
4412:17:16(−239.4, 58.3, −96.4)(0.366, 0.480, 0.796)(31.3, −11.9, 19.7)(0.067, 0.653, 0.754)
4512:21:17(−261.4, 81.7, −109.1)(0.587, 0.287, 0.756)(30.0, −12.8, 15.4)(0.116, 0.630, 0.767)
4612:24:21(−255.3, 73.3, −104.2)(0.810, −0.030, 0.585)(29.1, −13.6, 10.3)(0.174, 0.601, 0.779)
4712:44:45(−226.4, 105.8, −73.4)(0.739, 0.095, 0.666)(32.1, −11.2, 13.9)(0.115, 0.630, 0.767)
4812:49:41(−201.1, 84.6, −77.3)(0.648, 0.218, 0.729)(29.0, −6.9, 19.3)(0.030, 0.668, 0.742)
4912:56:10(−143.7, 27.0, −39.5)(−0.055, 0.700, 0.711)(29.4, −13.2, 15.0)(0.124, 0.626, 0.769)
5013:02:40(−291.1, 79.9, −140.1)(0.790, 0.009, 0.612)(31.0, −12.2, 14.5)(0.120, 0.628, 0.768)
5113:23:40(−281.9, 76.5, −121.2)(0.068, 0.652, 0.754)(32.3, −17.4, 7.9)(0.217, 0.577, 0.787)
5213:32:51(−245.7, 71.7, −100.5)(0.756, 0.069, 0.650)(29.4, −18.2, 6.9)(0.240, 0.563, 0.790)
5313:50:34(−259.3, 82.4, −102.1)(0.280, 0.539, 0.794)(29.3, −15.2, 10.9)(0.180, 0.598, 0.780)
5413:55:35(−243.0, 78.7, −92.4)(0.408, 0.448, 0.794)(31.3, −13.3, 11.9)(0.152, 0.612, 0.775)
5514:02:13(−287.6, 116.7, −105.3)(0.533, 0.341, 0.774)(25.5, −19.3, 3.8)(0.290, 0.533, 0.794)
5614:21:55(−274.4, 135.4, −82.3)(0.760, 0.062, 0.646)(32.6, −11.7, 10.5)(0.151, 0.613, 0.775)
5714:26:02(−244.5, 110.9, −81.6)(0.669, 0.193, 0.717)(27.0, −12.2, 13.2)(0.138, 0.619, 0.772)
Disclaimer/Publisher’s Note: The statements, opinions and data contained in all publications are solely those of the individual author(s) and contributor(s) and not of MDPI and/or the editor(s). MDPI and/or the editor(s) disclaim responsibility for any injury to people or property resulting from any ideas, methods, instructions or products referred to in the content.