Article

Make Way for the Wind—Promoting Urban Wind Corridor Planning by Integrating RS, GIS, and CFD in Urban Planning and Design to Mitigate the Heat Island Effect

1
Department of Urban Planning and Landscape Architecture, National Quemoy University, No. 1, University Rd., Jinning Township, Kinmen County 892, Taiwan
2
Urban Planning and Design Institute of Shenzhen, Shenzhen 518028, China
*
Author to whom correspondence should be addressed.
Atmosphere 2024, 15(3), 257; https://doi.org/10.3390/atmos15030257
Submission received: 15 December 2023 / Revised: 5 January 2024 / Accepted: 10 January 2024 / Published: 21 February 2024
(This article belongs to the Special Issue UHI Analysis and Evaluation with Remote Sensing Data)

Abstract

:
Under the trend in climate change, global warming, and the increasingly serious urban heat island effect, promoting urban wind corridor planning to reduce urban temperature and mitigate the effect of urban heat islands has received widespread attention in many cities. With emerging awareness of the need to explicitly incorporate climate considerations into urban planning and design, integrating current spatial analysis and simulation tools to enhance urban wind corridor planning to obtain the best urban ventilation effect has become an increasingly important research topic in green city development. However, how to systematically carry out urban wind corridor planning by employing related technology and simulation tools is a topic that needs to be explored urgently in both theory and practice. Taking Zhumadian City in China as an example, this study proposes a method and planning approach that uses remote sensing (RS), geographic information system (GIS), and computational fluid dynamics (CFD) in an integrated way to understand urban landscape and to conduct urban wind corridor planning. The research results reveal that the urban form of Zhumadian City favors the development of urban wind corridors, and that the railway lines and some major roads in the city have the potential to be developed as the city’s main wind corridors. However, there are still ventilation barriers resulting from the existing land use model and building layout patterns that need to be adjusted. In terms of local-level analysis, the CFD simulation analysis also reveals that some common building layout patterns may result in environments with poor ventilation. Finally, based on the results of our empirical analysis and local planning environment, specific suggestions are provided on how to develop appropriate strategies for urban wind corridor planning and adjustments related to land use planning and building layout patterns in order to mitigate the impact of the urban heat island effect.

1. Introduction

With the impact of climate change and the urban heat island effect [1,2], how to develop land use models and building layout patterns in line with local climate characteristics has become an important issue in architecture and urban design [3,4,5,6]. In light of these trends, the concepts of climate-responsive design and urban wind corridor planning have aroused increasing interest and discussion among related academia and professionals [7,8,9,10]. With the urban heat island effect becoming increasingly serious in many cities, using the urban wind corridor effect to foster urban cooling and alleviate the impact of the heat island effect has become an important research topic in urban planning and design [11,12,13,14,15]. It is also becoming a popular policy goal for many city governments [16,17]. However, how to introduce the concept of urban wind corridor planning in the critical stages of urban expansion or urban redevelopment while incorporating it into the overall consideration of urban spatial planning, land use planning, and building layout models is still an urgent research topic that needs to be investigated in depth [5].
The urban heat island (UHI) effect has become a fairly common phenomenon in many of today’s cities [18]. It is a phenomenon of urban high temperature, which not only causes the deterioration of the urban environment and makes people feel uncomfortable but also leads to an increase in the use of air conditioners and energy [19], which once again promotes an increase in city temperatures [20]. Relevant studies have shown that the trend in urbanization and urban expansion has increased the impact of the urban heat island effect [21,22,23], while high-density land development [24] and extensive use of impermeable pavements [25] have also made the heat island effect increasingly obvious.
Due to the impact of the heat island effect on the urban environment and urban life, researchers of related fields have actively explored the degree and impact of the heat island effect as well as useful mitigating strategies. [11,12,26,27]. For example, Wong et al. (2010) and Hsieh and Huang (2016) explored the potential of developing an urban wind corridor to mitigate urban heat islands [11,12]. O’Mallet et al. used a case study and the CFD simulation method to explore the effect several UHI mitigation strategies including urban greening, use of water bodies, and use of high-albedo materials [26]. In terms of examining the intensity and impact of the UHI effect, remote sensing satellite image analysis of land surface temperature and field measurements of ambient temperatures are two commonly used methods for examining the status and trends in the UHI effect [28,29]. Land surface temperature (LST) represents the radiative temperature of the land’s surface, such as soil, grass, pavements, and roofs [30]. Remote sensing analysis of land surface temperature provides an economical and easy-to-operate analysis tool due to the advantage of easy large-area surface information collection. Related research has used satellite images with thermal bands to understand urban warming conditions and the UHI effect using land surface temperature retrieval [31,32,33,34].
Given the fact that the heat island effect is a common problem in urban areas, the discussion of related mitigation measures has become a hot topic in urban planning and design and related academic research. Scholars in related fields have mainly addressed heat island mitigation measures from the following perspectives: (1) Achieving urban cooling through urban greening, such as green roofs and/or planting plans [35,36]. (2) Mitigating the impact of the urban heat island effect through better open space design and/or urban cool island planning [37,38]. For example, Sugawara et al. (2021) used the urban park of Shinjyuku Gyoen to study the vertical structure of a cool island at night, and found that with the cool island effect, the surface air temperature difference between the park and the town increased up to 2 °C [38]. (3) Exploring the relationship between urban morphology and the heat island effect [27,39]. For example, He et al. (2020) investigated the relationships between local-scale urban morphology, urban ventilation, and the urban heat island effect under the influence of sea breeze and found that several precinct morphological characteristics, including building height, street structure, and compactness, have a strong influence on precinct ventilation [27]. (4) Exploring the relationship between the massive use of impervious urban pavement and the increase in the heat island effect [25]. (5) Employing the Weather Research and Forecasting (WRF) model to explore the effect of UHI mitigation measures [18,40]. For example, Imran et al. (2019) used WRF model coupled with the single layer urban canopy model (SLUCM) to investigate the effect of vegetated patches as green infrastructure in mitigating UHI effects [40]. (6) Assessing the influences of wind environment improvement on urban heat islands and investigating the methodology and strategies in developing urban wind corridors as a tool to mitigate the UHI effect [11,12,13,41]. For example, Wong et al. (2010) used the least cost path method and the frontal area index (FAI) to analyze the paths of urban corridors [11]. Chen et al. (2013) estimated urban roughness based on digital building models using the SkyHelios model to evaluate wind environment performance [41].
The relationship between urban wind corridor/wind flow characteristics and unban heat islands has become an important topic when searching for planning measures to mitigate UHIs [11,12,13,42,43,44]. Urban wind corridors can result from roads, open spaces, and passages through which air reaches the interiors of urbanized areas [45]. Wind passing from rural or urban fringe areas into a city provides cleaner and cooler air to urban canopy layers in summers, which has been noted as one of the possible measures to mitigate the impact of the heat island effect [12,14,46,47]. Good ventilation not only helps eliminate pollutants but also reduces temperature and improves outdoor human comfort [48,49,50].
In terms of the methodology and analytical tools for studying urban ventilation improvement, over the years, the effects of urban building arrangement on the wind environment have been investigated using wind tunnel experiments [51,52] and numerical simulation analysis, particularly in the application of computational fluid dynamics (CFD). CFD has become a commonly used numerical simulation method and analytical tool for studying the wind environment in urban planning and design [5,24,49,50,53]. It is increasingly being used to assess the pedestrian-level wind environment and comfort in urban areas [53,54,55] and to investigate turbulent flow conditions in different street canyon models [36,49,56], as well as to evaluate the influences of building layout and land use patterns on ventilation in order to find optimal planning solutions for mitigating UHIs [57,58,59,60,61]. For example, Yuan and Ng (2012) found that building blocks with limited open spaces, uniform building heights, and large podium structures have led to lower permeability for urban air ventilation at the pedestrian level [57]. Using CFD analysis, several studies have noted that high-density land development and improper building layout patterns have affected the ventilation of residential communities [5,50,62,63]. Previous studies have also revealed the importance of carrying out CFD assessments of the available alternatives in different stages of architectural and urban design [5,64,65].
Urban wind corridors are three-dimensional main air circulation channels in a city. In urban planning and design practices, urban wind corridors are commonly designed to introduce clean and cool airflows into urban areas with the goals of improving urban air quality, alleviating the heat island effect, enhancing the comfort of external spaces, and connecting cool islands [16,17,65,66]. Currently, simulation analysis methods/tools commonly used for studying urban wind corridors include the Weather Research and Forecasting (WRF) model, geographic information system (GIS), and computational fluid dynamics (CFD). The WRF model is often used in large-scale simulation analysis of the overall urban meteorological environment. Its applications have been expanded to test the influence of certain parameters on the ambient air [18], but the level of detail of simulation results of the WRF model is still insufficient for the purpose of developing related detailed plans in urban planning and design. GIS application in urban wind corridor study is mainly used for 3D city model building, land use analysis, urban cool island analysis, and the analysis of urban ventilation potential. The data management functions of GIS can also help in managing related big data and graphic data for urban wind corridor planning. CFD is widely used in local-scale and site-scale ventilation environment assessment and pedestrian-level wind field analysis as mentioned above; however, due to limitations in computing capacity and grid system design, most of the current CFD software packages are still insufficient for conducting accurate simulation analysis on a very-large scale at the city level. Therefore, mathematical methods including the least cost path method and frontal area index (FAI) are generally employed to assist in identifying the major paths of urban wind corridors [11,12,13,67]. Since each simulation analysis tool has its functions and limitations, integrating related planning simulation analysis tools in order to fully utilize the advantages of each individual tool is an important research topic for optimizing the current simulation approach in urban wind corridor planning.
Under the impact of global climate change and the trend in the increasingly serious heat island effect, the planning and development of urban wind corridors have become an important planning topic and policy goal for promoting green cities [65,66]. However, although the importance of this topic and policy goal is increasing day by day, relatively few studies have provided a systematic and comprehensive investigation and analysis of urban wind corridor planning and related ventilation environment assessment from a multi-scale simulation analysis approach, nor have previous studies attempted to provide an integrated planning approach that explicitly explores related key issues simultaneously. These key issues include the following: how to estimate the current situation and the trend in land surface temperature and UHI intensity in an efficient way and how to connect urban wind corridor planning with urban land use planning and building layout design by integrating related simulation analysis methods/tools in order to achieve the goals of cooling cities and mitigating the urban heat island effect. In view of the problems indicated above and the demand for an integrated simulation analysis approach, this study attempts to develop a multi-scale urban wind corridor planning approach and ventilation environment assessment method in order to help mitigate the effect of urban heat islands. Through the integrated application of RS, GIS, and CFD, this study attempts to develop a new operational planning approach to foster the development of urban wind corridors. The research efforts also try to identify the main problems of building layouts affecting urban wind corridor planning and recommend planning strategies in order to create an urban living space with heat island effect reduction and good environmental quality.

2. Data and Methods

2.1. Study Areas

This study takes the central urban area of Zhumadian City in Henan Province of China as an empirical case for urban wind corridor planning (see Figure 1). Zhumadian City is located at 32°18′ to 33°35′ north latitude and 113°10′ to 115°12′ east longitude, with a total land area of approximately 15,083 square miles (approximately 191.5 km long from east to west, and 137.5 km wide from north to south) [66,68].
The city is located in the subtropical-to-warm temperate climate transition zone, which has a continental monsoon climate, with abundant rainfall and four distinct seasons. The main wind direction in the central urban area of Zhumadian is north-south. The prevailing winds in summer are southerly, and the sub-prevailing winds in summer are south–southwesterly and southeasterly. The frequency of a calm wind is high in urban areas, and the calm wind situation has an increasing trend. With the urbanization and expansion of the city, the problem of poor ventilation in urban areas has become obvious.
The urban form of the central urban area of Zhumadian is suitable for the planning of an urban wind corridor system. The orientation of the city’s major roads and railway lines is consistent with the prevailing wind direction in summer. The city’s government is also actively promoting the planning of urban wind corridors [65,66] and has developed a comprehensive green space system plan [68]. Currently, this city faces the dual pressures of rapid urban expansion and the need for urban renewal in some old districts. Therefore, Zhumadian provides an excellent empirical case for studying the introduction of urban wind corridor planning at a critical stage in urban expansion and urban redevelopment. This study employs a multi-scale simulation analysis approach. On the city scale, the central urban area of Zhumadian were selected as the urban wind corridor study region (see Figure 1) in order to conduct large-scale urban wind corridor planning and identify the main urban wind corridor paths in the city. This was followed by a local-scale ventilation environment assessment of two selected representative districts (i.e., the typical old-town blocks in the old district and the typical new residential blocks in the new district, as shown in Figure 1). These two representative districts are located at key locations of urban wind corridor channels. The local-scale simulation analysis attempts to identify the major problems of community ventilation and building layout patterns that favor or discourage community nature ventilation and provides suggestions for improving the situation.

2.2. Micro-Climate Measurement

In order to evaluate the ventilation environment of the selected pilot blocks on the paths of the main wind corridors in the study region and verify the results of CFD simulation analysis, this study conducted a micro-climate measurement of the selected building blocks by using mobile hot-wire anemometer (model: AM4214SD) and mnemonic humidity meters (model: HT-3007SD) (see Table 1). These two instruments are manufactured by the Lutron Company in Taiwan. The accuracy of the instruments can reach 0.10~20 m/s ± 5%. They were assembled on tripods about 1.60 m above the ground. The survey data were used for the assessment of the pedestrian wind field on the block scale.
The measurement time of our survey was between 8 July 2019 and 9 August 2019. This is the time period when the temperature in the study region is the highest and the heat island effect is more obvious. The micro-climate measurement was conducted on selected locations for two time periods each day of the survey time: from 9:00 a.m. to 11:30 a.m. in the morning, and from 13:30 p.m. to 16:00 p.m. in the afternoon. These two time periods were chosen because they represent the typical weather conditions in the morning and afternoon in the study region. As for the selection of measurement points, this study selected 28 to 30 measurement points for each representative strategic location under study. Figure 2 shows the measurement points of the demonstration urban blocks of the old district in Zhumadian City. The locations of the measurement points reflect the characteristics of the external space of the communities, including major nodes of public space, important traffic passages, key nodes of main roadways, important inflow air inlets, etc. We avoided locating these measurement points at the corner of buildings, so that they were not affected by corner winds. Six sets of instruments were used for simultaneous measurement at each survey site. The starting time of the measuring points was rotated in order to ensure that each measuring point had enough survey data for statistical analysis to calculate mean and mode values. Before the measurement instruments were used, the consistency of the measurement results was checked. Investigators were trained in advance to maintain precision and consistency in operations.

2.3. Research Methods and Data

2.3.1. Research Content

The main contents of this study include: (1) collection and analysis of meteorological data as well as estimations of land surface temperature and heat island intensity; (2) analysis of urban ventilation potential and related land use patterns; (3) analysis of the major paths of large-scale urban wind corridors; (4) CFD simulation analysis of key strategic locations for ventilation environment improvement; (5) identifying prototype building layout patterns with poor or good ventilation and developing planning strategies for improving the situation.

2.3.2. Data Acquisition

This research uses several kinds of data to achieve the research purposes, including: (1) meteorological data collected from government meteorological stations and actual micro-climate measurement data collected in this study in order to understand the characteristics and trends in the wind environment and temperature of the study region; (2) land use survey data collected by the city government’s planning agency in order to understand the land use patterns in Zhumadian City and analyze the major types of land cover as well as the spatial distribution of urban cool islands (e.g., forests, parks, green spaces, water bodies); (3) GIS shape file data (created by the city government’s planning agency) with polygon outlines and height information for all buildings in the research region, which were used to build the large-scale 3D digital city building volume model for wind corridor simulation and CFD analysis in this study; (4) population and housing data, which provided background information to understand the relationship between population density/household density and urban heat island intensity; and (5) satellite image data with thermal bands, which were used to calculate land surface temperature and urban heat island intensity.
Satellite image data from the NASA/USGS Landsat program were adopted to estimate and compare the changes in land surface temperatures over time. Considering the availability and comparability of the image data as well as cloud cover ratio (must less than 5%), images captured in and around the research region on 10 May 2018 and 18 August 2008 (captured by Landsat 8 and Landsat 5 satellites, respectively) were utilized in this research. Both image data were provided as Landsat Collection 2 Level 1 datasets. Thermal band images of these data were used for land surface temperature estimation, which were Band 10 from Landsat 8 and Band 6 from Landsat 5. In addition, the red band (Band 4) and near-infrared band (Band 5) from Landsat 8 images were used for Normalized Difference Vegetation Index (NDVI) calculation.

2.3.3. Research Methods

In order to conduct a systematic and comprehensive planning approach, this study attempts to integrate remote sensing (RS), GIS, CFD, and the least cost path method in order to conduct multi-scale urban wind corridor planning analysis and explore the usefulness of using the wind corridor effect to mitigate heat island impacts. The planning and simulation analysis process as well as the major steps are shown in Figure 3.
In this study, land surface temperature (LST) estimation and heat island intensity (UHI) analysis of the study region were first conducted using remote sensing in order to understand the situation and changes in urban heat island effects as well as identify the areas with strong urban heat island effects. Then, the 3D model building function and spatial analysis functions of the GIS were employed to explore the relationship between the spatial distribution of the heat island effect and land use patterns/development densities in order to understand the impact of land use patterns and development density on the urban heat island effect. This was followed by a large-scale wind corridor simulation analysis for identifying the main wind corridor paths by using the large-scale wind path analysis module of 2023 Version WindPerfectDX (based on the least cost path method and building frontal area index) in order to define the channels and scope of the main urban wind corridors and facilitate the development of relevant planning strategies and urban design control measures for introducing cool and clean airflows into the city. Finally, CFD simulation analysis at the local scale was conducted for selected representative urban blocks on the wind corridor paths (the selected pilot blocks in the old district and the selected pilot blocks in the new district shown in Figure 1) in order to find well-ventilated and poorly ventilated building layout patterns so as to suggest planning strategies to improve the situation. The research methods of the major research steps are described as follows.

Estimation of Land Surface Temperature and Urban Heat Island Intensity

(1)
2018 LST Estimation from Landsat 8 Image
In order to estimate the land surface temperature (LST) in and around the study region in 2018, the following steps were employed to estimate the land surface temperature by using the Landsat 8 image dataset [28,33,69].
A.
Convert DNs to TOA Radiance
The DNs from raw image data were first converted into top of atmosphere (TOA) radiance according to the product instruction from the USGS (Equation (1)) [33,69,70,71]:
L λ = M L × Q c a l + A L
where: L λ = TOA spectral radiance in Watts/(m2·srad·μm); M L = band-specific multiplicative rescaling factor; A L = band-specific additive rescaling factor; Q c a l = quantized and calibrated pixel values (DNs of the band being processed).
B.
Convert TOA Radiance to TOA Brightness Temperature
TOA radiance was later converted into TOA brightness temperature ( T B ) by using Equation (2) [28,33,69,71]. T B measures the temperature of conceptual blackbody and was used to estimate the land surface temperature in the next step.
T B = K 2 ln ( K 1 L λ + 1 )
where: T B = top of atmosphere brightness temperature (K); L λ = TOA spectral radiance in Watts/(m2·srad·μm); K 1 = band-specific thermal conversion constant; K 2 = band-specific thermal conversion constant.
C.
Estimation of Land Surface Emissivity
Land surface emissivity (LSE) was used as a correction to TOA brightness temperature to estimate LST [28,32]. LSE was calculated upon the proportion of vegetation ( P v ) using Equation (3). Where: ε denotes LES and P v denotes proportion of vegetation.
ε = 0.004 P v + 0.986
Proportion of vegetation ( P v ) was estimated based on the maximum and minimum value of N D V I (denoted as N D V I m a x and N D V I m i n ) derived from the image dataset using Equation (4):
P v = [ N D V I N D V I m i n N D V I m a x N D V I m i n ] 2
N D V I was calculated as instructed by the USGS [72] using the red band value (denoted as R) and near infrared band value (denoted as NIR) (see Equation (5)):
NDVI = (NIRR)/(NIR + R)
D.
Estimation of Land Surface Temperature
Land surface temperature (LST) was finally estimated with Equation (6) [28,33,70].
L S T = T B 1 + ( λ × T B / ρ ) ln ε 273.15
where: L S T = the emissivity corrected land surface temperature (°C); T B = TOA brightness temperature (K); λ = wavelength of emitted radiance of satellite images; ρ = h × c/σ (1.438 × 10⁻² m·K), c = velocity of light (2.998 × 10⁸ m/s), σ = Boltzmann constant (1.38 × 10⁻²³ J/K), and h = Planck’s constant (6.625 × 10⁻³⁴ J·s); and ε = the surface emissivity of the satellite image.
(2)
2008 LST Estimation from Landsat 5 Image
For the 2008 LST estimation, the Landsat 5 image was used. The process was as follows. First, DNs of the thermal band (Band 6) were converted into radiance using Equation (7):
L λ = L M A X λ L M I N λ Q C A L M A X Q C A L M I N × Q C A L Q C A L M I N + L M I N λ
where: L λ = spectral radiance; Q C A L = quantized calibrated pixel value in DN; L M A X λ = spectral radiance scaled to Q C A L M A X in Watts/(m2·srad·μm); L M I N λ = spectral radiance scaled to Q C A L M I N in Watts/(m2·srad·μm); Q C A L M I N = minimum quantized calibrated pixel value (corresponding to L M I N λ ) in DN; and Q C A L M A X = maximum quantized calibrated pixel value (corresponding to L M A X λ ).
After that, the radiance values were converted into T B using Equation (2).
(3)
Estimation of Urban Heat Island Intensity
Urban heat island (UHI) intensity can be defined as the difference between the temperature in the urban cluster and that of the surrounding rural areas [15,73]. To map the intensity of the urban heat island (UHI), the urban areas were first identified with reference to the panchromatic band from the Landsat image dataset. The difference between the LST in the urban area and the average temperature of outskirt areas (rural areas) was then calculated and used to estimate the UHI intensity. The equation is shown as follows (see Equation (8)). The higher the difference, the more severe the UHI.
UHI = TsTrural
where: UHI denotes urban heat island (UHI) intensity; Ts denotes the land surface temperature (LST) at the observation location in the urban area; and Trural denotes the mean temperature of the surrounding rural areas.

Analysis of Urban Wind Corridors Using the Least Cost Path Method and the Building Frontal Area Index (FAI)

With regard to simulation analysis of urban wind corridor simulation analysis, there are currently three commonly used methods for identifying the major urban wind corridor paths: (1) Using the least cost path method and building frontal area index (FAI) to simulate and identify the paths of large-scale urban wind corridors [11,12,13,65,67]. (2) Employing CFD simulation analysis to study the circulation of airflows at the district level, so as to identify local wind corridor paths. (3) Using planning judgments and designating the main urban roads and green open spaces of the city as the main urban wind corridors [16,17]. The first two methods can provide scientific information useful for policy discussion; however, most of the current CFD simulation analysis used in the second method is limited by computing capacity and cannot be performed with very-high precision in city-scale analysis. The third method is relatively subjective and lacks a scientific empirical basis for public discussion. In order to provide a systematic and scientific research approach and analysis, this study attempts to combine the first and the second methods. First, large-scale urban wind corridors were designated based on the simulation analysis of major urban wind corridor paths using the least cost path method and calculation of the building frontal area index. This was followed by local-level CFD simulation analysis, which was used to explore the ventilation environment and airflow circulation of selected key locations that affect the ventilation effect of the major urban wind corridor channels
This study employs the least cost path method and frontal area index (FAI) to analyze the main paths of urban wind corridors in the study region. The minimum cost path method uses map algebra operations to find the minimum cost path between origin and destination points. This method has been used in several studies and has proven a useful tool for conducting wind corridor planning [11,12,13,67]. Some software packages (such as 2023 version WindPerfectDX) contain special modules for conducting simulation analyses of large-scale urban wind paths using the least cost path method and frontal area index. In actual operation, cost-weighted distance and direction surfaces are used to find the most cost-effective path between each origin and destination. The calculation of the frontal area index (FAI) refers to the ratio of the windward area of the building in the incoming wind direction to the maximum possible windward area, as shown in Equation (9).
λf = Afacets/Aplane
where: λf = the frontal area index; Afacets = the total area of the building surface on the windward side; and Aplane = the area of the windward plane.

CFD Simulation Analysis for Ventilation Environment Assessment

(1)
The Process of CFD Analysis
Computation fluid dynamics (CFD) numerical simulation analysis and WindPerfect DX software were employed to analyze the wind environment of the research areas. The CFD numerical simulation analysis in this study was divided into three stages: (1) Pre-processing: build the 3D digital city model of the study region and convert it to an STL file, setting the grid system and boundary conditions. (2) Analytical calculation: execute CFD simulation analysis including setting the number of calculation iterations, simulation time, convergence conditions, etc. (3) Post-processing: read and analyze simulation result files, visualize the results, and output the result files for planning reference. The process of CFD simulation analysis on the local scale ventilation assessment is shown in Figure 4.
(2)
Building the 3D Digital City Model of the Study Region
Establishing a large-scale 3D digital city model was a very time-consuming task in this study. The 3D digital city building volume model of the study region was developed based on the 2019 GIS data from the planning agency of the city government. The GIS data from the city government have a layer file containing the outline polygon and building height information of all the urban buildings. This study used the functions of ArcGIS to build the 3D digital city building volume model. After the GIS 3D digital city building volume model was generated, satellite images from the same time point were used to check the accuracy of the model. If any missing building units or mistakes were found, the 3D digital city building volume model was corrected based on satellite images and actual survey data. The 3D digital city building model comprises digital solid blocks that reflect the actual building layout patterns. It is worth mentioning that in order to effectively conduct numerical simulation analysis, when building the large-scale 3D digital city building volume model, the details of building volumes must be appropriately simplified to reduce the total number of faces of the 3D digital city model. To meet this requirement, this study simplified the details of building volumes when building the 3D digital city building volume model first, and then used the software’s face simplification function to delete unnecessary triangular surfaces in order to control the total number of faces in the 3D digital city building volume model.
After the 3D digital city model was finally completed, it was then converted into an STL file and input into the CFD software for subsequent simulation analysis. The 3D digital city model of the study region after being input to WindPerfectDX software is shown in Figure 5. The 3D digital city model needed to be checked for broken surfaces, and the total number of surfaces of the model needed to be reduced in order to facilitate urban wind corridor analysis in the CFD software.
(3)
Setting the Grid System of the CFD Models for District Level Analysis
The scale of analysis in this study includes two scales: city scale and local scale. The city-scale grid system setting regards the overall city model as a complete scope for grid system setting. This study first used WindPerfectDX software to setup the grid system, approximately 20 m per grid, and then used the large-scale wind path analysis module of WindPerfectDX to refine the grid system. The final grid system was approximately 6–8 m per grid cell (mesh). After repeated testing, it was found that this grid system setting can effectively be used to explore the airflow circulation and ventilation conditions of urban streets and external spaces in the research region. In terms of the grid system setting for local-scale CFD analysis in this study, the division of the grid system was set in three areas: the focus area, the block area, and the whole area. In accordance with relevant research practices, the focus area includes the major blocks of the district under study; the block area includes the surrounding built environment; and the whole area includes the surrounding wind field environment. The grid (mesh) system’s transition between the focal area, the block area, and the whole area needed to be gradual and smooth. For the two pilot districts under study, the grid size was adjusted according to the actual situation. Therefore, the ventilation conditions of the small alley spaces and small external spaces between buildings in the focus area could efficiently and accurately be analyzed. The following takes the selected pilot blocks of the old district in Zhumadian city as an example to illustrate the setting of the grid system on the local scale in this study.
Figure 6 shows the grid system settings of the CFD analysis of the selected pilot blocks and surrounding areas of the old district in Zhumadian City under study. Since there are some narrow alleys in the study area, the grid system in the focus area was set to an average grid size of approximately 1.0 m in order to allow for analysis of the ventilation status of narrow traditional alleys in the area. Also, the grid system setting of the Z axis had to be able to cut at least one section (layer) within the range of the pedestrian-level wind field (urban spaces with a height of 1.5 to 2 m above the ground). Based on the above principles, the total number of meshes set for the CFD simulation analysis of this case was about 32.7 million meshes.
(4)
Setting Weather Conditions and Boundary Conditions
Regarding the setting of simulation conditions, this research is based on the analysis of the past ten years of data from related national meteorological stations and our field measurements. Through the data collection and analysis of daily and hourly meteorological data from meteorological stations in the research region, the main prevailing wind directions and average wind speed were calculated. The result of the analysis of meteorological data was reviewed in conjunction with the actual micro-climate measurement data in the research areas to help determine the simulation parameter settings, such as wind direction and average wind speed that best represent the actual wind conditions of the study areas. Regarding the setting of boundary conditions for the CFD simulation, the velocity inlet was set as the gradient wind, where the vertical wind speed distribution was represented by the power law profile (see Equation (10)); the rest of the external space was set as outflow; and the land surface was set as a no-slip condition.
U ( Z ) U 0 = ( z δ ) α
where: U0 = wind speed (m/s) outside of boundary layer (also known as the gradient velocity); U(Z) = the wind speed at the height of Z (m/s); z = the reference height (m); δ = the height of gradient (m); α = power law value (index).
According to the wind resistance design specifications, the common practice in wind engineering simulation, and our previous research experiences, the height and the power law value of the boundary layer were determined based on the terrain conditions (roughness) of the study area. The actual terrain condition of the study area for local-scale CFD analysis is Condition A (roughness level); therefore, the power law value was set to 0.32 and the height of the boundary level was 500 m according to the wind resistance design specifications and the standard commonly used by the wind engineering society. The wind velocity is 2.25 m/s, and the wind direction is southerly. Regarding the selection of turbulence models, the Large-Eddy Simulation (LES) model and RAND/URANS models were compared based on the related literature [54,74,75] and modeling tested in this study. Considering factors such as the geometry of the model, the accuracy of results, and the computing resources and costs, this study finally employed the LES turbulent model, and the time step used in the LES model was 0.01 s. WindPerfectDX was the software employed. Its advantages include the capacity to develop a very-fine grid system as well as the ability to import SketchUp 3D digital city model files easily. Also, it has a strong visualization capacity, which makes communication with developers and the general public easier. This study used the 2023 special professional version of WindPerfectDX, which can reach a total mesh number of up to 80 million and supports large-scale urban simulation analysis. Finally, the results of the CFD simulation analysis were validated to determine their reference ability.

3. Results

3.1. Analysis of Wind Conditions

After analyzing the meteorological data collected by the national weather stations in the study region, it was found that the prevailing winds in summer in the study region are southerly, while the sub-prevailing winds are south–southwesterly and southeasterly. Figure 7 shows the wind rose chart according to the daily and hourly meteorological data of the government’s weather stations between 2010 and 2019. The analysis results show that southerly and south–southwesterly winds can be used as the summer prevailing wind and sub-prevailing wind, respectively, for conducting urban wind corridor planning.
In addition, in order to understand how the average monthly wind speed changes over the course of a year, this study sorted the monthly average wind speed data of the related national meteorological stations between 1990 and 2019, and the analysis result is shown in Figure 8. It can be noted from Figure 8 that August is the month with the lowest average wind speed. Since Zhumadian City is hot in August, improving urban natural ventilation in the summer is important to help mitigate the heat island effect.

3.2. Estimation of Land Surface Temperature and Urban Heat Island Intensity

This research utilizes Landsat satellite image data to estimate land surface temperature (LST) and to reveal the change in the urban heat island effect in Zhumadian city between 2008 and 2018. After carefully selecting Landsat image datasets that represent summer weather conditions in the study region and also have very-low cloud cover ratio, the Landsat images captured on 18 August 2008 and 10 May 2018 through the NASA/USGS Landsat program were adopted. The results of the Landsat satellite image analyses in 2008 and 2018 are presented in Figure 9. The grading of the analysis results of land surface temperature was set by considering the frequency distribution and standard deviation of the estimated value of pixels as well as the consistency of the class break values in high-temperature areas of the two images for easy comparison. To test the accuracy of our estimation results of land surface temperature retrieval analysis, this study compared the analysis results of the spatial distribution LST and heat island intensity with the spatial distribution of building density and building intensity (the built-up urban areas with high temperature) using GIS spatial mapping and overlaying analysis in order to confirm the accuracy of the surface temperature inversion estimation results.
As revealed in Figure 9, land surface temperature analysis results show that the urbanized areas of Zhumadian city are experiencing warming. By comparing the 3D digital city model and the results presented in Figure 9, it can be seen that the central urban area and areas with high development intensity are also the areas with a high land surface temperature. In addition, by comparing the result of 2008 and 2018, it can be noted that after 10 years, the areas with high land surface temperature have increased significantly along with the trend in rapid urbanization and urban sprawl. Besides, it should be noted that since there is no multi-year image data with very low cloud coverage available for the same summer month, this study used two images of different month to study the changes in the past ten years. The impact of the farming period and agricultural land use cycle in the suburban areas needs to be considered when comparing the change of LST in suburban areas. The surrounding suburbs of the central urban area of Zhumadian City are mainly agricultural land. In late August, the harvest period has just ended and new sowing has not yet begun, so most of the farmland is exposed and the temperature is relatively high when there is sunshine during the day. Therefore, the LST of agricultural land in these suburbs around the city estimated using August 18 image of 2008 appears higher than that in 10 May 2018 when spring plowing has not yet been harvested.
After estimating the land surface temperature, estimation of the urban heat island (UHI) intensity was conducted based on the results of the land surface temperature analysis. The analysis results of the 2008 Landsat image and the 2018 Landsat image are shown in Figure 10. The results reveal that urban heat islands occur in most of the urbanized areas, including central urban areas and the surrounding areas along with rapid urbanization. Given that the phenomenon of urban heat islands in the urbanized areas of Zhumadian City is becoming increasingly obvious alongside the city’s rapid urbanization and urban expansion, if the cleaner and cooler airflows from the surrounding rural areas can be brought into the city through urban wind corridors (e.g., the cool airflows from the southwest woodlands), the impact of the heat island effect may be reduced to certain degree. Also, the analysis results of land surface temperature and heat island intensity show that high heat island intensity locations in Zhumadian City are mainly concentrated in several urbanized areas, including some old urban districts, high-density built-up areas and eastern industrial areas. Therefore, how to introduce cooler airflows through urban wind corridors to cut the heat islands as well as alleviate the spread of the heat island effect has become an increasingly important issue in urban planning and design.

3.3. Planning of Large-Scale Urban Wind Corridors

This study uses the central urban area of Zhumadian city as the pilot study region for conduct urban wind corridor planning. To conduct major wind corridor path identification, a grid system of 6~8 m per grid was used for large-scale urban simulation analysis. The analysis results were validated with data from related national weather stations and our micro-climate measurements of key locations. Large-scale urban wind corridor path simulation analysis was conducted for the prevailing southerly summer winds and the sub-prevailing south–southwesterly winds of the study region. After repeated model simulation testing and model refinement, the major urban wind corridor paths with the highest probability were identified. The analysis result for the prevailing southerly summer winds is shown in Figure 11, and the identified major urban wind corridor channels are shown in Figure 12. It should be noted that the paths derived from the results of the large-scale simulation analysis are three-dimensional urban wind paths. Considering the average building height and land development status of the study region, the analysis of the main urban wind corridor paths at the city scale focused on urban spaces ranging from a height of 10 to 25 m above the ground. The simulation analysis results reveal that urban form and building layout patterns are two key factors influencing the development of urban wind corridors in the study region. As shown in Figure 11, the urban form of the north–south road system in the central urban area of Zhumadian City is consistent with the direction of the prevailing winds in summer, which is conducive to the development of an urban wind corridor system. Also, it can be noted from Figure 11 that the corridor of Jingguang (Beijing-Guangzhou) Railway and several spacious north–south arterial roads have the potential to serve as the main urban wind corridors. In summary, the major roads that have potential to serve as major urban wind corridors include Tongshan Ave., Tianzhongshan Ave., Wenming Ave., Leshan Ave, Qianjin Ave, and Xingye Ave (see Figure 11 and Figure 12). However, the continuity of the city’s main wind corridors in some road sections is interrupted due to problems regarding improper building layouts and land use patterns; furthermore, some enclosed large building complexes as well as large and tall building masses at certain key locations also obstruct the linkage of urban wind corridors (see Figure 13). Figure 12 shows the main urban wind corridor channels identified in this study. These major wind corridor channels include a first-level urban wind corridor channel formed by the Jingguang Railway Line corridor and several second-level wind corridor channels formed by arterial roads. In order to explore the implementation of urban wind corridor planning, this study identified the key strategic ventilation improvement points (locations) that affect the development of urban wind corridor system. The analysis result is shown in Figure 13. These include key ventilation barrier sites and the demonstration blocks in this study (the typical old-town blocks of the old district and the typical new residential blocks of the new district), as shown in Figure 13 (the yellow-colored blocks). The key ventilation barrier points (sites) are mainly formed due to narrow road sections, improper building layouts, and massive building volumes on wind corridor paths. For the demonstration blocks, CFD simulation analysis of the ventilation environment was carried out and is discussed in the following section.
In addition to simulation analysis of the prevailing southerly winds, this study also simulated and analyzed the main urban wind corridor paths for the sub-prevailing south–southwesterly summer winds. The result is shown in Figure 14. The analysis result shows that if the sub-prevailing winds are south–southwesterly in the summer, Tianzhongshan Ave., Wenming Ave., and Jingguang railway corridor can serve as the major urban wind corridors of the city. The first two arterial roads and the railway corridor were also identified as the major wind corridors for the prevailing southerly summer winds, therefore further confirming their importance in developing city-level wind corridors. According to the simulation analysis results of the prevailing and sub-prevailing summer winds, it is suggested that priority should be placed on these arterial roads and the Jingguand Railway corridor when implementing Zhumadian’s urban wind corridor planning.

3.4. Integrated Analysis of GIS Spatial Analysis and Urban Wind Corridor Planning

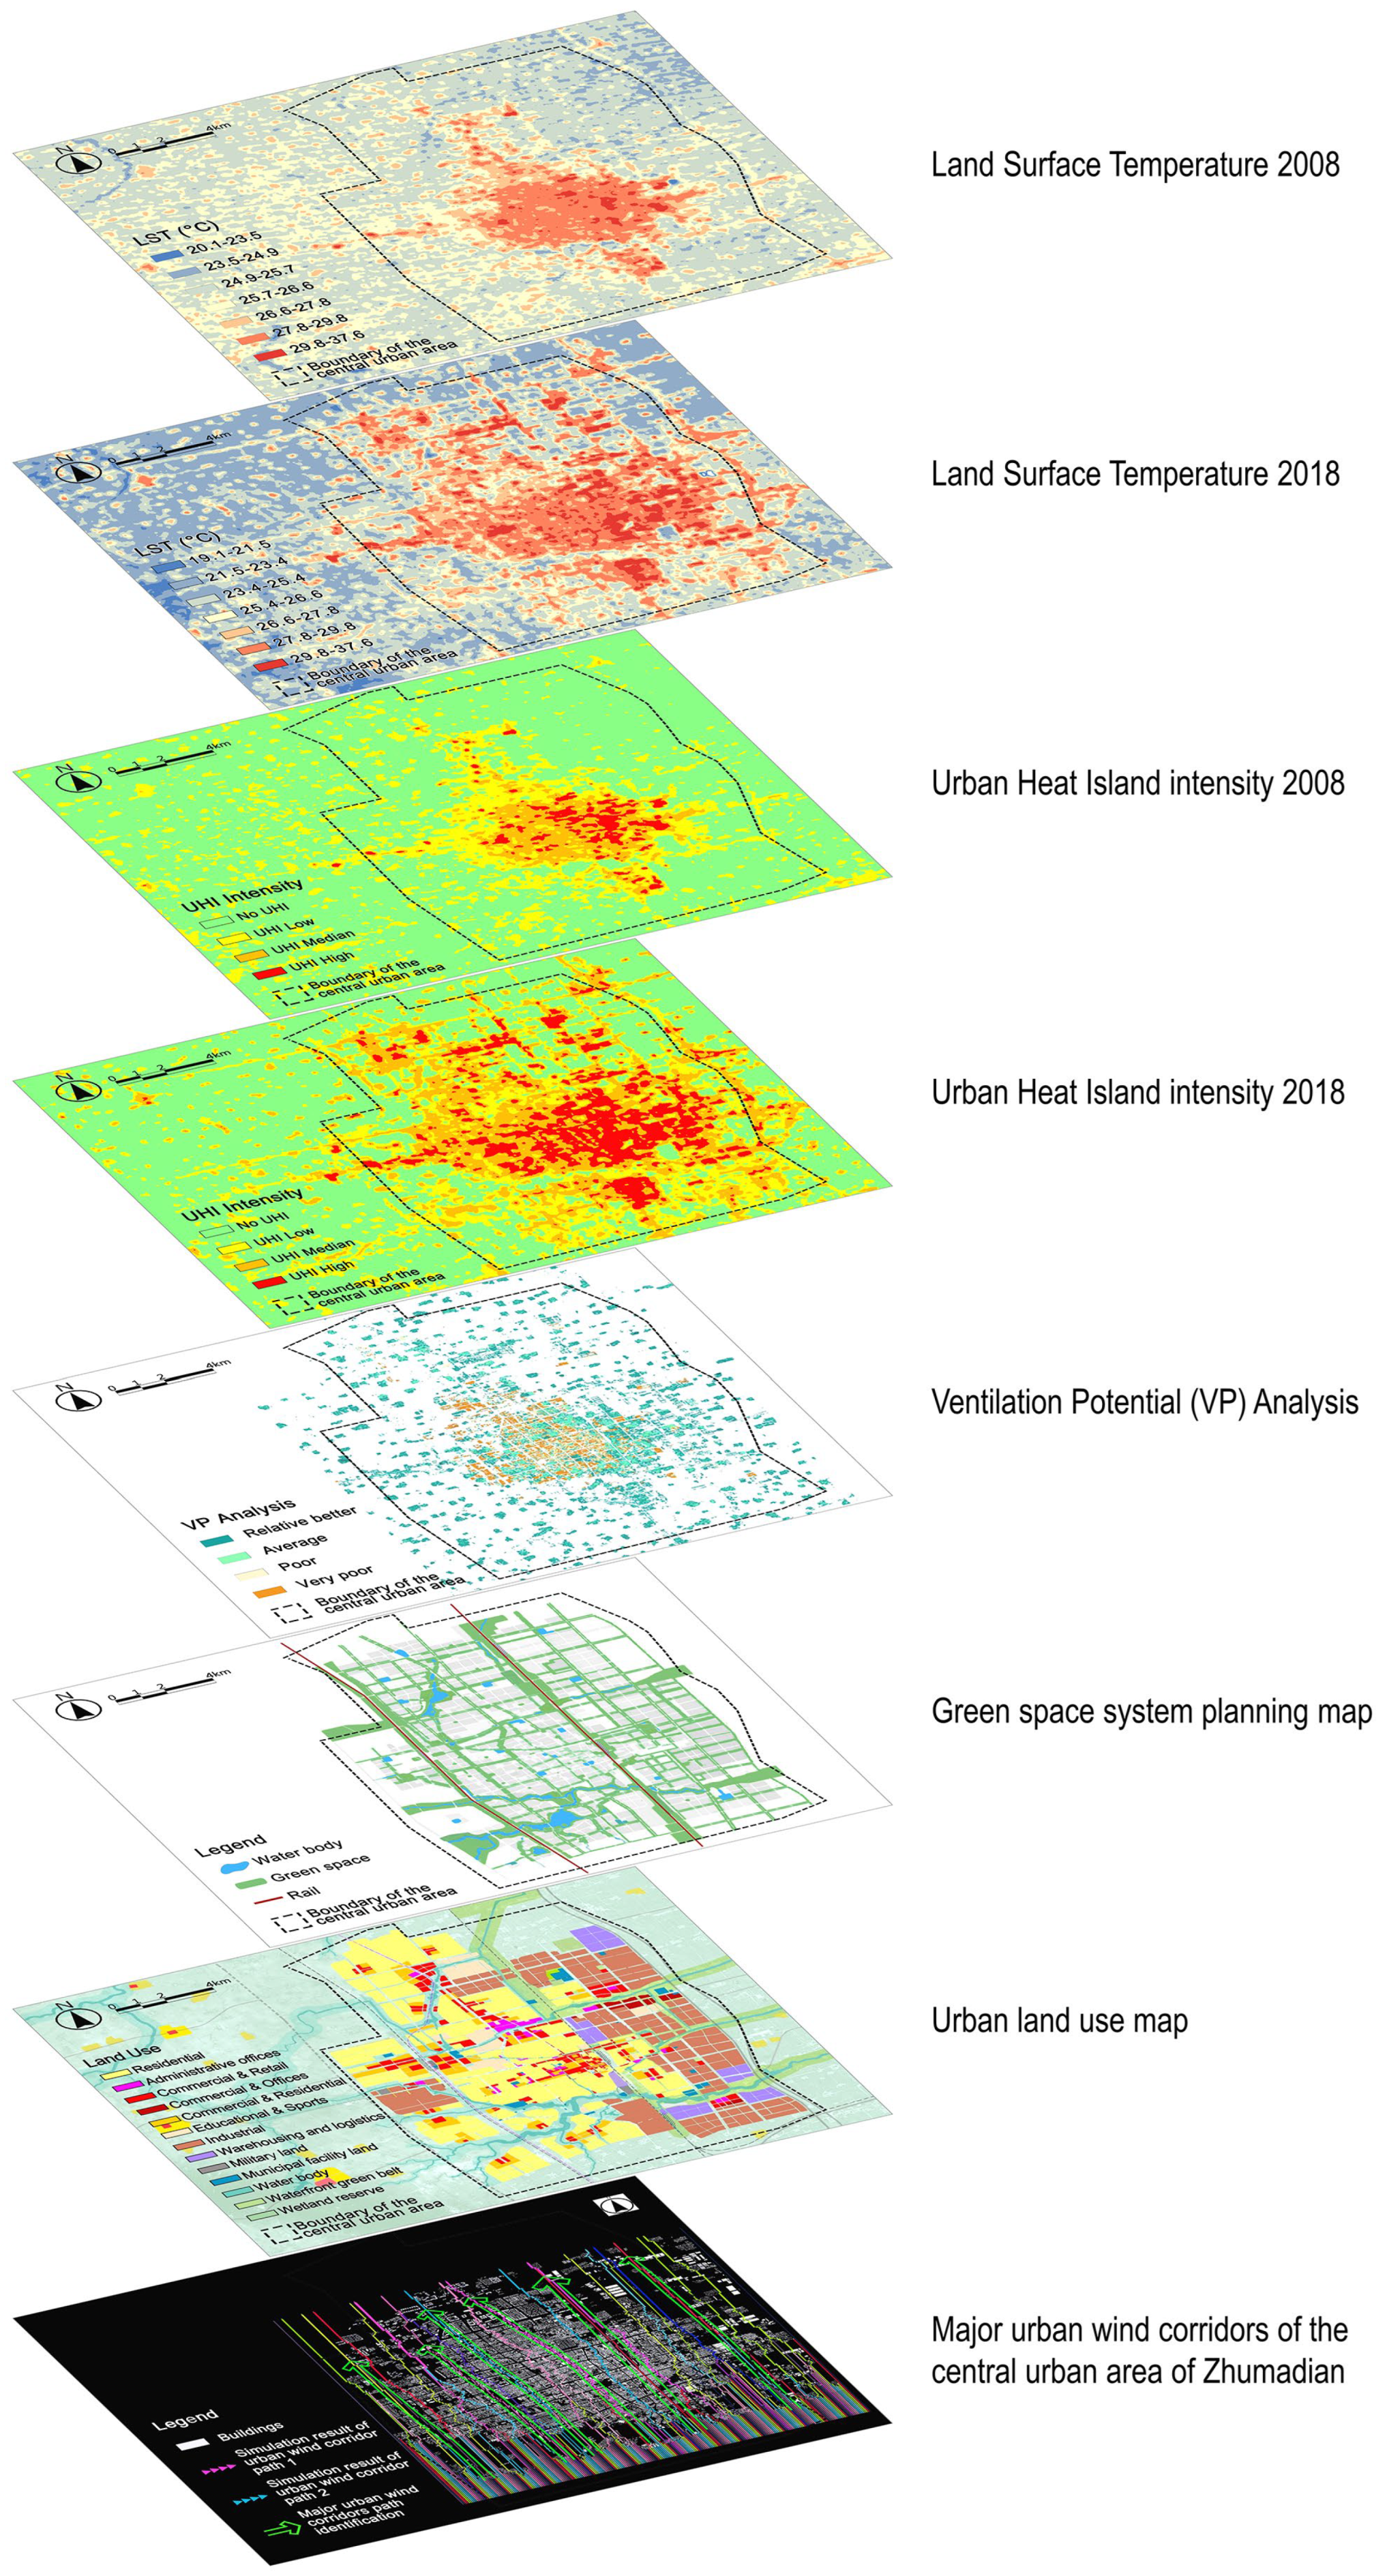
In order to efficiently manage and analyze the large amount of data required for urban wind corridor planning, this study employed a GIS to integrate related land-use data, 3D digital city model data, meteorological data, population and housing data, urban heat island effect estimation results, urban cool island data, etc. Using the GIS’s functions of spatial mapping and spatial overlay analysis, the relationships between related key planning elements (e.g., land-use patterns, spatial distribution of population and housing density, urban form and urban structure, major urban open spaces) and urban heat island effects were explored. A portion of the data analysis results is summarized in the overlay diagram shown in Figure 15 (on the following page), which reveals that between 2008 and 2018, the scope of urban warming and urban heat island effects in the central urban area of Zhumadian City expanded along with the increase in urbanized areas. From the overlap analysis of relevant influencing factors, it can be seen that the spatial distribution of urban heat island intensity is related to land-use patterns, the ventilation potential indicator, and the spatial distribution of urban cool islands (water bodies and green spaces).
The calculation of the ventilation potential indicator (VP) in Figure 15 was based on the analysis of the building density, building height, urban roughness, and sky view factor calculated using the 3D digital city model and GIS land-use data. The green space system planning map and urban land use map are generated based on the Comprehensive planning of Zhumadian city (2018–2035) [68]. Based on integrated analysis of GIS spatial analysis and urban wind corridor path analysis, it can be noted that the development of urban wind corridors can introduce cleaner and cooler airflow from surrounding rural areas into the city as well as connect urban cool islands and cut heat islands areas, which should mitigate the phenomenon of urban heat islands in the study region.
In summary, the 3D analysis and spatial analysis functions of the GIS played an important role in exploring the relationships between the spatial distribution of heat island intensity and urban wind corridor planning/land use planning. Using the simulation of urban wind corridor paths and integrated GIS spatial analysis, it can be found that factors such as urban form and urban land-use patterns as well as building layout models of some key locations will influence the development of urban wind corridors. This was further explored in this study using CFD simulation analysis and is discussed in the following paragraphs. This research shows that through the integration of relevant data by using the GIS platform, relevant big data and graphic data can be more efficiently managed, which is helpful when conducting multi-scale urban wind corridor planning.

3.5. CFD Simulation Analysis of the Key Strategic Locations (the Pilot Urban Districts) for Urban Ventilation Improvement

After the analysis of large-scale urban wind corridor paths and identification of key strategic ventilation improvement points (locations), this study proceeds to analyze two key strategic locations (the typical old-town blocks of the old district and the typical new residential blocks of the new district, as shown in Figure 1 and Figure 13) in order to assess their ventilation status and find key factors affecting urban ventilation. Before discussing the CFD simulation results, the model validation process is explained as follows.

3.5.1. Model Validation

In order to verify the reference ability of the simulation results of the CFD simulation model, this study examines the simulation model and simulation results in the following ways: (1) the simulation analysis results must reach the threshold of the convergence curve, and the convergence curve should show a trend toward convergence (see Figure 16 as an example); (2) the simulation results should conform to the principles of related wind theories and the actual wind environment. After model calibration and model refinement, the results of the convergence curves of our CFD simulation analysis show that all the final models tend to converge and meet the convergence threshold requirements, and the outcomes are reasonable according to wind engineering theories and the real situation. This study also compares the results of the CFD simulation analysis with the results of our micro-climate survey in order to examine the accuracy of the simulation model. This model validation process was conducted for the selected blocks in both the old district and the new district in Zhumadian City. Using the selected typical blocks of the old district as an example, the validation process and results are summarized as follows: In the model validation process, a CFD simulation model based on the current situation was first calibrated; then, the CFD simulation results were compared with the results of our micro-climate survey conducted on the site. Part of the results are shown in Figure 17. The results show that the simulation values at measurement points D2, D6, D11, D20, and D26 (see Table 2 for the locations of the measurement points) are close to the measured values, which indicates that the model is reasonable. In addition, a correlation analysis between the simulation values and measured values of the measurement points was conducted for all measurement points, and the results show a Pearson correlation coefficient r = 0.745 (p < 0.05), which indicates that the simulation results were close to the measured results. This further confirms that the CFD simulation model can be used in the subsequent scheme assessment and analysis.

3.5.2. CFD Simulation Analysis of Typical Urban Blocks at the Key Strategic Ventilation Improvement Locations of Urban Wind Corridor Routes

In order to find the major urban ventilation problems at the local scale, CFD simulation analyses for the typical urban blocks at the key strategic ventilation improvement locations were conducted, and the simulation analyses results are summarized as follows.
The main analysis sections of the local scale wind assessment are the pedestrian wind field at a height of 1.5–2.0 m above the ground. The typical urban blocks analyzed included the typical old-town blocks of the old district and the typical new residential blocks of the new district shown in Figure 1 and Figure 13. According to the Beaufort wind force scale and the characteristics of the wind environment in the study region, the average wind speed of the pedestrian-level wind field in the summer falling in the range of 1.0 m/s to 3.0 m/s is a comfortable wind speed for outdoor activities. However, when it is lower than 0.6 m/s (the deep blue color areas in the following simulation result figures), it is considered poor ventilation with a calm-wind or no-wind situation. The criteria are consistent with the suggestion of a previous study in Hong Kong by Yuan and Ng (2012), which classifies the pedestrian-level natural ventilation in the street canyon as: stagnant (u < 0.3 m/s), poor (0.3 m/s ≤ u < 0.6 m/s), low (0.6 m/s ≤ u < 1.0 m/s), satisfactory (1.0 m/s ≤ u < 1.3 m/s), and good (u ≥ 1.3 m/s) [57]. The CFD simulation analysis of the selected typical urban blocks (demonstration blocks) in this study was based on the prevailing wind being southern wind in summer. The following floor plan maps show the CFD simulation analysis results with a height of about 1.60 m above the ground.

CFD Analysis of the Demonstration Old-Town Blocks in the Old District

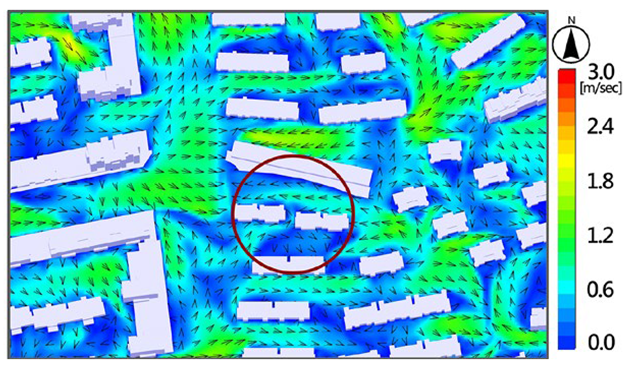
The research area of the old district in this study is about 545 m long and 510 m wide. It is a demonstration urban redevelopment site (superblock) with unique traditional residential buildings that need to be preserved. The buildings in this area have various building forms and building layout patterns, resulting in different ventilation effects. Figure 18 shows the 3D building model of the CFD simulation analysis areas constructed in this research and photo images of the major building types in this district. The dense square-shaped residential buildings in the demonstration blocks are typical traditional housing units in Zhumadian City, while some of the peripheral areas of the research blocks are middle-rise apartments and high-rise buildings built after 1980s. Figure 19 shows the overall CFD simulation analysis result of the research blocks and the surrounding areas, and Figure 20 shows the enlargement of the CFD analysis results of the demonstration blocks (Figure 19 and Figure 20 show the simulation results at height of about 1.6 m above the ground). Figure 21 shows a selected sectional view of the CFD analysis result. It can be noted from Figure 19 and Figure 20 that the outdoor ventilation environment in most areas of the research district is not good in summer, and there is no obvious wind corridor effect introduced to the inner open space of the dense square-shaped residential building communities in the blocks.
From Figure 19, Figure 20 and Figure 21, it can be noted that although the effect of some wind corridors has been introduced to the communities on both sides of the wind corridors, the ventilation of the external spaces in the traditional square-shaped enclosure housing and in some old residential buildings is generally not good. The problem of the ventilation environment in the old district is mainly due to the high-density land development of the old urban communities and the enclosed building layout patterns, resulting in poor ventilation in the district. In addition, the lack of continued wind corridor routes in the district also affects the corridor effects being introduced to the open spaces of some communities (see Figure 19 and Figure 20). Moreover, the large and long building volumes arranged on the windward side of the summer prevailing winds also prevent the introduction of wind corridor effects to the open spaces of some communities (see Figure 21). Using CFD simulation analysis and field investigation and analysis, this study attempts to identify the basic building layout patterns with poor ventilation (see OBs in Figure 22) or good ventilation (see OGs in Figure 22) in the old district of Zhumadian City and analyzes the main factors affecting the ventilation condition of external spaces. The analysis results are summarized in Figure 22 and Table 2 and Table 3. These prototype patterns can serve as a design pattern language for community design and urban redevelopment in order to promote the concept of wind friendly urban planning and design.
A.
Analysis of Old District Poor Ventilation Building Units (OBs)
This research attempts to identify the basic building units and layout patterns with poor ventilation in the old district (poor ventilation building units of the old district, hereinafter referred to as OBs in Table 2) and analyze the major reasons for their poor ventilation. The research results show that small building spacing, densely land development, long and tall building volumes on the summer windward side, high-rise buildings on the outside and low-rise in the middle, a lack of proper opening of enclosed building cluster, and the square-shaped enclosed buildings without proper openings are the major reasons leading to the poor ventilation of the external spaces of these building units. The locations of the building units with poor ventilation in the old district are shown in Figure 22, and the analysis of ventilation problems and the basic building layout patterns is shown in Table 2. Some of the suggested alternatives in Table 2 employed the scenario analysis method, which assumes how the situation would improve if this method were conducted.
B.
Analysis of Old District Good Ventilation Building Units (OGs)
Although the overall ventilation condition of the research blocks of the old district is not good, there are still several well-ventilated building units. After CFD simulation analysis, this study identified two well-ventilated building units in the old district (good ventilation building units of the old district, hereinafter referred to as OGs in Table 3), and the influencing factors are discussed below. The locations of well-ventilated building units of the old district are shown in Figure 22, and the analysis of prototype good ventilation building layout patterns is summarized in Table 3.

CFD Simulation Analysis of the New Residential Blocks in the New District

The new residential blocks of the new district analyzed in this study are the result of a new housing development. This is a representative case of high-ranking residential community development in Zhumadian City (See Figure 23). The entire residential development project includes two large urban blocks. The project employs the superblock concept and the planned unit development (PUD) model, with various residential building types, good community greening, and sufficient spacing between adjacent buildings (See Figure 23). The area of the researched blocks is about 830 m long and 510 m wide. A 3D model of the entire community and photos of major building types are shown in Figure 23.
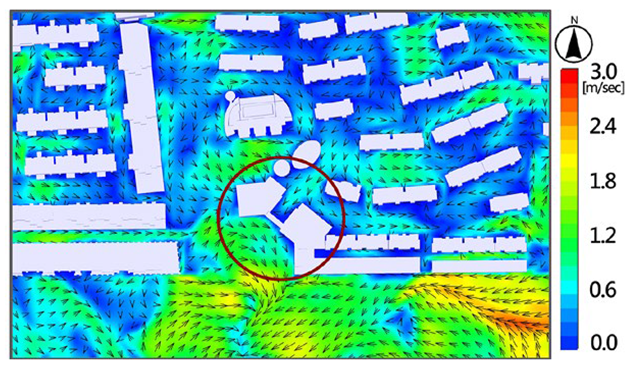
The CFD simulation analysis result of the demonstration new residential blocks is shown in Figure 24. The figure shows the CFD simulation result of the pedestrian wind field at a height of about 1.6 m above the ground. It can be seen from Figure 24 that the ventilation environment of the residential block external spaces in the new district varies greatly. There are residential building clusters with good ventilation; however, there are also building units with relatively poor ventilation. This reflects some problems that must be paid attention to in the planning and design of residential communities.
Figure 25 shows the enlargement of the CFD analysis result of the demonstration blocks in the new district at a height of about 1.6 m above the ground. Figure 26 shows a selected sectional view of the CFD analysis result. The results show that the residential buildings on the east side of the block arranged in a staggered spatial layout together with sufficient spacing between buildings result in better ventilation in the external space.
However, due to the land development project employing a superblock concept—which places tall and large building volumes on the periphery of the community to surround the internal low-rise buildings so that the summer windward side is blocked by long and high-rise buildings—inflow winds are not easily introduced to the community.
Using CFD simulation analysis and field investigation, this study also identifies basic building layout patterns with poor ventilation (poor ventilation building units of the new district, hereinafter referred to as NBs) and good ventilation (good ventilation building units of the new district, hereinafter referred to as NGs) of the demonstration blocks in the new district (see Figure 27), examines the main factors affecting ventilation conditions, and suggests improvement strategies. The analysis results are described below.
A.
Analysis of New District Poor Ventilation Building Units (OBs)
This study identified several poorly ventilated building units in the demonstration blocks of the new district and analyzed the reasons for poor ventilation. The research results show that the major factors affecting the ventilation of the study area are that the building layout failed to leave appropriate ventilation openings and that the building volumes are too long and tall on the summer windward side. The locations of the building units with poor ventilation of the demonstration blocks in the new district are shown in Figure 27, and the analysis of ventilation problems is summarized in Table 4.
B.
Analysis of New District Good Ventilation Building Units (OGs)
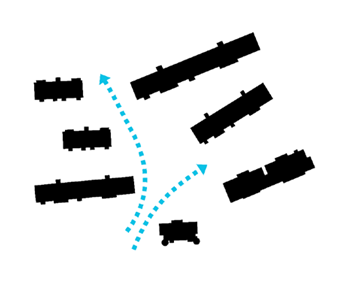
There are also some well-ventilated building units in the new district. Using CFD simulation analysis and field investigation, this study selected the following three well-ventilated building layout patterns for analysis. The analysis results are shown in Figure 27 and Table 5.

4. Conclusions and Recommendations

4.1. Promoting Urban Wind Corridor Planning as a New Approach to Mitigate Urban Heat Island Impact

This study explored how to conduct urban wind corridor planning and community ventilation improvement in Zhumadian City by using a multi-scale simulation analysis that integrated RS, GIS, and CFD in order to alleviate the impact of the urban heat island effect. The analysis results show that factors such as urban form, land use patterns, orientation and width of the major urban roads, building layout patterns, and the location and size of building openings are the key factors affecting the development of urban wind corridors. This research also shows that urban wind corridor planning in Zhumadian City can play an important role in mitigating the impact of urban heat islands.
By analyzing the study region’s meteorological data and land surface temperature at two time points, this research found that urban temperature and the impact of heat islands have increased in Zhumadian City alongside the trend in urbanization and urban sprawl. Using numerical simulation analysis, this study also found that urban wind corridors in Zhumadian City can be used to introduce relatively cool airflow, which should have a specific effect on cooling the city and improving air quality. The results also show that the urban form and the orientation of urban road system of Zhumadian City favor the development of urban wind corridors, and that some arterial roads in the city can act as main urban wind corridors. However, there are still some ventilation barriers resulting from the existing land use model and building layout patterns that need to be adjusted in urban redevelopment or the urban design process.
As evidenced by the increasingly severe effect of urban heat islands in Zhumadian City, the implementation of urban wind corridor planning in current urban land use planning and urban design is becoming an important issue in green city development. This study proposed a new planning approach that combines several spatial analysis and simulation methods/tools to help evaluate the influence of urban land-use patterns and building layout patterns on urban wind corridor planning. The new planning approach proposed was tested and proved useful in developing climate-sensitive land use plans and building layout modes. Based on the results of our empirical analysis, this study suggests the following planning strategies for promoting the development of urban wind corridors in order to mitigate the impact of the urban heat island effect:
  • Use remote sensing and GIS analysis to identify areas with obvious heat island effects and locations with significantly increased heat island intensity, and explore their relationship with land use and building layout patterns.
  • After identifying the critical areas with obvious heat island effects, employ urban wind corridor planning and CFD simulation analysis to help introduce clean and cooler airflow into city to cut the heat islands and prevent the spread of the heat island effect.
  • Conduct a complete planning approach to designate first- and second-level urban wind corridors. This task should be processed with the help of systematic numerical simulation analysis and open discussion. In addition to first- and second-level urban wind corridors, potential local-level wind corridor paths in communities or urban blocks should be suggested later, so as to construct a multi-scale urban wind corridor system.
  • Conduct suitable land use adjustment and urban design control (such as the control of building setbacks, building height, building openings, location of square and green space, etc.) within a reasonable distance on both sides of the main wind corridor routes in order to maintain a good ventilation environment and urban environmental quality. Relevant control measures need to consider land market demand as well as public acceptance at the same time.
  • National land planning and urban land use planning should avoid allocating polluting industries or polluting land use activities in upwind areas where the inflow wind blows into the city. It is suggested that polluting industries or land use activities be placed at the end of the wind corridor on the path of the main directions of the wind rose.
  • Urban wind corridor planning needs to be coordinated with the planning of regional open space systems. For example, the planning of river open spaces and green open spaces should consider their potential and functions in developing urban cool islands. Urban wind corridor planning should connect these urban cool island elements.
  • When designating major road systems, the feasibility of developing them into major urban wind corridors should be considered. The characteristics of the wind environment and climate should be considered in road system adjustment and street section design.
  • According to current national land policy and land use control in China, it is recommended to conduct related land use and urban design control within the range of 80–100 m on both sides of the first-level wind corridor path and within the range of 40–50 m of the second-level wind corridor path.
  • When conducting building layout planning and open space design in urban blocks, appropriate ventilation openings or corner squares should be reserved to match the routes of the wind corridor in the region. The main opening of the atrium of the enclosed building communities should face the airflow direction of the prevailing wind corridor in summer.
  • During the urban renewal of old urban blocks, appropriate green open spaces or squares should be reserved at important spatial nodes where the urban wind corridor flows, or through the adjustment of building layout or building mass organization, in order to introduce wind corridor airflow to the external space between buildings.
  • When conducting land development in new urban blocks or building new residential communities, the proportional relationship between the building masses and atrium open spaces as well as the positions of building openings should be carefully considered so wind corridor airflow can be introduced to the atrium space.
  • Strengthen the integrated application of urban simulation analysis tools in urban wind corridor planning, including remote sensing in land surface temperature and heat island intensity analysis, GIS spatial analysis of the relationship between land use and wind corridors, numerical simulation analysis of major urban wind paths, and CFD application in wind environment assessments, so as to assist in the development of appropriate building layout models and planning strategies to improve the ventilation environment of urbanized areas.

4.2. Applicability of This Study and Recommendations for Future Research

This study proposes an urban wind corridor planning approach as well as a community ventilation assessment method. The research results show that if the abovementioned considerations of wind environment response design and suggested planning approach can be included in the strategic planning stage of urban planning/design or in the evaluation stage of urban redevelopment, the goals of optimizing the ventilation environment of urban spaces as well as meeting the demand of local land development can be achieved simultaneously. The innovation point of this study is to propose a new planning approach and planning processes that integrate RS, GIS, and CFD within the process of urban wind corridor planning to mitigate the impact of heat islands. It is hoped that the methods, planning processes, and analysis results presented can provide useful information for urban planners, urban designers, architects, and policymakers to help implement the concept of urban wind corridors.
Using multi-scale urban wind corridor planning analysis and community ventilation assessment, this study attempted to combine the functions of RS, GIS, CFD, and the management of a variety of related planning data. However, due to the limitations of research data and computing capacity, this study should be regarded as a preliminary pilot study, and it is suggested that the following topics be explored in depth to provide further information for the implementation of urban wind corridor planning: (1) Validation and comparison of mathematical models for the analysis of large-scale wind corridor paths as well as optimization of mesh systems in simulation models for more efficient computing. (2) Integrated application of related big data (e.g., meteorological data, land use data, and land cover data) and CFD simulation analysis results based on a GIS platform in order to provide more comprehensive analyses for urban wind corridor planning. (3) Use of empirical simulation analysis results to assist in policy review and public involvement of urban wind corridor planning and to conduct project evaluation of multi-scale wind corridor planning. (4) Rethinking the definition, functions, methodology, and impacts of urban wind corridor planning in order to seek public consensuses on related planning practices and policy implementation.
Furthermore, for the planning and implementation of urban wind corridors, this study found that there are still some basic conceptual issues that need to be clarified: (1) Which type of urban ventilation corridor should be emphasized? We need to make a decision on developing either a passthrough-type urban wind corridor for the near-ground field below 10 m (e.g., for improving the situation of the pedestrian wind field) or the main wind corridor for the overall three-dimensional space field of the city (e.g., based on the average building height and building masses condition of the city). (2) How do we incorporate specific living considerations into urban wind corridor planning to reflect seasonal climate characteristics, such as introducing wind airflows to reduce temperature and pollution in the summer as well as blocking wind airflows to keep warm and comfortable in the winter? (3) What is the relationship between the construction of urban wind corridors and urban activities/user behavior in urban spaces? Answering these questions requires some public discourse and public involvement to seek consensuses. It also requires more systematic empirical research to provide scientific information that can be used as planning references and in public debates. It is suggested that these issues be addressed in future studies.
Finally, referring back to the title of this article, “Make Way for the Wind” actually means providing opportunities for a more climate-responsive urban environment as well as more room for promoting the concept of “design with nature”, as originally proposed by Ian McHarg (1969) [76]. The title outlines the key concept of this study, which attempts to introduce a climate-friendly urban planning/design approach using the process of multi-scale urban wind corridor planning by integrating RS, GIS, and CFD. “To Give Up” (“Make Way”) is actually “To Get.” What we need to give up is a crowded, enclosed, high-intensity, sprawling planning model in land development practice, and what we will in turn receive is a good quality living environment with better ventilation and fewer urban heat islands. Our hope is that the planning concept, approach, and methods proposed in this study will lead to more public discussion and stimulate more relevant empirical research. Under the global trend in promoting cooling cities and a policy direction emphasizes the development of smart, sustainable, and ecological cities of many localities, let us develop an innovative planning approach to help create urban wind corridors. The reward will be a cool and healthy urban environment.

Author Contributions

Conceptualization, methodology, software, analysis, validation, visualization, evaluation, writing up, and supervision by K.-L.W. Research investigation, resources, and project administration by K.-L.W. and L.S. Funding acquisition of previous initial study by L.S. All authors have read and agreed to the published version of the manuscript.

Funding

The preliminary research on the urban wind corridor planning and CFD ventilation analysis of this study is based on a previous research on urban wind corridor planning funded by the Bureau of Natural Resources and Planning of Zhumadian. The remote sensing analysis, large-scale wind corridor path analysis, and GIS analysis part of this study were developed by the first author without external funding support.

Institutional Review Board Statement

Not applicable.

Informed Consent Statement

Not applicable.

Data Availability Statement

Publically available Landsat series of data has been used in this study downloaded from USGS earth explorer website (https://earthexplorer.usgs.gov/, accessed on 17 November 2023).

Acknowledgments

The authors are grateful to the editors and the anonymous reviewers for their valuable and constructive comments and suggestions to improve the quality of the manuscript. The preliminary research on the urban wind corridor planning and CFD ventilation analysis of this study is based on a previous research on urban wind corridor planning conducted by the Urban Planning and Design Institute of Shenzhen commissioned by the Bureau of Natural Resources and Planning of Zhumadian as well as based on the ventilation corridor researches conducted by the first author of this article. After expanding the scope of the demonstration areas, this study proceeded to conduct a more in-depth analysis on urban wind corridor planning and urban ventilation assessment. The two authors gratefully appreciate the Bureau of Natural Resources and Planning of Zhumadian for its assistance in research data collection.

Conflicts of Interest

The authors declare no conflict of interest.

References

  1. Oke, T.R. The energetic basis of the urban heat island. Q. J. R. Meteorol. Soc. 1982, 108, 1–24. [Google Scholar] [CrossRef]
  2. Oke, T.R. The Heat Island of the Urban Boundary Layer: Characteristics, Causes and Effects. In Wind Climate in Cities; Cermak, J.E., Davenport, A.G., Plate, E.J., Viegas, D.X., Eds.; Springer: Dordrecht, The Netherlands, 1995; Volume 277, pp. 81–107. [Google Scholar]
  3. Brown, G.Z.; Dekay, M. Sun, Wind, and Light Architectural Design Strategies; Wiley Press: Hoboken, NJ, USA, 2014. [Google Scholar]
  4. Hong, B.; Lin, B. Numerical studies of the outdoor wind environment and thermal comfort at pedestrian level in housing blocks with different building layout patterns and trees arrangement. Renew. Energy 2015, 73, 18–27. [Google Scholar] [CrossRef]
  5. Wu, K.-L.; Hsieh, C.-M. Computational fluid dynamics application for the evaluation of a community atrium open space design integrated with microclimate environment. Appl. Ecol. Environ. Res. 2017, 15, 1815–1831. [Google Scholar] [CrossRef]
  6. Ngarambe, J.; Oh, J.W.; Su, M.A.; Santamouris, M.; Yun, G.Y. Influences of wind speed, sky conditions, land use and land cover characteristics on the magnitude of the urban heat island in Seoul: An exploratory analysis. Sustain. Cities Soc. 2021, 71, 102953. [Google Scholar] [CrossRef]
  7. Hyde, R. Climate Responsive Design; E&FN Spon: New York, NY, USA, 2000. [Google Scholar]
  8. Olgyay, V. Design with Climate: A Study of Buildings in Moderate and Hot Humid Climates; Taylor & Francis: New York, NY, USA, 2015. [Google Scholar]
  9. Hsieh, C.-M.; Wu, K.-L. Climate-sensitive urban design measures for improving the wind environment for pedestrians in a transit-oriented development area. J. Sustain. Dev. 2012, 5, 46–58. [Google Scholar] [CrossRef]
  10. He, B.-J.; Ding, L.; Prasad, D. Wind-sensitive urban planning and design: Precinct ventilation performance and its potential for local warming mitigation in an open midrise gridiron precinct. J. Build. Eng. 2020, 29, 101145. [Google Scholar] [CrossRef]
  11. Wong, M.S.; Nichol, J.E.; To, P.H.; Wang, J. A simple method for designation of urban ventilation corridors and its application to urban heat island analysis. Build. Environ. 2010, 45, 1880–1889. [Google Scholar] [CrossRef]
  12. Hsieh, C.-M.; Huang, H.-C. Mitigating urban heat islands: A method to identify potential wind corridor for cooling and ventilation. Comput. Environ. Urban Syst. 2016, 57, 130–143. [Google Scholar] [CrossRef]
  13. Chen, Y.C.; Lin, T.P.; Lin, C.T. A simple approach for the development of urban climatic maps based on the urban characteristics in Tainan, Taiwan. Int. J. Biometeorol. 2017, 61, 1029–1041. [Google Scholar] [CrossRef] [PubMed]
  14. Son, J.-M.; Eum, J.-H.; Kim, S. Wind corridor planning and management strategies using cold air characteristics: The application in Korean cities. Sustain. Cities Soc. 2022, 77, 103512. [Google Scholar] [CrossRef]
  15. Liu, Y.; Xuan, C.; Xu, Y.; Fu, N.; Xiong, F.; Gan, L. Local climate effects of urban wind corridors in Beijing. Urban Clim. 2022, 43, 101181. [Google Scholar] [CrossRef]
  16. Jinan City Planning Bureau. Research on the Construction and Planning Strategies of Ventilation Corridors; Research Report for Policy Discussion; Jinan City Planning Bureau: Jinan, China, 2019. (In Chinese) [Google Scholar]
  17. Foshan City Planning Bureau. Planning of Foshan Ventilation Corridors: 2018–2035; Policy Report for Policy Discussion; Foshan City Planning Bureau: Foshan, China, 2018. (In Chinese) [Google Scholar]
  18. Liu, N.; Morawska, L. Modeling the urban heat island mitigation effect of cool coatings in realistic urban morphology. J. Clean. Prod. 2020, 264, 121560. [Google Scholar] [CrossRef]
  19. Salamanca, F.; Georgescu, M.; Mahalov, A.; Moustaoui, M.; Wang, M. Anthropogenic heating of the urban environment due to air conditioning. J. Geophys. Res. Atmos. 2014, 119, 5949–5965. [Google Scholar] [CrossRef]
  20. Crutzen, P.J. New Directions: The growing urban heat and pollution island effect-impact on chemistry and climate. Atmos. Environ. 2004, 38, 3539–3540. [Google Scholar] [CrossRef]
  21. Oke, T.R. City size and the urban heat island. Atmos. Environ. 1973, 7, 769–779. [Google Scholar] [CrossRef]
  22. Grimmond, S. Urbanization and global environmental change: Local effects of urban warming. Geogr. J. 2007, 173, 83–88. [Google Scholar] [CrossRef]
  23. Molina-Gómez, N.I.; Varon-Bravo, L.M.; Sierra-Parada, R.; López-Jiménez, P.A. Urban growth and heat islands: A case study in micro-territories for urban sustainability. Urban Ecosyst. 2022, 25, 1379–1397. [Google Scholar] [CrossRef]
  24. Chao, Y.; Ng, E. Practical application of CFD on environmentally sensitive architectural design at high density cities: A case study in Hong Kong. Urban Clim. 2014, 8, 57–77. [Google Scholar]
  25. Sen, S.; Roesler, J.; Ruddell, B.; Middel, A. Cool Pavement Strategies for Urban Heat Island Mitigation in Suburban Phoenix, Arizona. Sustainability 2019, 11, 4452. [Google Scholar] [CrossRef]
  26. O’Malley, C.; Piroozfar, P.; Farr, E.R.P.; Pomponi, F. Urban Heat Island (UHI) mitigating strategies: A case-based comparative analysis. Sustain. Cities Soc. 2015, 19, 222–235. [Google Scholar] [CrossRef]
  27. He, B.J.; Ding, L.; Prasad, D. Relationships among local-scale urban morphology, urban ventilation, urban heat island and outdoor thermal comfort under sea breeze influence. Sustain. Cities Soc. 2020, 60, 102289. [Google Scholar] [CrossRef]
  28. Halder, B.; Karimi, A.; Mohammad, P.; Bandyopadhyay, J.; Brown, R.D.; Yaseen, Z.M. Investigating the relationship between land alteration and the urban heat island of Seville city using multi-temporal Landsat data. Theor. Appl. Climatol. 2022, 150, 613–635. [Google Scholar] [CrossRef]
  29. Alahmad, B.; Tomasso, L.P.; Al-Hemoud, A.; James, P.; Koutrakis, P. Spatial Distribution of Land Surface Temperatures in Kuwait: Urban Heat and Cool Islands. Int. J. Environ. Res. Public Health 2020, 17, 2993. [Google Scholar] [CrossRef] [PubMed]
  30. Hulley, G.C.; Ghent, D.; Göttsche, F.M.; Guillevic, P.C.; Mildrexler, D.J.; Coll, C. Land Surface Temperature. In Taking the Temperature of the Earth; Elsevier: Amsterdam, The Netherlands, 2019; pp. 57–127. [Google Scholar]
  31. Becker, F.; Li, Z.-L. Surface Temperature and Emissivity at Various Scales: Definition, Measurement and Related Problems. Remote Sens. Rev. 1995, 12, 225–253. [Google Scholar] [CrossRef]
  32. Alipour, T.; Sarajian, M.R.; Esmaeily, A. Land surface temperature estimation from thermal band of Landsat sensor, case study: Alashtar city. The International Achieves of the Photogrammetry. Remote Sens. Spat. Inf. Sci. 2003, 38, 1–6. [Google Scholar]
  33. Weng, Q.; Lu, D.; Schubring, J. Estimation of land surface temperature–vegetation abundance relationship for urban heat island studies. Remote Sens. Environ. 2004, 89, 467–483. [Google Scholar] [CrossRef]
  34. Avdan, U.; Jovanovska, G. Algorithm for automated mapping of land surface temperature using LANDSAT 8 satellite data. J. Sens. 2016, 2016, 1480307. [Google Scholar] [CrossRef]
  35. Wang, X.; Li, H.; Sodoudi, S. The effectiveness of cool and green roofs in mitigating urban heat island and improving human thermal comfort. Build. Environ. 2022, 217, 109082. [Google Scholar] [CrossRef]
  36. Morakinyo, T.E.; Lam, Y.F. Simulation study on the impact of tree-configuration, planting pattern and wind condition on street-canyon’s micro-climate and thermal comfort. Build. Environ. 2016, 103, 262–275. [Google Scholar] [CrossRef]
  37. Zhang, M.; Bae, W.; Kim, J. The Effects of the Layouts of Vegetation and Wind Flow in an Apartment Housing Complex to Mitigate Outdoor Microclimate Air Temperature. Sustainability 2019, 11, 3081. [Google Scholar] [CrossRef]
  38. Sugawara, H.; Narita, K.-I.; Mikamic, T. Vertical structure of the cool island in a large urban park. Urban Clim. 2021, 35, 100744. [Google Scholar] [CrossRef]
  39. Yuan, C.; Adelia, A.S.; Mei, S.; He, W.; Li, X.-X.; Norford, L. Mitigating intensity of urban heat island by better understanding on urban morphology and anthropogenic heat dispersion. Build. Environ. 2020, 176, 106876. [Google Scholar] [CrossRef]
  40. Imran, H.M.; Kala, J.; Ng, A.W.M.; Muthukumaran, S. Effectiveness of vegetated patches as Green Infrastructure in mitigating Urban Heat Island effects during a heatwave event in the city of Melbourne. Weather Clim. Extremes 2019, 25, 100217. [Google Scholar] [CrossRef]
  41. Chen, Y.-C.; Fröhlich, D.; Matzarakis, A.; Lin, T.-P. Urban Roughness Estimation Based on Digital Building Models for Urban Wind and Thermal Condition Estimation—Application of the SkyHelios Model. Atmosphere 2017, 8, 247. [Google Scholar] [CrossRef]
  42. Abbassi, Y.; Ahmadikia, H.; Baniasadi, E. Impact of wind speed on urban heat and pollution islands. Urban Clim. 2022, 44, 101200. [Google Scholar] [CrossRef]
  43. Zong, L.; Liu, S.; Yang, Y.; Ren, G.; Yu, M.; Zhang, Y.; Li, Y. Synergistic Influence of Local Climate Zones and Wind Speeds on the Urban Heat Island and Heat Waves in the Megacity of Beijing, China. Front. Earth Sci. 2021, 9, 458. [Google Scholar] [CrossRef]
  44. Rajagopalan, P.; Lim, K.C.; Jamei, E. Urban heat island and wind flow characteristics of a tropical city. Sol. Energy 2014, 107, 159–170. [Google Scholar] [CrossRef]
  45. Suder, A.; Szymanowski, M. Determination of ventilation channels in urban area: A case study of Wrocław. Pure Appl. Geophys. 2014, 171, 965–975. [Google Scholar] [CrossRef]
  46. Zhang, S.; Fang, X.; Cheng, C.; Chen, L.; Zhang, L.; Yu, Y.; Li, L.; Luo, H. Research on the Planning Method and Strategy of Urban Wind and Heat Environment Optimization—Taking Shenzhen, a Sub-Tropical Megacity in Southern China, as an Example. Atmosphere 2022, 13, 1395. [Google Scholar] [CrossRef]
  47. Hang, J.; Luo, Z.W.; Mats, S.; Gong, J. Natural ventilation assessment in typical open and semi-open urban environments under various wind directions. Build. Environ. 2013, 70, 318–333. [Google Scholar] [CrossRef]
  48. Givoni, B. Climate Considerations in Building and Urban Design; International Thomson Publishing: New York, NY, USA, 1998. [Google Scholar]
  49. Xie, X.; Huang, Z.; Wang, J. The impact of urban street layout on local atmospheric environment. Build. Environ. 2006, 41, 1352–1363. [Google Scholar]
  50. Ng, E. Policies and technical guidelines for urban planning of high-density cities—Air ventilation assessment (AVA) of Hong Kong. Build. Environ. 2009, 44, 1478–1488. [Google Scholar] [CrossRef]
  51. Sharples, S.; Bensalem, R. Airflow in courtyard and atrium buildings in the urban environment: A wind tunnel study. Sol. Energy 2001, 70, 237–244. [Google Scholar] [CrossRef]
  52. Kubota, T.; Miura, M.; Tominaga, T.; Mochida, A. Wind tunnel tests on the relationship between building density and pedestrian-level wind velocity: Development of guidelines for realizing acceptable wind environment in residential neighborhoods. Build. Environ. 2008, 43, 1699–1708. [Google Scholar] [CrossRef]
  53. Shi, X.; Zhu, Y.-Y.; Duan, J.; Shao, R.-Q.; Wang, J.-G. Assessment of pedestrian wind environment in urban planning design. Landsc. Urban Plan. 2015, 140, 17–28. [Google Scholar] [CrossRef]
  54. Mochida, A.; Lun, Y.F. Prediction of wind environment and thermal comfort at pedestrian level in urban area. J. Wind Eng. Ind. Aerodyn. 2008, 96, 1498–1527. [Google Scholar] [CrossRef]
  55. Blocken, B.; Janssen, W.D.; van Hooff, T. CFD simulation for pedestrian wind comfort and wind safety in urban areas: General decision framework and case study for the Eindhoven University campus. Environ. Model. Softw. 2012, 30, 15–34. [Google Scholar] [CrossRef]
  56. Jing, Y.; Zhong, H.-Y.; Wang, W.-W.; He, Y.; Zhao, F.-Y.; Li, Y. Quantitative city ventilation evaluation for urban canopy under heat island circulation without geostrophic winds: Multi-scale CFD model and parametric investigations. Build. Environ. 2021, 196, 107793. [Google Scholar] [CrossRef]
  57. Yuan, C.; Ng, E. Building porosity for better urban ventilation in high-density cities—A computational parametric study. Build. Environ. 2012, 50, 176–189. [Google Scholar] [CrossRef]
  58. Mora-Pérez, M.; Guillén-Guillamón, I.; López-Jiménez, P.A. Computational analysis of wind interactions for comparing different buildings sites in terms of natural ventilation. Adv. Eng. Softw. 2015, 88, 73–82. [Google Scholar] [CrossRef]
  59. Ku, C.-A.; Tsai, H.-K. Evaluating the Influence of Urban Morphology on Urban Wind Environment Based on Computational Fluid Dynamics Simulation. ISPRS Int. J. Geo-Inf. 2020, 9, 399. [Google Scholar] [CrossRef]
  60. Allegrini, J.; Dorer, V.; Carmeliet, J. Influence of morphologies on the microclimate in urban neighbourhoods. J. Wind Eng. Ind. Aerodyn. 2015, 144, 108–117. [Google Scholar] [CrossRef]
  61. Sun, C.-Y. Thermal Environment Simulation of an East-West Street in Taipei. Int. Rev. Spat. Plan. Sustain. Dev. 2017, 5, 89–100. [Google Scholar] [CrossRef] [PubMed]
  62. Ma, T.; Chen, T. Classification and pedestrian-level wind environment assessment among Tianjin’s residential area based on numerical simulation. Urban Clim. 2020, 34, 100702. [Google Scholar] [CrossRef]
  63. Wu, K.-L.; Hung, I.-A.; Lin, H.-T. Application of CFD Simulations in Studying Outdoor Wind Environment in Different Community Building Layouts and Open Space Designs. Adv. Mech. Control Eng. 2013, 2, 2317–2324. [Google Scholar] [CrossRef]
  64. Omar, S.A. Prediction of wind environment in different grouping patterns of housing blocks. Energy Build. 2010, 42, 2061–2069. [Google Scholar]
  65. Wu, K.-L. CFD Simulation Analysis for Building and City Ventilation Environment Design; Wunan Book Publishing Co., Ltd.: Taipei, Taiwan, 2019. (In Chinese) [Google Scholar]
  66. Special Planning for Urban Wind Corridor in the Central Urban Area of Zhumadian City; Urban Planning and Design Institute of Shenzhen: Shenzhen, China, 2019. (In Chinese)
  67. Xu, F.; Gao, Z. Frontal area index: A review of calculation methods and application in the urban environment. Build. Environ. 2022, 224, 109588. [Google Scholar] [CrossRef]
  68. Comprehensive Planning of Zhumadian City (2018–2035); Bureau of Natural Resources and Planning of Zhumadian: Zhumadian, China, 2018. Available online: http://zrzyhghj.zhumadian.gov.cn/web/front/news/detail.php?newsid=8207 (accessed on 13 October 2022). (In Chinese)
  69. USGS. Using the USGS Landsat Level-1 Data Product. U.S. Geological Survey. Available online: https://www.usgs.gov/landsat-missions/using-usgs-landsat-level-1-data-product (accessed on 13 October 2022).
  70. Artis, D.A.; Carnahan, W.H. Survey of emissivity variability in thermography of urban areas. Remote Sens. Environ. 1982, 12, 313–329. [Google Scholar] [CrossRef]
  71. Bhatti, S.S.; Tripathi, N.K. Built-up area extraction using Landsat 8 OLI imagery. GISci. Remote Sens. 2014, 51, 445–467. [Google Scholar] [CrossRef]
  72. USGS. Landsat Normalized Difference Vegetation Index. U.S. Geological Survey. Available online: https://www.usgs.gov/landsat-missions/landsat-normalized-difference-vegetation-index (accessed on 13 October 2022).
  73. Zhou, B.; Rybski, D.; Kropp, J.P. On the statistics of urban heat island intensity. Geophys. Res. Lett. 2013, 40, 5486–5491. [Google Scholar] [CrossRef]
  74. Blocken, B. LES over RANS in building simulation for outdoor and indoor applications: A foregone conclusion? Build. Simul. 2018, 11, 821–870. [Google Scholar] [CrossRef]
  75. Zheng, X.; Montazeri, H.; Blocken, B. CFD simulations of wind flow and mean surface pressure for buildings with balconies: Comparison of RANS and LES. Build. Environ. 2020, 173, 106747. [Google Scholar] [CrossRef]
  76. McHarg, I.L. Design with Nature; Natural History Press: Garden City, NY, USA, 1969. [Google Scholar]
Figure 1. Location of the study region of Zhumadian and the pilot study areas.
Atmosphere 15 00257 g001
Figure 2. Spatial distribution of measurement points and instrument setup images in the demonstration blocks of the old district in Zhumadian City.
Atmosphere 15 00257 g002
Figure 3. The process and steps for integrating RS, GIS, and CFD to conduct multi-scale wind corridor planning analysis for heat island mitigation.
Atmosphere 15 00257 g003
Figure 4. The process of CFD simulation analysis on the local level.
Atmosphere 15 00257 g004
Figure 5. The 3D digital city model of the central urban area of Zhumadian City after being input to WindPerfectDX.
Atmosphere 15 00257 g005
Figure 6. Grid system setting of the selected pilot blocks and surrounding areas of the old district in the central urban area of Zhumadian City.
Atmosphere 15 00257 g006
Figure 7. Wind rose chart of Zhumadian City, 2010–2019.
Atmosphere 15 00257 g007
Figure 8. Average monthly wind speed in Zhumadian City, 1990–2019.
Atmosphere 15 00257 g008
Figure 9. LST estimation of the study region of Zhumadian City, 2008 and 2018. (a) LST estimation 2008 (image: 18 August 2008); (b) LSI estimation 2018 (image: 10 May 2018).
Atmosphere 15 00257 g009
Figure 10. UHI intensity estimation of the study region of Zhumadian City, 2008 and 2018. (a) UHI intensity estimation 2008 (image: 18 August 2008); (b) UHI intensity estimation 2018 (image: 10 May 2018).
Atmosphere 15 00257 g010
Figure 11. Simulation analysis result of large-scale urban wind corridor paths in the central urban area of Zhumadian City (summer prevailing winds: southerly winds).
Atmosphere 15 00257 g011
Figure 12. Identification of main urban wind corridor channels and scope of urban design control in the central urban area of Zhumadian City (summer prevailing winds: southerly winds).
Atmosphere 15 00257 g012
Figure 13. Key strategic ventilation improvement points (locations) in the central urban area of Zhumadian City (summer prevailing winds: southerly winds).
Atmosphere 15 00257 g013
Figure 14. Simulation analysis result of large-scale urban wind corridor paths in the central urban area of Zhumadian City (summer sub-prevailing winds: south–southwesterly winds).
Atmosphere 15 00257 g014
Figure 15. Overlay analyses of the main factors in urban wind corridor planning of the study region.
Atmosphere 15 00257 g015
Figure 16. CFD simulation analysis convergence curve of the selected typical blocks in the old district in Zhumadian City (the green line is the convergence threshold line, and the red curve is the convergence curve).
Atmosphere 15 00257 g016
Figure 17. Comparison between simulation analysis results and experiment results of key measurement points of the selected typical blocks of the old district.
Atmosphere 15 00257 g017
Figure 18. Three-dimensional building model and the current situation of the old town blocks in the old district.
Atmosphere 15 00257 g018
Figure 19. CFD analysis result of the demonstration blocks and surrounding areas in the old district.
Atmosphere 15 00257 g019
Figure 20. CFD analysis result of pedestrian wind field of the demonstration blocks in the old district.
Atmosphere 15 00257 g020
Figure 21. Sectional view of CFD analysis result of the Demonstration blocks and surrounding areas in the old district.
Atmosphere 15 00257 g021
Figure 22. Locations of poorly ventilated building layout patterns and well-ventilated building layout patterns of the demonstration blocks in the old district.
Atmosphere 15 00257 g022
Figure 23. Three-dimensional building model and the current situation of the new residential blocks in the new district.
Atmosphere 15 00257 g023
Figure 24. CFD analysis result of the demonstration blocks and surrounding areas of the new residential communities in the new district.
Atmosphere 15 00257 g024
Figure 25. CFD analysis result of pedestrian wind field of the new residential blocks in the new district.
Atmosphere 15 00257 g025
Figure 26. Sectional view of CFD analysis result of the new residential blocks in the new district.
Atmosphere 15 00257 g026
Figure 27. Locations of poorly ventilated building layout patterns and well-ventilated building layout patterns of the new residential blocks in the new district.
Atmosphere 15 00257 g027
Table 1. Analysis of measurement instruments.
MethodsMobile Measurement Method
Measurement itemsWind speed, temperature, humidity.
Measurement locationsSelect 28–30 measurement points in each demonstration site
Measurement instrument Mnemonic hot-wire anemometer (AM4214SD) and mnemonic temperature and humidity meter (HT-3007SD)
Photos of instruments and instrument setupAtmosphere 15 00257 i001
Mnemonic hot-wire
anemometer
Atmosphere 15 00257 i002
Mnemonic humidity/
temperature meter
Atmosphere 15 00257 i003
Instrument setup
Table 2. Analysis of basic building layout patterns with poor ventilation in the external spaces of the demonstration blocks in the old district.
Poor Ventilation
Reasons
Label
No.
CFD Simulation ResultPoor Ventilation Building Layout PatternsSuggested Scenarios Building Layout Patterns
The distance between buildings is too small in the wind corridor pathsOB1Atmosphere 15 00257 i004Atmosphere 15 00257 i005Short spacingAtmosphere 15 00257 i006Maintain proper spacing
The windward building is too long and too tall, which blocks the airflows of summer winds OB2, OB7Atmosphere 15 00257 i007Atmosphere 15 00257 i008Too long and too tall buildingsAtmosphere 15 00257 i009Separate long and tall buildings
The distance between buildings is too small, and the alley is too narrowOB3Atmosphere 15 00257 i010Atmosphere 15 00257 i011Narrow alleys and small building spacingAtmosphere 15 00257 i012Maintain proper alley width and building spacing
Illegal building units and illegal building additions which block ventilationOB4Atmosphere 15 00257 i013Atmosphere 15 00257 i014Illegal building units and additions blocking ventilationAtmosphere 15 00257 i015Clean illegal building units and building additions
Enclosed square-shaped traditional building units, resulting in poor ventilationOB5Atmosphere 15 00257 i016Atmosphere 15 00257 i017Enlosed square-shaped buildings prevent ventilationAtmosphere 15 00257 i018Maintain proper openings for square-shaped buildings
The long L-shaped building form which is unfavorable to ventilationOB6Atmosphere 15 00257 i019Atmosphere 15 00257 i020Long L-shahed buildings prevent ventilationAtmosphere 15 00257 i021Maintain proper openings for long L-shaped buildings
Table 3. Analysis of basic building layout patterns with good ventilation in the external spaces of the demonstration blocks in the old district.
Good Ventilation ReasonsLabel No.CFD Simulation ResultGood Ventilation Building Layout Patterns
Employing scattered building layout model and maintain sufficient distance between adjacent buildings OG1Atmosphere 15 00257 i022Atmosphere 15 00257 i023
The width of the street meets the ventilation requirements and the orentation of the street consistent with the direction of the summer prevailing windOG2Atmosphere 15 00257 i024Atmosphere 15 00257 i025
Table 4. Analysis of basic building layout patterns with poor ventilation in the external spaces of the new residential blocks of the new district.
Poor Ventilation ReasonsLabel No.CFD Simulation ResultPoor Ventilation Building Layout PatternsSuggested Scenarios Building Layout Patterns
Lack of proper building ventilation openings in the summer prevailing wind directionNB1Atmosphere 15 00257 i026Atmosphere 15 00257 i027No proper building openingsAtmosphere 15 00257 i028Maintain proper building openings
Long and tall building volume, which prevents summer prevailing wind flow to the communitiesNB2Atmosphere 15 00257 i029Atmosphere 15 00257 i030Long and tall buildingsAtmosphere 15 00257 i031Separate the long and tall buildings
Spacing of adjacent buildings is too small, resulting in poor ventilationNB3
NB5
NB7
Atmosphere 15 00257 i032Atmosphere 15 00257 i033Small spacings
between
buildings
Atmosphere 15 00257 i034Maintain proper building spacings
Summer windward buildings are too long and without proper ventilation openingsNB4Atmosphere 15 00257 i035Atmosphere 15 00257 i036No proper openings in windward buildingsAtmosphere 15 00257 i037Maintain proper openings in windward buildings
Lack of adequate ventilation openings on the windward street corner NB6Atmosphere 15 00257 i038Atmosphere 15 00257 i039No proper openings on windward street cornerAtmosphere 15 00257 i040Maintain proper openings of windward street corner
Table 5. Analysis of basic building layout patterns with good ventilation in the external spaces of the new residential blocks in the new district.
Good Ventilation ReasonsLabel No.CFD Simulation ResultGood Ventilation Layout Patterns
Scattered building layout model with proper distance between buildings, which is conducive to good ventilationNG1
NG2
Atmosphere 15 00257 i041Atmosphere 15 00257 i042
Maintain appropriate building openings and spacing at street corners to facilitate the introduction of summer inflow windsNG3Atmosphere 15 00257 i043Atmosphere 15 00257 i044
Appropriate building spacing, proper street orientation, and scattered building layout, which are conducive to wind circulationNG4Atmosphere 15 00257 i045Atmosphere 15 00257 i046
Disclaimer/Publisher’s Note: The statements, opinions and data contained in all publications are solely those of the individual author(s) and contributor(s) and not of MDPI and/or the editor(s). MDPI and/or the editor(s) disclaim responsibility for any injury to people or property resulting from any ideas, methods, instructions or products referred to in the content.