
Impact of the Eclipsed Sun on Terrestrial Atmospheric Parameters in Desert Locations: A Comprehensive Overview and Two Events Case Study in Saudi Arabia †

 , , and
Abstract
1. Introduction
1.1. Circumstances of the Eclipses of 2019 and 2020 in the Arabian Peninsula
1.1.1. Astronomical
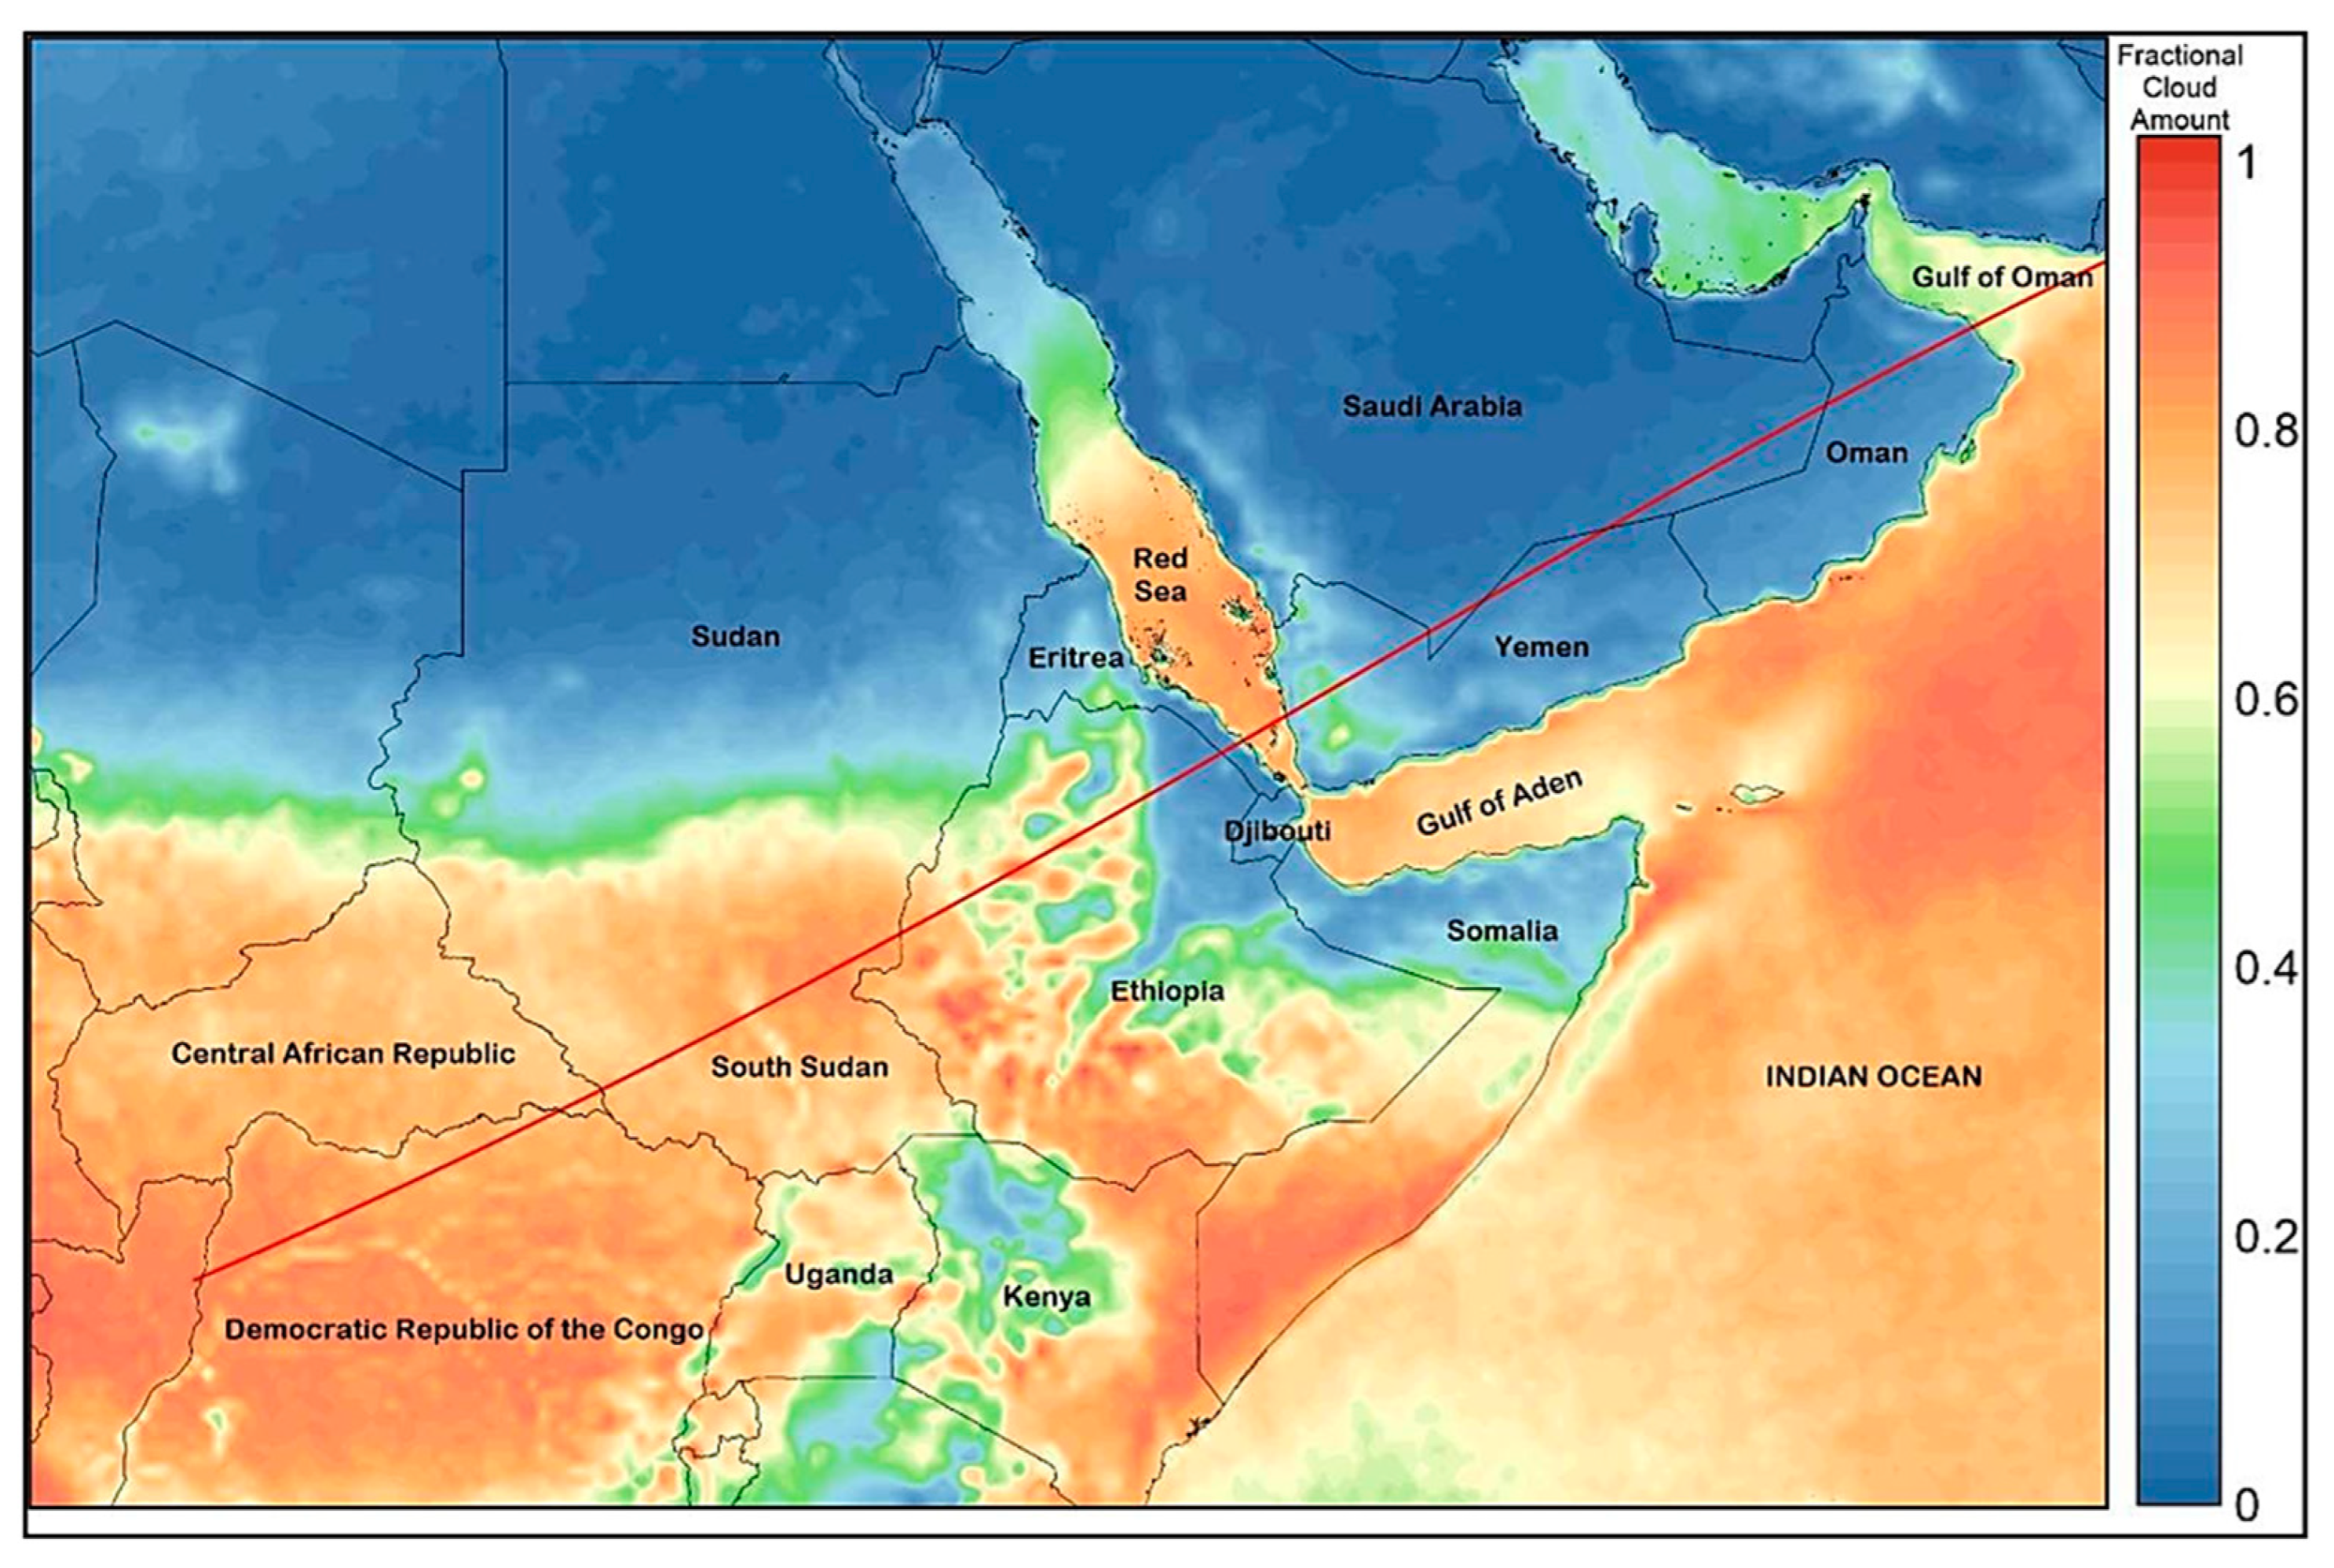
1.1.2. Geographical, Climatological and Meteorological
2. Equipment and Data Acquisition
3. Results and Analysis
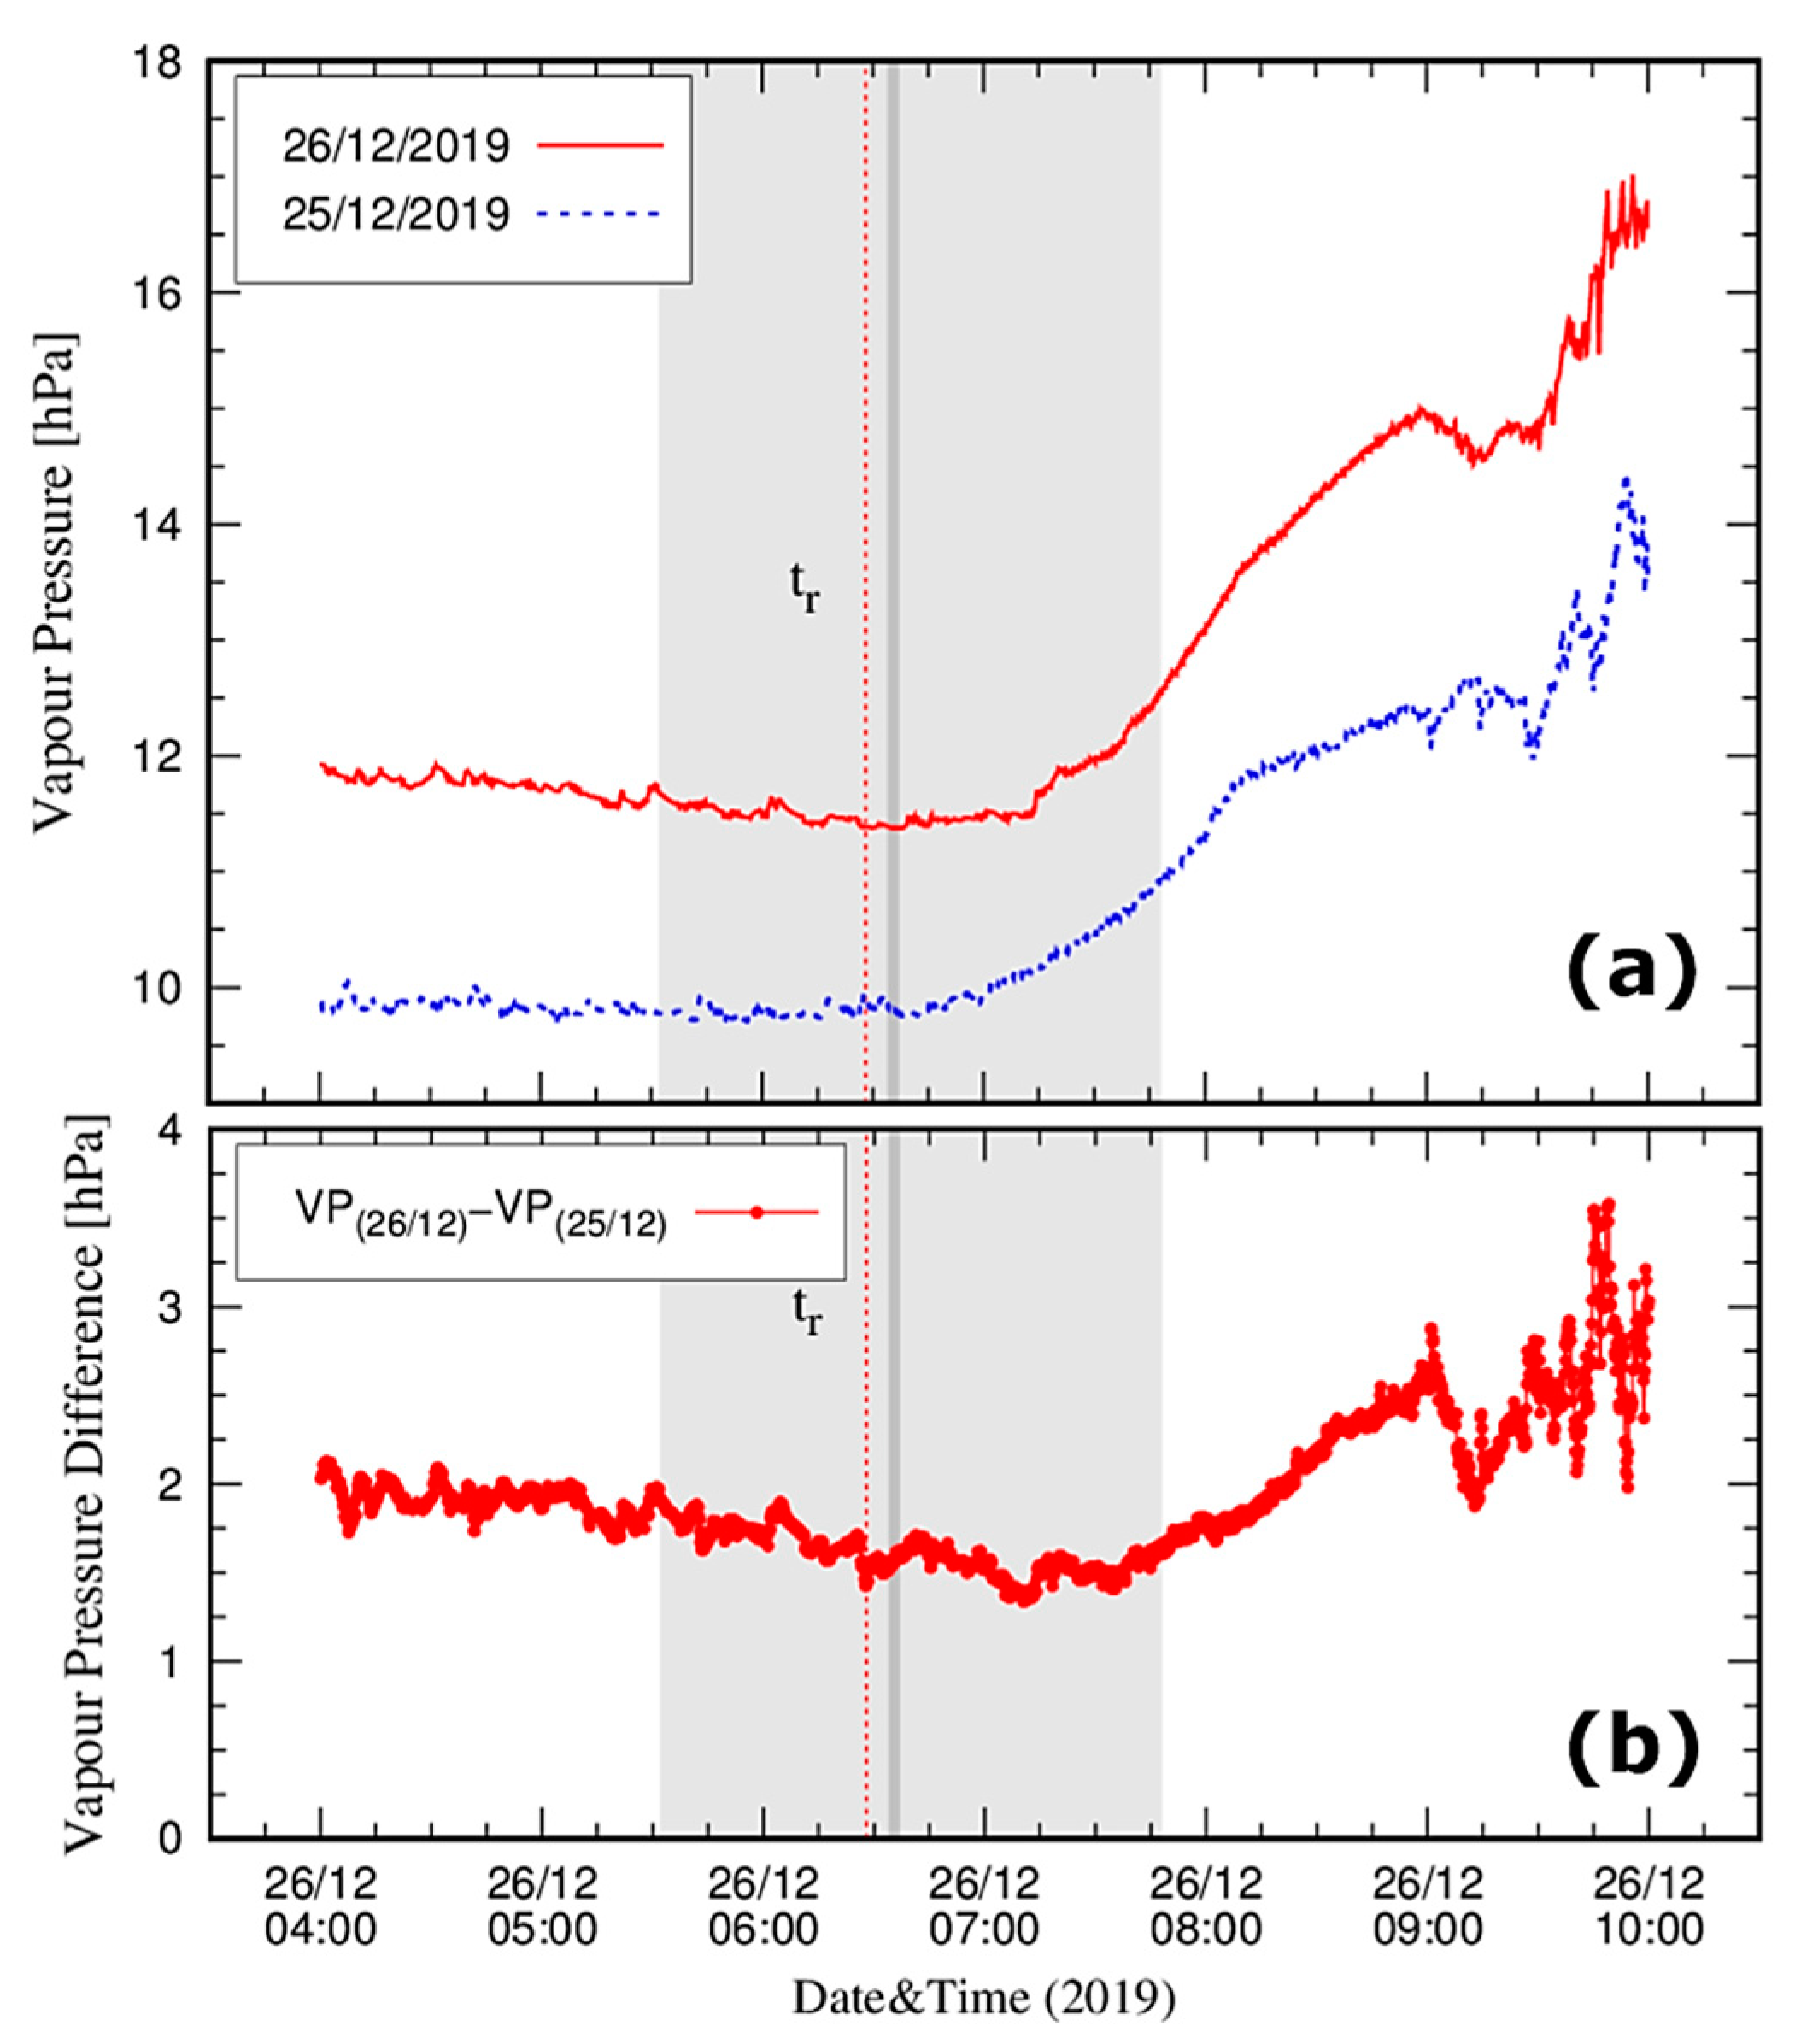
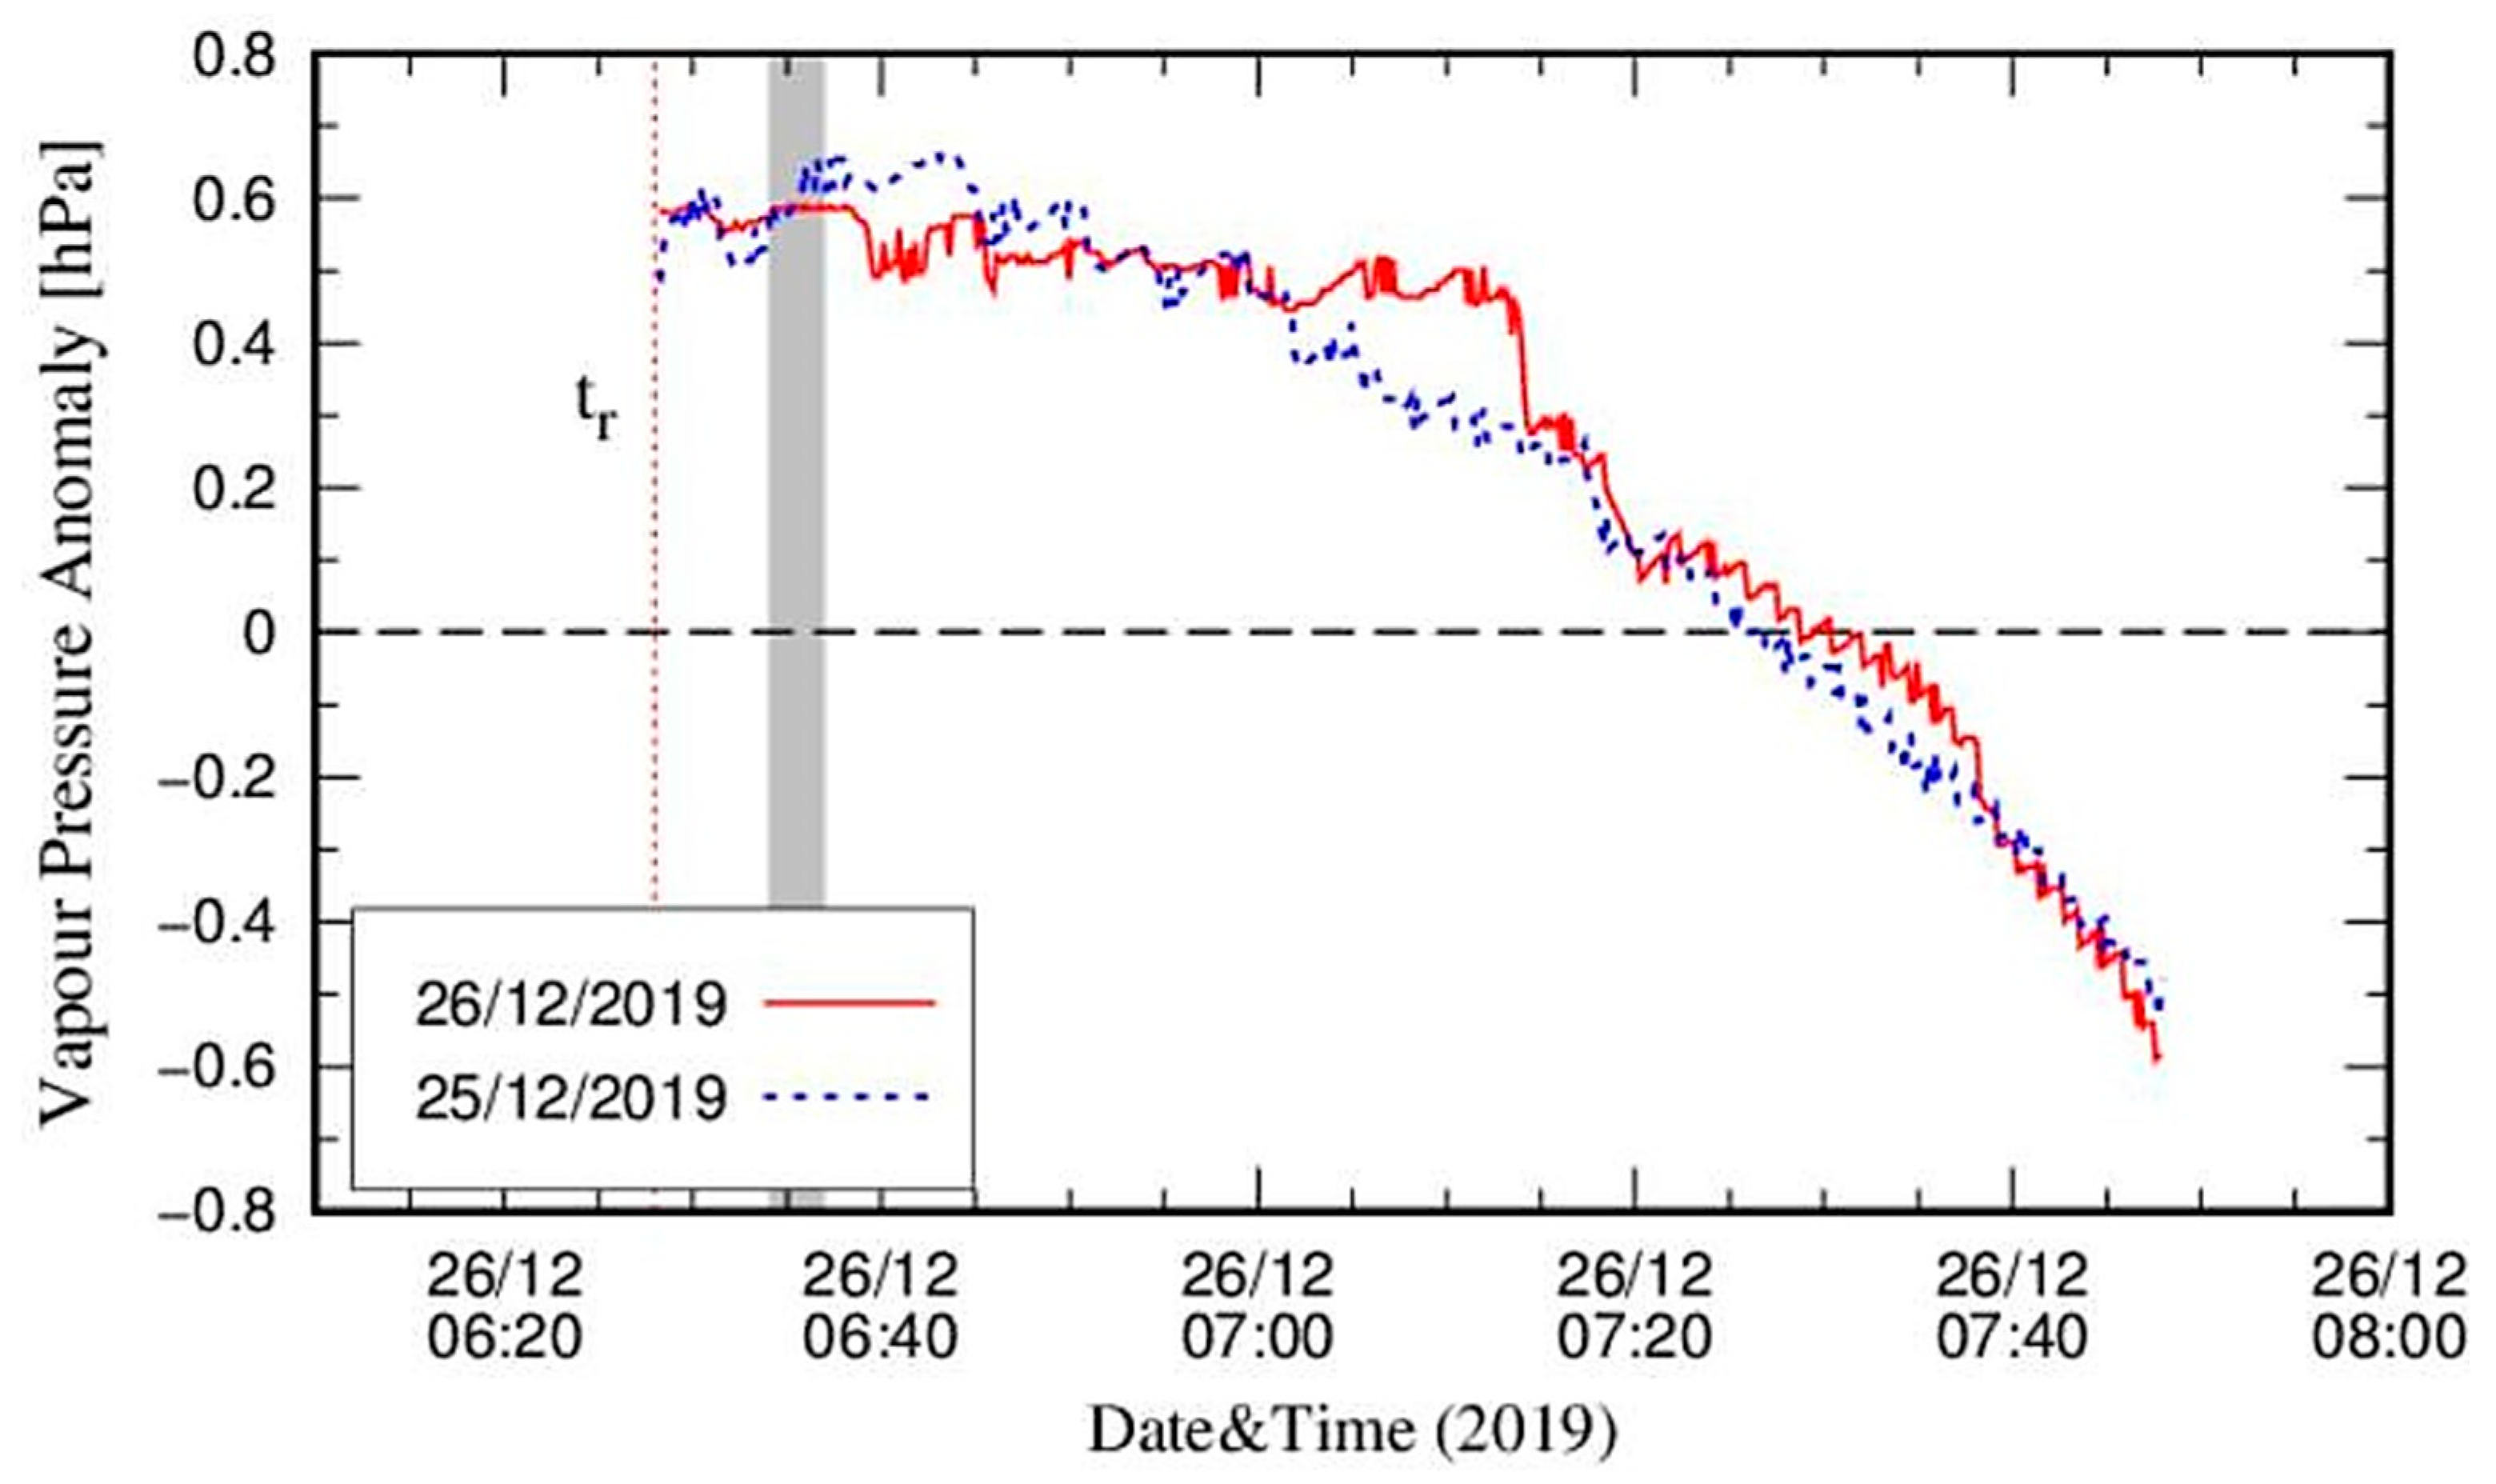
3.1. Al-Hofuf
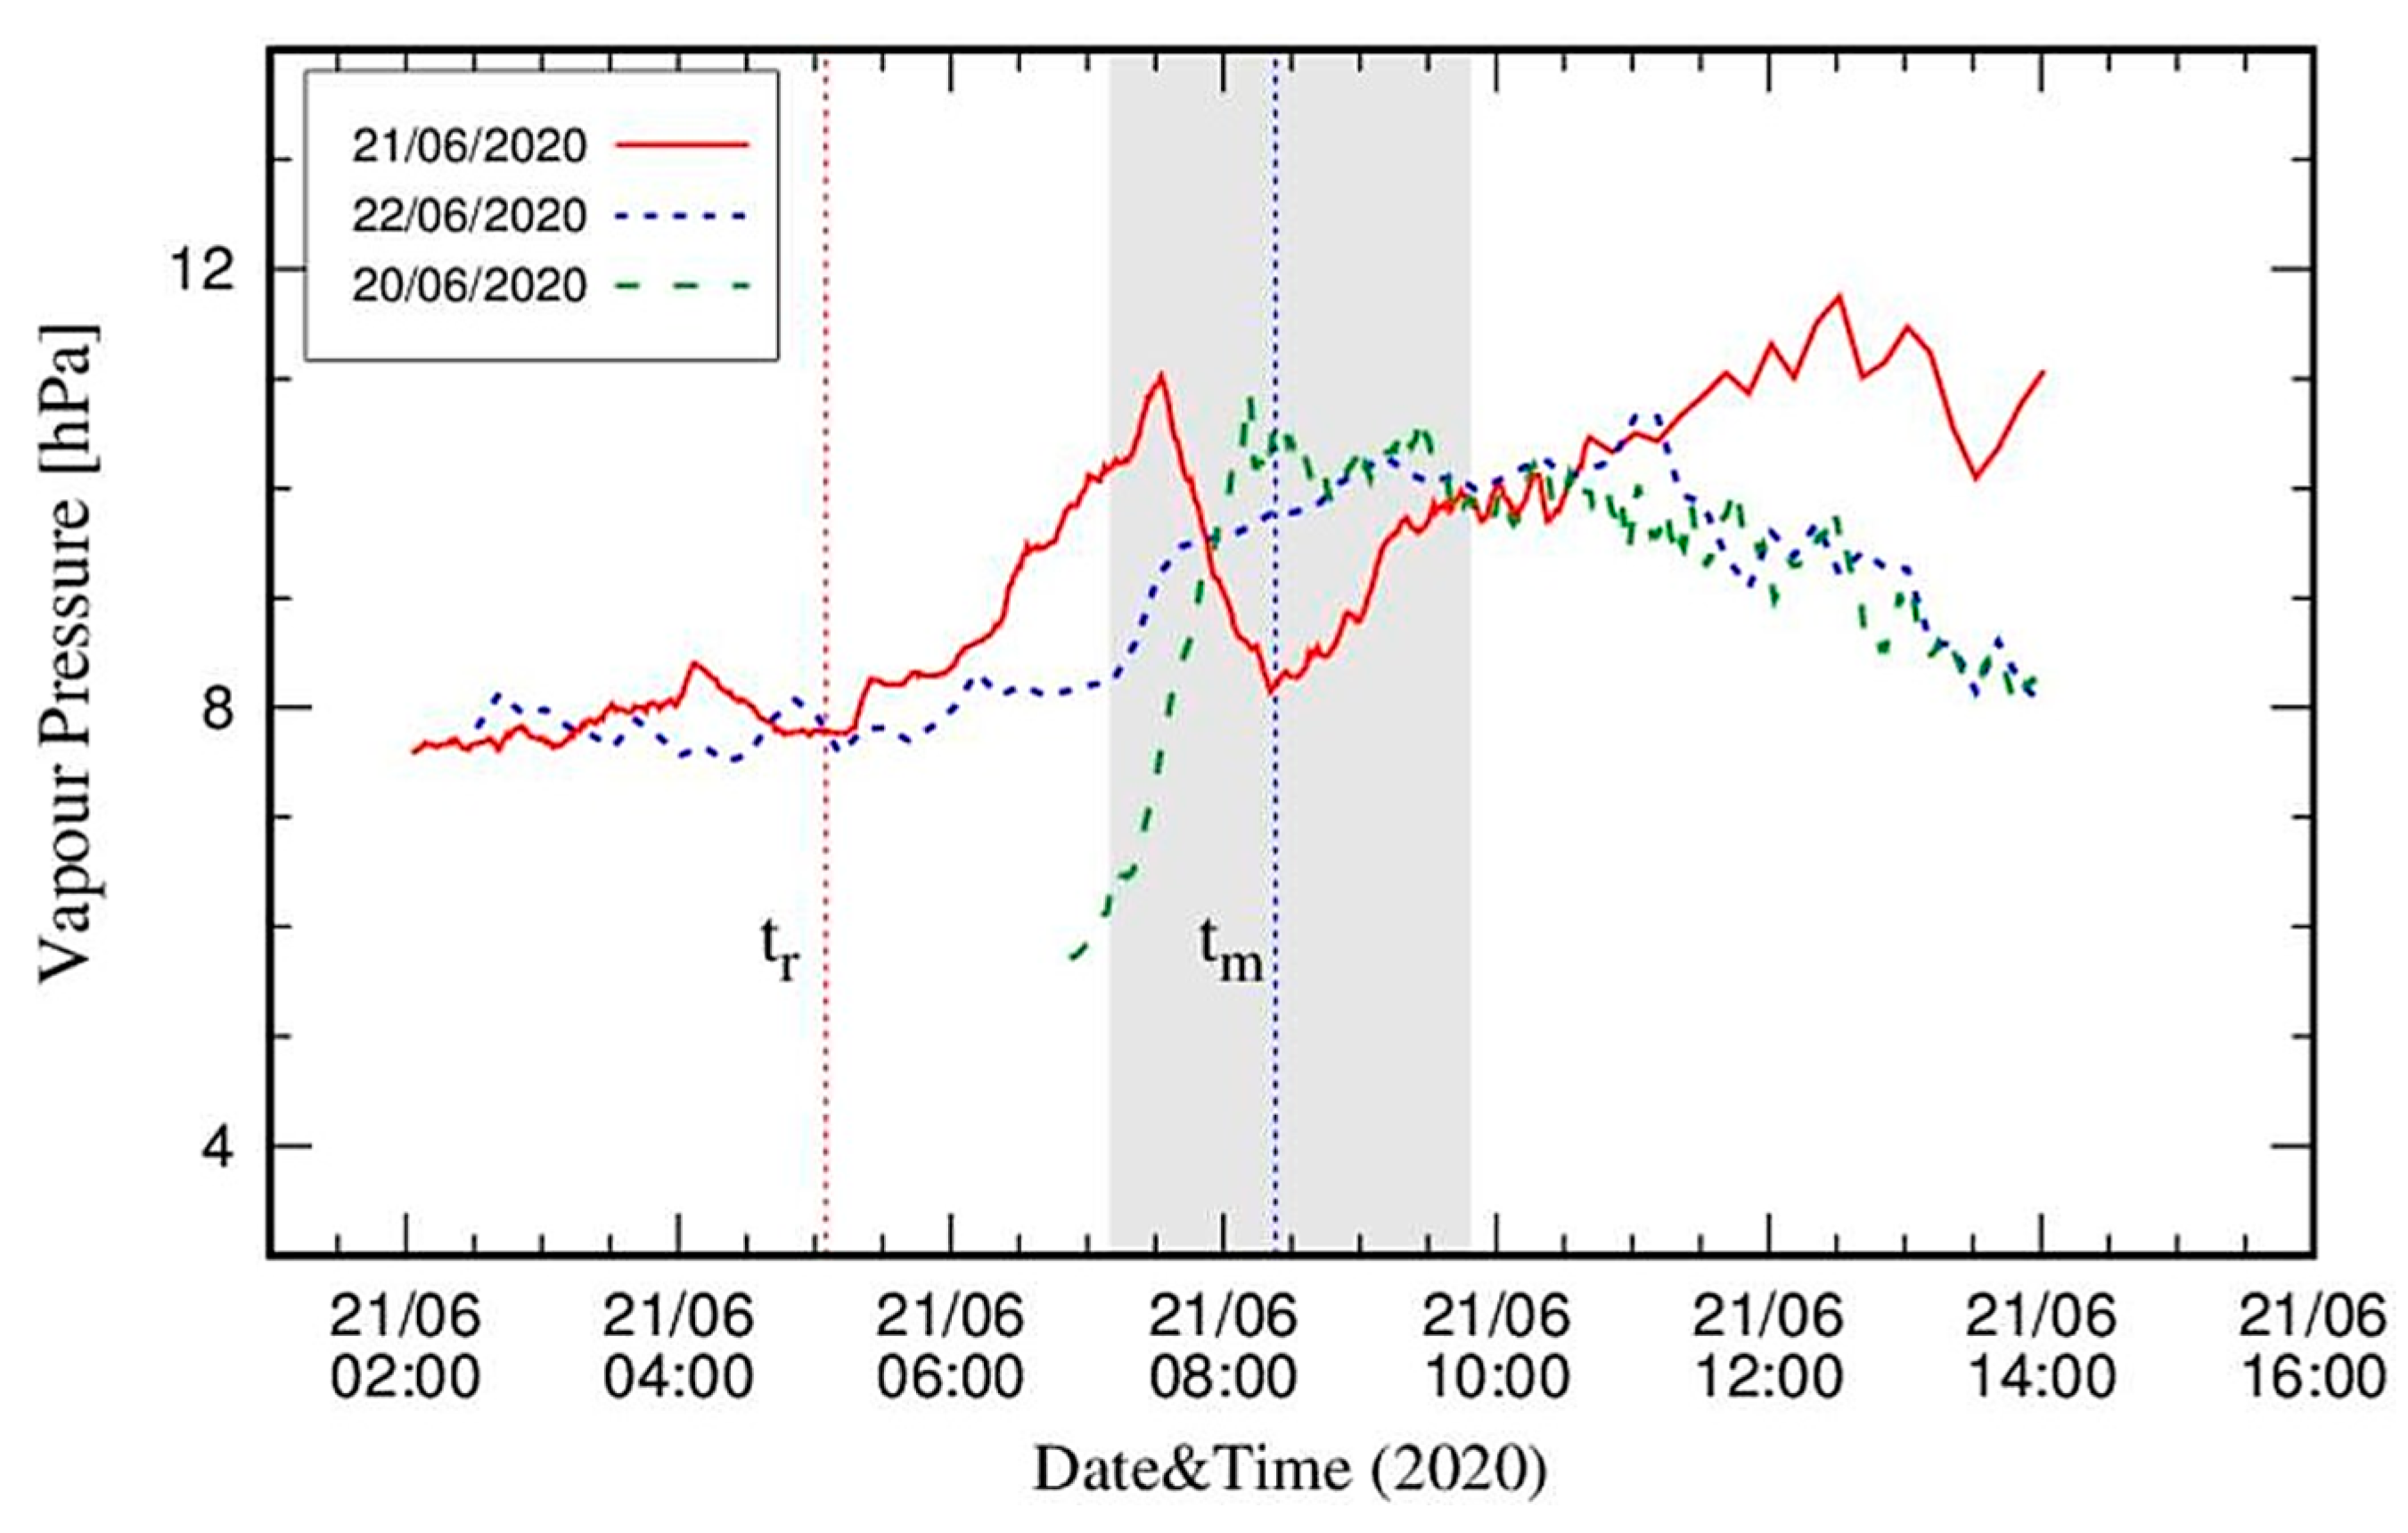
3.2. Riyadh
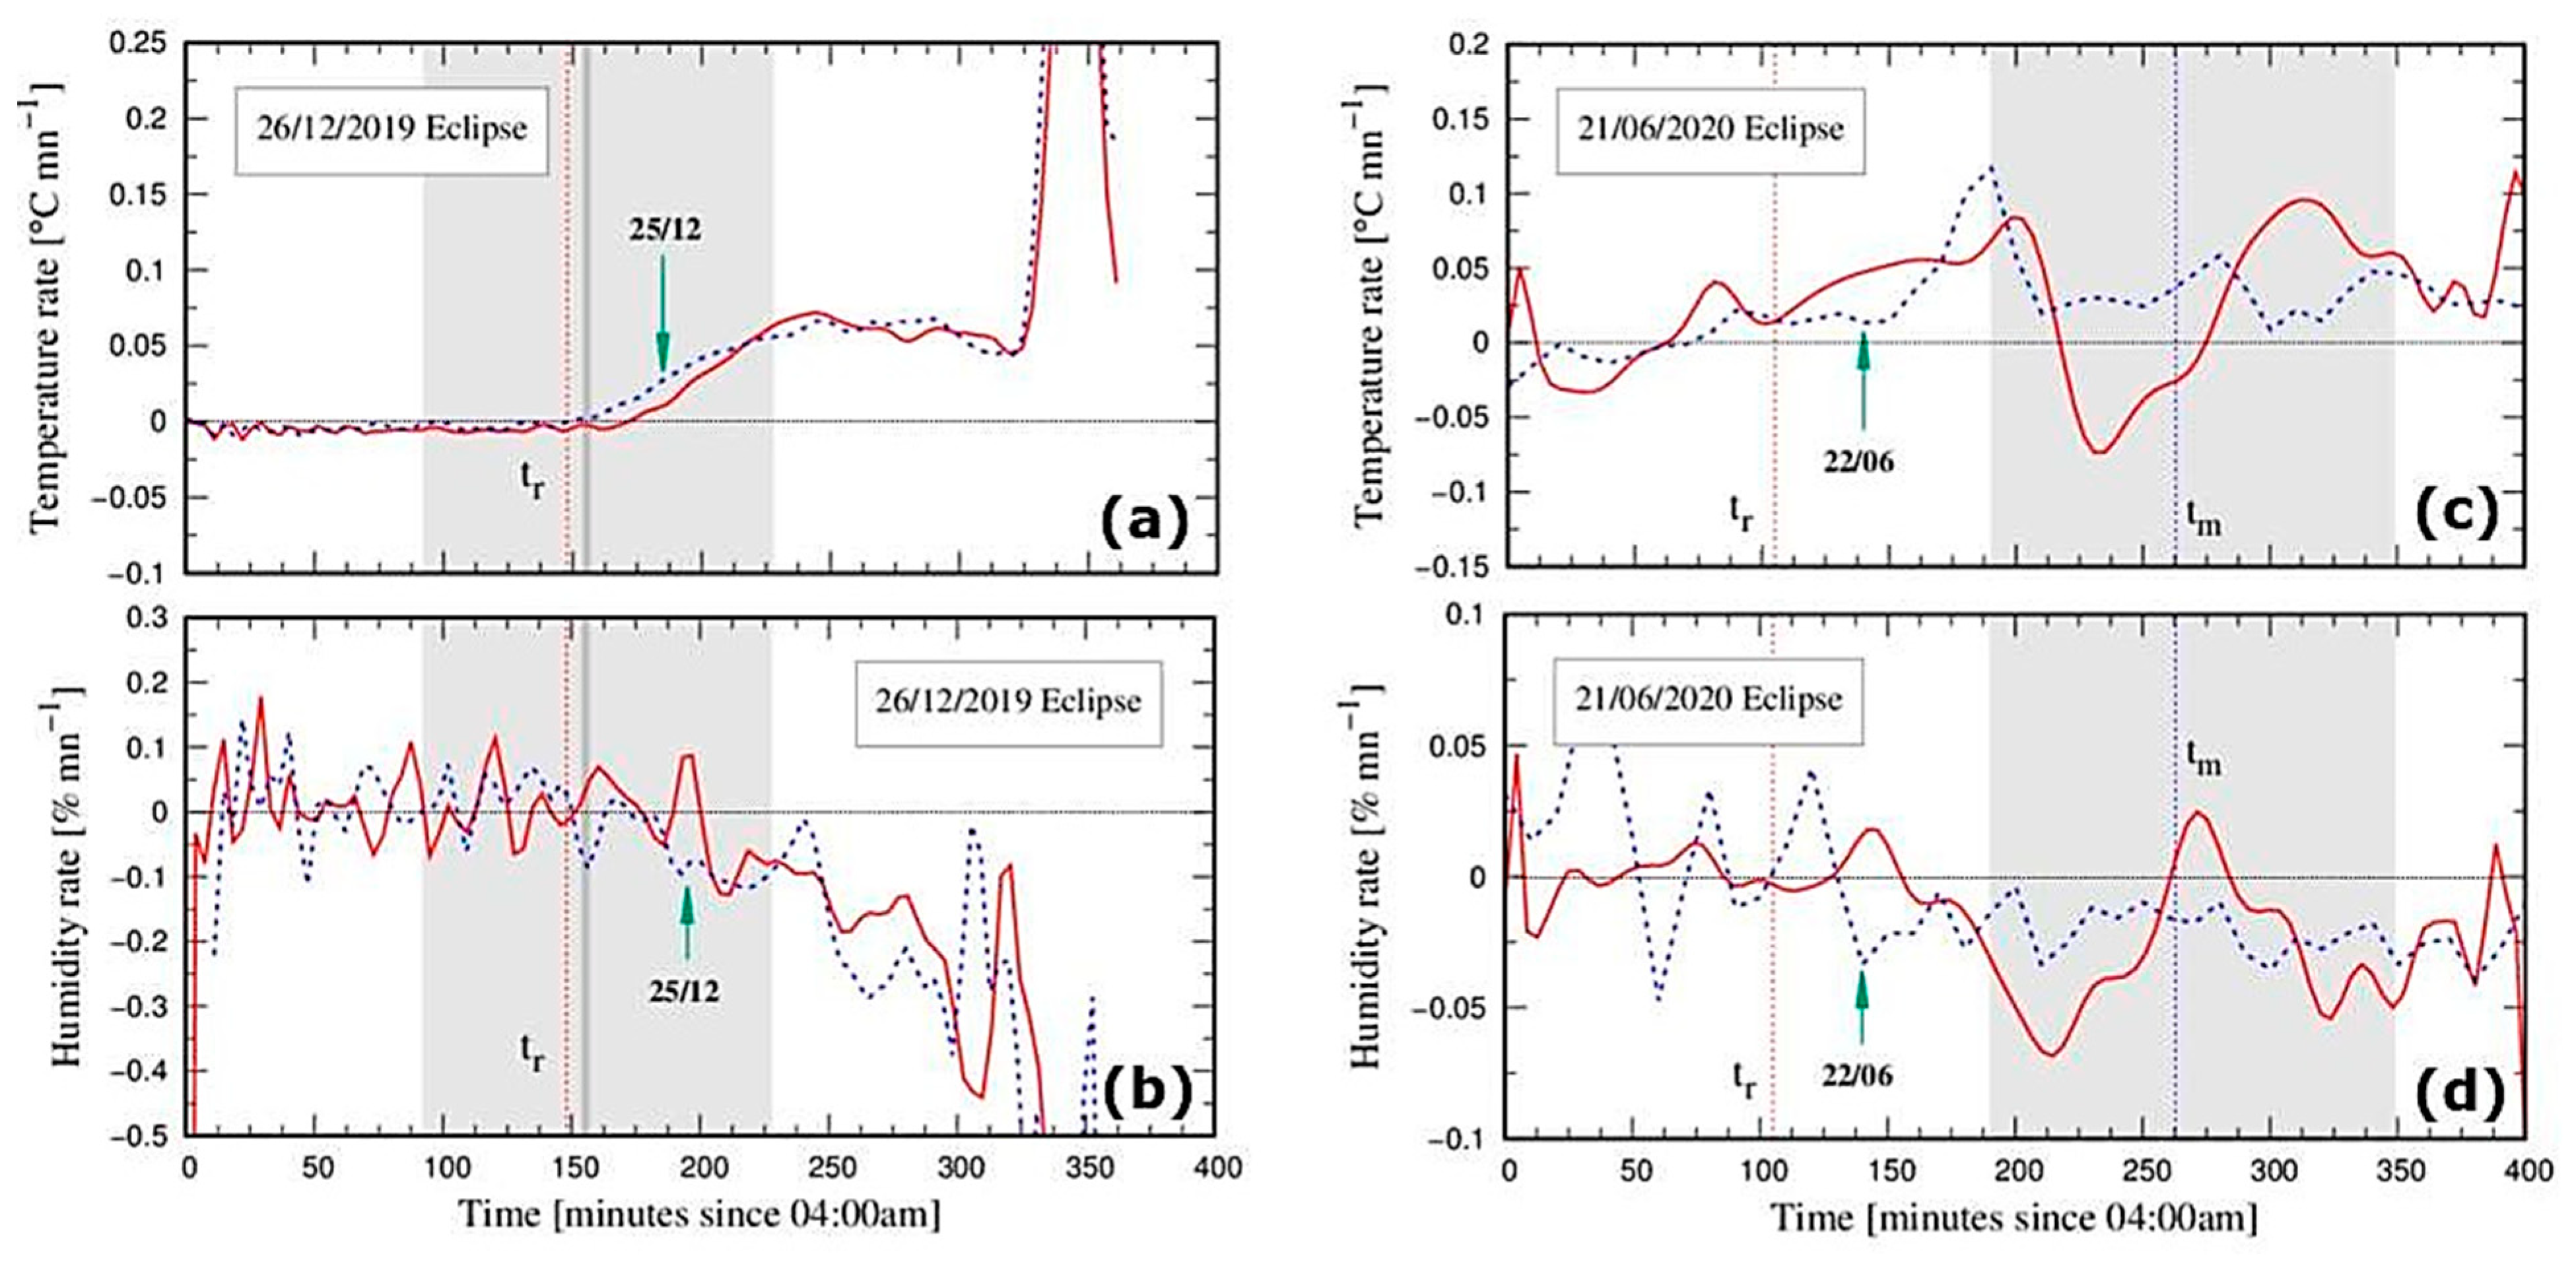
3.3. Eclipse Related-Dynamical Variations and Inter-Comparison
4. Eclipse Meteorology in the Past and Now: Temperature and Humidity
4.1. Temperature: A Very Short Historical Summary
4.2. Humidity: Previous Studies and Rationale
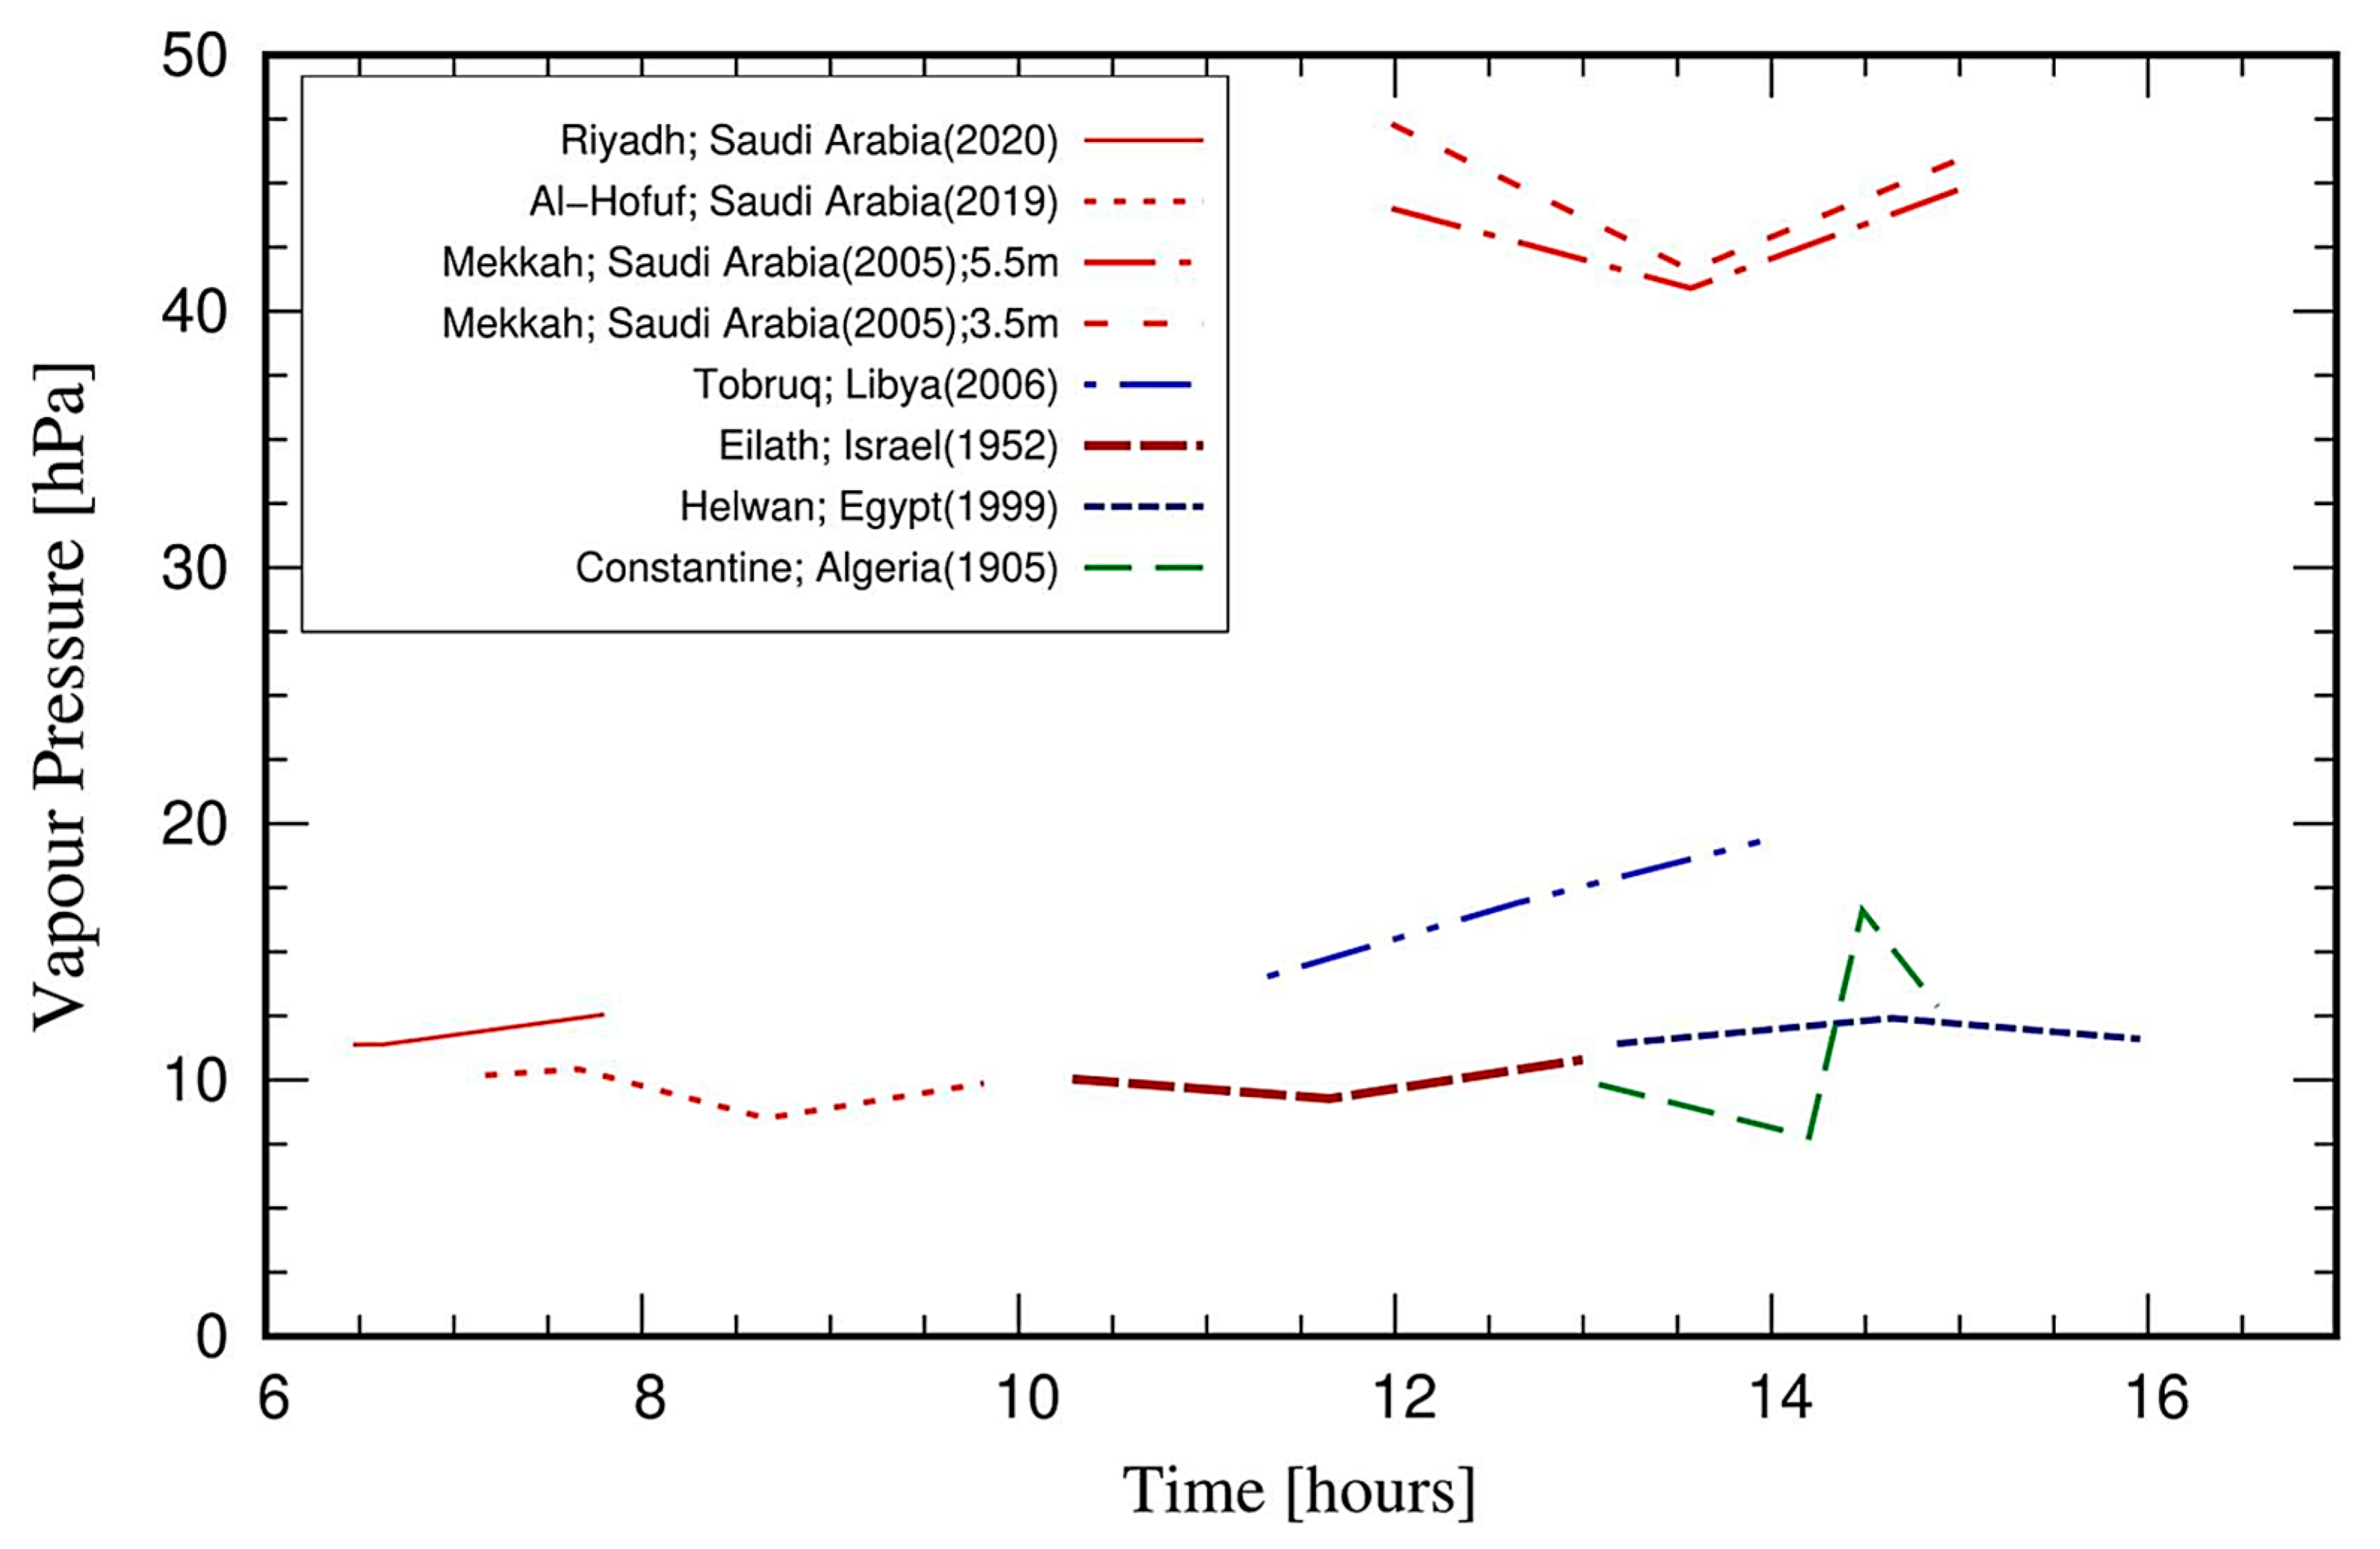
5. Inter-Comparison among Studies of Other Eclipses in Deserts or Similar Environments
5.1. Previous Studies
5.2. Present-Day Observations
6. Discussion
7. Conclusions and Final Comments
Author Contributions
Funding
Institutional Review Board Statement
Informed Consent Statement
Data Availability Statement
Acknowledgments
Conflicts of Interest
References
- Olson, R.J.M.; Pasachoff, J.M. Cosmos: The Art and Science of the Universe; Reaktion Books: London, UK, 2019; p. 320. [Google Scholar]
- Espenak, F. 21st Century Canon of Solar Eclipses. Astropixels. 2016. Available online: https://www.eclipsewise.com/pubs/21CCSE.html (accessed on 1 December 2023).
- Jubier, X. Five Millennium (-1999 to +3000) Canon of Solar Eclipses Database; 2020. Available online: http://xjubier.free.fr/en/site_pages/solar_eclipses/5MCSE/xSE_Five_Millennium_Canon.html (accessed on 01 May 2021).
- Liu, Y.; Shen, Y.; Zhang, X.; Liu, N. Using a new sky brightness monitor to observe the annular solar eclipse on 15th january 2010. Sol. Phys. 2012, 279, 561–572. [Google Scholar] [CrossRef][Green Version]
- Pasachoff, M. Corona Light. Astron. Mag. 2021, 49, 40–45. [Google Scholar]
- Liu, Y.; Elmhamdi, A.; Al-Trabulsy, H.; Song, T.; Zhang, X. A magnificent ring of fire on the horizon of the Persian Gulf: The annular eclipse of Saudi Arabia on December 26, 2019. Amat. Astron. 2020, 7, 57–60. (In Chinese) [Google Scholar]
- Nelli, N.R.; Temimi, M.; Fonseca, R.; Francis, D.; Nesterov, O.; Abida, R.; Weston, M.; Kumar, A. Anatomy of the Annular Solar Eclipse of 26 December 2019 and Its Impact on Land– Atmosphere Interactions Over an Arid Region. IEEE Geosci. Remote. Sens. Lett. 2020, 18, 1312–1316. [Google Scholar] [CrossRef]
- Jaubert, M.J. Observations en ballon pendant l’éclipse du 30 Aoȗt 1905. In Rapport de la mission aéronautique anvoyée, par le Ministère de l’Instruction publique à l’effet d’observer en ballon l’éclipse totale de Soleil du 30 aoȗt, 1905, dans la région de Constantine; Algérie, 1906; pp. 38–52. [Google Scholar]
- Klein, M.; Robison, N. Solar Eclipse of 25 February 1952, Its Influence on the Insolation and on Various Meteorological Elements; Meteorological Notes N° 11 (Series A); Meteorological Service, Ministry of Transport and Cominunications, State of Israel: Jerusalem, Israel, 1955; p. 12. [Google Scholar]
- Anderson, R.C.; Keefer, D.R. Observation of the temperature and pressure changes during the 30 June 1973 solar eclipse. J. Atmos. Sci. 1975, 32, 228–231. [Google Scholar] [CrossRef]
- Rahoma, U.A.; Shaltout, M.A.; Hassan, A.H. Study of spectral global radiation during the partial solar eclipse of 11 August 1999 at Helwan, Egypt. J. Astron. Soc. Egypt 1999, 12, 31–45. [Google Scholar]
- Hassan, A.H.; Shaltout, M.A.; Rahoma, U.A. The depression of different components during the solar eclipse, 11 August 1999 over Egypt. J. Astron. Soc. Egypt 1999, 12, 70–81. [Google Scholar]
- Trapasso, L.M.; Kinkel, B. A study of local weather conditions—The effects of the May 30, 1984 eclipse. Weatherwise 1984, 37, 253–256. [Google Scholar] [CrossRef]
- Bose, S.; Lal, M.; Ghosh, A.B. Measurements of water vapor over Delhi during the solar eclipse—1995. Kodaikanal Obs. Bull. 1997, 13, 183–187. [Google Scholar]
- Gonzalez, G. Ground-level humidity, pressure and temperature measurements during the October 24, 1995 total solar eclipse. Kodaikanal Obs. Bull. 1997, 13, 151–154. [Google Scholar]
- Jain, S.; Arya, B.; Singh, S.; Tripathi, O.; Hamid, A. Measurement of Various Atmospheric Parameters During a Total Solar Eclipse. Terr. Atmos. Ocean. Sci. 1997, 8, 371–384. [Google Scholar] [CrossRef] [PubMed]
- Kolarž, P.; Šekarić, J.; Marinković, B.P.; Filipović, D.M. Correlation between some of the meteorological parameters measured during the partial solar eclipse, 11 August 1999. J. Atmos. Sol. Terr. Phys. 2005, 67, 1357–1364. [Google Scholar] [CrossRef]
- Ahrens, D.; Iziomon, M.G.; Jaeger, L.; Matzarakis, A.; Mayer, H. Impacts of the solar eclipse of 11 August 1999 on routinely rec-orded meteorological and air quality data in south-west Germany. Meteorol. Z. 2001, 10, 215–223. [Google Scholar] [CrossRef]
- Ramchandran, P.M.; Ramchandran, R.; Gupta, K.S.; Patil, S.M.; Jadhav, P.N. Atmospheric Surface-Layer Processes During the Total Solar Eclipse Of 11 August 1999. Bound. Layer Meteorol. 2002, 104, 445–461. [Google Scholar] [CrossRef]
- Pleijel, H. Observations of temperature and air humidity during the total solar eclipse 29 March 2006 at Side, Turkey. Meteorol. Z. 2008, 18, 107–109. [Google Scholar] [CrossRef] [PubMed]
- Kadygrov, E.N.; Al Miller, E.; Troitsky, A.V. Study of Atmospheric Boundary Layer Thermodynamics During Total Solar Eclipses. IEEE Trans. Geosci. Remote Sens. 2013, 51, 4672–4677. [Google Scholar] [CrossRef]
- Muraleedharan, P.M.; Nisha, P.G.; Mohankumar, K. Effect of January 15, 2010 annular solar eclipse on meteorological over Goa, India. J. Atmos. Sol. Terr. Phys. 2011, 73, 1988–1998. [Google Scholar] [CrossRef]
- Bhat, G.; Jagannathan, R. Moisture depletion in the surface layer in response to an annular solar eclipse. J. Atmos. Sol. Terr. Phys. 2012, 80, 60–67. [Google Scholar] [CrossRef]
- Mahmood, R.; Schargorodski, M.; Rappin, E.; Griffin, M.; Collins, P.; Knupp, K.; Quilligan, A.; Wade, R.; Cary, K.; Foster, S. The Total Solar Eclipse of 2017: Meteorological Observations from a Statewide Mesonet and Atmospheric Profiling Systems. Bull. Am. Meteorol. Soc. 2020, 101, E720–E737. [Google Scholar] [CrossRef]
- Buban, M.S.; Lee, T.R.; Dumas, E.J.; Baker, C.B.; Heuer, M. Observations and Numerical Simulation of the Effects of the 21 August 2017 North American Total Solar Eclipse on Surface Conditions and Atmospheric Boundary-Layer Evolution. Bound. Layer Meteorol. 2019, 171, 257–270. [Google Scholar] [CrossRef]
- Jubier, X. AL-Hofuf Eclipse Path. 2020. Available online: http://xjubier.free.fr/en/site_pages/solar_eclipses/xSE_GoogleMap3.php?Ecl=+20191226&Acc=2&Umb=1&Lmt=1&Mag=1&Max=1&Map=ROADMAP&Lat=25.38003&Lng=49.58877&Elv=-1.0&Zoom=7&LC=1 (accessed on 1 May 2021).
- Alharbi, B.H.; Pasha, M.J.; Tapper, N. Assessment of Ambient Air Quality in Riyadh City, Saudi Arabia. Curr. World Environ. J. 2014, 9, 227–236. [Google Scholar] [CrossRef]
- Alharbi, B.; Shareef, M.M.; Husain, T. Study of chemical characteristics of particulate matter concentrations in Riyadh, Saudi Arabia. Atmos. Pollut. Res. 2015, 6, 88–98. [Google Scholar] [CrossRef]
- Al-Rajhi, M.; Seaward, M.; Al-Aamer, A. Metal levels in indoor and outdoor dust in Riyadh, Saudi Arabia. Environ. Int. 1996, 22, 315–324. [Google Scholar] [CrossRef]
- Modaihsh, A.S.; Mahjou, M.O. Falling Dust Characteristics in Riyadh City, Saudi Arabia During Winter Months. APCBEE Procedia 2013, 5, 50–58. [Google Scholar] [CrossRef]
- Yousef, L.A.; Temimi, M.; Molini, A.; Weston, M.; Wehbe, Y.; Al Mandous, A. Cloud Cover over the Arabian Peninsula from Global Remote Sensing and Reanalysis Products. Atmos. Res. 2020, 238, 104866. [Google Scholar] [CrossRef]
- Kumar, K.N.; Ouarda, T.B.M.J. Precipitation variability over UAE and global SST teleconnections. J. Geophys. Res. Atmos. 2014, 119, 10313–10322. [Google Scholar]
- Steinhoff, D.F.; Bruintjes, R.; Hacker, J.; Keller, T.; Williams, C.; Jensen, T.; Al Mandous, A.; Al Yazeedi, O.A. Influences of the Monsoon Trough and Arabian Heat Low on Summer Rainfall over the United Arab Emirates. Mon. Weather Rev. 2018, 146, 1383–1403. [Google Scholar] [CrossRef]
- Al Senafi, F.; Anis, A. Shamals and climate variability in the Northern Arabian/Persian Gulf from 1973 to 2012. Int. J. Climatol. 2015, 35, 4509–4528. [Google Scholar] [CrossRef]
- Yu, Y.; Notaro, M.; Liu, Z.; Wang, F.; Alkolibi, F.; Fadda, E.; Bakhrjy, F. Climatic controls on the interannual to decadal variability in Saudi Arabian dust activity: Toward the development of a seasonal dust prediction model. J. Geophys. Res. Atmos. 2015, 120, 1739–1758. [Google Scholar] [CrossRef]
- Yu, Y.; Notaro, M.; Kalashnikova, O.V.; Garay, M.J. Climatology of summer Shamal wind in the Middle East. J. Geophys. Res. Atmos. 2016, 121, 289–305. [Google Scholar] [CrossRef]
- Abuelgasim, A.; Farahat, A. Effect of dust loadings, meteorological conditions, and local emissions on aerosol mixing and loading variability over highly urbanized semiarid countries: United Arab Emirates case study. J. Atmos. Sol. Terr. Phys. 2020, 199, 105215. [Google Scholar] [CrossRef]
- Nelli, N.R.; Temimi, M.; Fonseca, R.M.; Weston, M.J.; Thota, M.S.; Valappil, V.K.; Branch, O.; Wizemann, H.-D.; Wulfmeyer, V.; Wehbe, Y. Micrometeorological measurements in an arid environment: Diurnal characteristics and surface energy balance closure. Atmos. Res. 2020, 234, 104745. [Google Scholar] [CrossRef]
- Maghrabi, A.; Clay, R.; Wild, N.; Dawson, B. Design and development of a simple infrared monitor for cloud detection. Energy Convers. Manag. 2009, 50, 2732–2737. [Google Scholar] [CrossRef]
- Bohren, C.F.; Albrecht, B.A. Atmospheric Thermodynamics; Oxford University Press: Oxford, UK, 1998; p. 402. [Google Scholar]
- Buck, A.L. New equations for computing vapor pressure and enhancement factor. J. Appl. Meteorol. 1981, 20, 1527–1532. [Google Scholar] [CrossRef]
- Campbell, G.S.; Norman, J.M. An Introduction to Environmental Biophysics; Springer: New York, NY, USA, 1998; p. 286. [Google Scholar]
- Idso, S.B.; Jackson, R.D. Thermal radiation from the atmosphere. J. Geophys. Res. 1969, 74, 5397–5403. [Google Scholar] [CrossRef]
- Huzimura, I. The effect of solar eclipse on the meteorological elements at various altitudes along the slope of Mt. Huzi. In Report of Solar Eclipse Observation; The Geophysical Magazine; Central Meteorological Observatory: Tokyo, Japan, 1949; Volume XIX, pp. 94–114. [Google Scholar]
- Peñaloza-Murillo, M.A.; Roman, M.T.; Pasachoff, J.M. Anomalies and fluctuations of near-surface air temperature at Tianhuangping (Zhejiang), China, produced by the longest total solar eclipse of the 21st century under cloudy skies. Publ. Astron. Soc. Pac. 2020, 132, 114503. [Google Scholar] [CrossRef]
- Brereton, J.A. Meteorological observations during the solar eclipse of 30th November, 1834, at Boston, Mass.—The Thermometer (Monlamden’s) in the shade, and, of course, in northern exposure. Boston Med. Surg. J. 1834, 10, 296. [Google Scholar]
- Barlow, E.W. The meteorology of solar eclipses. Q. J. R. Meteorol. Soc. 1927, 53, 1–24. [Google Scholar]
- Aplin, K.L.; Scott, C.J.; Gray, L. Atmospheric changes from solar eclipses. Philos. Trans. R. Soc. A 2016, 374, 20150217. [Google Scholar] [CrossRef]
- Peñaloza-Murillo, M.A.; Pasachoff, J.M. Air-cooling mathematical analysis as inferred from the air-temperature observation during the 1st total occultation of the Sun of the 21st century at Lusaka, Zambia. J. Atmos. Sol. Terr. Phys. 2015, 125–126, 59–77. [Google Scholar] [CrossRef]
- Kameda, T.; Fujita, K.; Sugita, O.; Hirasawa, N.; Takahashi, S. Total solar eclipse over Antarctica on 23 November 2003 and its effects on the atmosphere and snow near the ice sheet surface at Dome Fuji. J. Geophys. Res. 2009, 114, D18115. [Google Scholar] [CrossRef]
- Pakkattil, A.; Muhsin, M.; John, S.; Saseendran, A.; Thomas, A.P.; Deepa, V.; Varma, R. Trace pollutant fluctuations observed in Calicut city, India, during the annular solar eclipse on 26 December 2019. Atmos. Pollut. Res. 2020, 11, 2049–2055. [Google Scholar] [CrossRef]
- Reddy, T.L.; Balakrishnaiah, G.; Reddy, K.R.O.; Reddy, N.S.K.; Rao, T.C.; Gopal, K.R.; Bhavyasree, A. Perturbations of atmospheric surface layer characteristics during the annular solar eclipse on 26 December 2019 over a semi-arid region Anantapur in southern India. J. Atmos. Sol. Terr. Phys. 2020, 211, 195467. [Google Scholar]
- Brooks, C.F.; Fergusson, S.P.; Kimball, H.H.; Haurwitz, B.; Brooks, E.S.; Namias, J.; Pierce, C.H.; Wexler, E.M. Eclipse Meteorology with Special Reference to the Total Solar Eclipse of August 31, 1932; Harvard Meteorological Studies N°5; Harvard University—Blue Hill Meteorological Observatory: Milton, MA, USA, 1941; p. 109. [Google Scholar]
- Burt, S. Meteorological impacts of the total solar eclipse of 21 August 2017. Weather 2018, 73, 90–95. [Google Scholar] [CrossRef]
- Hanna, E.; Penman, J.; Jónsson, T.; Bigg, G.R.; Björnsson, H.; Sjúrðarson, S.; Hansen, M.A.; Cappelen, J.; Bryant, R.G. Meteorological effects of the solar eclipse of 20 March 2015: Analysis of UK Met Office automatic weather station data and comparison with automatic weather station data from the Faroes and Iceland. Philos. Trans. R. Soc. A 2016, 374, 20150212. [Google Scholar] [CrossRef] [PubMed]
- Schulz, A.; Schaller, C.; Maturilli, M.; Boike, J.; Ritter, C.; Foken, T. Surface energy fluxes during the total solar eclipse over Ny-Ålesund, Svalbard, on 20 March 2015. Meteorol. Z. 2017, 26, 431–440. [Google Scholar] [CrossRef]
- Segal, M.; Turner, R.W.; Prusa, J.; Bitzer, R.J.; Finley, S.V. Solar eclipse effect on shelter air temperature. Bull. Am. Meteorol. Soc. 1996, 77, 89–99. [Google Scholar] [CrossRef][Green Version]
- Ushiyama, U.; Narita, F.; Suzuki, Y.; Suzuki, T. The variation of the surface meteorological elements. In Report of Solar Eclipse Observation May, 9 1948; The Geophysical Magazine; Central Meteorological Observatory: Tokyo, Japan, 1949; Volume XIX, pp. 78–94. [Google Scholar]
- Alexander, S. Observation of the annular eclipse of May 26 in the suburbs of Ogdensburgh. N. Y. Astrophys. J. 1854, IV, 7–22. [Google Scholar]
- Gilliss, J.M. An account of the total solar eclipse of July 18, 1860, as observed for the United States Coast Survey near Steilacoom, Washington Territory. In Report of the Superintendent of the United States Coast Survey, 1860; Appendices 21 and 22; Government Printing Office: Washington, DC, USA, 1861; pp. 229–292. [Google Scholar]
- Upton, W.; Rotch, L. Meteorological and other observations made at Willows, California, in connection with the total solar eclipse of January 1, 1889. Ann. Astron. Obs. Harv. Coll. 1892, 29, 1–35. [Google Scholar]
- Clayton, H.H. The eclipse cyclone and the diurnal cyclones. In Annals of the Astronomical Observatory of Harvard College; The Observatory: Cambridge, UK, 1901; Volume 43, pp. 1–37. [Google Scholar]
- Bigelow, F.H. Eclipse Meteorology and Allied Problems; U.S. Department of Agriculture, Weather Bureau. Government Printing Office: Washington, WA, USA, 1902; 166p. [Google Scholar]
- Bauer, L.A.; Fisk, H.W. On the results of some magnetic observations during the solar eclipse of August 21, 1914. Terr. Magn. Atmos. Electr. 1916, 21, 57–86. [Google Scholar] [CrossRef]
- Ugueto, L. El Eclipse Total de sol del 3 de febrero de 1916 en Venezuela; Ministerio de Instrucción Pública—Observatorio Cagigal. Litografía Comercio: Caracas, Venezuela, 1916; p. 42. [Google Scholar]
- Sifontes, E. Variaciones meteorológicas durante un eclipse—El eclipse anular de Sol del 22 de noviembre de 1919, visto en Ciudad Bolívar (Venezuela) SA, como un eclipse parcial. In Contribuciones al Estudio de la Climatología Tropical en la Zona Sur del Río Orinoco, Parte 3; Ciudad Bolívar, Venezuela, 1920; pp. 34–36. [Google Scholar]
- Bilham, E.G. Meteorological observations during the annular solar eclipse of April 8, 1921. Q. J. R. Meteorol. Soc. 1921, 47, 206–210. [Google Scholar]
- Samuels, L.T. SPECIAL Aerological observations during the solar eclipse of January 24, 1925. Mon. Weather Rev. 1925, 53, 23. [Google Scholar] [CrossRef]
- Stenz, E. Radiation solaire et l’opacité atmosphérique pendant l’éclipse du soleil du, 29. VI. 1927 à Jokkmokk. Gerlands Beiträge Geophys. 1929, XXI, 269–289. [Google Scholar]
- Stratton, F.J.M. Total Solar Eclipse, 1932 August 31: Report of the Expedition from the Solar Physics Observatory, Cambridge. Mon. Not. R. Astron. Soc. 1932, 93, 9–16. [Google Scholar] [CrossRef][Green Version]
- Cohn, W.M. Some meteorological observations in connection with the 1932 and 1934 total eclipses of the Sun. Pop. Astron. 1938, 46, 201–204. [Google Scholar]
- Süring, R.; Kühl, W.; Albrecht, F. Ergbnisse der Sonnenfinsternisexpedition des meteorologische Observatoriums Postdam nach Lappland im Juni and Juli 1927. Met. Inst. Veröff. Bd. 1934, 10, 47. [Google Scholar]
- Anfossi, D.; Schayes, G.; Degrazia, G.; Goulart, A. Atmospheric Turbulence Decay During the Solar Total Eclipse of 11 August 1999. Bound. Layer Meteorol. 2004, 111, 301–311. [Google Scholar] [CrossRef]
- Antonia, R.A.; Chambers, A.J.; Phong-Anant, D.; Rajagopalan, S.; Sreenivasan, K.R. Response of atmospheric surface layer turbulence to a partial solar eclipse. J. Geophys. Res. 1979, 84, 1689–1692. [Google Scholar] [CrossRef]
- Eaton, F.D.; Hines, J.R.; Hatch, W.H.; Cionco, R.M.; Byers, J.; Garvey, D.; Miller, D.R. Solar eclipse effects observed in the planetary boundary layer over a desert. Bound. Layer Meteorol. 1997, 83, 331–346. [Google Scholar] [CrossRef]
- Raman, S.; Boone, P.; Rao, K.S. Observations and numerical simulation of the evolution of the tropical planetary boundary layer during total solar eclipses. Atmos. Environ. Part A Gen. Top. 1990, 24, 789–799. [Google Scholar] [CrossRef]
- Szałowski, K. The effect of the solar eclipse on the air temperature near the ground. J. Atmos. Sol.-Terr. Phys. 2002, 64, 1589–1600. [Google Scholar] [CrossRef]
- Eliot, J. Observations recorded during the solar eclipse of 22nd January 1898 at 154 meteorological stations in India. Indian Meteorol. Mem. 1809, 11, 1–183. [Google Scholar]
- Lowry, W.P.; Lowry, P.P. Fundamentals of Biometeorology—Interactions of Organisms and the Atmosphere, Volume I: The Physical Environment; Peavine Publications: McMinnville, OR, USA, 1989; p. 310. [Google Scholar]
- Montheith, J.L.; Unsworth, M. Principles of Environmental Physics, 2nd ed.; Butterworth-Heinemann, Elsevier: Oxford, UK, 1990. [Google Scholar]
- World Meteorological Organization. Turbulent Diffusion in the Atmosphere; Technical Note N° 24 (WMO-N° 77. TP.31); World Meteorological Organization: Geneva, Switzerland, 1954; p. 68. [Google Scholar]
- Knöfel, V.A. Meteorologische beobachtungen während der sonnenfinsternis am 30. Mai 1984. Z. Meteorol. 1986, 36, 335–340. [Google Scholar]
- Kullenberg, B. Biological Observations during the Solar Eclipse in Southern Sweden (Province of Öland) on 30th June 1954. Oikos 1955, 6, 51–60. [Google Scholar] [CrossRef]
- Paulsen, H.S. On Radiation, Illumination, and Meteorological Conditions in Southern Norway during the Total Solar Eclipse of June 30, 1954; Naturvitenskapelig Rekke; Nr. 7; Universitetet I Bergen, Årbok: Bergen, Norway, 1995; pp. 1–33. [Google Scholar]
- Anić, B. Atmospherical effects of the total solar eclipse in 1961. Arch. Met. Geoph. Biokl. B. 1970, 18, 197–201. [Google Scholar] [CrossRef]
- Pruitt, W.O.; Lourence, F.; Crawford, T.V. Radiation and Energy Balance Changes During the Eclipse of 20 July 1963. J. Appl. Meteorol. 1965, 4, 272–278. [Google Scholar] [CrossRef]
- Stewart, R.B.; Rouse, W.R. Radiation and Energy Budgets at an Arctic Site during the Solar Eclipse of July 10, 1972. Arct. Alp. Res. 1974, 6, 231–236. [Google Scholar] [CrossRef]
- Katsoulis, B.A.S. On certain radiometric and other meteorological measurements, made in Athens. Mem. Natl. Obs. Athens 1976, 44, 3–10. [Google Scholar]
- Babu, V.R.; Sastry, J.S. Total solar eclipse of 16 February 1980 and the vertical profiles of atmospheric parameters in the lowest 200 m. In Total Solar Eclipse of 16 February, 1980, Proceedings of the Symposium, New Delhi, India, 27–31 January 1981; Results of Observations; A Special Supplement to Proceedings of INSA, Part A, Physical Sciences; Trehan, S.K., Ed.; Indian National Academy of Science: New Delhi, India, 1982; Volume 48, pp. 196–201. [Google Scholar]
- Mohanakumar, K.; Devanarayanam, S. Solar eclipse of 16 February 1980—Its effect on meteorological parameters. In Total Solar Eclipse of 16 February, 1980, Proceedings of the Symposium, New Delhi, India, 27–31 January 1981; Results of Observations; A Special Supplement to Proceedings of INSA, Part A, Physical Sciences; Trehan, S.K., Ed.; Indian National Academy of Science: New Delhi, India, 1982; Volume 48, pp. 209–216. [Google Scholar]
- Kotrappa, P.; Mayya, Y.S.; Dua, S.K.; Gupta, P.C. Increase in ground level concentration of radon during solar eclipse. Health Phys. 1981, 40, 559–560. [Google Scholar]
- Castro, V.; Hidalgo, H.; Fernández, W. Air temperature and wind changes in Costa Rica during the total solar eclipse of July 11, 1991. Earth Moon Planets 1993, 63, 133–147. [Google Scholar]
- Bernard, E.A.; Vandiepenbeek, M.; Verhas, P. Météorologie et micrométéorologie de l’éclipse totale de soleil du 11 juilet 1991 à San Cabo (México). Ciel Terre 1992, 108, 3–10. [Google Scholar]
- Gaso, M.; Cervantes, M.; Segovia, N.; Espindola, V. Atmospheric radon concentration levels. Radiat. Meas. 1994, 23, 225–230. [Google Scholar] [CrossRef]
- Mauder, M.; Desjardins, R.L.; Oncley, S.P.; MacPherson, I. Atmospheric Response to a Partial Solar Eclipse over a Cotton Field in Central California. J. Appl. Meteorol. Clim. 2007, 46, 1792–1803. [Google Scholar] [CrossRef][Green Version]
- Hidalgo, H.; Coronel, G.; Morales, E.; Fernández, W. Changes in meteorological variables in Coronel Oviedo, Paraguay, during the total solar eclipse of 3 November 1994. Earth Moon Planets 1996, 74, 49–59. [Google Scholar]
- Arulraj, S.; Dharmaraj, T.; Debaje, S.B.; Singh, A.B.; Vernekar, K.G. The dynamics of surface boundary layer during total Solar eclipse 1995. Mausam 1998, 49, 475–480. [Google Scholar] [CrossRef]
- Bansal, M.K.; Verma, T.S. Aerosol measurements at Roorkee relating to the total solar eclipse of 24 October 1995. Indian J. Radio Space Phys. 1998, 27, 260–263. [Google Scholar]
- Dani, K.; Devara, P. Aerosol optical depth and ozone variations during the total solar eclipse of 24 October 1995. Atmospheric Res. 2002, 65, 1–15. [Google Scholar] [CrossRef]
- Ghosh, A.; Bose, S.; Lal, M.; Maitra, A. Ground-based Measurements of Some Minor Constituents During the Solar Eclipse-1995. Terr. Atmos. Ocean. Sci. 1997, 8, 247–253. [Google Scholar] [CrossRef]
- Niranjan, K.; Thulasiraman, S. Aerosol Optical Depth and Size Distribution Changes During the Total Solar Eclipse of 24 October 1995. Terr. Atmos. Ocean. Sci. 1998, 9, 255–262. [Google Scholar] [CrossRef]
- Sapra, B.K.; Mayya, Y.S.; Sawant, V.D.; Nambi, K.S.V. Aerosol measurements at Trombay relating to the 1995 solar eclipse. Curr. Sci. 1997, 72, 321–325. [Google Scholar]
- Singh, A.K.; Nivas, S.; Kumar, A.; Rai, J.; Nigam, M.J. Variations in atmospheric aerosols and electrical conductivity at Roorkee during the total solar eclipse of October 1995. Indian J. Radio Space Phys. 1999, 28, 1–10. [Google Scholar]
- Peñaloza-Murillo, M.A. Optical Response of the Atmosphere During the Caribbean Total Solar Eclipses of 26 February 1998 and of 3 February 1916 at Falcón state, Venezuela. Earth Moon Planets 2002, 91, 125–159. [Google Scholar] [CrossRef]
- Peñaloza, M.M.A. Respuesta radiativa del cielo y de la superficie durante el eclipse solar del 3 de febrero de 1916 en Tucacas y durante el eclipse solar del 26 de febrero de 1998 en Paraguaná, Venezuela. Croizatia 2003, 4, 7–25. [Google Scholar]
- Božić, N. Total solar eclipse on August 11th 1999 observed at Kelebija. In Proceedings of the XIII National Conference of Yugoslav Astronomers, Belgrade, Serbia, 17–20 October 2002. [Google Scholar]
- Crochard, G.; Renaut, D. L’impact météorologique de l’eclipe du 11 Aoû 1999. Météorologie 1999, 28, 57–63. [Google Scholar] [CrossRef][Green Version]
- Foken, T.; Wichura, B.; Klemm, O.; Gerchau, J.; Winterhalter, M.; Weidinger, T. Micrometeorological measurements during the total solar eclipse of August 11, 1999. Meteorol. Z. 2001, 10, 171–178. [Google Scholar] [CrossRef]
- Häberle, K.-H.; Reiter, I.; Patzner, K.; Heyne, C.; Matyssek, R. Switching the light off: A break in photosynthesis and sap flow of forest trees under total solar eclipse. Meteorol. Z. 2001, 10, 201–206. [Google Scholar] [CrossRef]
- Kolev, N.; Tatarov, B.; Grigorieva, V.; Donev, E.; Simeonev, P.; Umlensky, V.; Kaprielov, B.; Kolev, I. Aeorosol lidar and in situ observations of the planetary boundary layer over Bulgaria during the solar eclipse of 11 August 1999. Int. J. Remote Sens. 2005, 26, 3567–3584. [Google Scholar] [CrossRef]
- Perkins, D.F. Weather observations on Anglesey during the solar eclipse on 11 August 1999. J. Meteorol. 2000, 25, 5–10. [Google Scholar]
- Prenosil, T. The influence of the 11 August 1999 total solar eclipse on the weather over central Europe. Meteorol. Z. 2000, 9, 351–359. [Google Scholar] [CrossRef]
- Simeonov, P.; Iordanova, D.; Dimitrova, P. Overview of meteorological conditions during the total solar eclipse observa-tions in Shabla on August 11, 1999. In Proceedings of the International Conference “First Results of 1999 Total Eclipse Observations”, Varna, Bulgaria, 11–15 September 2000; Mishev, D.N., Phillips, K.J.H., Eds.; Bulgarian Academy of Sciences: Sofia, Bulgaria, 2002; pp. 243–246. [Google Scholar]
- Stoev, A.; Tasheva, T.; Muglova, P.; Kishinova, N.; Halachliyska, C. Changes in meteorological parameters near the ground during the 1999 total solar eclipse. In Proceedings of the International Conference “First Results of 1999 Total Eclipse Observations”, Varna, Bulgaria, 11–15 September 2000; Mishev, D.N., Phillips, K.J.H., Eds.; Bulgarian Academy of Sciences: Sofia, Bulgaria, 2000; pp. 237–242. [Google Scholar]
- Tzenkova, A.; Mihnevski, N.; Ivancheva, J.; Lanzov, I. Micrometeorological investigations during the 1999 total solar eclipse in Shabla. In Proceedings of the International Conference “First Results of 1999 Total Eclipse Observations”, Varna, Bulgaria, 11–15 September 2000; Mishev, D.N., Phillips, K.J.H., Eds.; Bulgarian Academy of Sciences: Sofia, Bulgaria, 2002; pp. 231–236. [Google Scholar]
- Krishnan, P.; Kunhikrishnan, P.K.; Nair, S.M.; Ravindran, S.; Ramachandran, R.; Subrahamanyam, D.B.; Ramana, M.V. Observations of the atmospheric surface layer parameters over a semid arid region during the solar eclipse of August 11th, 1999. Proc. Indian Acad. Sci. Earth Planet. Sci. 2004, 113, 353–363. [Google Scholar] [CrossRef]
- Imbres, J.M. Solar eclipse—June 21, 2001. In Report for the Center for Advanced Studies of the U.S. Coast Guard Academy; United States Coast Guard Academy: New London, CT, USA, 2001; p. 28. [Google Scholar]
- Anbar, O.M.Y. Solar Eclipse Effects on the Air Near the Surface over Makkah Region. JKAU Meteorol. Environ. Arid. Land Agric. Sci. 2006, 18, 47–59. [Google Scholar] [CrossRef]
- Hassan, A.H.; Rahoma, U.A. Solar radiation at total solar eclipse, 29-March 2006, at Tobruq. Am. J. Env. Ment. Sci. 2010, 6, 449–454. [Google Scholar] [CrossRef][Green Version]
- Amiridis, V.; Melas, D.; Balis, D.S.; Papayannis, A.; Founda, D.; Katragkou, E.; Giannakaki, E.; Mamouri, R.E.; Gerasopoulos, E.; Zerefos, C. Aerosol Lidar observations and model calculations of the Planetary Boundary Layer evolution over Greece, during the March 2006 Total Solar Eclipse. Atmos. Chem. Phys. 2007, 7, 6181–6189. [Google Scholar] [CrossRef]
- Tzanis, C.; Varotsos, C.; Viras, L. Impacts of the solar eclipse of 29 March 2006 on the surface ozone concentration, the solar ultraviolet radiation and the meteorological parameters at Athens, Greece. Atmos. Meas. Tech. 2008, 8, 425–430. [Google Scholar] [CrossRef]
- Stoev, A.D.; Stoeva, P.V.; Kiskinova, N.; Stoyanov, N. Evolution of the basic micrometeorological parameters during the total solar eclipse of 29 March 2006 at Manavgat, Turkey. In Fourteenth International Symposium on Atmospheric and Ocean Optics/Atmospheric Physics; Matvienko, G.G., Banakh, V.A., Eds.; SPIE: Bellingham, WA, USA, 2008; Volume 6936, p. 69361Z. [Google Scholar]
- Uddin, W.; Joshi, B.; Kumar, S.T.; Sharma, S.; Sagar, R. Observations of total solar eclipse of 29 March 2006 and related atmospheric measurements. Curr. Sci. 2007, 93, 957–959. [Google Scholar]
- Sjöblom, A. A solar eclipse seen from the High Arctic during the period of midnight sun: Effects on the local meteorology. Meteorol. Atmos. Phys. 2010, 107, 123–136. [Google Scholar] [CrossRef]
- Chung, Y.S.; Kim, H.S.; Choo, S.H. The solar eclipse and associated atmospheric variations observed in South Korea on 22 July 2009. Air Qual. Atmos. Health 2010, 3, 125–130. [Google Scholar] [CrossRef][Green Version]
- Jeon, B.-I.L. Effects on meteorological variables during the partial solar eclipse event of 22 July 2009 in Korea. J. Environ. Sci. Int. 2011, 20, 1041–1048, (in Korean with abstract in English). [Google Scholar] [CrossRef][Green Version]
- Chen, Z.; Liu, W.; Zhang, Y.; He, J.; Ruan, J. Mixing layer height and meteorological measurements in Hefei China during the total solar eclipse of 22 July, 2009. Opt. Laser Technol. 2011, 43, 50–54. [Google Scholar] [CrossRef]
- Lu, J.; Chen, S.-L.; Bu, C.-W.; Liu, Y.-X. Analysis of urban thermal environment change characteristics during the total solar eclipse. Guang Pu Xue Yu Guang Pu Fen Xi Spectrosc. Spectr. Anal. 2011, 31, 911–914. (In Chinese) [Google Scholar]
- Pintér, T.; Péntek, K.; Mitre, Z. 20th National Solar Physics Meeting Conference Proceedings; Dorotovic, I., Ed.; Slovack Central Observatory: Hurbanovo, Slovakia, 2010; p. 144. [Google Scholar]
- Stoeva, P.; Stoev, A.; Kuzin, S.; Stoyanov, N.; Pertsov, A. Fundamental Space Research; Dachev, T., Danov, D., Tishchenko, Y., Eds.; Solar Terrestrial Influences Institute “Acad. D. Mishev” of Bulgarian Academy of Science, Sofia, Bulgaria & Kotel’nikov Institute of Radioengineering and Electronics of Russian Academy of Sciences: Moscow, Russia, 2009; p. 132. [Google Scholar]
- Zainuddin, M.Z.; Haron, S.; Niri, M.A.; Ahmad, N.; Nawawi, M.S.A.M.; Man, S.; Rodzali, M.Z.; Ramli, R.; Wahab, R.A.; Ismail, K.; et al. Sky brightness condition during total solar eclipse on July 22, 2009. Middle-East J. Sci. Res. 2013, 13, 220–223. [Google Scholar]
- Rao, K.G.; Reddy, N.N.; Ramakrishna, G.; Bhuyan, P.K.; Bhuyan, K.; Kalita, G.; Pathak, B. Near surface atmospheric response to the total solar eclipse at Dibrugarh on 22 July 2009. J. Atmos. Sol. Terr. Phys. 2013, 95, 87–95. [Google Scholar] [CrossRef]
- Kumar, A. Variations in atmospheric aerosol concentration of various sizes during the total solar eclipse of 22 July 2009 over a semi urban tropical site of Northern India. Indian J. Phys. 2014, 88, 449–453. [Google Scholar] [CrossRef]
- Babu, S.S.; Sreekanth, V.; Moorthy, K.K.; Mohan, M.N.V.; Kirankumar, N.V.P.; Subrahamanyam, D.B.; Gogoi, M.M.; Kompalli, S.K.; Beegum, N.; Cahubey, J.P.; et al. Vertical profiles of aerosol black carbon in the atmospheric boundary layer over a tropical coastal station: Perturbations during an annular solar eclipse. Atmos. Res. 2011, 99, 471–478. [Google Scholar] [CrossRef]
- Manchanda, R.; Sinha, P.; Sreenivasan, S.; Trivedi, D.; Kapardhi, B.; Kumar, B.S.; Kumar, P.; Satyaprakash, U.; Rao, V. In-situ measurements of vertical structure of ozone during the solar eclipse of 15 January 2010. J. Atmos. Sol. Terr. Phys. 2012, 84–85, 88–100. [Google Scholar] [CrossRef]
- Subrahamanyam, D.B.; Anurose, T. Solar eclipse induced impacts on sea/land breeze circulation over Thumba: A case study. J. Atmos. Sol. Terr. Phys. 2011, 73, 703–708. [Google Scholar] [CrossRef]
- Subrahamanyam, D.B.; Anurose, T.J.; Mohan, M.; Santosh, M.; Kumar, N.V.P.K.; Sijikumar, S.; Prijith, S.S.; Aloysius, M. Atmospheric Surface-Layer Response to the Annular Solar Eclipse of 15 January 2010 over Thiruvananthapuram, India. Bound. Layer Meteorol. 2011, 141, 325–332. [Google Scholar] [CrossRef]
- Subrahamanyam, D.B.; Anurose, T.J.; Mohan, M.; Santosh, M.; Kumar, N.V.P.K.; Sijikumar, S. Impact of Annular Solar Eclipse of 15 January 2010 on the Atmospheric Boundary Layer Characteristics Over Thumba: A Case Study. Pure Appl. Geophys. 2011, 169, 741–753. [Google Scholar] [CrossRef]
- Vyas, B.; Saxena, A.; Panwar, C. Study of atmospheric air pollutants during the partial solar eclipse on 15 January 2010 over Udaipur: A semi-arid location in Western India. Adv. Space Res. 2012, 50, 1553–1563. [Google Scholar] [CrossRef]
- Burt, S. Meteorological responses in the atmospheric boundary layer over southern England to the deep partial eclipse of 20 March 2015. Philos. Trans. R. Soc. A Lond. 2016, 374, 2077. [Google Scholar] [CrossRef]
- Kastendeuch, P.P.; Najjar, G.; Colin, J.; Luhahe, R.; Bruckmann, F. Effects of the 20 March 2015 solar eclipse in Strasbourg, France. Weather 2016, 71, 55–62. [Google Scholar] [CrossRef]
- Nezval, O.; Pavelka, M. Microclimate changes in a spruce stand and meadow ecosystem during a solar eclipse in the Czech Republic. Weather 2017, 72, 67–72. [Google Scholar] [CrossRef]
- Romano, S.; Lo Feudo, T.; Calidonna, C.R.; Burlizzi, P.; Perrone, M.R. Solar eclipse of 20 March 2015 and impacts on irra-diance, meteorological parameters, and aerosol properties over southern Italy. Atmos. Res. 2017, 198, 11–21. [Google Scholar] [CrossRef]
- Harrison, R.G.; Hanna, E. Theme issue: Atmospheric effects of solar eclipses stimulated by the 2015 UK eclipse. Philos. Trans. R. Soc. A Math. Phys. Eng. Sci. 2016, 374, 262. [Google Scholar]
- Paramitha, B.; Zaen, R.; Nandiyanto, A.B.D. Changes in Meteorological Parameters (i.e., UV and Solar Radiation, Air Temperature, Humidity and Wind Condition) during the Partial Solar Eclipse of 9 March 2016. IOP Conf. Ser. Mater. Sci. Eng. 2017, 180, 012131. [Google Scholar] [CrossRef]
- Ojobo, E.; Okoh, D.; Okeya, D.; Yusuf, N.; Adukwu, G. The response of meteorological parameters to the September 1 2016 solar eclipse as observed in Anyigba, Nigeria. J. Space Sci. Technol. 2017, 6, 16–24. [Google Scholar]
- Lee, T.R.; Buban, M.; Palecki, M.A.; Leeper, R.D.; Diamond, H.J.; Dumas, E.; Meyers, T.P.; Baker, C.B. Great American Eclipse Data May Fine-Tune Weather Forecasts. Eos 2018, 99, 19–22. [Google Scholar] [CrossRef]
- Turner, D.D.; Wulfmeyer, V.; Behrendt, A.; Bonin, T.A.; Choukulkar, A.; Newsom, R.K.; Brewer, W.A.; Cook, D.R. Re-sponse of the land-atmosphere system over north- central Oklahoma during the 2017 eclipse. Geophys. Res. Lett. 2018, 45, 1668–1675. [Google Scholar] [CrossRef]
- Wang, W.; Dang, T.; Lei, J.; Zhang, S.; Zhang, B.; Burns, A. Physical Processes Driving the Response of the F2 Region Ionosphere to the 21 August 2017 Solar Eclipse at Millstone Hill. J. Geophys. Res. Space Phys. 2019, 124, 2978–2991. [Google Scholar] [CrossRef]
- Zhang, K.; Wang, H. The Great Reduction of Equatorial Electrojet During the Solar Eclipse on 14 December 2020. Space Weather 2022, 20, e2022SW003295. [Google Scholar] [CrossRef]
- Schove, D.J.; Fletcher, A. Chronology of Eclipses and Comets AD 1~1000; The Boydell Press: Martlesham, UK, 1987; p. 356. [Google Scholar]
- Finegan, J. Handbook of Biblical Chronology; Hendrickson Publishers: Peabody, MA, USA, 1998; p. 426. [Google Scholar]
- Khalisi, E. The solar eclipses of the pharaoh Akhenaten. arXiv 2020, arXiv:2004.12952. [Google Scholar]
- Kudlek, M.; Mickler, E.M. Solar and Lunar Eclipses of the Ancient Near East from 3000 B.C. to 0 with Maps; Alter Orient und Altes Testament. Sonderreihe, Bd. 1; Butzon & Bercker: Neukirchen-Vluyn, Germany, 1971; p. 199, Neukirchener Verlag d. Erziehungsvereins. [Google Scholar]
- Stephenson, F.R. Astronomical Verification and Dating of old Testament Passages Referring to Solar Eclipses. Palest. Explor. Q. 1975, 107, 107–120. [Google Scholar] [CrossRef]
- Ben-Menahem, A. Cross-dating of biblical history via singular astronomical and geophysical events over the ancient Near East. Q. J. R. Astron. Soc. 1992, 33, 175–190. [Google Scholar]
- Said, S.S.; Stephenson, F.R. Accuracy of Eclipse Observations Recorded in Medieval Arabic Chronicles. J. Hist. Astron. 1991, 22, 297–310. [Google Scholar] [CrossRef]
- Espenak, F. Fifty Year Canon of Solar Eclipses: 1986–2035; NASA Reference Publication 1178 Revised; NASA: Washington, DC, USA, 1987; p. 278. [Google Scholar]
- Hassan, A.H.; Rahoma, U.A.; Sabry, M.; Fathy, A.M. Color Portion of Solar Radiation in the Partial Annular Solar Eclipse, October 3rd, 2005, at Helwan, Egypt. Acta Polytech. 2010, 50, 32–40. [Google Scholar] [CrossRef] [PubMed]
- Möllman, K.-P.; Vollmer, M. Measurements and predictions of the illuminance during a solar eclipse. Eur. J. Phys. 2006, 27, 1299–1314. [Google Scholar] [CrossRef]
- Stoev, A.; Stoeva, P.; Kuzin, S. Total solar eclipses and atmospheric boundary layer response. Sun Geosph. 2012, 7, 103–107. [Google Scholar]
- Nawar, S.; Morcos, A.B.; Mikhail, J.S. Photoelectric study of the sky brightness along Sun’s meridian during the March, 2006 solar eclipse. New Astron. 2007, 12, 562–568. [Google Scholar] [CrossRef]
- Nymphas, E.; Adeniyi, M.; Ayoola, M.; Oladiran, E. Micrometeorological measurements in Nigeria during the total solar eclipse of 29 March, 2006. J. Atmos. Sol. Terr. Phys. 2009, 71, 1245–1253. [Google Scholar] [CrossRef]
- Khalil, S.A.; Hassan, A.H.; Rahoma, U.A.; Abulwfa, A.; Khamees, A.S. Performance of incoming solar radiation components in partial annular solar Eclipse on June 21st, 2020 in Helwan, Egypt. Open J. Appl. Sci. 2021, 11, 294–311. [Google Scholar]
- Patel, K.; Singh, A.K. Changes in atmospheric parameters due to annular solar eclipse of June 21, 2020, over India. Indian J. Phys. 2021, 96, 1613–1624. [Google Scholar] [CrossRef]
- Pasachoff, J.M.; Peñaloza-Murillo, M.A.; Carter, A.L.; Roman, M.T. Terrestrial atmospheric responses on Svalbard to the 20 March 2015 Arctic total solar eclipse under extreme conditions. Philos. Trans. R. Soc. A 2016, 374, 20160188. [Google Scholar] [CrossRef] [PubMed]
- Maturilli, M.; Ritter, C. Surface radiation during the total solar eclipse over Ny-Ålesund, Svalbard, on 20 March 2015. Earth Syst. Sci. Data 2016, 8, 159–164. [Google Scholar] [CrossRef]
- Klekociuk, A. Ice and fire: A total solar eclipse over Antarctica. Aust. Antarct. Mag. 2004, 6, 33–34. [Google Scholar]
- Peñaloza-Murillo, M.A.; Pasachoff, J.M. Cloudiness and Solar Radiation During the Longest Total Solar Eclipse of the 21st Century at Tianhuangping (Zhejiang), China. J. Geophys. Res. Atmos. 2018, 123, 13443–13461. [Google Scholar] [CrossRef]
- Peñaloza-Murillo, M.A.; Roman, M.T.; Pasachoff, J.M.; Elmhamdi, A. An empirical study of near-surface air temperature time lags and delay function during the longest total solar eclipse of the 21st century at Tianhuangping (Zhejiang), China, under cloudy conditions. Meteorol. Z. 2022, 31, 243–261. [Google Scholar] [CrossRef]


| Annular Solar Eclipse | Partial Solar Eclipse | |
|---|---|---|
| Date | 26 December 2019 (D) | 21 June 2020 (J) |
| Observing site and location | Site: Al-Hofuf City (Four Mountains Camp) | Site: Riyadh City |
| Location: 25°17′ N, 49°42′ E | Location: 24°44′ N, 46°37′ E | |
| Start of partial eclipse [1st contact (1CD)]: 5 h 32 min | ||
| Timing sequence (Local time: UT + h) | Sunrise (partial eclipse in progress): 06 h 28 min | Sunrise at: 05 h 05 min |
| Annular eclipse starts [2nd contact (2CD)] at: 06 h 34 min | Start of partial eclipse [1st contact (1CJ): 07 h 10 min | |
| Maximum annular eclipse: 06 h 36 min | Maximum eclipse at: 08 h 23 min | |
| End of annular phase [3rd contact (3CD)]: 06 h 37 min End of partial eclipse [4th contact (4CD)]: 07 h 48 min | End of partial eclipse [4th contact (4CJ)]: 09 h 49 min | |
| Duration | ~2 h 16 min (total) | ~2 h 39 min (penumbral duration) |
| 2 min 59.2 s (with lunar limb corrected; annular phase) | ||
| [Moon/Sun] size ratio (at the eclipse maximum) | ~0.956 | ~0.988 |
| Obscuration (%) | ~91.53 | ~72.80 |
| Al-Hofuf (Al-Ahsa) | Riyadh | |
|---|---|---|
| Station name/Number | Al-Ahsa/40420 | Riyadh Old/40438 |
| Month | December | June |
| Record high (°C) | 32.5 | 47.2 |
| Average high (C) | 23.4 | 42.5 |
| Daily mean (°C) | 16.6 | 35.7 |
| Average low (C) | 10.5 | 28.0 |
| Record low (C) | 0.8 | 21.1 |
| Average rainfall (mm) | 21.1 | 0.0 |
| Average RH (%) | 56 | 11 |
| Average rainy days | - | 0 |
| Mean monthly sunshine | - | 328.2 |
| Percent possible sunshine | - | 80 |
| Serie and Type | XR5-8-A-SE (8 analog inputs with 12-bit resolution) |
| Manufacture | Pace Scientific |
| Observing locations | Al-Hofuf: horizontal level Riyadh: 6 m above ground level |
| Cadence | Al-Hofuf: 10 s Riyadh: 1 min for eclipse day and 10 min for the pre-eclipse day |
| Accuracy of the measurements | ±2% for RH 0.15 °C for T at 25 °C |
| Date | Type | Path over Land | Quantities Measured | Observation Site/Region | References |
|---|---|---|---|---|---|
| 9 May 1948 | T | Japan | VP a,b VP c, RH | Mt. Huzi Multiple sites | Huzimura, 1949 [44] Ushiyama et al., 1949 [58] |
| 25 February 1952 | T | Near East | VP d, RH | Israel (Eilath) | Klein and Robinson, 1955 [9] |
| 30 June 1954 | T | Scandinavia | RH AH | Southern Sweden Southern Norway | Kullenberg [83] Paulsen, 1955 [84] |
| 7 March 1961 | T | Balcans | VP a, RH | Yugoslavia (Golia Mountain) | Anić, 1970 [85] |
| 20 July 1963 | T | North America | RH | U.S.A. (Davis, California) | Pruitt et al., 1965 [86] |
| 10 July 1972 | T | North America | VP c | Canada (Hudson Bay) | Stewart and Rouse, 1974 [87] |
| 29 April 1976 | A | Greece | RH | Athens | Katsoulis, 1976 [88] |
| 16 February | T | India | RH | Raichur | Babu and Sastry, |
| 1980 | 1982 [89] | ||||
| RH | Multiple sites | Mohanakumar and Devanarayanam, 1982 [90] | |||
| RH | Bombay | Kotrappa et al., 1981 [91] | |||
| 30 May 1984 | A | North America Germany | E, RH RH | U.S.A. (Kentucky) Multiple sites | Trapasso and Kinkel, 1984 [13] Knöfel, 1986 [82] |
| 11 July | T | Costa Rica | RH | Filadelfia | Castro et al., 1993 [92] |
| 1991 | |||||
| Mexico | VP c, RH | Baja California | Bernard et al., 1992 [93] | ||
| RH | Nuclear Center | Gaso et al., 1994 [94] | |||
| North | VP c | U.S.A. | Mauder et al., 2007 [95] | ||
| America | (Central California) | ||||
| 3 November 1994 | T | South America | RH | Paraguay (Coronel Oviedo) | Hidalgo et al., 1996 [96] |
| 24 October | T | RH | Robertsgunj | Arulraj et al., 1998 [97] | |
| 1995 | |||||
| RH | Roorkee | Bansal and Verma, 1998 [98] | |||
| TWC | Delhi | Bose et al. 1997 [14] | |||
| RH | Robertsgunj | Dani and Devara, 2002 [99] | |||
| India | TWC | Delhi | Ghosh et al., 1997 [100] | ||
| RH | Neem KaThana | Gonzalez, 1997 [15] | |||
| TWC, RH | Neem Ka Thana | Jain et al., 1997 [16] | |||
| RH RH RH | Visakhapatnam Trombay Roorkee | Niranjan and Thulasiraman, 1998 [101] Sapra et al., 1997 [102] Singh et al., 1999 [103] | |||
| 26 February 1998 | T | Northern South America | RH | Venezuela (Paraguaná Peninsula) | Peñaloza- Murillo, 2002 [104], 2003 [105] |
| 11 August | T | Europe | RH | Germany | Ahrens et al., 2001 [18] |
| 1999 | (south-west) | ||||
| RH | Yugoslavia | Božić et al., 2002 [106] | |||
| (Kelebija) | |||||
| AH, RH | France | Crochard and Renaut, 1999 [107] | |||
| (Beauvais) | |||||
| VP a | Germany | Foken et al., 2001 [108] | |||
| (southern) | |||||
| VP a | Germany | Häberle et al., 2001 [109] | |||
| (Kranzberg) | |||||
| RH | Yugoslavia | Kolarž et al., 2005 [17] | |||
| (Belgrade) | |||||
| RH | Bulgaria | Kolev et al., 2005 [110] | |||
| (different sites) | |||||
| RH | U.K. | Perkins, 2000 [111] | |||
| (Anglesey) | |||||
| RH | Germany | Prenosil, 2000 [112] | |||
| (southern/northern) | |||||
| RH | Romania/Bulgaria | Simeonov et al., 2002 [113] | |||
| (Bucharest, | |||||
| Constanta and Sofía) | |||||
| RH | Bulgaria | Stoev et al., 2000 [114] | |||
| (multiple sites) | |||||
| RH | Bulgaria | Tzenkova et al., 2002 [115] | |||
| (Shabla) | |||||
| Africa | RH | Egypt | Rahoma et al., 1999 [11] | ||
| (Helwan) | |||||
| Asia | RH | India | Krishnan et al., 2004 [116] | ||
| (Ahmedabad) |
| Date | Type | Path over Land | Quantities Measured | Observation Region | References |
|---|---|---|---|---|---|
| 21 June 2001 | T | Southern Africa and Madagascar | RH | Zambia | Imbres, 2001 [117] |
| 3 October 2005 | A | Spain and Africa | RH | Saudi Arabia (Makkah) | Anbar, 2006 [118] |
| 26 March | T | RH | Lybia | Hassan and Rahoma, 2010 [119] | |
| 2006 | |||||
| RH | Greece | Amiridis et al., 2007 [120] | |||
| RH | “ | Tzanis et al., 2008 [121] | |||
| Africa, Near | |||||
| East | RH | “ | Amiridis et al., 2007 [120] | ||
| VPb, RH | Turkey | Pleijel, 2008 [20] | |||
| RH | “ | Stoev et al., 2008 [122] | |||
| RH | “ | Uddin et al., 2007 [123] | |||
| 1 August 2008 | T | Artic Canada, northern Greenland, northern Svalbard, Novaya Zemlya and Siberia | RH TWC | Norway (Svalbard) Russia (Novosibirsk) | Sjöblom, 2010 [124] Kadygrov et al., 2013 [21] |
| 22 July 2009 | T | RH | South Korea | Chung et al., 2010 [125] | |
| RH | “ | Jeon, 2011 [126] | |||
| RH | China | Chen et al., 2011 [127] | |||
| RH | “ | Lu et al., 2011 [128] | |||
| RH | “ | Pintér et al., 2010 [129] | |||
| Asia | |||||
| RH | “ | Stoeva et al., 2009 [130] | |||
| RH | “ | Zainuddin et al., 2013 [131] | |||
| RH | India | Rao et al., 2013 [132] | |||
| RH | “ | Kumar, 2014 [133] | |||
| 15 January 2010 | A | Asia | RH q, RH RH | India “ “ | Babu et al., 2011 [134] Bhat and Jagannathan, 2012 [23] Manchanda et al., 2012 [135] |
| Muraleedharan et al., 2011 [22] | |||||
| RH | “ | ||||
| RH | “ | Subrahamanyam et al., 2011 [136] | |||
| RH | “ | Subrahamanyam and Anurose, 2011 [137] | |||
| RH | “ | Subrahamanyam et al., 2011 [138] | |||
| TWVC | “ | Vyas et al., 2012 [139] | |||
| 20 March 2015 | T | Greenland, Iceland, Ireland, UK, Faroe Islands, northern Norway | DP, RH RH RH RH | U.K. France Czech Republic Italy (southern) | Burt, 2016 [140] Kastendeuch et al., 2016 [141] Nezval and Pavelka, 2017 Romano et al., 2017 [142,143] Harrison et al., 2016 [144] |
| 9 March | T | South- | RH | Indonesia | Paramitha et al., 2017 [145] |
| 2016 | eastern | ||||
| Pacific | |||||
| Ocean | |||||
| archipelagos | |||||
| 1 September 2016 | A | Africa, Madagascar and Reunion | RH | Nigeria | Ojobo et al., 2017 [146] |
| 21 August | T | DP, q, w | Tennessee | Buban et al., 2019 [25] | |
| 2017 | |||||
| RH | Oregon, | Burt, 2018 [54] | |||
| Wyoming, | |||||
| Nebraska, | |||||
| U.S.A. | Tennessee and | ||||
| South | |||||
| Carolina | |||||
| RH | Multiple sites | Lee et al., 2018 [147] | |||
| RH, ρwv | Kentucky | Mahmood et al., 2020 [24] | |||
| w | Oklahoma | Turner et al., 2018 [148] | |||
| U.S.A. | F2 region Ionosphere | Millstone Hill | Wang et al., 2019 [149] (refer to Zhang and Wang, 2022 [150] too, for the Eclipse influence on the variability of the ionosphere) |
| Eclipse Date, Site, Occultation, Duration and Reference | Contacts (C) (Local Time) [h:min:s] | Temperature (at Time) [°C] or Temperature Change | RH (at Time) [%] | VP (at Time) [hPa] |
|---|---|---|---|---|
| 25 February 1952 | 1C/10:17:06 | ~18.3 (1C) --- ~17.4 (Max) --- ~19.1 (4C) | ~ 47.8 (1C) --- ~ 46.7 (Max) --- ~ 48.9 (4C) | ~ 9.4 (1C) --- ~9.9 (Max) --- ~9.2 (4C) |
| Eilath, Israel | --- | |||
| (29°33′4 N, 35°56′9 E, 63 m asl) | Max/11:39:10 | |||
| Partial: 75.30% | --- | |||
| 2 h 42 min 48 s | 4C/12:59:54 | |||
| Klein and Robinson (1955) [9] | ||||
| 25 February 1952 | 1C/10:22:03 | ~15.8 (1C) --- ~15.3 (Max) --- ~16.8 (4C) | ||
| Tel Aviv, Israel | --- | |||
| (32°4′.85 N, 34°46′.8 E, 15 m asl) | Max/11:42:20 | - | - | |
| Partial: 69.19% | --- | |||
| 2 h 39 min 11 s | 4C/13:01:14 | |||
| Klein and Robinson (1955) [9] | ||||
| 29 March 2006 | [via Equation (1)] | |||
| Tobruq, Lybia | 1C/11:19:24 | |||
| (32°05′ N, 23°59′ E, 30 m asl) | --- | 19.5 (1C) | 62 (1C) | 14.04 (1C) |
| Partial: 99.98% | Max/12:39:01 | 18.0 (Max) | 82 (Max) | 16.91 (Max) |
| 2 h 39 min 24 s | --- | 21.0 (4C) | 78 (4C) | 19.38 (4C) |
| Hassan and Rahoma (2010) [119] | 4C/13:58:48 | |||
| 10 May 1994 Tularosa Basin, NM, USA. | 1C/08:46:41 --- 2C/10:10:51 | “the near-surface air was stable, form the surface to 20 m AGL, for about 45 min | ||
| (32°24′ N, 106°21′ W, 1220 m asl) Annular: 86.65% 3 h 08 min 19 s Eaton et al. (1997) [75] | --- 3C/10:15:13 --- 4C/11:55:00 | centered around the time of maximum eclipse. Air temperature at the 4 m level decreased about 3 °C during the eclipse…” | - | - |
| 30 June 1973 | 1C/09:28:17 | The following absolute anomalies (Tmax- Tmin) were found by the authors: “The temperature changes were 3.5 °C at 0.3 m and 2.5 °C at 6.75 m and 13.5 m above the surface”. | ||
| Chinguetti, Mauritania | --- | |||
| (20°26′.4 N, 12°15′.7 W, 453 m asl) | 2C/10:45:41 | |||
| Total: 100% | --- | - | - | |
| 2 h 50 min 16 s | 3C/10:51:58 | |||
| Anderson and Keefer (1975) [10] | --- | |||
| 4C/12:18:33 | ||||
| 30 August 1905 | 1C/12:21:45 | |||
| Constantine, Algeria | --- | 32.6 (13:05) | 20 (13:05) | 9.83 (13:05) |
| (36°21′.9 N, 6°36′.87 E, 574 m asl) | 2C/13:42:17 | 29.4 (14:12) | 19 (14:12) | 7.78 (14:12) |
| total: 100% | --- | 28.4 (14:29) | 43 (14:29) | 16.62 (14:29) |
| 2 h 37 min 23 s | 3C/13:45:27 | 30.2 (14:53) | 30 (14:53) | 12.87 (14:53) |
| Jaubert (1906) [8] | --- | |||
| 4C/14:59:08 | ||||
| 11 August 1999 | [via Equation (1)] | |||
| Helwan, Egypt | 1C/13:10:44.6 | 37.2 (1C) | 18 (1C) | 11.42 (1C) |
| 29°50′.99 N, 31°21′.0 W, 28 m asl | --- | --- | --- | --- |
| Partial: 62.33% | Max/14:38:27.8 | 35.9 (Max) | 21 (Max) | 12.41 (Max) |
| 2 h 46 min 41 s | --- | --- | --- | --- |
| Hassan et al. (1999) [12] | 4C/15:57:26.2 | 37.5 (4C) | 18 (4C) | 11.61 (4C) |
| 3 October 2005 | 1C/11:58:56 | ~40.10 (3.5 m agl) ~38.76 (5.5 m agl) --- ~40.25 (3.5 m agl) ~39.90 (5.5 m agl) --- ~39.5 (3.5 m agl) ~38.5 (5.5 m agl) | ~63.8 (11:59.0) --- ~55.7 (12:51.4) --- ~66.1 (15:05.4) | [via Equation (1)] ~47.3 (3.5 m agl) ~44.0 (5.5 m agl) --- ~41.6 (3.5 m agl) ~40.9 (5.5 m agl) --- ~46.2 (3.5 m agl) ~45.0 (5.5 m agl) |
| Makkah, Hada Al-Sham | --- | |||
| Saudi Arabia | ||||
| (21°48′.1 N, 39°43′.7 E, 245 m asl) | Max/13:34:17 | |||
| Partial: 50.33% | --- | |||
| 3 h 06 min 28 s | ||||
| Anbar (2006) [118] | 4C/15:05:24 |
| Eclipse Date, Site, Occultation, Duration and Reference | Contacts (C) (Local Time) [h:min:s] | Temperature Change or Temperature (at Time) [°C] | RH (at Time) [%] | VP (at Time) [hPa] |
|---|---|---|---|---|
| 1C/06:31:14.7 | “Consequently, LST signal from the eclipse is not evident at location #1, even though it may still be present…” | |||
| 26 December 2019 | --- | |||
| Station #1 | 2C/07:35:06.7 | |||
| United Arab Emirates | --- | - | - | |
| 23°30′ N, 53°30′ E, ~100 m asl | Mid/07:36:36.7 | |||
| Annular: 91.738% | --- | |||
| Nelli et al., 2020a [7] | 3C/07:38:06.7 --- | |||
| 4C/08:51:55.8 | ||||
| 1C/06:30:21.8 | ||||
| 26 December 2019 | --- | “At station #2, the largest temperature difference was about 6 °C and it occurred just after the ASE…” | ||
| Station #2, Oman | 2C/07:36:16.1 | |||
| 21°30′ N, 57°00′ E, ~100 m asl | --- | - | - | |
| Annular: 91.947% | Mid/07:37:36.6 | |||
| Nelli et al., 2020a [7] | --- 3C/07:38:57.0 | |||
| --- | ||||
| 4C/08:55:49.4 | ||||
| “After the sunrise at ~03 UTC, the surface gradually warmed up to 14.7 °C, but then it cooled down to 13.4 °C just before 04 UTC…” | ||||
| 26 December 2019 | 1C/06:31:28.9 | |||
| MWR (location is close to Abu | --- | |||
| Dhabi International airport) | Mid/07:37:23.6 | - | - | |
| United Arab Emirates | --- | |||
| 24°26′11″ N, 53°36′43″ E, ~0 m asl | 4 C/08:53:25.6 | |||
| Partial: 90.79% | ||||
| Nelli et al., 2020a [7] | ||||
| 26 December 2019 Al-Hofuf, Saudi Arabia (this work, see Table 1) | See Table 1 | [via Equation (1)] | ||
| 9.4 (sunrise) | 96.55 (sunrise) | 11.38 (sunrise) | ||
| 9.4 (2CD) | 96.63 (2CD) | 11.39 (2CD) | ||
| 9.4 (3CD) | 96.55 (3CD) | 11.38 (3CD) | ||
| 11.1 (4CD) | 95.37 (4CD) | 12.55 (4CD) | ||
| 21 June 2020 Riyadh, Saudi Arabia (this work, see Table 1) | See Table 1 | [via Equation (1)] | ||
| 33.42 (1CJ) 35.93 (07:39:36) 32.71 (08:39:36) | 19.79 (1CJ) 17.63 (07:39:36) 17.20 (08:39:36) | 10.19 (1CJ) 10.43 (07:39:36) 8.51 (08:39:36) | ||
| 37.94 (4CJ) | 14.95 (4CJ) | 9.87 (4CJ) |
Disclaimer/Publisher’s Note: The statements, opinions and data contained in all publications are solely those of the individual author(s) and contributor(s) and not of MDPI and/or the editor(s). MDPI and/or the editor(s) disclaim responsibility for any injury to people or property resulting from any ideas, methods, instructions or products referred to in the content. |
© 2024 by the authors. Licensee MDPI, Basel, Switzerland. This article is an open access article distributed under the terms and conditions of the Creative Commons Attribution (CC BY) license (https://creativecommons.org/licenses/by/4.0/).
Share and Cite
Elmhamdi, A.; Roman, M.T.; Peñaloza-Murillo, M.A.; Pasachoff, J.M.; Liu, Y.; Al-Mostafa, Z.A.; Maghrabi, A.H.; Oloketuyi, J.; Al-Trabulsy, H.A. Impact of the Eclipsed Sun on Terrestrial Atmospheric Parameters in Desert Locations: A Comprehensive Overview and Two Events Case Study in Saudi Arabia. Atmosphere 2024, 15, 62. https://doi.org/10.3390/atmos15010062
Elmhamdi A, Roman MT, Peñaloza-Murillo MA, Pasachoff JM, Liu Y, Al-Mostafa ZA, Maghrabi AH, Oloketuyi J, Al-Trabulsy HA. Impact of the Eclipsed Sun on Terrestrial Atmospheric Parameters in Desert Locations: A Comprehensive Overview and Two Events Case Study in Saudi Arabia. Atmosphere. 2024; 15(1):62. https://doi.org/10.3390/atmos15010062
Chicago/Turabian StyleElmhamdi, Abouazza, Michael T. Roman, Marcos A. Peñaloza-Murillo, Jay M. Pasachoff, Yu Liu, Z. A. Al-Mostafa, A. H. Maghrabi, Jacob Oloketuyi, and H. A. Al-Trabulsy. 2024. "Impact of the Eclipsed Sun on Terrestrial Atmospheric Parameters in Desert Locations: A Comprehensive Overview and Two Events Case Study in Saudi Arabia" Atmosphere 15, no. 1: 62. https://doi.org/10.3390/atmos15010062
APA StyleElmhamdi, A., Roman, M. T., Peñaloza-Murillo, M. A., Pasachoff, J. M., Liu, Y., Al-Mostafa, Z. A., Maghrabi, A. H., Oloketuyi, J., & Al-Trabulsy, H. A. (2024). Impact of the Eclipsed Sun on Terrestrial Atmospheric Parameters in Desert Locations: A Comprehensive Overview and Two Events Case Study in Saudi Arabia. Atmosphere, 15(1), 62. https://doi.org/10.3390/atmos15010062