Abstract
Wind erosion is one of the major meteorological hazards in Ningxia, and climate change has caused changes in wind erosion–climatic erosion activity in recent years. This study uses the wind erosion climate factor (C) proposed by the Food and Agriculture Organization of the United Nations to assess the impact of climate change on wind erosion–climate erosion, and the results show that (1) the distribution of wind erosion degree in Ningxia region is central > northern > southern. Seasonally, it is higher in spring and winter, and lower in summer and autumn. (2) Climate change has more influence on spring, autumn and winter, and less influence on summer. (3) The center of gravity is mainly located at the junction of central and northern Ningxia, and the center of gravity migrates through four migration stages—northeast–southwest–northeast–southwest—on the annual scale, and four migration stages—northwest–northeast–southeast—on the seasonal and monthly scales. The migration rate in the cold season is greater than that in the warm season. (4) The wind erosion climate factor index is influenced by sunshine hours, average temperature, average humidity, average wind speed and total precipitation, and the degree of influence has spatial and temporal variability, among which the wind erosion climate factor index is the most sensitive to the influence of average wind speed. (5) The wind erosion climate factor indices are positively correlated with NAO, AO, PDO and SOI indices, and negatively correlated with MEI and ENSO indices, and there are resonance cycles of different time scales.
1. Introduction
The wind erosion climate factor index is an analytical index constructed after the integrated parameterization of precipitation, evaporation (calculated by Penman-Monteith formula, which requires parameters such as temperature, humidity, wind speed, barometric pressure, sunshine hours and altitude) and other influencing factors to characterize the potential level of wind erosion under the combined influence of a series of climatic conditions [1]. The wind erosion climate factor index was first proposed by Chepil [2], but this formula has some limitations for arid and semi-arid regions [3]. The FAO of the United Nations subsequently proposed a new wind erosion climate factor index with an improved calculation formula, which is now widely used [4].
In recent years, the international community has paid increasing attention to wind erosion disasters [5], and the impact of climate change on desertification has been directly or indirectly addressed in successive IPCC assessment reports [6]. China is a country more seriously affected by wind erosion, which occurs mainly in the arid and semi-arid regions of China, and the occurrence of wind erosion carries away fertile soil from the surface layer of agricultural land, thus causing land degradation [7]. The total land area affected by wind erosion in China is estimated to be 165.59 × 10⁴ km, accounting for 17.24% of the national land area [8]. Therefore, the study of wind erosion patterns and driving factors is of guiding significance for agricultural production and desert management in China.
In northern China, wind erosion is one of the major types of soil erosion. Rainfall is the main natural driver of soil water erosion, while wind speed is the primary factor affecting soil wind erosion and precipitation and temperature also have important effects on wind erosion [9,10]. Changes in the wind erosion climate factor index are the result of the combined effect of precipitation, evapotranspiration, drought and ENSO under the positive dominance of wind [11,12]. Wind erosion is also influenced by global climate change, and the large-scale circulation index is an extremely prominent signal of climate change [13]. The atmospheric circulation index is significantly periodic, persistent and predictable [14,15,16,17], while the atmospheric circulation has a strong influence on wind speed, temperature, humidity, sunshine duration and climate change [18,19,20,21]. The relationship between the atmospheric circulation and the environment (e.g., ocean, land surface, soil, sea ice and snow) causes persistent surface anomalies that may affect the atmosphere through surface feedback mechanisms, resulting in an atmospheric response that lags several months from the initial forcing [22]. Therefore, exploring the response of wind erosion climate factor indices to atmospheric circulation changes is of great significance for the prediction and prevention of wind erosion.
The Ningxia Autonomous Region is the junction of Loess Plateau and Inner Mongolia Plateau and is an important commercial grain base in Northwest China, as well as a region that is more seriously affected by wind erosion. This paper analyzes the distribution patterns and trends of wind erosion in Ningxia region using the FAO (Food and Agriculture Organization of the United Nations) wind erosion climate factor index, further reveals the driving factors of wind erosion climate erosion, analyzes the main driving factors of wind erosion climate erosion area, which provides a reference basis for further research on wind and sand control in the Ningxia Autonomous Region and provides some background support for the research on environmental protection and ecological security construction in the Ningxia Autonomous Region.
2. Materials and Methods
2.1. Study Area
As shown in Figure 1, Ningxia is located in the middle and upper reaches of the Yellow River in northwestern China, between latitude 35°14′ N–39°23′ N and longitude 104°17′ E–107°39′ E. The terrain is high in the south and low in the north and is divided into three major zones from north to south: the northern yellow-intake irrigation zone (Shichuanjing, Huinong, Shizuishan, Pingluo, Taole, Helan, Yinchuan, Qingtongxia, Lingwu, Wuzhong, Zhongning and Zhongwei), central arid zone (Yanchi, Mahuangshan, Weizhou, Haiyuan and Xingrenbao), and southern mountainous zone (Xiji, Guyuan, Lunde and Jinyuan). Ningxia is located in the Yellow River water system and has a temperate continental arid and semi-arid climate.
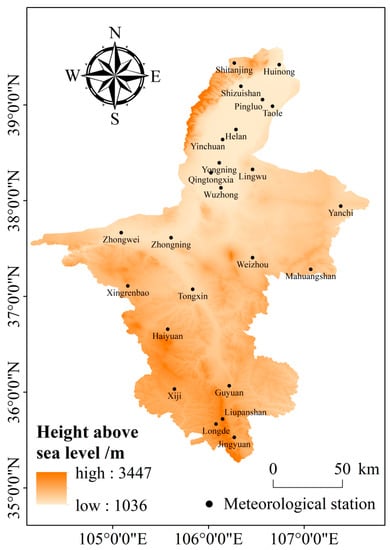
Figure 1.
Distribution of meteorological stations in the Ningxia Autonomous Region.
2.2. Sources of Information
The meteorological data of Ningxia were selected from the National Meteorological Center of the China Meteorological Administration, and the meteorological data were selected day by day from 1982 to 2020. Six meteorological factors were selected from 23 meteorological stations in Ningxia, namely maximum temperature, minimum temperature, wind speed, sunshine hours, relative humidity and precipitation. Atmospheric circulation data were selected from between 1982 and 2020 from the NAO (North Atlantic oscillation), AO (Arctic oscillation), ENSO index using the NINO3.4 index, MEI index (i.e., the calculation of six parameters: SST, meridional wind, latitudinal wind, sea level pressure, temperature near sea level and sky cloudiness obtained by parameters), PDO (Pacific decadal oscillation index) and SOI (southern oscillation index).
2.3. Research Methodology
2.3.1. Wind Erosion Climate Factor Index (C)
In this paper, different time-scales of C are used for analysis according to seasons defined as spring (March–May), summer (June–August), autumn (September–November), and winter (December–February) using the Penman–Monteith Equation (ET0) to calculate the wind erosion climate factor index.
Here, the unit of C is the wind erosion climate factor index. ET0 is expressed in mm/d. Δ is the slope value of the relationship between saturated water vapor pressure and temperature (kPa/°C); Rn represents the net radiation from the ground (MJ/m2); G represents the soil heat flux (MJ/(m2·d)), which is so small as to be negligible; γ represents the hygrometer constant (kPa/°C); T represents the daily average temperature (°C); U2 represents the wind speed at a height of 2 m (m/s); Uz represents the wind speed (m/s) at zm height, which is mostly 10 m above the ground in weather forecasts; es represents the saturated vapor pressure (kPa); and ea represents the actual water vapor pressure (kPa/°C).
2.3.2. Analysis of the Degree of Wind Erosion
Wind erosion is classified into different wind-erosion classes according to the wind erosion climate factor index, as shown in Table 1.

Table 1.
Wind erosion grade classification criteria based on wind erosion climate factor index.
2.3.3. Mann–Kendall Trend Test Method
The Mann–Kendall trend test is a method recommended by the World Meteorological Organization for time series analysis. In this paper, MK analysis is performed using MATLAB, where a positive UF value represents an upward trend of the series and a negative value of UF represents a downward trend.
2.3.4. Inverse Distance Weight Interpolation
The inverse distance weight interpolation method (IDW) is a simple interpolation method based on Tobler’s theorem. In this paper, IDW interpolation is used to derive the raster data when analyzing the spatial variation, and the formula is
where Z0 is the estimated value of point 0; Zi is the Z value of control point i; di is the distance between control point i and point 0; n is the number of control points; and r is the specified power.
2.3.5. Center of Gravity Migration Model
The center of gravity is derived by invoking the principle of the center of gravity of population distribution common in population geography, and the formula for calculating the center of gravity is provided in the References section [20].
2.3.6. Spatiotemporal Geographically Weighted Regression (GTWR) Model
The spatiotemporal geographically weighted regression (GTWR) model can effectively deal with spatiotemporal nonstationarity by introducing a temporal dimension based on spatial heterogeneity, and the basic formula is as follows:
where (μi,νi) denotes the latitude and longitude coordinates of the ith sample point, ti denotes the observation time, Yi denotes the value of the dependent variable at the ith sample point, and Xik denotes the k explanatory variable at the ith sample point. The model error term, β0(μi,νi,ti), represents the regression constant of the ith sample point, and βk(μi,νi,ti) represents the regression coefficient of the k explanatory variable of the ith sample point.
Here, β0(μi,νi,ti) is the estimated value of βk(μi,νi,ti); X is the matrix of independent variables; XT is the transpose of matrix X; Y is the matrix of the indicators of carbon reduction intensity of the Yangtze River Delta urban agglomeration in time scale; and W(μi,νi,ti) is the matrix of spatiotemporal weights. The Gaussian distance function is chosen to obtain the spatiotemporal weight matrix using the bi-square spatial weight function, and the spatiotemporal distance dij between sample i and sample j is shown in the following equation:
where δ is the bandwidth. The implementation of the GTWR model of pollution reduction intensity in this study is mainly based on ArcGIS10.5 using the GTWR plugin created by [21], and the bandwidth is set using AICc optimization.
2.3.7. Cross Wavelet Analysis
The cross-wavelet transform and wavelet coherence can be used to examine the correlation between two time series. The cross-wavelet transform is mainly used to analyze the correlation between two non-stationary signals in both time and frequency domains, which can provide richer feature information than the correlation analysis in frequency domain [23].
3. Results and Analysis
3.1. Spatial and Temporal Evolution Characteristics of Wind Erosion Index
Figure 2 shows the interannual distribution of the wind erosion climate factor index for each station in the Ningxia region from 1982 to 2020. The wind erosion climate factor index in the northern region is between 30.00 and 70.00, with moderate wind erosion as the main factor, and the wind erosion in the southern region is weak, with values between −4.02 and 30.00, with light wind erosion as the main factor and slight wind erosion at individual sites. The distribution of the wind erosion climate factor index has obvious regional differences, with the degree of wind erosion appearing in the order central > northern > southern.
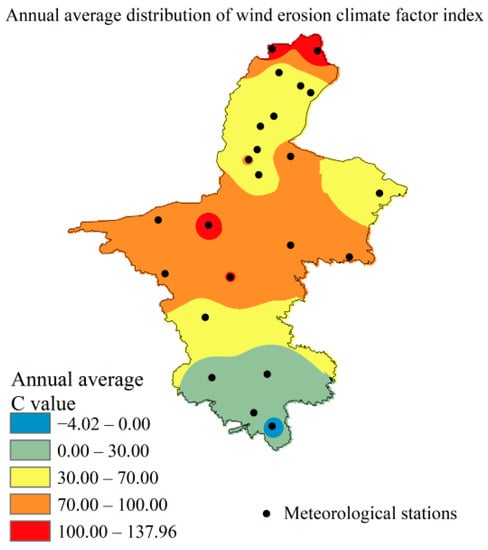
Figure 2.
Spatial distribution of wind erosion climate factor index in the Ningxia region from 1982 to 2020.
3.2. Temporal Evolution Trendiness and Sudden Change
The annual and seasonal variation patterns of C values in the Ningxia Autonomous Region are shown in Figure 3. UF values show a “rising–lowering” trend in interannual time variation, with a sudden change point in 2009. The trend of C values increases from 1982 to 1991, increases from 1992 to 2000, decreases from 2001 to 2007, decreases to below 0 in 2008, and decreases from 2008 to 2020. The trend of UF in spring, autumn and winter is consistent with the trend of interannual UF, and they all show an “increasing–decreasing” trend, and the mutation points in spring, autumn and winter appear in 2009, 2006 and 2009, respectively.
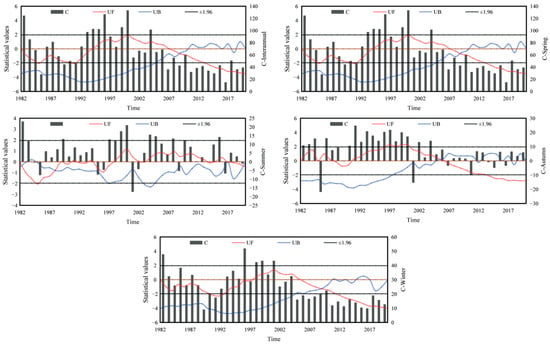
Figure 3.
Abrupt change test of wind erosion climate factor index in Ningxia from 1982 to 2020.
3.3. Center of Gravity Migration Characteristics of Wind Erosion Climate Erosion Forces
According to Figure 4a,b and Table 2, the center of gravity of the wind erosion climate factor index from 1982 to 2020 is mainly concentrated at the junction of the northern and central regions of Ningxia, mainly moving in the areas of 106°4′55″ E–106°23′30″ E, 38°1′59″ N–37°58′55″ N. The center of gravity shifts three times to the southwest, two times to the northeast, once to the northwest, and two times to the southeast. From 1982 to 1985, there is a 58.71 km shift to the northeast; a 56.58 km shift to the southwest from 1985 to 2000; a 28.01 km shift to the northeast from 2000 to 2010; and a 48.12 km shift to the southwest from 2010 to 2020. From 2000 to 2010, it moves 28.01 km to the northeast, and from 2010 to 2020 it moves 48.12 km to the southwest. From the migration map of the center of gravity of the annual wind erosion climate erosion force, it mainly goes through four migration stages: northeast–southwest–northeast–southwest.
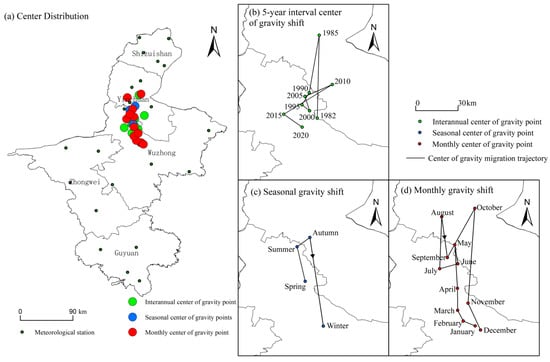
Figure 4.
Distribution and migration characteristics of the center of gravity of wind erosion climate factor index in the Ningxia Autonomous Region from 1982 to 2020. (a) shows the distribution of center of gravity points month by month, season by season and year by year; (b) shows the annual center of gravity migration pattern; (c) shows the seasonal center of gravity migration pattern; and (d) shows the month by month center of gravity migration pattern.

Table 2.
Annual center of gravity migration characteristics of wind erosion–climate erosion forces.
The migration of the center of gravity of the wind erosion climate factor index is shown in Figure 4c and Table 3, which shows that the center of gravity moves 24.86 km to the northwest from spring to summer, 9.76 km to the northeast from summer to autumn and 63.22 km to the central part of Ningxia from autumn to winter. From spring to summer, the center of gravity moves to the northern part of the country, and from summer to autumn, the temperature decreases slowly, and the center of gravity moves to the eastern part of the country.

Table 3.
Seasonal center of gravity migration characteristics of wind erosion–climate erosion forces.
Figure 4d and Table 4 show the gravity center migration of the climatic factor index of monthly wind erosion. From January to August, the center of gravity of the wind erosion climate factor index migrates to the northwest, with a total migration of 123.19 km, and the migration rate is 17.60 km·month−1. From August to October, the total migration is 67.17 km, and the migration rate is 33.58 km·month−1. From October to December, the center of gravity of wind erosion climatic factor index begins to migrate back, and migrates 87.54 km, with a migration rate of 43.77 km·month−1. During the temperature warming period, the monthly barycenter point gradually moves to the north, the temperature decreases, the monthly barycenter point begins to move back and the barycenter migration rate of the wind erosion climate erosive force with decreasing temperature is greater than that with increasing temperature.

Table 4.
Monthly center of gravity migration characteristics of wind erosion–climate erosion forces.
3.4. Climate Driver Analysis of Wind Erosion–Climate Erosion Force
3.4.1. Spatial Characteristics of the Regression Coefficients of the Drivers
Although the geographically weighted regression model (GWR) takes into account spatial effects and spatial heterogeneity, there are some problems in the practical application due to the limited sample size of cross-sectional data. For example, when there are too many explanatory variables, the heterogeneity of explanatory variables and their spatial spillover effects in different spatial geographic locations should be considered. The spatiotemporal geographically weighted regression model (GTWR) can solve the above problems in the geographically weighted regression model by introducing the time dimension, which makes the estimation more effective. The spatial distribution of GTWR regression coefficients is shown in Figure 5. The wind erosion climate factor index is used as the dependent variable, and sunshine hours, average temperature, average humidity, average wind speed and total precipitation are used as independent variables. All the selected variables passed the covariance test (VIF less than 5), and it can be seen from the figure that sunshine hours are both positively and negatively driven for the wind erosion climate factor index in each region, with the wind erosion index receiving a positive drive in the northern region and a negative drive in the central and southern regions. The wind erosion climate factor index is positively driven by the average temperature mainly in the southwest side of Ningxia, and negatively driven mainly in the northeast side of Ningxia. Wind erosion in more than 86% of Ningxia is mainly negatively driven by mean humidity. The wind erosion climate factor index in Ningxia is driven by the mean wind speed, and the degree of positive driving increases from south to north. The wind erosion climate factor index in the Ningxia region is significantly driven by total precipitation, and the regression coefficient negative driving maximum is mainly concentrated in the central east side of the Ningxia region, where the wind erosion climate factor index is more sensitive to the change in total precipitation.
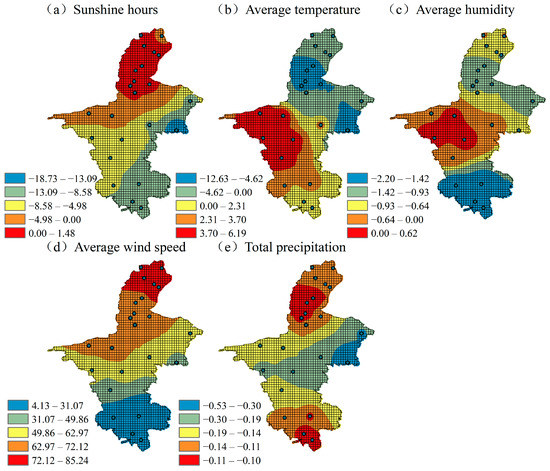
Figure 5.
Spatial distribution of local regression coefficients of GTWR model. (a) Spatial and temporal correlation between sunshine hours and wind erosion; (b) Spatial and temporal correlation between average temperature and wind erosion; (c) Spatial and temporal correlation between average humidity and wind erosion; (d) Spatial and temporal correlation between average wind speed and wind erosion and (e) Spatial and temporal correlation between total precipitation and wind erosion.
3.4.2. Temporal Correlation of Wind Erosion Climate Factor Index and Large-Scale Circulation Factor in Ningxia
As shown in Figure 6, the polynomials of NAO, AO, MEI, ENSO, PDO and SOI were fitted to the wind erosion climate factor index and NAO, AO, MEI, ENSO, PDO and SOI from 1982 to 2020, and the fitted polynomials were all fitted to sixth-order polynomials to obtain the interannual scale trends between the two and reveal the interrelationships. The polynomials of NAO, AO, MEI, ENSO, PDO and SOI index polynomials and wind erosion climate factor index polynomials have some correlation and some phase deviation.
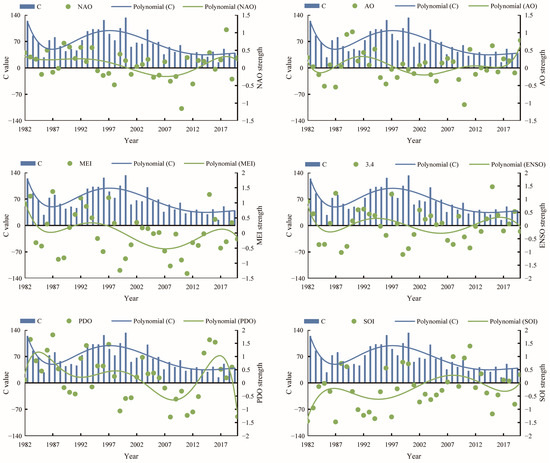
Figure 6.
Relationship between the trend of wind erosion climate factor index and the intensity of atmospheric circulation occurrence in the Ningxia Autonomous Region.
To further analyze the interrelationship between the wind erosion climate factor index and the atmospheric circulation in Ningxia Province, the cross-wavelet power spectrum was plotted using the cross-wavelet method (Figure 7). As shown in Figure 7, the resonance period of April–August for the C value and the NAO index passing the red noise test is mainly concentrated in 1993–1996, with the arrow shifted 30° to the upper left, indicating a one-month lag, while the resonance cycle of August—16 months—appears in 1992–1994, with an offset to the upper right, indicating a positive correlation and a one-month lead, and in 1998–2002 it shows a positive one-month lag. The resonance period of C value and AO index mainly exists over 8–16 months, with positive correlation in 2000–2004, and the mean directional angle downward by 90° indicates that C value lags behind the AO index by 3 months. The resonance period of the C value with the MEI index mainly exists in the period of 8–16 months, in 1998–2004, according to the direction of the mean directional angle, and the resonance period in the period of 32–48 months mainly exists in the period of 1998–2002, showing a negative correlation and a 2-month lead. The resonance cycle of 32–46 months is mainly present in 1998–2002, with a negative correlation and a 2-month lead between C and the ENSO index. The resonance cycle of C value and PDO index mainly exists over 8–16 months, with positive correlation in 1992–2004, and C value lags behind the PDO index by 1–3 months. The C-value resonates with the SOI index for 8–16 months, with a positive correlation in 2000–2002, and the C-value leads the SOI index by 2 months.
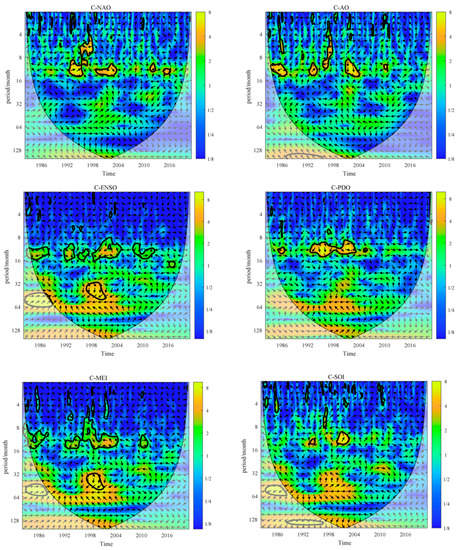
Figure 7.
Cross wavelet analysis of wind erosion climate factor index and atmospheric circulation index in Ningxia.
4. Discussion
The wind erosion climate erosion force in China has obvious spatial and temporal variability, and the wind erosion climate erosion force in arid and semi-arid regions of China ranges from 2.00 to 162.00, with obvious seasonal variability, with more significant wind erosion climate erosion force in spring and winter and weaker wind erosion climate erosion force in summer and winter [24]. Studies have shown that wind erosion climate erosion force is the result of the combined effect of wind speed, precipitation, temperature, relative humidity and other factors, with wind speed being the main driving factor [25] and in recent years, climate change coupled with soil and water conservation initiatives have led to a decreasing trend in wind erosion in Ningxia [26]. Climate response to atmospheric circulation has been a hot topic of research, and the variability of the North Atlantic Oscillation (NAO) has a strong lag in the northern hemisphere, especially in winter, when this phenomenon dominates climate variability on hemispheric and regional scales. From this perspective, it is of great interest to better understand the mechanisms of NAO effects that lead to seasonal lags and their possible impact on seasonal forecasts [27]. The Pacific Decadal Oscillation (PDO), Southern Oscillation Index (SOI), El Niño (ENSO) and MEI index (MEI index is a parameter obtained by calculating six parameters: SST, meridional winds, latitudinal winds, sea level pressure, temperature near sea level and sky cloudiness) all have some correlation and lag between them for the environment [28,29,30]. By studying the lag between the atmospheric circulation index and the wind erosion climate erosion force and finding the correlation link, it provides guidance for the early warning of wind erosion.
In this paper, we systematically analyze the spatial and temporal changes of wind erosion and climate erosion in Ningxia based on daily data from 23 meteorological stations, illustrate the spatial and temporal relationships between the drivers of wind erosion and climate erosion and the migration of the center of gravity of wind erosion in the Ningxia Autonomous Region and grasp the evolution of wind erosion and climate erosion, as well as illustrating the influence of atmospheric circulation on wind erosion climate erosion force in Ningxia on a large scale and obtaining the resonance period by cross wavelet analysis. The lagged relationship between the atmospheric circulation index and the wind erosion climate erosion force is analyzed, which is important for the prediction and forecast of wind erosion.
5. Conclusions
The distribution of wind erosion degree in the Ningxia area is central > northern > southern. Seasonally, it is higher in spring and winter, and lower in summer and autumn.
The trend of annual scale wind erosion climate factor index shows a trend of “increase–decrease”. In the analysis of the seasonal trend of wind erosion climate factor index, there is an “increase–decrease” trend in spring, autumn and winter, while the trend change in summer is relatively stable.
The center of gravity of wind erosion is mainly distributed at the junction of the northern and central regions of Ningxia, and the center of gravity migration on the annual scale underwent four migration stages: northeast–southwest–northeast–southwest. On the seasonal scale, the center of gravity migrates through four stages: northwest–northeast–southeast, and the migration rate in the cold season is greater than that in the warm season. On the monthly scale, the migration pattern and rate pattern are similar to the seasonal migration pattern.
The wind erosion climate factor index is influenced by sunshine hours, average temperature, average humidity, average wind speed and total precipitation, among which the wind erosion climate factor index is the most sensitive to the influence of average wind speed, while sunshine hours, average temperature and average temperature show significant spatial and temporal distribution, average wind speed is positively driven, and total precipitation is negatively driven.
The wind erosion climate factor indices are positively correlated with NAO, AO, PDO and SOI indices, and negatively correlated with MEI and ENSO indices, and there are resonance cycles of different time scales.
Author Contributions
Conceptualization, Z.L. and Q.S.; methodology, Z.L.; data curation, J.L., P.D., B.Z., L.W., H.X. and J.W.; writing—original draft preparation, Z.L.; writing—review and editing, Z.L.; supervision, Q.S.; project administration, Q.S. All authors have read and agreed to the published version of the manuscript.
Funding
This study was funded by the National Key Research and Development Program (2019YFD1002502).
Institutional Review Board Statement
Not applicable.
Informed Consent Statement
Not applicable.
Data Availability Statement
Not applicable.
Acknowledgments
Thanks to the National Meteorological Center of China Meteorological Administration for providing the meteorological and index datasets.
Conflicts of Interest
The authors declare no conflict of interest.
References
- Buschiazzo, D.E.; Zobeck, T.M. Validation of WEQ, RWEQ and WEPS wind erosion for different arable land management systems in the Argentinean Pampas. Earth Surf. Process. Landf. J. Br. Geomorphol. Res. Group 2008, 33, 1839–1850. [Google Scholar] [CrossRef]
- Chepil, W.; Siddoway, F.; Armbrust, D.V. Climatic factor for estimating wind erodibility of farm fields. J. Soil Water Conserv. 1962, 17, 162–165. [Google Scholar]
- Woodruff, N.; Armbrust, D.V. A monthly climatic factor for the wind erosion equation. J. Soil Water Conserv. 1968, 23, 103–104. [Google Scholar]
- FAO; UNEP; UNESCO. A Provisional Methodology for Soil Degradation Assessment; FAO: Rome, Italy, 1979. [Google Scholar]
- Ashkenazy, Y.; Yizhaq, H.; Tsoar, H. Sand dune mobility under climate change in the Kalahari and Australian deserts. Clim. Change 2012, 112, 901–923. [Google Scholar] [CrossRef]
- Zhang, X.; Zhou, Q.; Chen, W.; Wang, Y.; Tong, D.Q. Observation and modeling of black soil wind-blown erosion from cropland in Northeastern China. Aeolian Res. 2015, 19, 153–162. [Google Scholar] [CrossRef]
- Teng, Y.M.; Zhan, J.; Liu, W.; Sun, Y.; Agyenmang, F.B.; Liang, L.; Li, Z. Spatiotemporal dynamics and drivers of wind erosion on the Qinghai-Tibet Plateau, China. Ecol. Indic. 2021, 123, 107340. [Google Scholar] [CrossRef]
- Zhang, L.; Guo, Z.; Li, J.; Chang, C.; Wang, R.; Li, Q. Effect of the Type of Wind Data on Regional Potential Wind Erosion Estimation. Front. Environ. Sci. 2022, 10, 118. [Google Scholar] [CrossRef]
- Zhang, G.; Azorin-Molina, C.; Shi, P.; Lin, D.; Guijarro, J.A.; Kong, F.; Chen, D. Impact of near-surface wind speed variability on wind erosion in the eastern agro-pastoral transitional zone of Northern China, 1982–2016. Agric. For. Meteorol. 2019, 271, 102–115. [Google Scholar] [CrossRef]
- Zhang, H.; Fan, J.; Cao, W.; Harris, W.; Li, Y.; Chi, W.; Wang, S. Response of wind erosion dynamics to climate change and human activity in Inner Mongolia, China during 1990 to 2015. Sci. Total Environ. 2018, 639, 1038–1050. [Google Scholar] [CrossRef]
- Chen, S.; Dong, Y. A review of the research on wind erosion climatic erosivity. J. Desert Res. 2020, 40, 65. [Google Scholar]
- Lou, J.; Wang, X.; Cai, D. Spatial and temporal variation of wind erosion climatic erosivity and its response to ENSO in the Otindag Desert, China. Atmosphere 2019, 10, 614. [Google Scholar] [CrossRef]
- Li, J.; Garshick, E.; Huang, S.; Koutrakis, P. Impacts of El Niño-Southern Oscillation on surface dust levels across the world during 1982–2019. Sci. Total Environ. 2021, 769, 144566. [Google Scholar] [CrossRef] [PubMed]
- Gritsun, A.S. Variability of Extra Tropical Atmospheric Circulation and Periodic Trajectories in Simplified Models of Atmospheric Dynamics. Izv. Atmos. Ocean. Phys. 2020, 56, 229–240. [Google Scholar] [CrossRef]
- Kyselý, J. Implications of enhanced persistence of atmospheric circulation for the occurrence and severity of temperature extremes. Int. J. Climatol. A J. R. Meteorol. Soc. 2007, 27, 689–695. [Google Scholar] [CrossRef]
- Schubert, S.; Rienecker, M.; Mlynczak, M.; Miller, T.; Schoeberl, M. Ocean and atmosphere: Predicting monthly to seasonal climate variability and the oceanic and atmospheric causes and effects. In IGARSS 2003, Proceedings of the 2003 IEEE International Geoscience and Remote Sensing Symposium, Toulouse, France, 21–25 July 2003; IEEE: Piscataway, NJ, USA, 2003; pp. 142–144. [Google Scholar]
- Jackson, L.; Smith, R.S.; Wood, R. Ocean and atmosphere feedbacks affecting AMOC hysteresis in a GCM. Clim. Dyn. 2017, 49, 173–191. [Google Scholar] [CrossRef]
- Zheng, J.; Li, B.; Chen, Y.; Chen, Z.; Lian, L. Spatiotemporal variation of upper-air and surface wind speed and its influencing factors in northwestern China during 1980–2012. Theor. Appl. Climatol. 2018, 133, 1303–1314. [Google Scholar] [CrossRef]
- Kononova, N.K.; Lupo, A.R. Changes in the Dynamics of the Northern Hemisphere Atmospheric Circulation and the Relationship to Surface Temperature in the 20th and 21st Centuries. Atmosphere 2020, 11, 255. [Google Scholar] [CrossRef]
- Po-Chedley, S.; Zelinka, M.D.; Jeevanjee, N.; Thorsen, T.J.; Santer, B.D. Climatology explains intermodel spread in tropical upper tropospheric cloud and relative humidity response to greenhouse warming. Geophys. Res. Lett. 2019, 46, 13399–13409. [Google Scholar] [CrossRef]
- Urban, G.; Migała, K.; Pawliczek, P. Sunshine duration and its variability in the main ridge of the Karkonosze Mountains in relation to with atmospheric circulation. Theor. Appl. Climatol. 2018, 131, 1173–1189. [Google Scholar] [CrossRef]
- Herceg-Bulić, I.; Kucharski, F. North Atlantic SSTs as a link between the wintertime NAO and the following spring climate. J. Clim. 2014, 27, 186–201. [Google Scholar] [CrossRef]
- Wang, F.; Wang, Z.; Yang, H.; Di, D.; Zhao, Y.; Liang, Q.; Hussain, Z. Comprehensive evaluation of hydrological drought and its relationships with meteorological drought in the Yellow River basin, China. J. Hydrol. 2020, 584, 124751. [Google Scholar] [CrossRef]
- Dong, Y.X.; Kang, G.D. Study on the wind erosion climatic erosivity in arid and semi-arid areas in China. J. Soil Water Conserv. 1994, 8, 1–7. [Google Scholar]
- Niu, Q.; Qu, J.; An, Z. Characteristic of wind erosion climatic erosivity in Dunhuang Yardang Geo-park of Gansu Province. J. Desert Res. 2017, 37, 1066. [Google Scholar]
- Li, Q.; Cai, Q.; Fang, H. Spatial characteristic research on wind erosion contribution to sediment yield in wind and water complex erosion zone of loess plateau. J. Water Res. Water Eng. 2007, 27, 552–557. [Google Scholar]
- Greatbatch, R.J.; Jung, T. Local versus tropical diabatic heating and the winter North Atlantic Oscillation. J. Clim. 2007, 20, 2058–2075. [Google Scholar] [CrossRef]
- Xu, Z.; Han, M. Spatio-temporal distribution characteristics of drought in Shandong Province and it relationship with ENSO. Zhongguo Shengtai Nongye Xuebao/Chin. J. Eco-Agric. 2018, 26, 1236–1248. [Google Scholar]
- Wang, X.; Liu, H. PDO modulation of ENSO effect on tropical cyclone rapid intensification in the western North Pacific. Clim. Dyn. 2016, 46, 15–28. [Google Scholar] [CrossRef]
- Woolhiser, D.A. Combined effects of the Southern Oscillation index and the Pacific decadal oscillation on a stochastic daily precipitation model. J. Clim. 2008, 21, 1139–1152. [Google Scholar] [CrossRef]
Disclaimer/Publisher’s Note: The statements, opinions and data contained in all publications are solely those of the individual author(s) and contributor(s) and not of MDPI and/or the editor(s). MDPI and/or the editor(s) disclaim responsibility for any injury to people or property resulting from any ideas, methods, instructions or products referred to in the content. |
© 2023 by the authors. Licensee MDPI, Basel, Switzerland. This article is an open access article distributed under the terms and conditions of the Creative Commons Attribution (CC BY) license (https://creativecommons.org/licenses/by/4.0/).